Article

Chemical Profile of Cyperus laevigatus and Its Protective Effects against Thioacetamide-Induced Hepatorenal Toxicity in Rats

by
Iriny M. Ayoub
1,†,
Marawan A. El-Baset
2,†,
Mai M. Elghonemy
3,†,
Samir A. E. Bashandy
2,
Fatma A. A. Ibrahim
4,
Omar A. H. Ahmed-Farid
5,
Abd El-Nasser G. El Gendy
6,
Sherif M. Afifi
7,
Tuba Esatbeyoglu
8,*,
Abdel Razik H. Farrag
9,
Mohamed A. Farag
10 and
Abdelsamed I. Elshamy
3,*
1
Department of Pharmacognosy, Faculty of Pharmacy, Ain Shams University, Cairo 11566, Egypt
2
Pharmacology Department, Medical Research and Clinical Studies Institute, National Research Centre, 33 El-Bohouth St., Dokki, Cairo 12622, Egypt
3
Department of Natural Compounds Chemistry, National Research Center, 33 El Bohouth St., Dokki, Giza 12622, Egypt
4
Biochemistry Department, Biotechnology Research Institute, National Research Centre, 33 EL Bohouth St., Dokki, Cairo 12622, Egypt
5
Physiology Department, National Organization for Drug Control and Research, Cairo 12311, Egypt
6
Medicinal and Aromatic Plants Research Department, National Research Centre, 33 El Bohouth St., Dokki, Giza 12622, Egypt
7
Pharmacognosy Department, Faculty of Pharmacy, University of Sadat City, Sadat City 32897, Egypt
8
Institute of Food Science and Human Nutrition, Department of Food Development and Food Quality, Gottfried Wilhelm Leibniz University Hannover, Am Kleinen Felde 30, 30167 Hannover, Germany
9
Pathology Department, National Research Centre, 33 El Bohouth St., Dokki, Giza 12622, Egypt
10
Pharmacognosy Department, Faculty of Pharmacy, Cairo University, Kasr el Aini St., Cairo 11562, Egypt
*
Authors to whom correspondence should be addressed.
These authors contributed equally to this work.
Molecules 2022, 27(19), 6470; https://doi.org/10.3390/molecules27196470
Submission received: 29 August 2022 / Revised: 21 September 2022 / Accepted: 27 September 2022 / Published: 1 October 2022
(This article belongs to the Section Natural Products Chemistry)

Abstract

:
Cyperus species represent a group of cosmopolitan plants used in folk medicine to treat several diseases. In the current study, the phytochemical profile of Cyperus laevigatus ethanolic extract (CLEE) was assessed using UPLC-QTOF–MS/MS. The protective effect of CLEE at 50 and 100 mg /kg body weight (b.w.) was evaluated on hepatorenal injuries induced by thioacetamide (100 mg/kg) via investigation of the extract’s effects on oxidative stress, inflammatory markers and histopathological changes in the liver and kidney. UPLC-QTOF–MS/MS analysis of CLEE resulted in the identification of 94 compounds, including organic and phenolic acids, flavones, aurones, and fatty acids. CLEE improved the antioxidant status in the liver and kidney, as manifested by enhancement of reduced glutathione (GSH) and coenzyme Q10 (CoQ10), in addition to the reduction in malondialdehyde (MDA), nitric oxide (NO), and 8-hydroxy-2′-deoxyguanosine (8OHdG). Moreover, CLEE positively affected oxidative stress parameters in plasma and thwarted the depletion of hepatorenal ATP content by thioacetamide (TAA). Furthermore, treatment of rats with CLEE alleviated the significant increase in plasma liver enzymes, kidney function parameters, and inflammatory markers. The protective effect of CLEE was confirmed by a histopathological study of the liver and kidney. Our results proposed that CLEE may reduce TAA-hepatorenal toxicity via its antioxidant and anti-inflammatory properties suppressing oxidative stress.

1. Introduction

Medicinal plants represent the most enriched resources for natural remedies worldwide [1,2,3]. Recently, medicinal plants and their byproducts have proved to be the main source of safe medicinal drugs because of their bioactive secondary metabolites [2,4]. Moreover, plants provide phytochemicals to manage and protect against a multitude of diseases, owing to minimal side effects, and/or low toxicity and costs, along with significant biological potentiality and availability [4]. All documented data reported a strong relationship between the biological activities, including anti-inflammatory, antioxidant, and hepatoprotective potentialities of medicinal herbs, and their bioactive metabolites [2]. Plant phytochemicals, including phenolic acids, organic acids, flavonoids, aurones, and others, are the main contributors to the hepatoprotective mechanism [4].
Plants belonging to the Cyperus genus (family Cyperaceae) are widely distributed around the world with several traditional uses [5,6]. Various byproducts from Cyperus plants displayed several potent biological and pharmaceutical potentialities, including anti-inflammatory [7], hepatoprotective [8], anti-ulcer [5,6], antimalarial [9], and antidiabetic [10] activities. Many secondary metabolites were identified in Cyperus plants, including phenolic acids, flavonoids, aurones, quinones [5,6,11,12], steroids, terpenes [13], and alkaloids [14], along with volatile oils [15,16]. The previous work on C. laevigatus aerial parts resulted in the characterization of some phenolic acids and flavonoids [7] alongside volatile components [16]. Essential oil, extracts, and metabolites derived from this plant were reported to possess significant antioxidant, anti-inflammation, antimicrobial, and anti-diabetic effects [7,16].
Thioacetamide (TAA), an organo-sulfur white crystal, has been reported to cause carcinogenic damage to the liver and thus used to induce rats’ hepatic injury [17]. The documented toxicological reports deduced the neurotoxic effect of TAA in animals and humans [18]. TAA may cause the generation of reactive oxygen species (ROS), destroying free radical scavenging mechanisms and some cellular ingredients such as DNA, lipids, and proteins, thus deteriorating cellular structures and functions [19].
The current study provides mechanistic insights on potential protective effects of CLEE against hepatorenal damage induced by thioacetamide. Comprehensive metabolites profiling of C. laevigatus ethanolic extract (CLEE) was described herein for the first time using UPLC-ESI–QTOF-MS/MS. Additionally, the protective effect of CLEE against thioacetamide-induced hepatorenal toxicity in rat models was assessed based upon biochemical and histochemical results.

2. Results

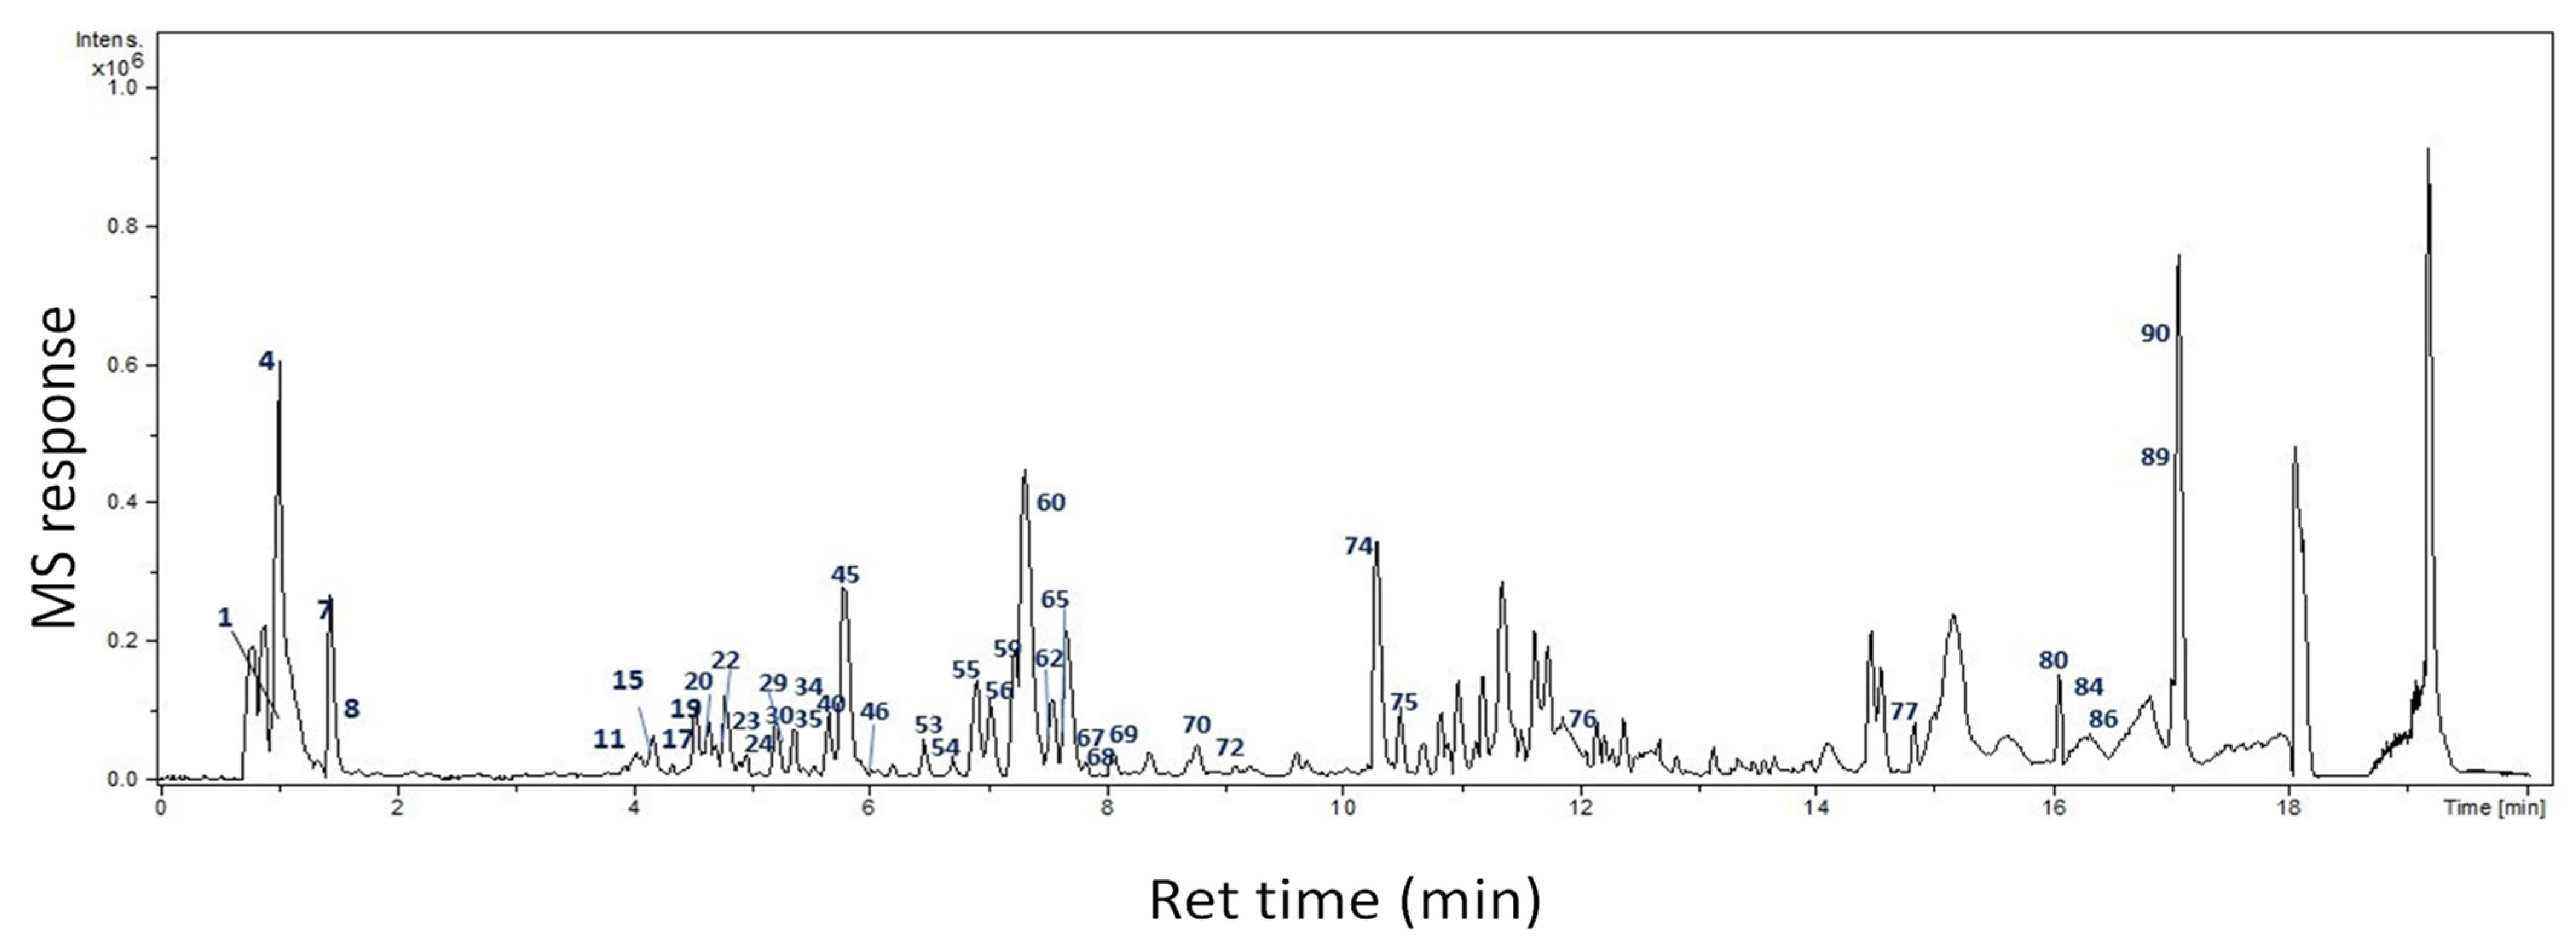
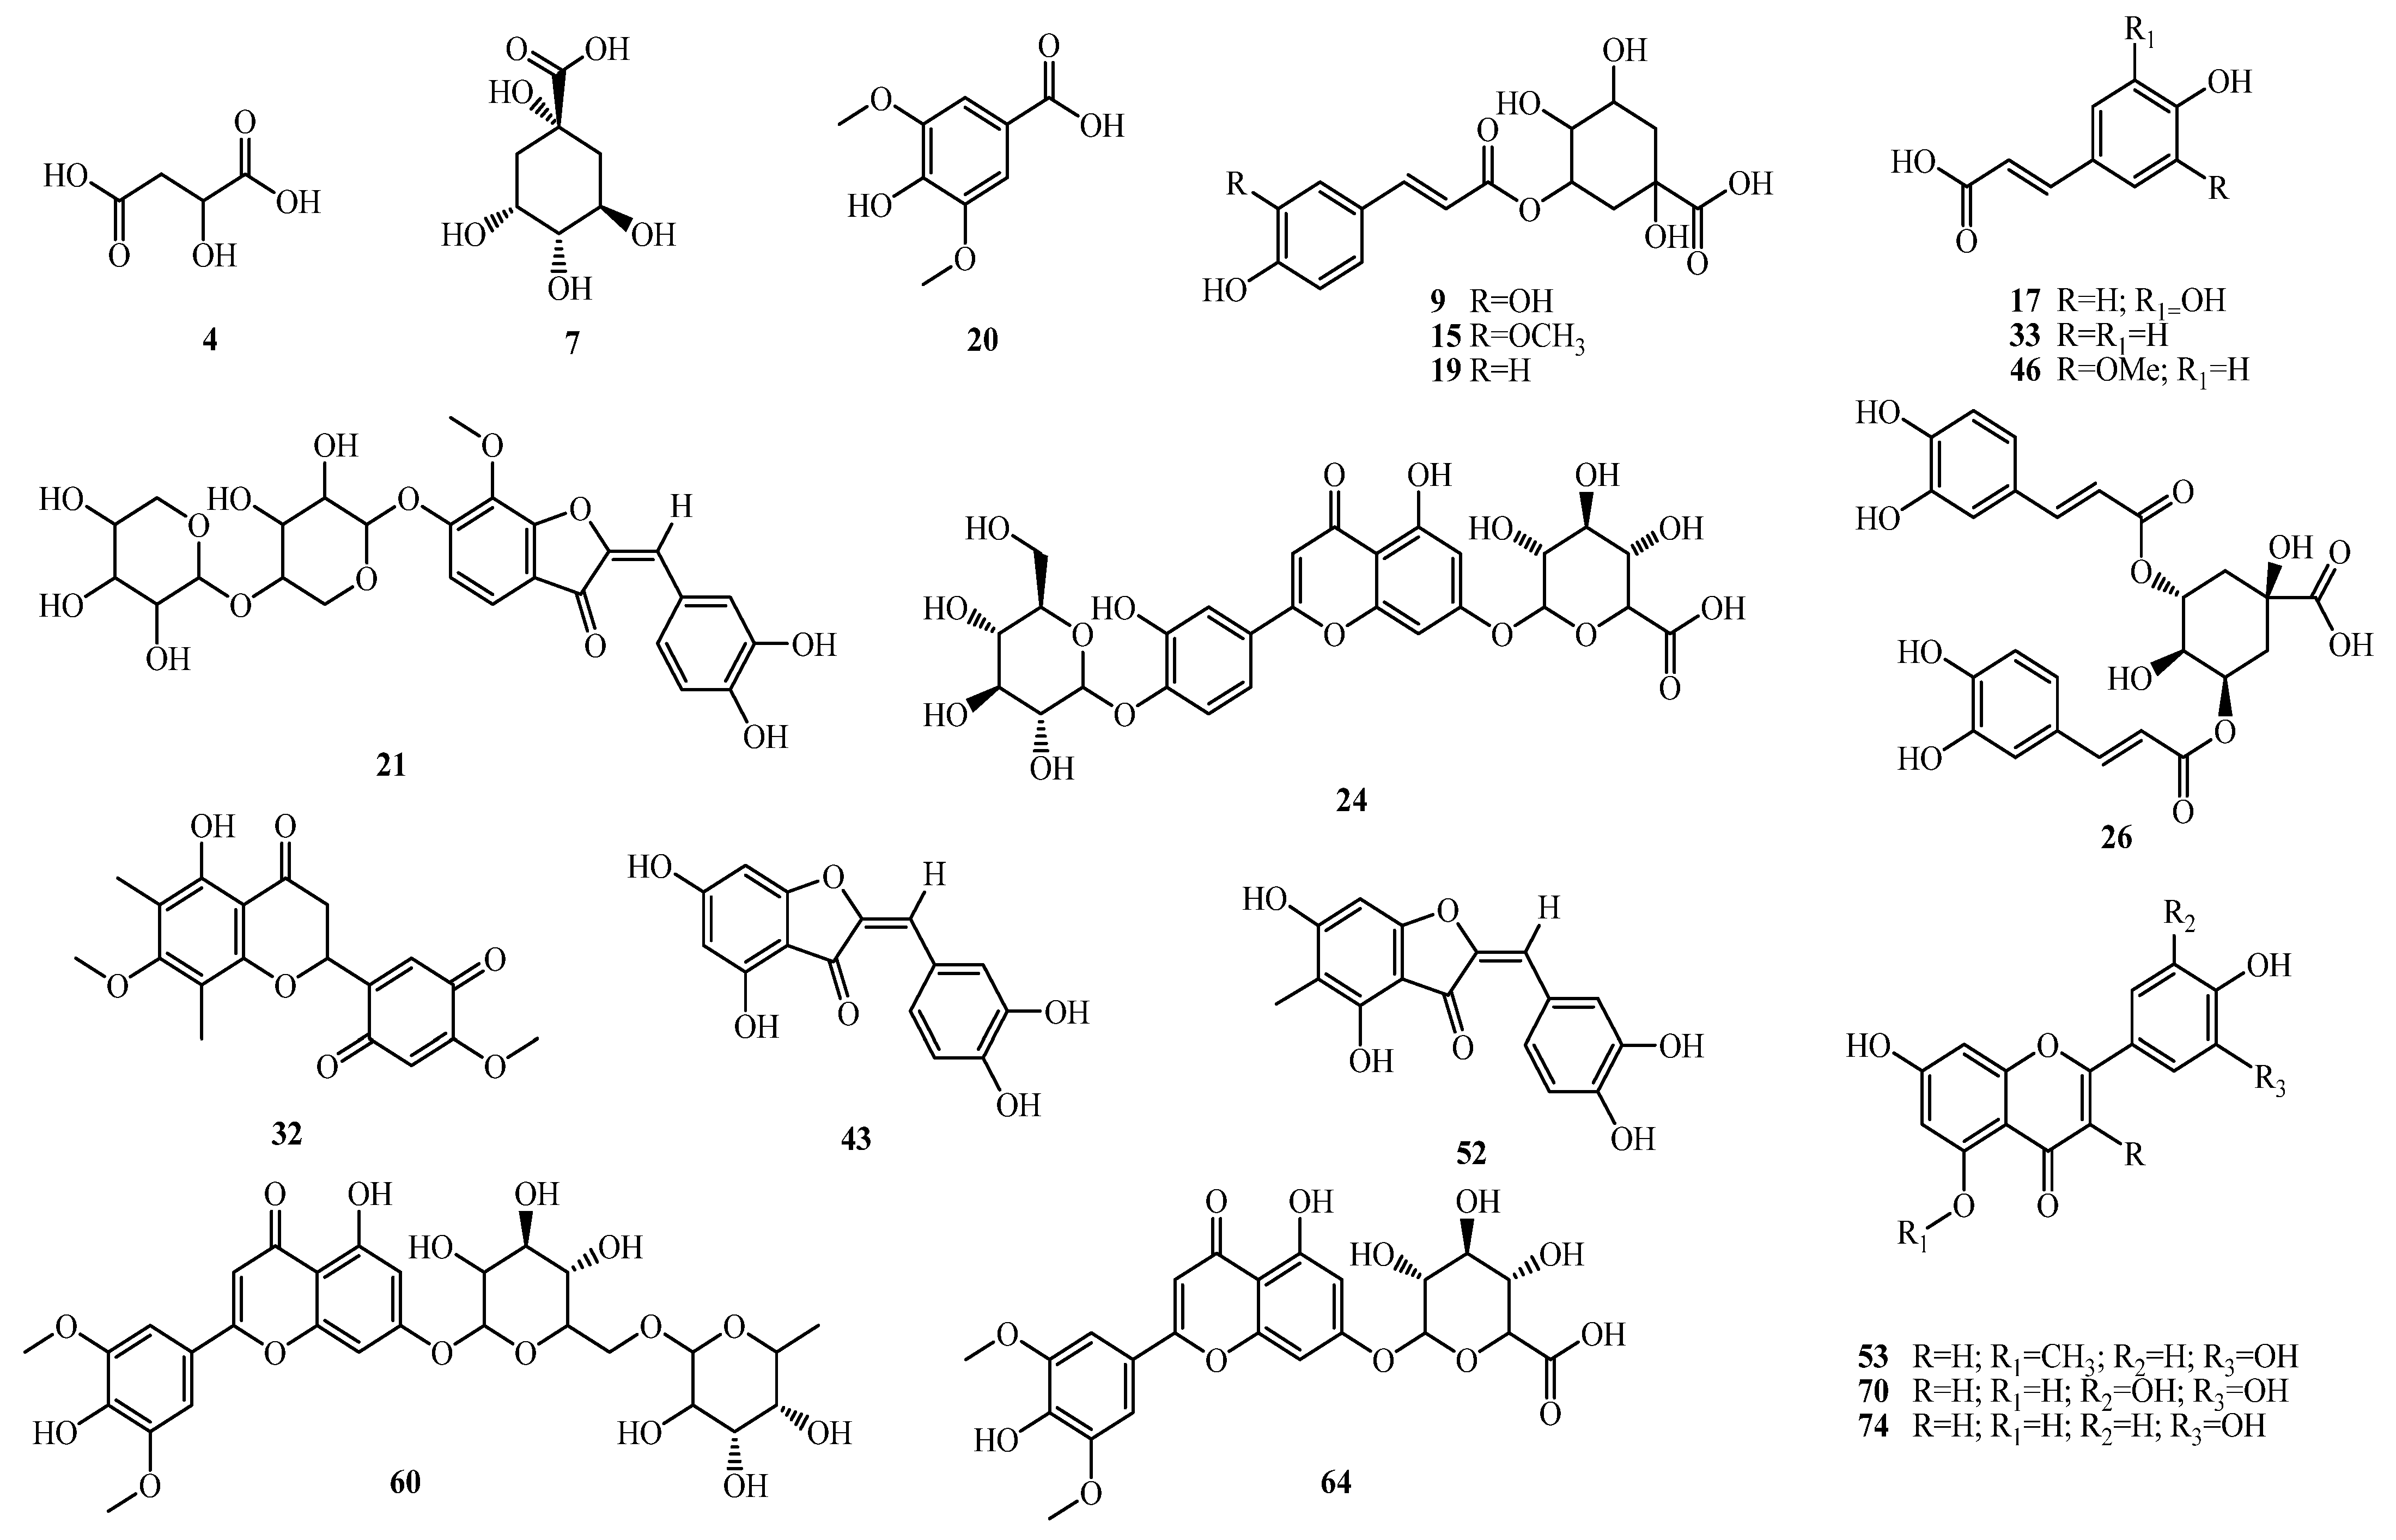
2.1. Identification of Bioactive Compounds

UPLC-ESI-QTOF–MS/MS analysis of the ethanolic extract was performed to characterize the bioactive compounds of CLEE. A total of 94 compounds belonging to various classes were annotated, including organic and phenolic acids, flavones, aurones, and fatty acids. The base peak chromatogram is depicted in Figure 1 in negative ion mode. Compounds were identified based on molecular formula, MS/MS fragmentation pattern, the reported data in the literature, and the phytochemical dictionary of natural products, as listed in Table 1 and Figure 2, representing the first comprehensive phytochemical profiling of CLEE.

2.1.1. Organic Acids

Organic acids were abundant in CLEE, represented by gluconic acid (1), tetrahydroxypentanoic acid (2), malic acid (4), and its isomer (5), in addition to fumaric acid (6), quinic acid (7), and citric/isocitric acid (8), by comparison with published data [5,20]. Malic acid amounted to the major organic acid.
Table 1. Metabolites profiling of CLEE via UPLC-QTOF–MS/MS analysis in negative ion mode.
Peak NoNameMFRt[M−H] m/zDiff (ppm)Ms2ClassRef.
1Gluconic acidC6H12O70.968195.05005.1161, 129, 89, 75Organic acid
2Tetrahydroxypentanoic acidC5H10O60.980165.04055.3147, 99, 87, 75Organic acid[5]
3HexoseC6H12O60.988179.0562−0.5161, 131, 113, 85Sugar
4Malic acidC4H6O51.033133.0145−1.8115, 89Organic acid
5Malic acid isomerC4H6O51.308133.01410.8115Organic acid
6Fumaric acidC4H4O41.346115.00370.369Organic acid
7Quinic acidC7H12O61.438191.0566−2.5111, 87Organic acid
8Citric acid/Isocitric acidC6H8O71.514191.0208−5.7155, 129, 111Organic acid
9O-Caffeoylquinic acidC16H18O93.479353.08585.7191Phenolic acid
10UnknownC14H24O104.300351.12973.5113, 101, 89Unknown glycoside
11O-Caffeoylquinic acid isomerC16H18O94.028353.0877−0.3191Phenolic acid
12O-CoumaroylhexoseC15H18O84.120325.0932−1.0191, 179Phenolic acid
13AsperulosideC18H22O114.202413.1659−1.4353, 345, 267, 249Iridoid
14Hydroxybenzoic acidC7H6O34.134137.02441.293 Phenolic acid
15Feruloyl quinic acidC17H20O94.148367.10352.0193Phenolic acid
16Feruloyl-O-hexosideC16H20O94.337355.1035−0.2163Phenolic acid
17Caffeic acidC9H8O44.422179.0350−9.2135Phenolic acid
18O-Syringoyl quinic acidC16H20O104.464371.0988−1.2323, 305, 121Phenolic acid
19Coumaroyl quinic acidC16H18O84.543337.0935−1.8191, 173Phenolic acid
20Syringic acidC9H10O54.598197.0460−2.5182, 167Phenolic acid
21Leptosidin-O-dipentoside
(Tetrahydroxy-methoxy-aurone-O-di-pentoside)
C26H28O144.557563.1411−0.8ndAurone[21]
22Feruloylquinic acid isomerC17H20O94.763367.1035−2.3193, 173Phenolic acid[5]
23Luteolin di-O-hexosideC27H30O164.852609.14590.4447Flavone[22]
24Luteolin- O-hexoside-O-glucuronideC27H28O174.900623.12362.9461Flavone
25O-Syringoylquinic acid
O-(Hydroxydimethoxy- benzoyl)-quinic acid
C16H20O104.952371.09842.5353, 327, 249, 231, 121Phenolic acid[5]
26Dicaffeoylquinic acidC25H24O124.918515.1213−3.4NdPhenolic acid[5]
27O-(Hydroxydimethoxybenzoyl)-quinic acid isomerC16H20O104.969371.09781.7249Phenolic acid
28O-CoumaroylglycerolC12H14O55.097237.07682.1145Phenolic acid
29O-Caffeoyl-O-syringoylquinic acidC25H26O135.193533.1301−1.6469, 443, 255Phenolic acid
30Tetrahydroxy-dimethoxyflavone- di-O-hexosideC29H34O185.364669.16572.3623, 619, 507, 427Flavone
31Tetrahydroxy-methoxyflavone- dihexosideC28H32O175.282639.15670.3593Flavone
325-Hydroxy-4′,7-dimethoxy-6,8-dimethyl-2′,5′-flavanonequinone (Scaberin)C19H18O75.357357.0980−2.5163, 119Flavanone quinone[6]
33Hydroxycinnamic acidC9H8O35.388163.0403−1.2119Phenolic acid[23]
34Dihydroxy-dimethoxy-methylauroneC18H16O65.411327.0874−1.6283, 163Aurone[24]
35Tetrahydroxy-dimethoxyflavone- di-O-hexosideC29H34O185.415669.1674−0.3619, 507, 427Flavone
36Hydroxycinnamic acid isomerC9H8O35.532163.0405−2.4119Phenolic acid[23]
37Luteolin-O-deoxyhexoside -O-glucuronideC27H28O165.473607.1305−0.1493, 436, 284Flavone
38Hydroxyoctanoic acid-O-hexosideC14H26O85.432321.15555.2158, 114Fatty acid
39Hydroxycinnamoyl-O-malic acidC13H12O75.515279.0510−2.2163Phenolic acid
40Tetrahydroxyflavone-O-pentosyl hexoside (Luteolin-O-pentosyl hexoside)C36H36O75.649579.2388−1.9493, 285, 284Flavone
41Tetrahydroxyaurone-O-glucuronide
(Aureusidin 6-O-glucuronide)
C21H18O125.748461.0725−2.9285, 283Aurone[24]
42Tetrahydroxyaurone-O-glucuronide isomerC21H18O125.763461.0736−2.2285Aurone
43Aureusidin
(Tetrahydroxyaurone)
C15H10O65.820285.0405−2.6NdAurone[22]
44Tetrahydroxymethoxyflavone-O-glucuronideC22H20O135.903491.0831−2.0315Flavone
45Pentahydroxymethoxyflavone-O-glucuronideC22H20O145.910507.0780−2.7462, 331Flavone
46Ferulic acid
(Hydroxymethoxycinnamic acid)
C10H10O45.937193.0514−3.8178, 134Phenolic acid[5]
47Hydroxydimethoxycinna-mic acid isomerC11H12O55.947223.0612−2.2ndPhenolic acid
48Tetrahydroxymethoxyflavone-O-glucuronide isomerC22H20O135.995491.0831−1.5315, 175Flavone
49Hydroxymethoxycinnamic acid isomerC10H10O45.999193.0506−2.5178, 134Phenolic acid[5]
50Luteolin-O-glucuronide (Tetrahydroxy-flavone- O-glucuronide)C21H18O126.016461.0742−3.5325, 285Flavone[22]
51Dicaffeoylquinic acid isomerC25H24O126.164515.1195−1.1353Phenolic acid[5]
52Tetrahydroxy-methylauroneC16H12O66.449299.0561−4.8284, 267Aurone[22,23,24]
53Luteolin-5-methyl ether
(Trihydroxymethoxyflavone)
C16H12O66.507299.0561−5.3283, 267, 238, 147Flavone[24]
54Luteolin methyl ether glucuronide
(Trihydroxymethoxyflavone glucuronide)
C22H20O126.579475.0889−1.5299Flavone[24]
55Tricin
(Trihydroxy-dimethoxyflavone)
C17H14O76.713329.0681−4.3261Flavone[22]
56Tricin (7-O-deoxhexosyl-O-glucuronide)C29H32O177.035651.1575−1.3329Flavone
57Luteolin-O-deoxyhexosideC21H20O107.104431.1003−4.4285Flavone
58Trihydroxyflavone-O-glucuronide
(Apigenin glucuronide)
C21H18O117.189445.0786−2.2269, 175 [14]
59Trihydroxyflavone-O-glucuronide isomerC21H18O117.257445.0776−5.0269, 175Flavone
60Tricin-7-O-deoxyhexosyl-O-hexosideC29H34O167.346637.1774−3.1593, 447, 329Flavone
61Tricin-7-O-hexosyl sulfateC23H24O15S7.397571.0768−0.8329, 255, 241, 175Flavone[25]
62Tricin-7-O-hexosyl sulfate isomerC23H24O15S7.455571.0767−1.8329, 271Flavone[24]
63Tetrahydroxy-methoxyflavone-O-sulfate
(Methoxyluteolin-O-sulfate)
C16H12O10S7.575395.0078−4.9315, 225, 209, 167Flavone
64Tricin-7-O-glucuronideC23H22O137.616505.09881.2329Flavone[23]
65Luteolin methyl ether-O-glucuronide isomerC22H20O127.647475.0905−1.2299, 177, 175Flavone
66Tetrahydroxyaurone-O-hexosideC21H20O117.831447.0954−4.7411, 285, 233Aurone[14]
67Tetrahydroxyflavone-O-hexoside
(Luteolin-O-hexoside)
C21H20O117.875447.09331.1285, 255Flavone[26]
68DihydroxymethoxyauroneC16H12O58.053283.0631−6.6268, 240Aurone
69DihydroxymethoxyflavoneC16H12O58.104283.0626−4.9269, 147Flavone
70Pentahydroxyflavone
(Tricetin)
C15H10O78.128301.0360−2.2ndFlavone[23,27]
71Trihydroxy-methoxy-methylauroneC17H14O68.803313.0718−0.2298, 267Aurone
72Hydroxy-dodecenedioic acidC12H20O59.201243.1250−4.8225, 199Fatty acid
73Dihydroxy-decenoic acidC10H18O410.200201.11206.2183, 139Fatty acid
74Tetrahydroxyflavone
(Luteolin)
C15H10O610.251285.0405−0.3ndFlavone
75Trihydroxy-methoxy-flavonol
(Isorhamnetin)
C16H12O710.389315.0518−2.4300, 271, 175Flavonol[22]
76Hydroxyoctadecenedioic acidC18H32O511.953327.2196−6.0309, 239Fatty acid
77Hydroxyoctadecadienoic acidC18H32O314.767295.2292−4.4277, 237Fatty acid
78Hydroxytetradecanoic acidC14H28O315.827243.19631.1ndFatty acid
79Hydroxydocosanoic acidC22H44O315.878355.32111.8ndFatty acid
80Hydroxytetracosenoic acidC24H46O316.003381.33642.8ndFatty acid
81Hydroxypentadecanoic acidC15H30O316.409257.2124−0.6ndFatty acid
82Hydroxyhexadecenoic acidC16H30O316.413269.2131−3.2225Fatty acid
83Hydroxyeicosanoic acidC20H40O316.478327.28943.2ndFatty acid
84Eicosanoic acid (Arachidic acid)C20H40O216.491311.2957−0.5ndFatty acid
85Hexacosanoic acidC26H52O216.642395.38862.0ndFatty acid
86Hydroxytetracosanoic acidC24H48O316.666383.35311.3ndFatty acid
87Octadecanoic acidC18H36O216.734283.26265.9ndFatty acid
88Octadecatrienoic acidC18H30O216.799277.2186−4.6ndFatty acid
89Trihydroxy octadecenoic acidC18H34O516.876329.23262.3ndFatty acid
90Hydroxypalmitic acidC16H32O317.049271.22703.3225Fatty acid
91Hexadecenoic acidC16H30O217.244253.2173−3.8ndFatty acid
92Docosanedioic acidC22H42O417.368369.30041.4ndFatty acid
93Pentacosanedioic acidC25H48O417.479411.34702.4ndFatty acid
94Eicosanedioic acidC20H38O417.660341.26853.4ndFatty acid

2.1.2. Phenolic Acids

Several phenolic acids were annotated, including hydroxybenzoic acid (14), displaying a characteristic 44 amu (CO2) loss. Syringic acid (20) exhibited a molecular ion [M–H] at m/z 197.0460 and yielded a product ion at m/z 167, indicating the loss of two methyl groups. In addition, several hydroxycinnamic acids were annotated in CLEE, including caffeic and ferulic acid conjugates. Caffeic acid (17) [M−H] at m/z 179.0350 was characterized by a loss of a CO2 group forming a product ion at m/z 135. Ferulic acid (46) and its isomer (49) showed deprotonated molecular ions at m/z 193.0514 and 193.0506, respectively, followed by a subsequent loss of CH3-group yielding a product ion [M–H−15] at m/z 178. Aside from free cinnamates, acylated forms were detected. For example, caffeoyl quinic acid (9) and its isomer (11) showed a pseudomolecular ion at m/z 353.0858 and 353.0877, respectively, and displayed a fragment ion of quinic acid moiety (m/z 191) [28]. Peaks (26) and (51) were annotated as dicaffeoylquinic acid, exhibiting quasi-molecular ions at m/z 515.1213 and 515.1195, respectively, and a product ion at m/z 353 corresponding to the loss of a caffeoyl moiety.

2.1.3. Flavonoids

Various flavonoids were detected, including flavones, flavonols, and aurones, with flavones amounting to the major subclass. Luteolin, luteolin 5-methyl ether, and tricin-O-glycosides were the major flavones identified in CLEE. This concurs with previous reports on Cyperus species [24]. Likewise, members of Cyperaceae exhibited the same pattern, especially in the occurrence of the rare marker compound, luteolin 5-methyl ether. Additionally, tricin, and luteolin were found in the glycosidic form in conjugation with uronic acids exemplified in 7-glucosides and/or 7-glucuronides [22,25]. Luteolin was mainly found as luteolin-O-glucuronide (50), exhibiting a deprotonated ion at m/z 461.0742 and a predominant product ion at m/z 285 [M–H–176] indicating a glucuronyl unit loss. Other luteolin glycosides were identified in peaks (57) at m/z 431.1003, (67) m/z 447.0933, (40) m/z 579.2388, (37) m/z 607.1305, (23) m/z 609.1459, and (24) m/z 623.1236. In MS–MS spectrum, the most abundant fragment ion at m/z 285 was observed corresponding to [M–H–146], [M–H–162], [M–H–132–162], [M–H–146–176], [M–H–162–162], and [M–H–162–176], respectively. These glycosides were identified as luteolin-O-deoxyhexoside (57), luteolin-O-hexoside (67), luteolin-O-pentosyl hexoside (40), luteolin-O-deoxyhexoside-O-glucuronide (37), luteolin di-O-hexoside (23), and luteolin-O-hexoside-O-glucuronide (24). Likewise, luteolin 5-methyl ether (53) was detected at m/z 299.0561. Additionally, luteolin 5-methyl ether-O-glucuronide (54, 65) was characterized by [M–H] at m/z 475.0889 and 475.0905, respectively, exhibiting a product ion at m/z 299 [M–H–176] indicating a glucuronyl unit loss.
Another flavone, aglycone, tricin (55) [M–H] at m/z 329.0681, was similarly detected. Other glucuronide/glycosidic conjugates of tricin were detected in peaks (56 and 64). In detail, compound (64) exhibited [M–H] at m/z 505.0988 and a product ion at m/z 329, corresponding to the loss of a glucuronyl unit (176 Da), indicating tricin-7-O-glucuronide. Likewise, peak (56) [M–H] at m/z 651.1575 showed an additional loss of 146 amu, indicating tricin-7-O-deoxhexosyl-O-glucuronide. Noteworthy, for tricin glycosides, the glucuronyl moiety was tentatively assigned to the O-7 hydroxyl group because the hydroxyl group at C-5 in ring A is not considered a place for sugar substitution [29]. Additionally, the presence of two methyl groups on ring B hydroxyls at C-3′ and C-5′ creates a spatial hindrance for sugar substitution to occur at the C-4′ hydroxyl group [29]. In the same context, compound (60) [M − H] at m/z 637.1774 showed a fragment ion at m/z 329, indicating the loss of a deoxyhexose (146 Da) and a hexose (162 Da), and annotated as tricin-7-O-deoxyhexosyl-O-hexoside.
Sulfated glycosides are typical components in the Cyperaceae family and could be detected herein mostly based on the loss of 80 amu for sulfate moiety. For example, MS-MS spectra of compounds (61) and (62) revealed the same predominant product ion at m/z 329 [M–H–80–162], thus, indicating the loss of a sulphated hexosyl unit and annotated as tricin-7-O-hexosylsulfate in agreement with previous reports [25]. Likewise, compound (63) showed a similar pattern displaying a molecular ion at m/z 395.0078 [M–H] C16H12O10S and an abundant product ion at m/z 315, indicating the loss of a sulfate moiety (80 Da) and assigned as tetrahydroxymethoxyflavone-O-sulfate.

2.1.4. Aurones

Aurones are structural isomers of flavones and are considered minor flavonoids owing to their very limited abundance in nature [22]. Abundant aurones were reported in Cyperus species [22]. In the current study, several aurones were identified in peaks 34, 41, 42, 43, 52, 66, 68, and 71. Peak assignment was based on the earlier elution of aurones compared to structurally related flavone isomers [30]. Compound (43) at m/z 285.0405 was tentatively identified as aureusidin, the most widely distributed aurone. Compound (34) displayed [M–H]− at m/z 327.0874 corresponding to C18H16O6, assigned as dihydroxy-dimethoxy-methylaurone based on product ions at m/z 283 and 163. Compound (52) [M–H]− at m/z 299.0561, C16H12O6 showed daughter fragment ions at m/z 284 and 267 and annotated as tetrahydroxy-methylaurone. Likewise, peak (71) displayed [M−H] at m/z 313.0718 (C17H14O6), showing a similar fragmentation behavior to compound (52), with an extra 14 amu and annotated as trihydroxy-methoxy-methylaurone [23].
Furthermore, several aurone glycosides were detected in peaks 41 and 42 at m/z 461.0742 and m/z 461.0736, respectively, with a predicted molecular formula C21H18O12 and exhibited a daughter fragment ion at m/z 285 [M–H−176] annotated as tetrahydroxyaurone-O-glucuronide. Peak 21 displayed molecular ion [M−H] at m/z 563.1411 (C26H28O14) and assigned as leptosidin-O-dipentoside, previously reported in C. scariosus and for the first time reported in CLEE [21].

2.1.5. Fatty Acids

Numerous fatty acids were annotated in CLEE, displaying the intense molecular ion peak [M−H] typical of fatty acids in the second half of the chromatogram in negative ion mode. A hydroxy unsaturated dicarboxylic fatty acid was detected exhibiting [M−H] at m/z 327.2196 C18H32O5 and displaying losses of a water molecule m/z 309 [M−H−H2O], and two CO2 molecules m/z 239 [M−H−2CO2] indicating a hydroxy dicarboxylic acid annotated as hydroxyoctadecenedioic acid (76). Additionally, several monohydroxy saturated fatty acids were observed, including hydroxytetradecanoic acid (78) C14H28O3 at m/z 243.1963, hydroxydocosanoic acid (79) C22H44O3 at m/z 355.3211, hydroxypentadecanoic acid (81) C15H30O3 at m/z 257.2124, hydroxyeicosanoic acid (83) C20H40O3 at m/z 327.2894, hydroxypalmitic acid (90) C16H32O3 at m/z 271.2270 and hydroxytetracosanoic acid (87) C24H48O3 at m/z 383.3531. In addition, monohydroxy unsaturated fatty acids hydroxytetracosenoic acid (80) C24H46O3 at m/z 381.3364, hydroxyhexadecenoic acid (82) C16H30O3 at m/z 269.2131 were also assigned. Additionally, a trihydroxy unsaturated fatty acid was identified as trihydroxyoctadecenoic acid (89) exhibiting [M−H] at m/z 329.2326 C18H34O5. Noteworthy, fatty acids showing a mass difference of two amu indicate the occurrence of an additional double bond [28]. Octadecatrienoic acid (88) C18H30O2 at m/z 277.2186 displayed a decrease by six amu from compound (87), indicating the occurrence of three double bonds, and hexadecenoic acid (91) C16H30O2 at m/z 253.2173 could be identified. Additionally, dicarboxylic saturated fatty acids were also detected, including docosanedioic acid (92) C22H42O4, pentacosanedioic acid (93) C25H48O4 at m/z 369.3004 and eicosanedioic acid (94) C20H38O4 at m/z 341.2685.

2.2. Thioacetamide-Induced Hepatorenal Toxicity Results

2.2.1. Body Weight

The administration of TAA led to a marked reduction in the rats’ body weight from the second week until the sixthweek (Table 2) by 19%, 19.5%, 28%, 27%, and 26% compared to the control, respectively. On the contrary, the rats that were given CLEE + TAA exhibited an insignificant gain of body weight until the fifth week. Only CLEE (100 mg/kg) in the sixth week significantly ameliorated the body weight gain by 11% compared to the TAA (p ≤ 0.05).

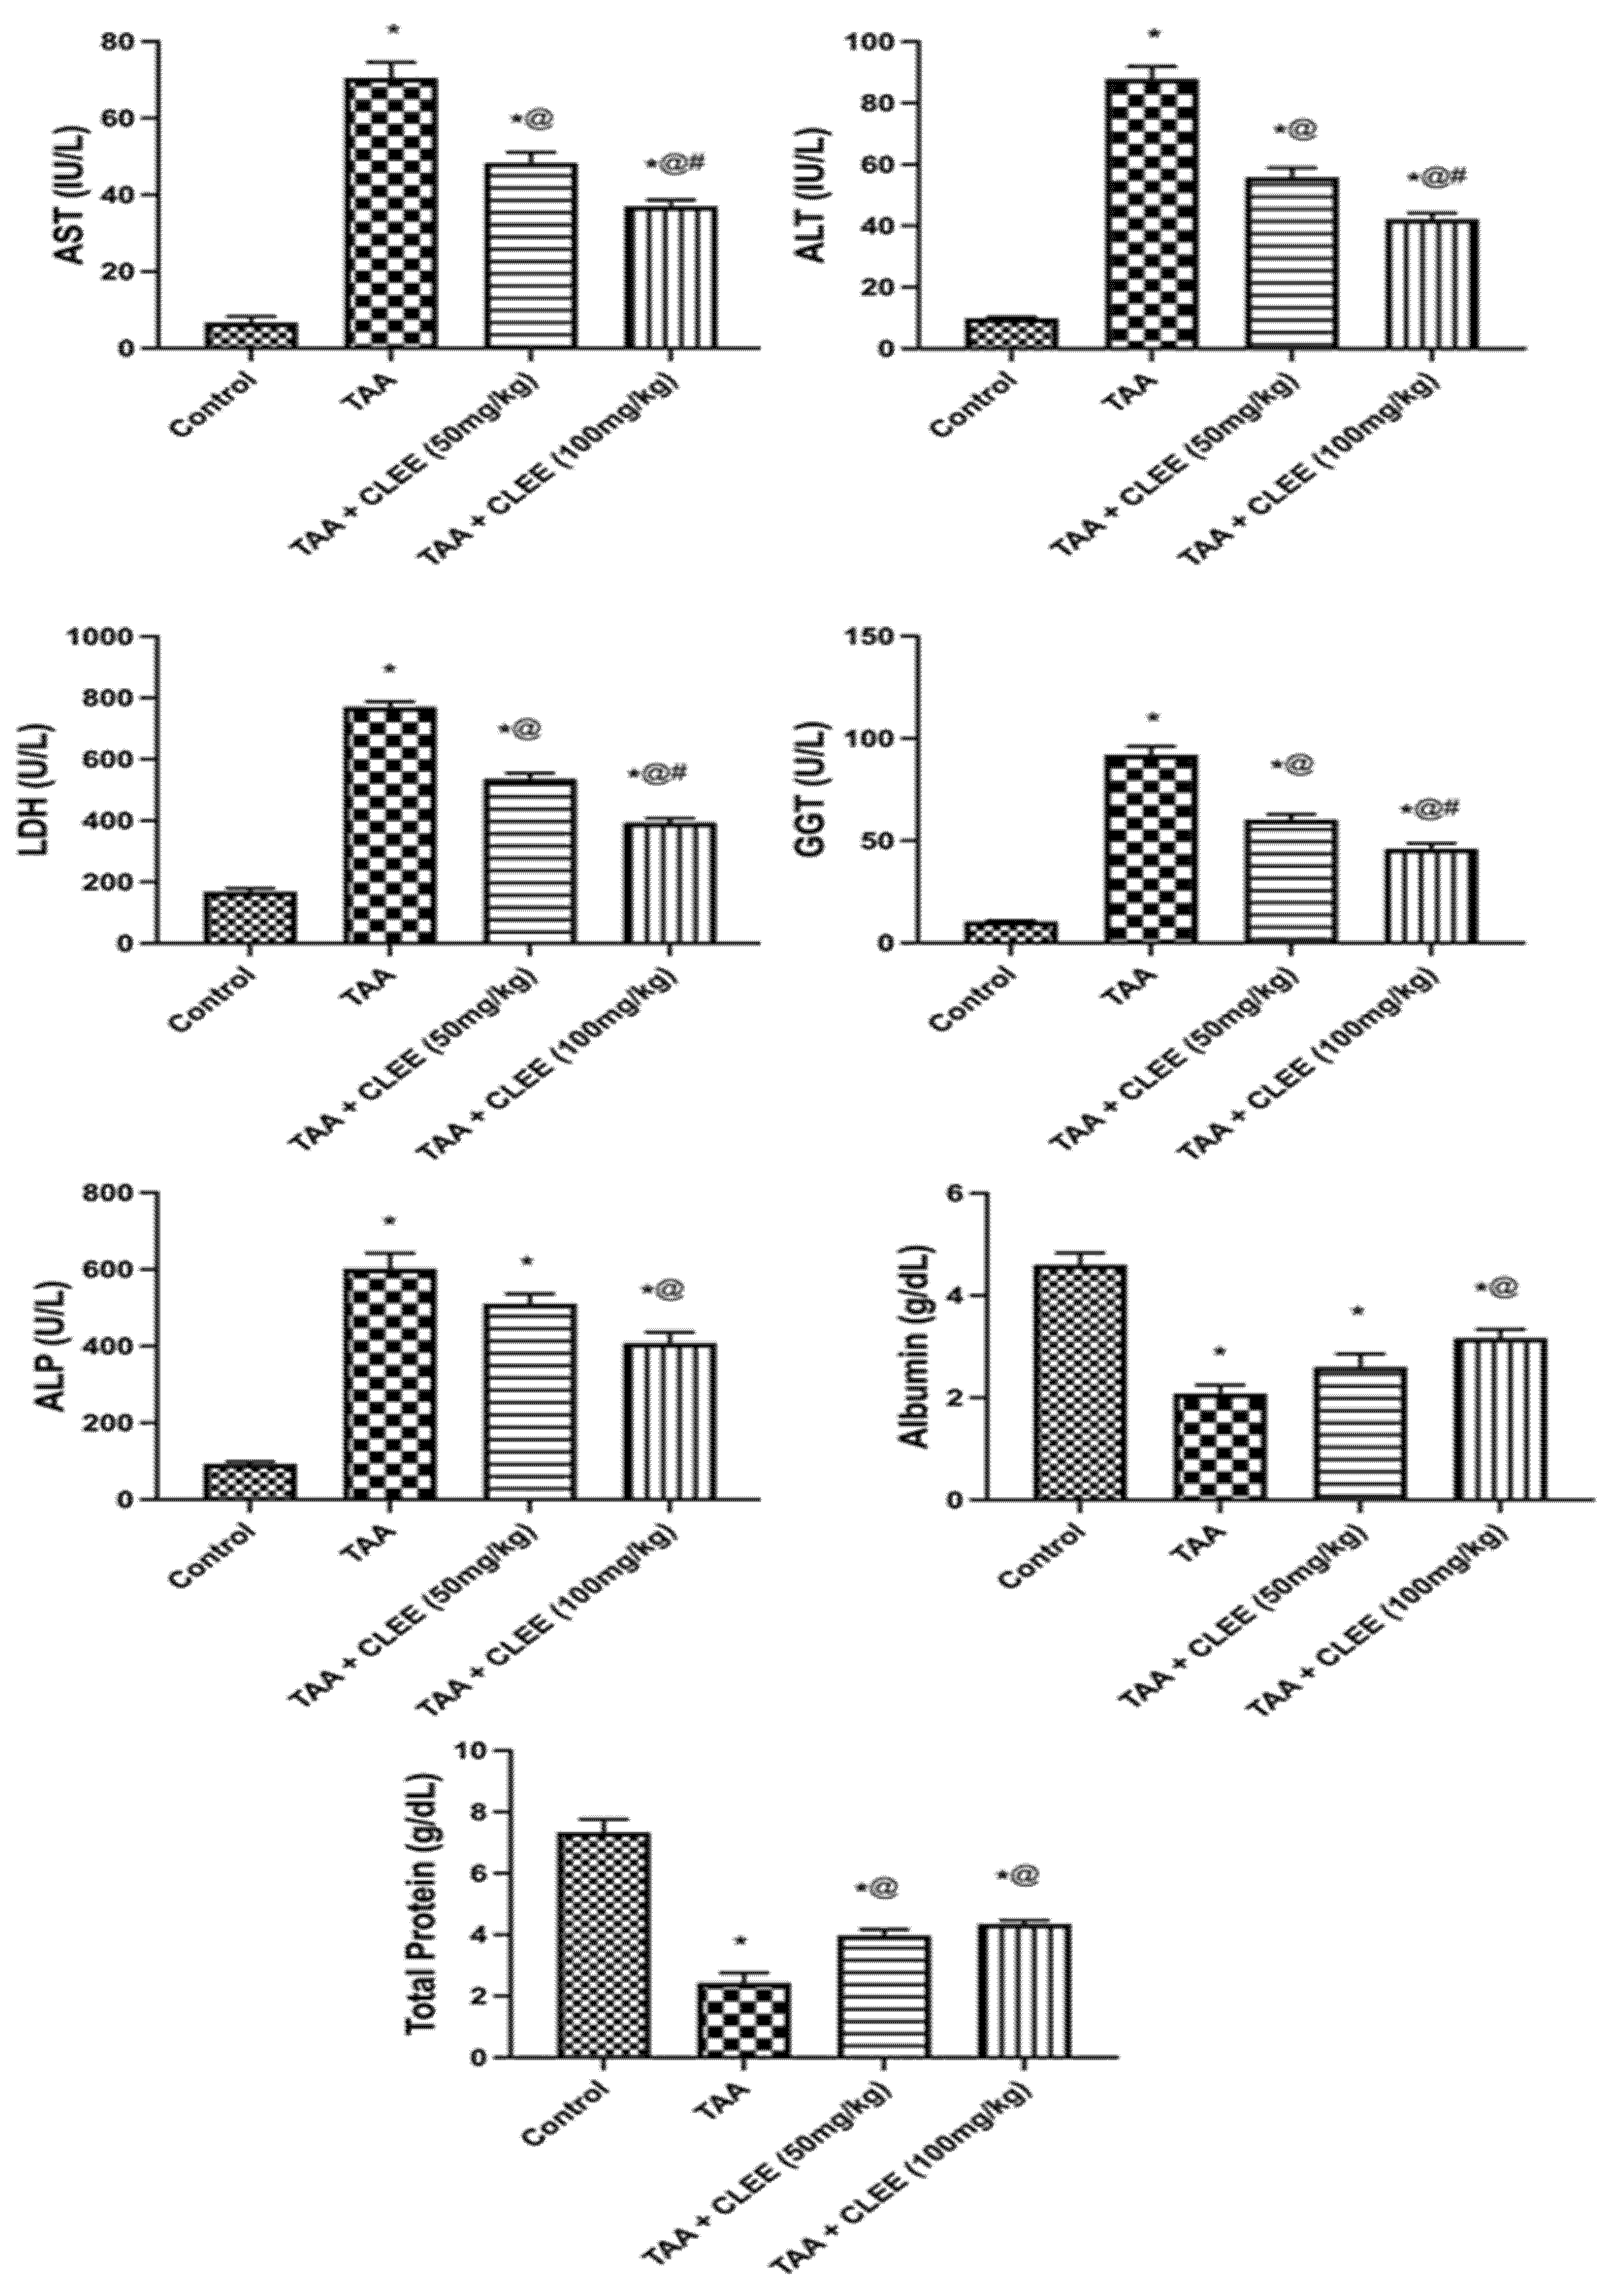
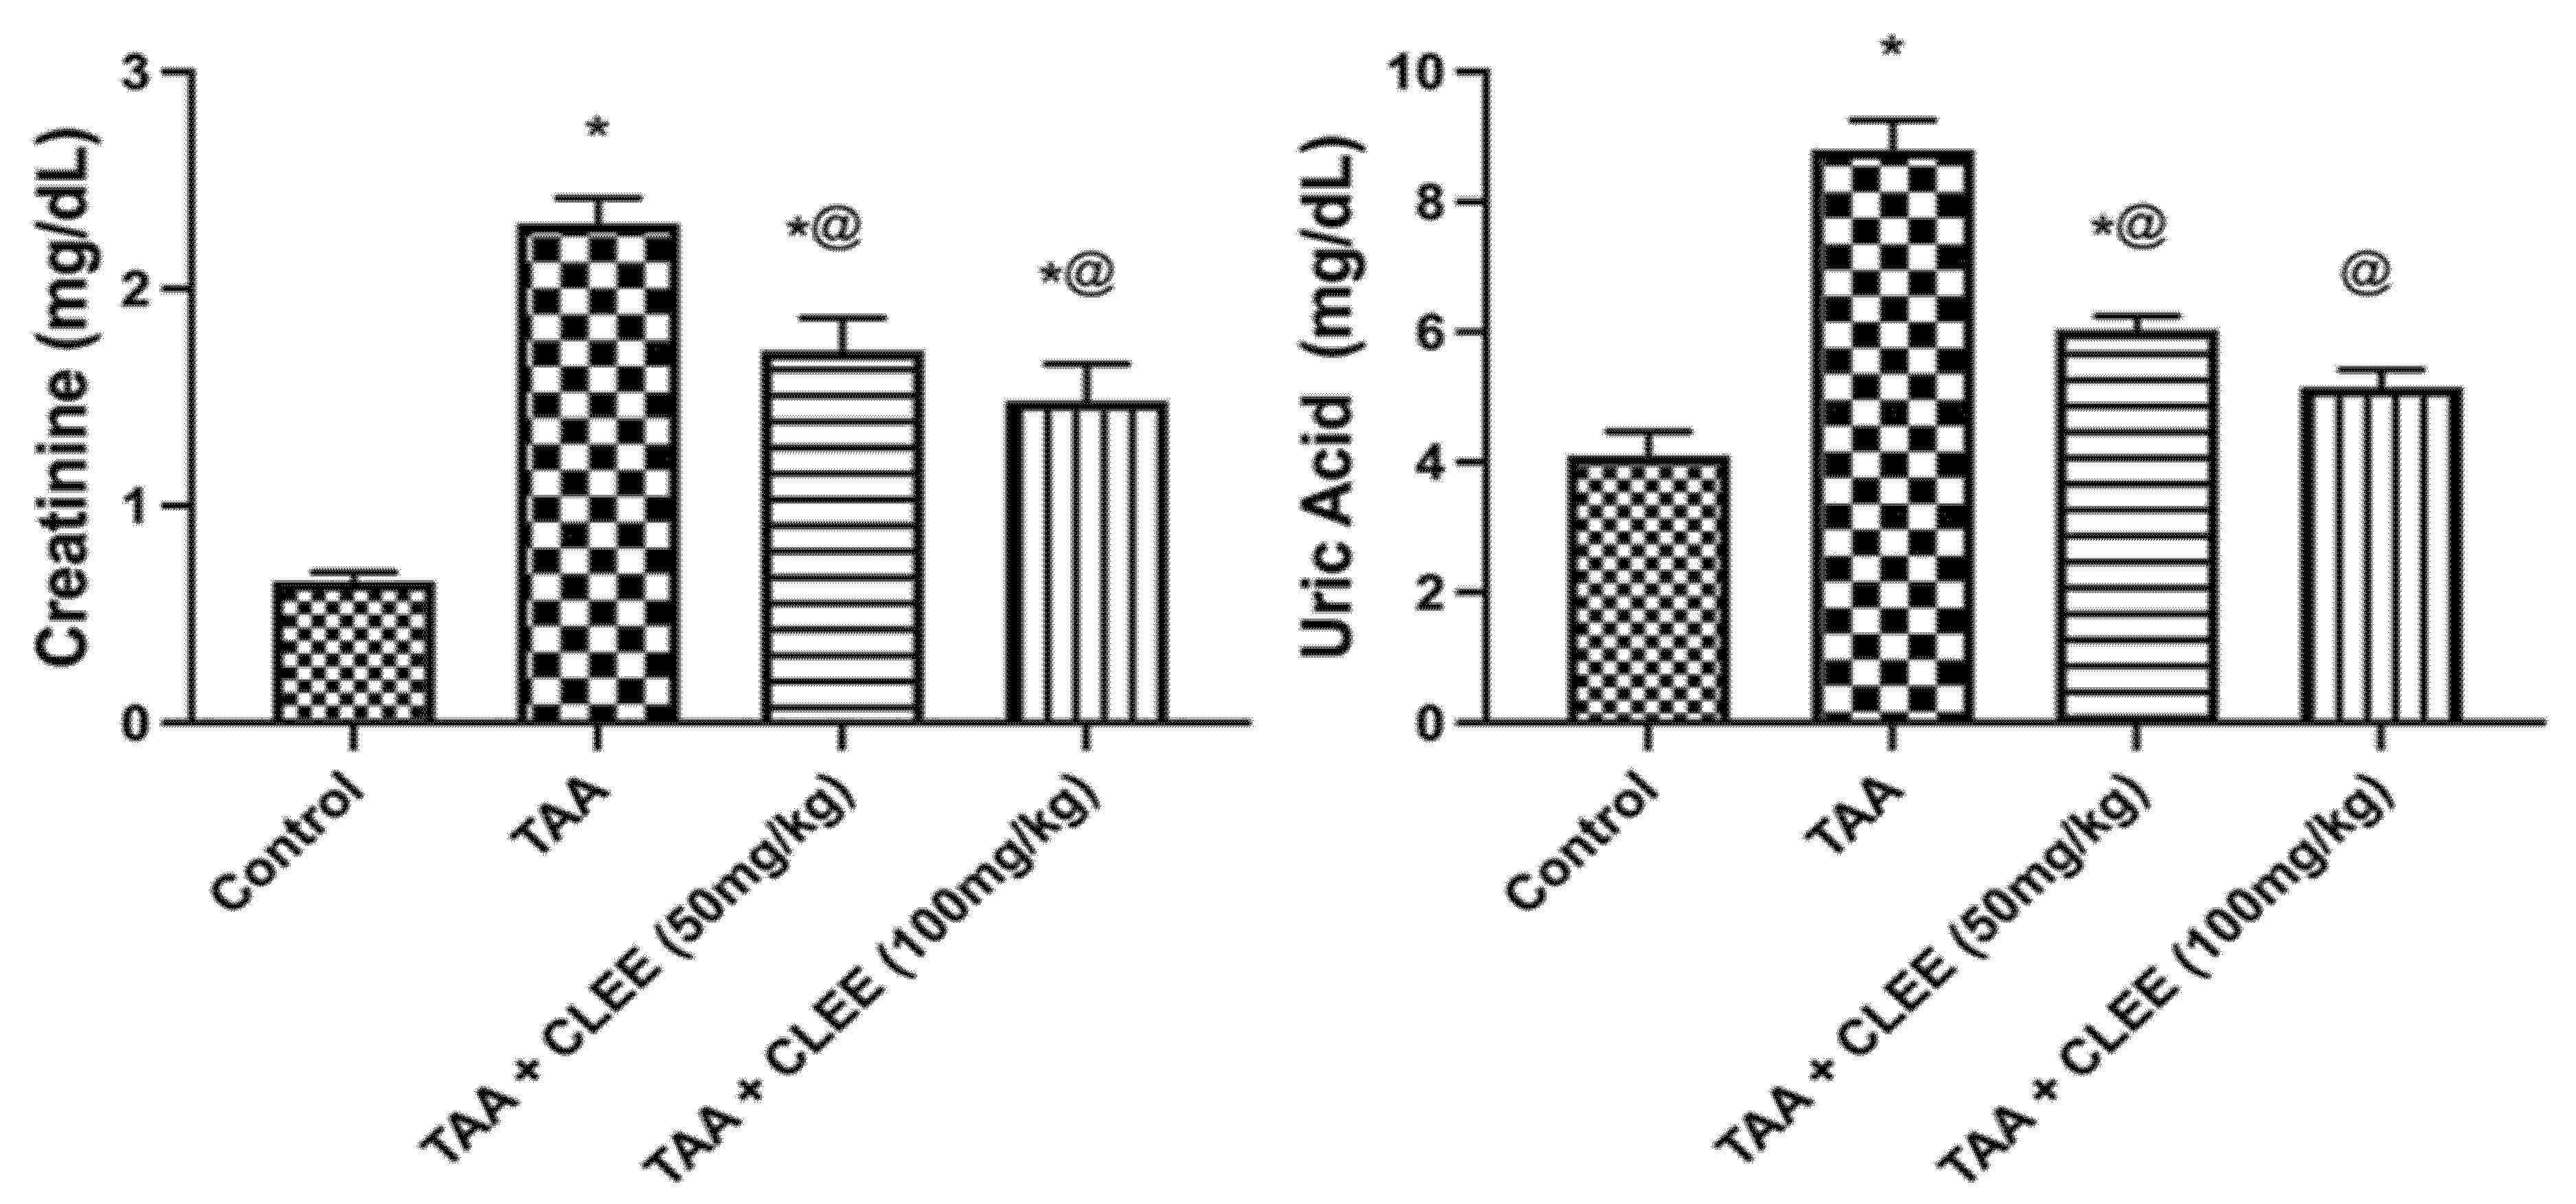
2.2.2. Biochemical Indicators of Hepatic and Renal Function

The administration of TAA led to a significant elevation (p ≤ 0.05) in serum AST, ALT, ALP, GGT, and LDH by 9.0-, 10.5-, 6.4-, 8.7-, and 4.6-fold compared to the control group, respectively. On the contrary CLEE (100 mg/kg) showed a significant reduction in serum AST, ALT, ALP, GGT, and LDH by 52%, 48%, 32%, 49%, and 48%, respectively, compared to the TAA group. Likewise, CLEE (50 mg/kg) displayed a marked reduction in serum AST, ALT, GGT, and LDH by 36%, 31%, 34%, and 30%, respectively, compared to the TAA group. Contrariwise, the total protein and the albumin levels depicted lower levels in the TAA group compared to the control group by 66% and 55%, respectively. Meanwhile, CLEE at 50 and 100 mg/kg restored the serum total protein by 64% and 79%, respectively, compared to the TAA group. Only CLEE (100 mg/kg) replenished the serum albumin by 52% compared to the TAA group (Figure 3). The intoxication by TAA resulted in a significant elevation in serum creatinine and uric acid levels by 3.5- and 2.1-fold, respectively, compared to the control group. Conversely, administration of CLEE at 50 and 100 mg/kg reduced the serum creatinine levels by 25% and 36% and uric acid levels by 31% and 41%, respectively, compared to the TAA group (Figure 4).

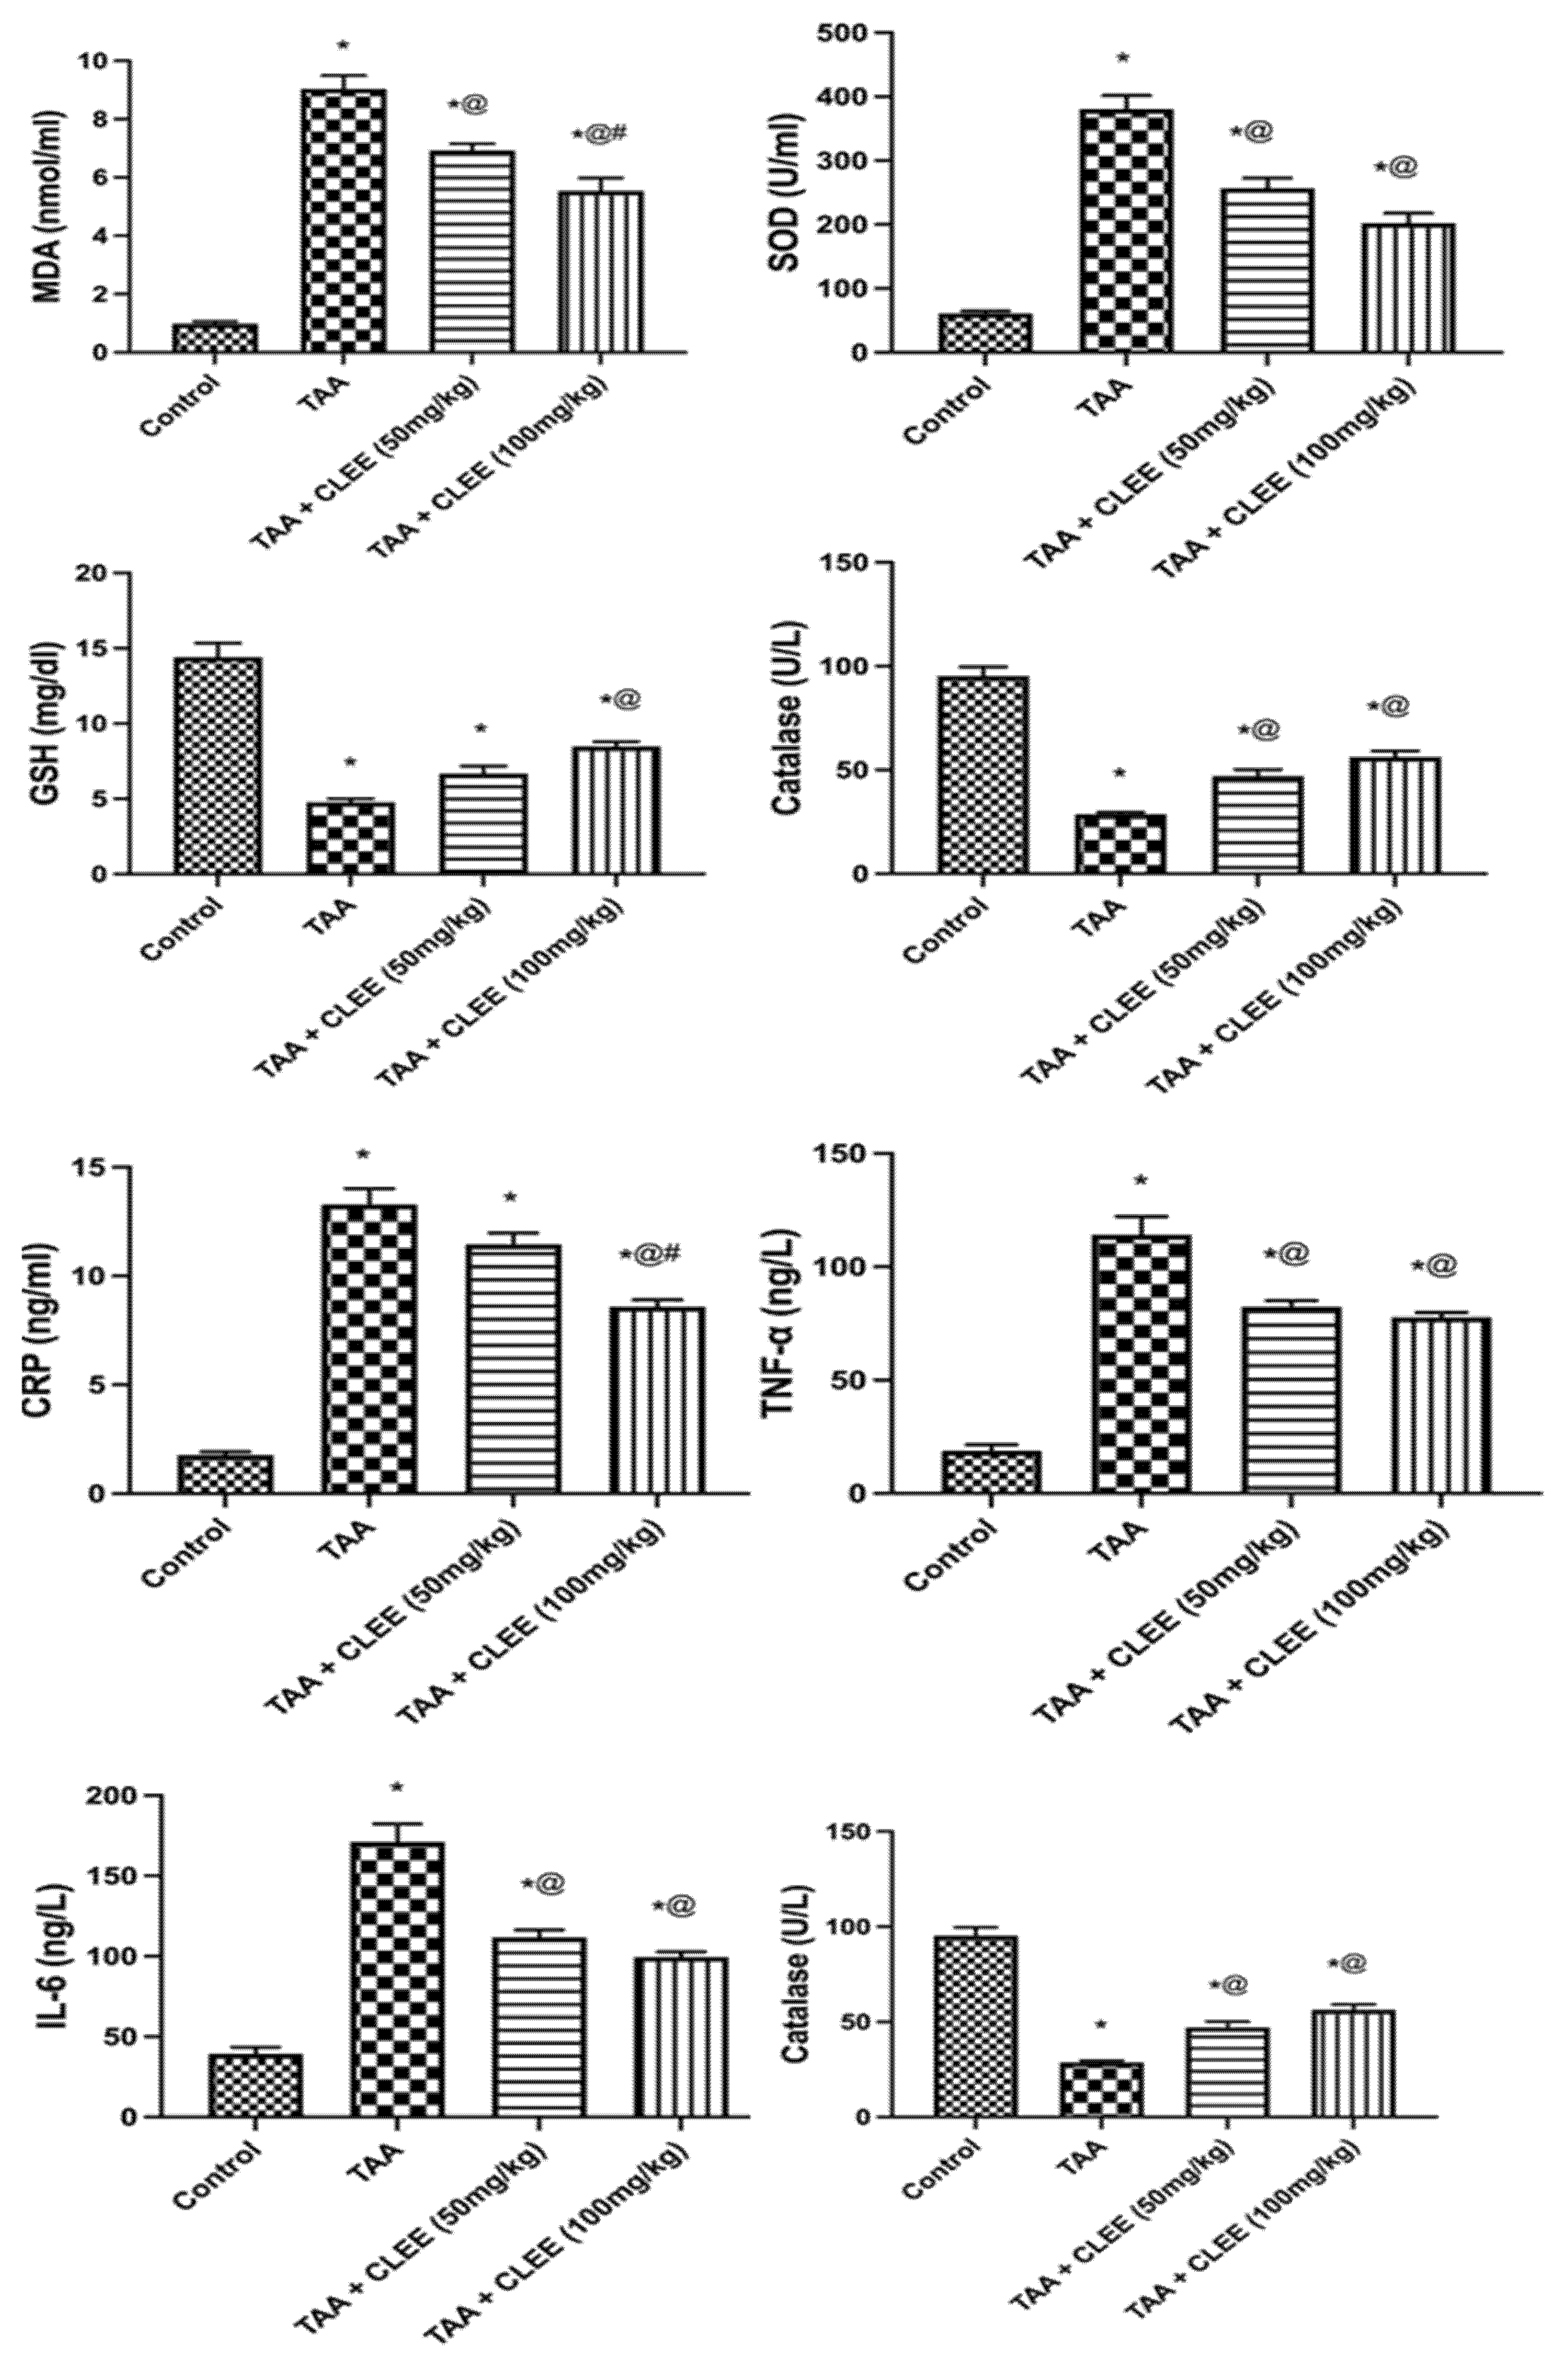
2.2.3. Plasma Oxidative Stress and Inflammatory Markers

The administration of TAA led to a significant increase (p ≤ 0.05) in MDA, SOD, CRP, TNF-α, and IL6 levels by 9.2-, 6.2-, 7.4-, 6.0- and 4.4-fold, respectively, compared to the control group. On the other hand, CLEE (50 mg/kg) decreased the previous parameters by 23%, 32%, 14%, 28%, and 35%, respectively, compared to the TAA group. While CLEE (100 mg/kg) reduced the serum level of MDA, SOD, CRP, TNF-α, and IL6 by 38%, 47%, 35%, 32%, and 42%, respectively (Figure 5). The TAA group depicted lower serum levels of GSH and catalase than the control group by 67% and 70%, respectively. On the contrary, CLEE (50 and 100 mg/kg) elevated the GSH by 40% and 80%, respectively, compared to the TAA group. Meanwhile, CLEE (50 and 100 mg/kg) showed increased serum catalase by 1.6- and 2.0-fold, respectively, compared to the TAA group (Figure 5).

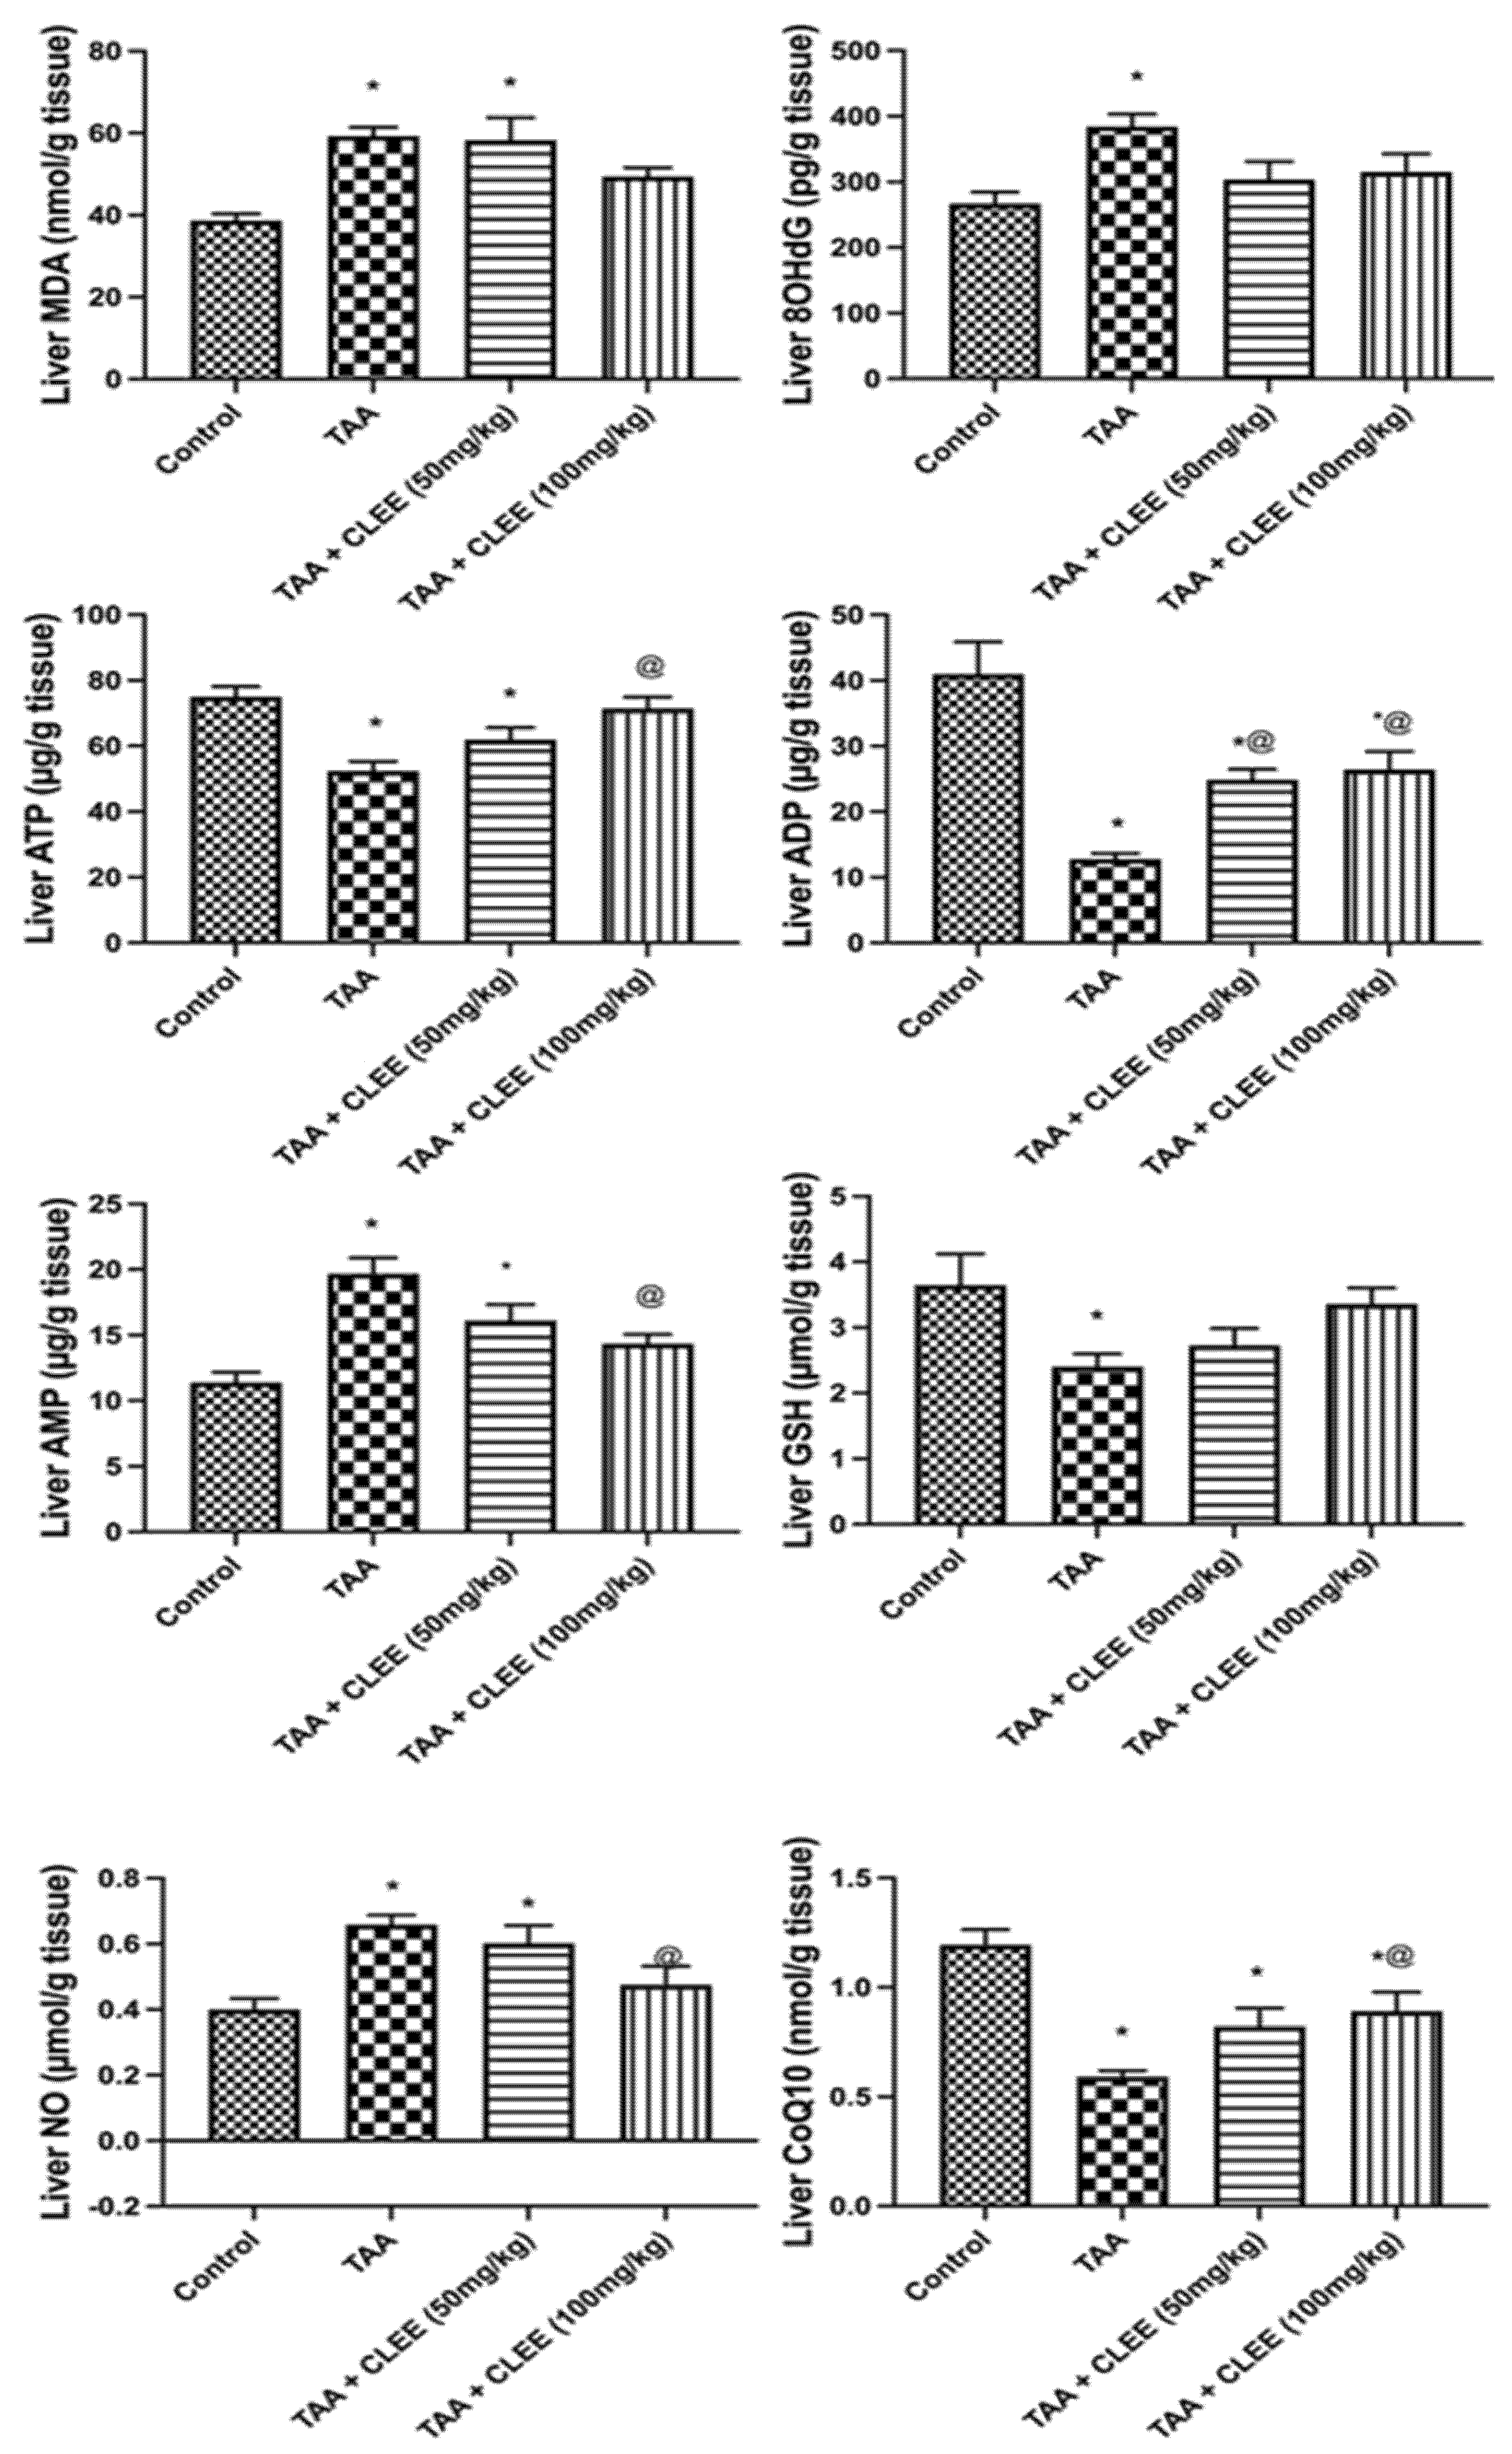
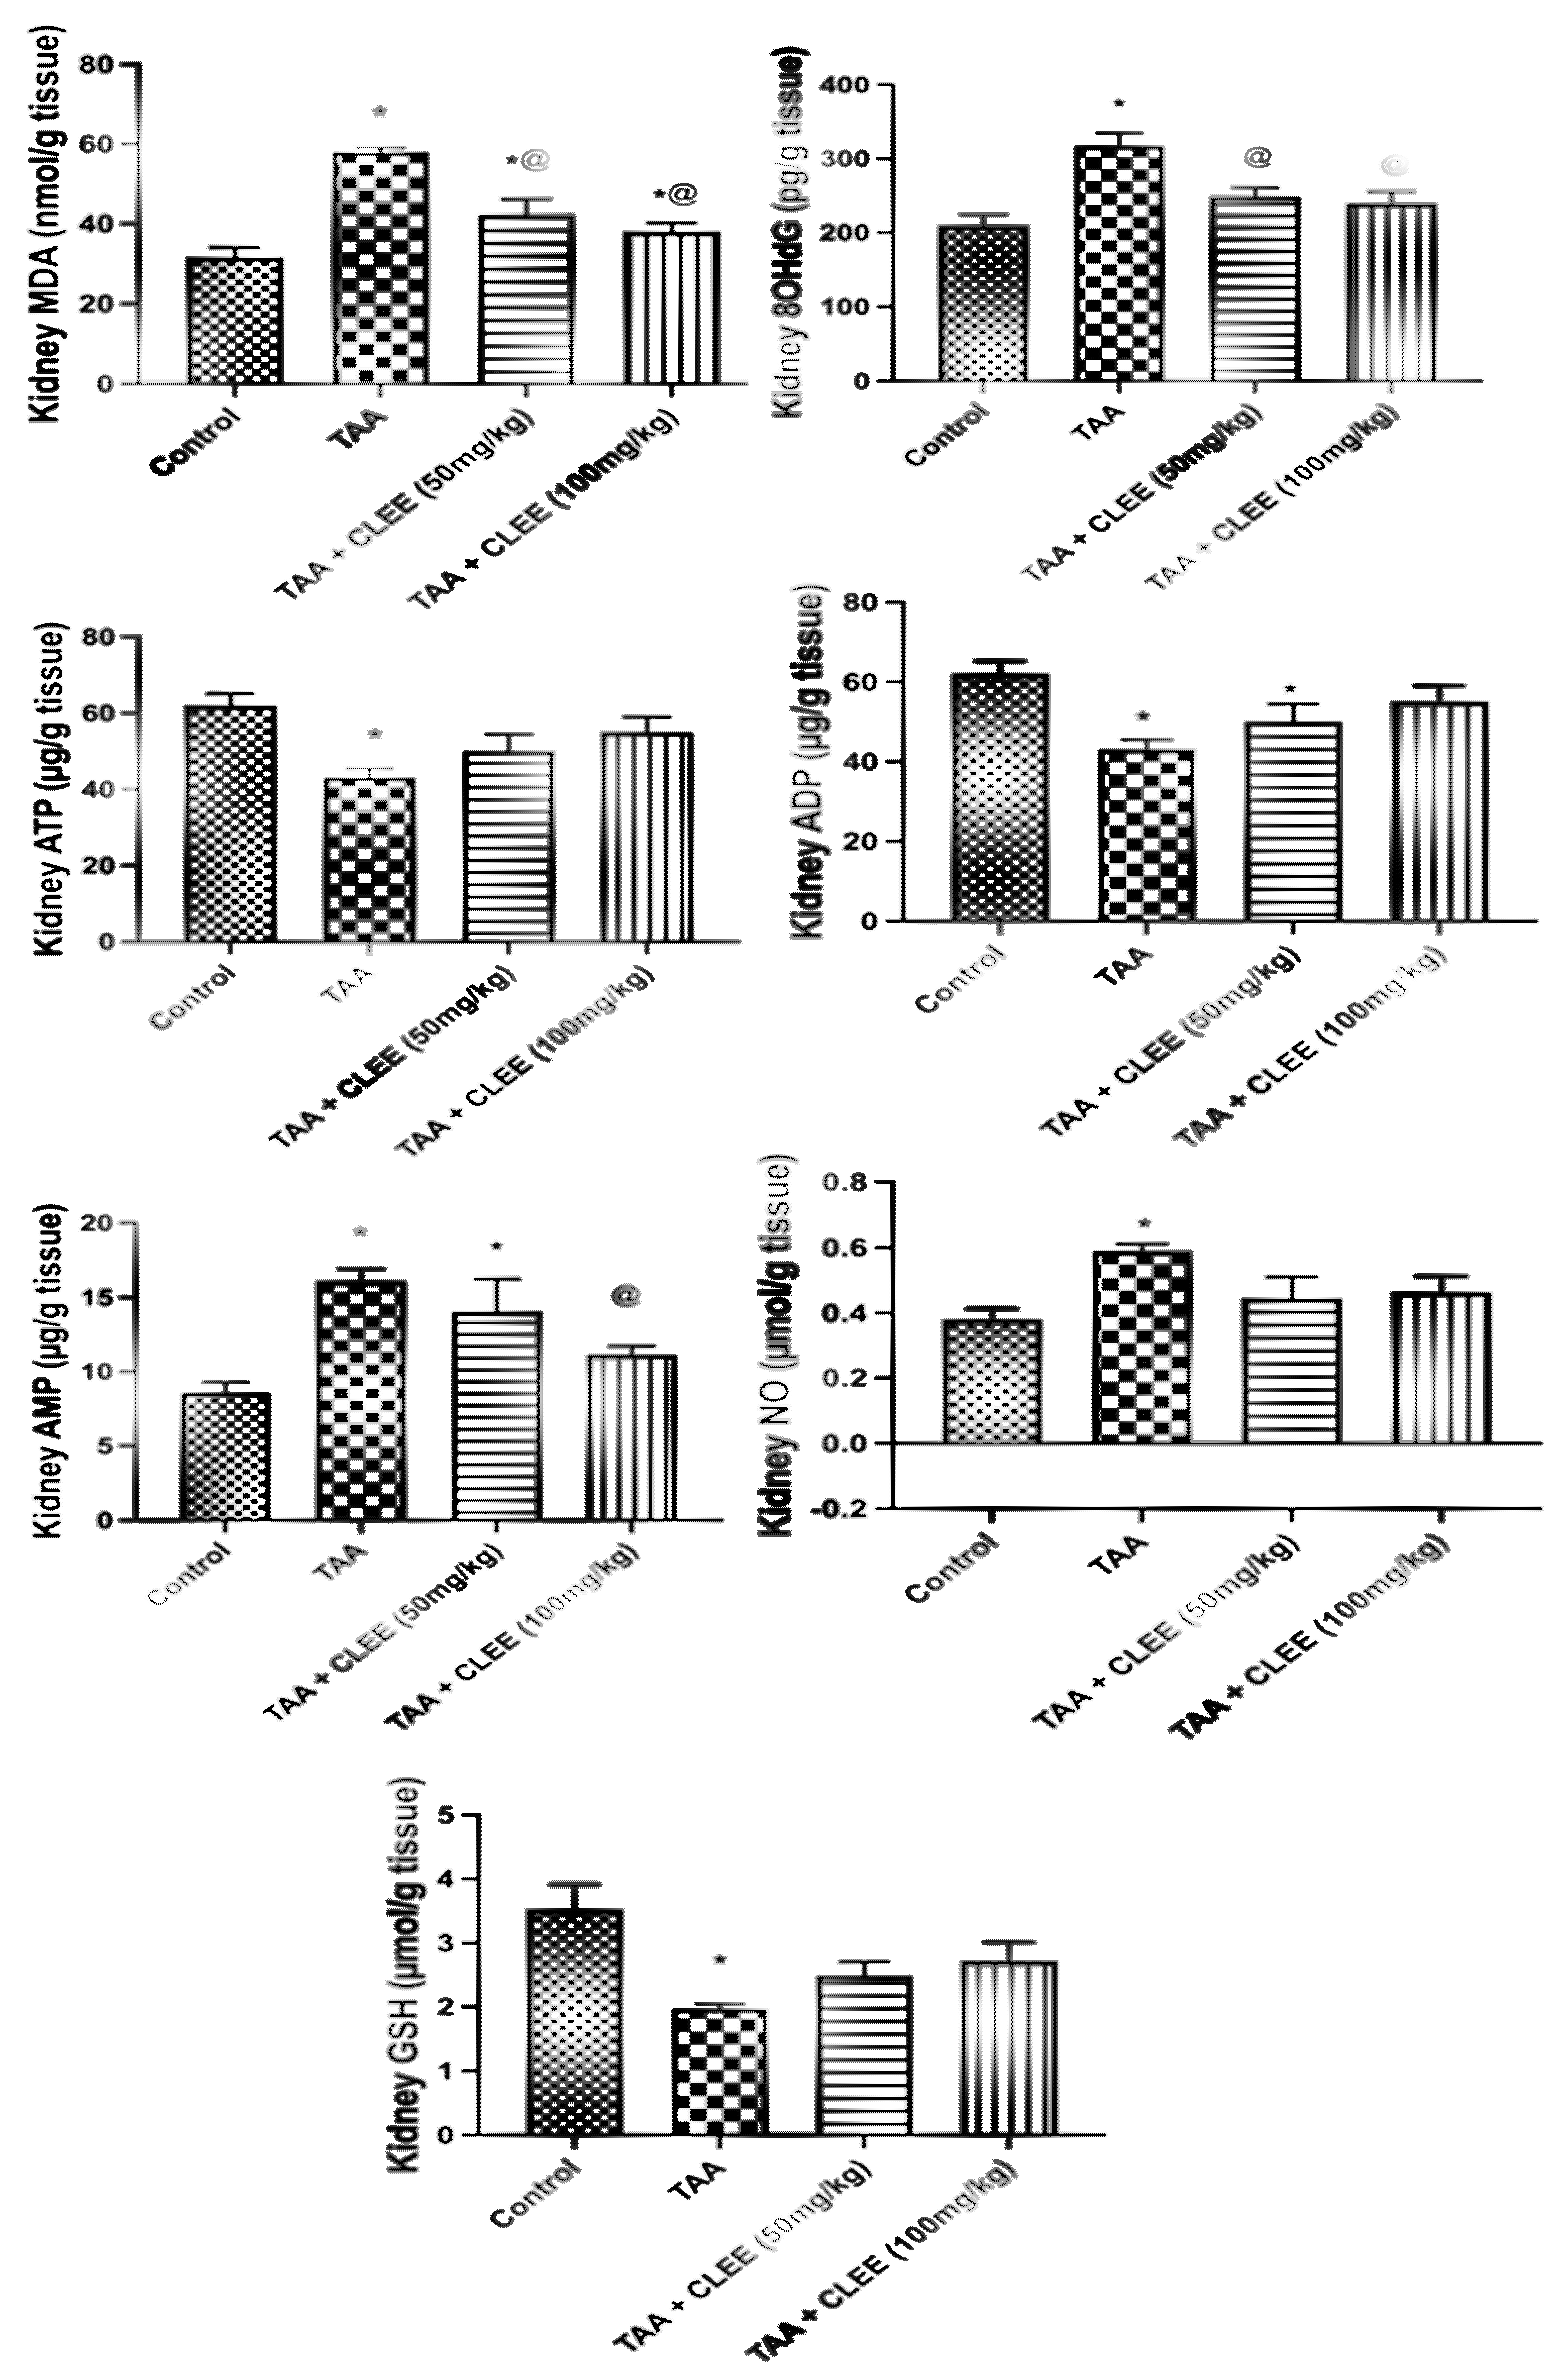
2.2.4. Hepatic and Renal Oxidative Stress and Energy Parameters

Figure 6 indicated that TAA-induced prominent elevation in hepatic content of MDA, 8OHdG, NO, and AMP by 53%, 44%, 73%, and 65%, respectively, compared to the control group. On the other side, only the administration of CLEE (100 mg/kg) led to a significant decrease in hepatic content of NO, and AMP by 27% and 28%, respectively, compared to the TAA group. Noteworthy, the hepatic contents of these parameters were comparable to the normal group. Moreover, compared to the control group, TAA-induced significant decline in ATP, ADP, GSH, and CoQ10 by 30%, 69%, 159%, and 34%. Conversely, the administration of CLEE (100 mg/kg) restored the hepatic content of ATP, ADP, and CoQ10 by 36%, 106%, and 38%, respectively, compared to the TAA group.
Similarly, Figure 7 illustrated a substantial increase in renal content of MDA, 8OHdG, NO, and AMP by 83%, 52%, 88%, and 55%, respectively, owing to the effect of TAA compared to the control group. Contrarywise, the administration of CLEE (50 mg/kg) decreased the renal content of MDA and 8OHdG by 27% and 22%, respectively, compared to TAA. Meanwhile, the administration of CLEE (100 mg/kg) decreased the renal content of MDA, 8OHdG, and ATP by 34%, 25%, and 31%, respectively, compared to TAA. Additionally, compared to the control group, TAA induced a significant reduction in renal content of ATP, ADP, and GSH by 30%, 149%, and 44%. Meanwhile, the administration of CLEE (50 and 100 mg/kg) failed to reduce the renal content of ATP, ADP, and GSH compared to TAA. However, CLEE (100 mg/kg) improved these parameters to levels comparable to the normal control group.

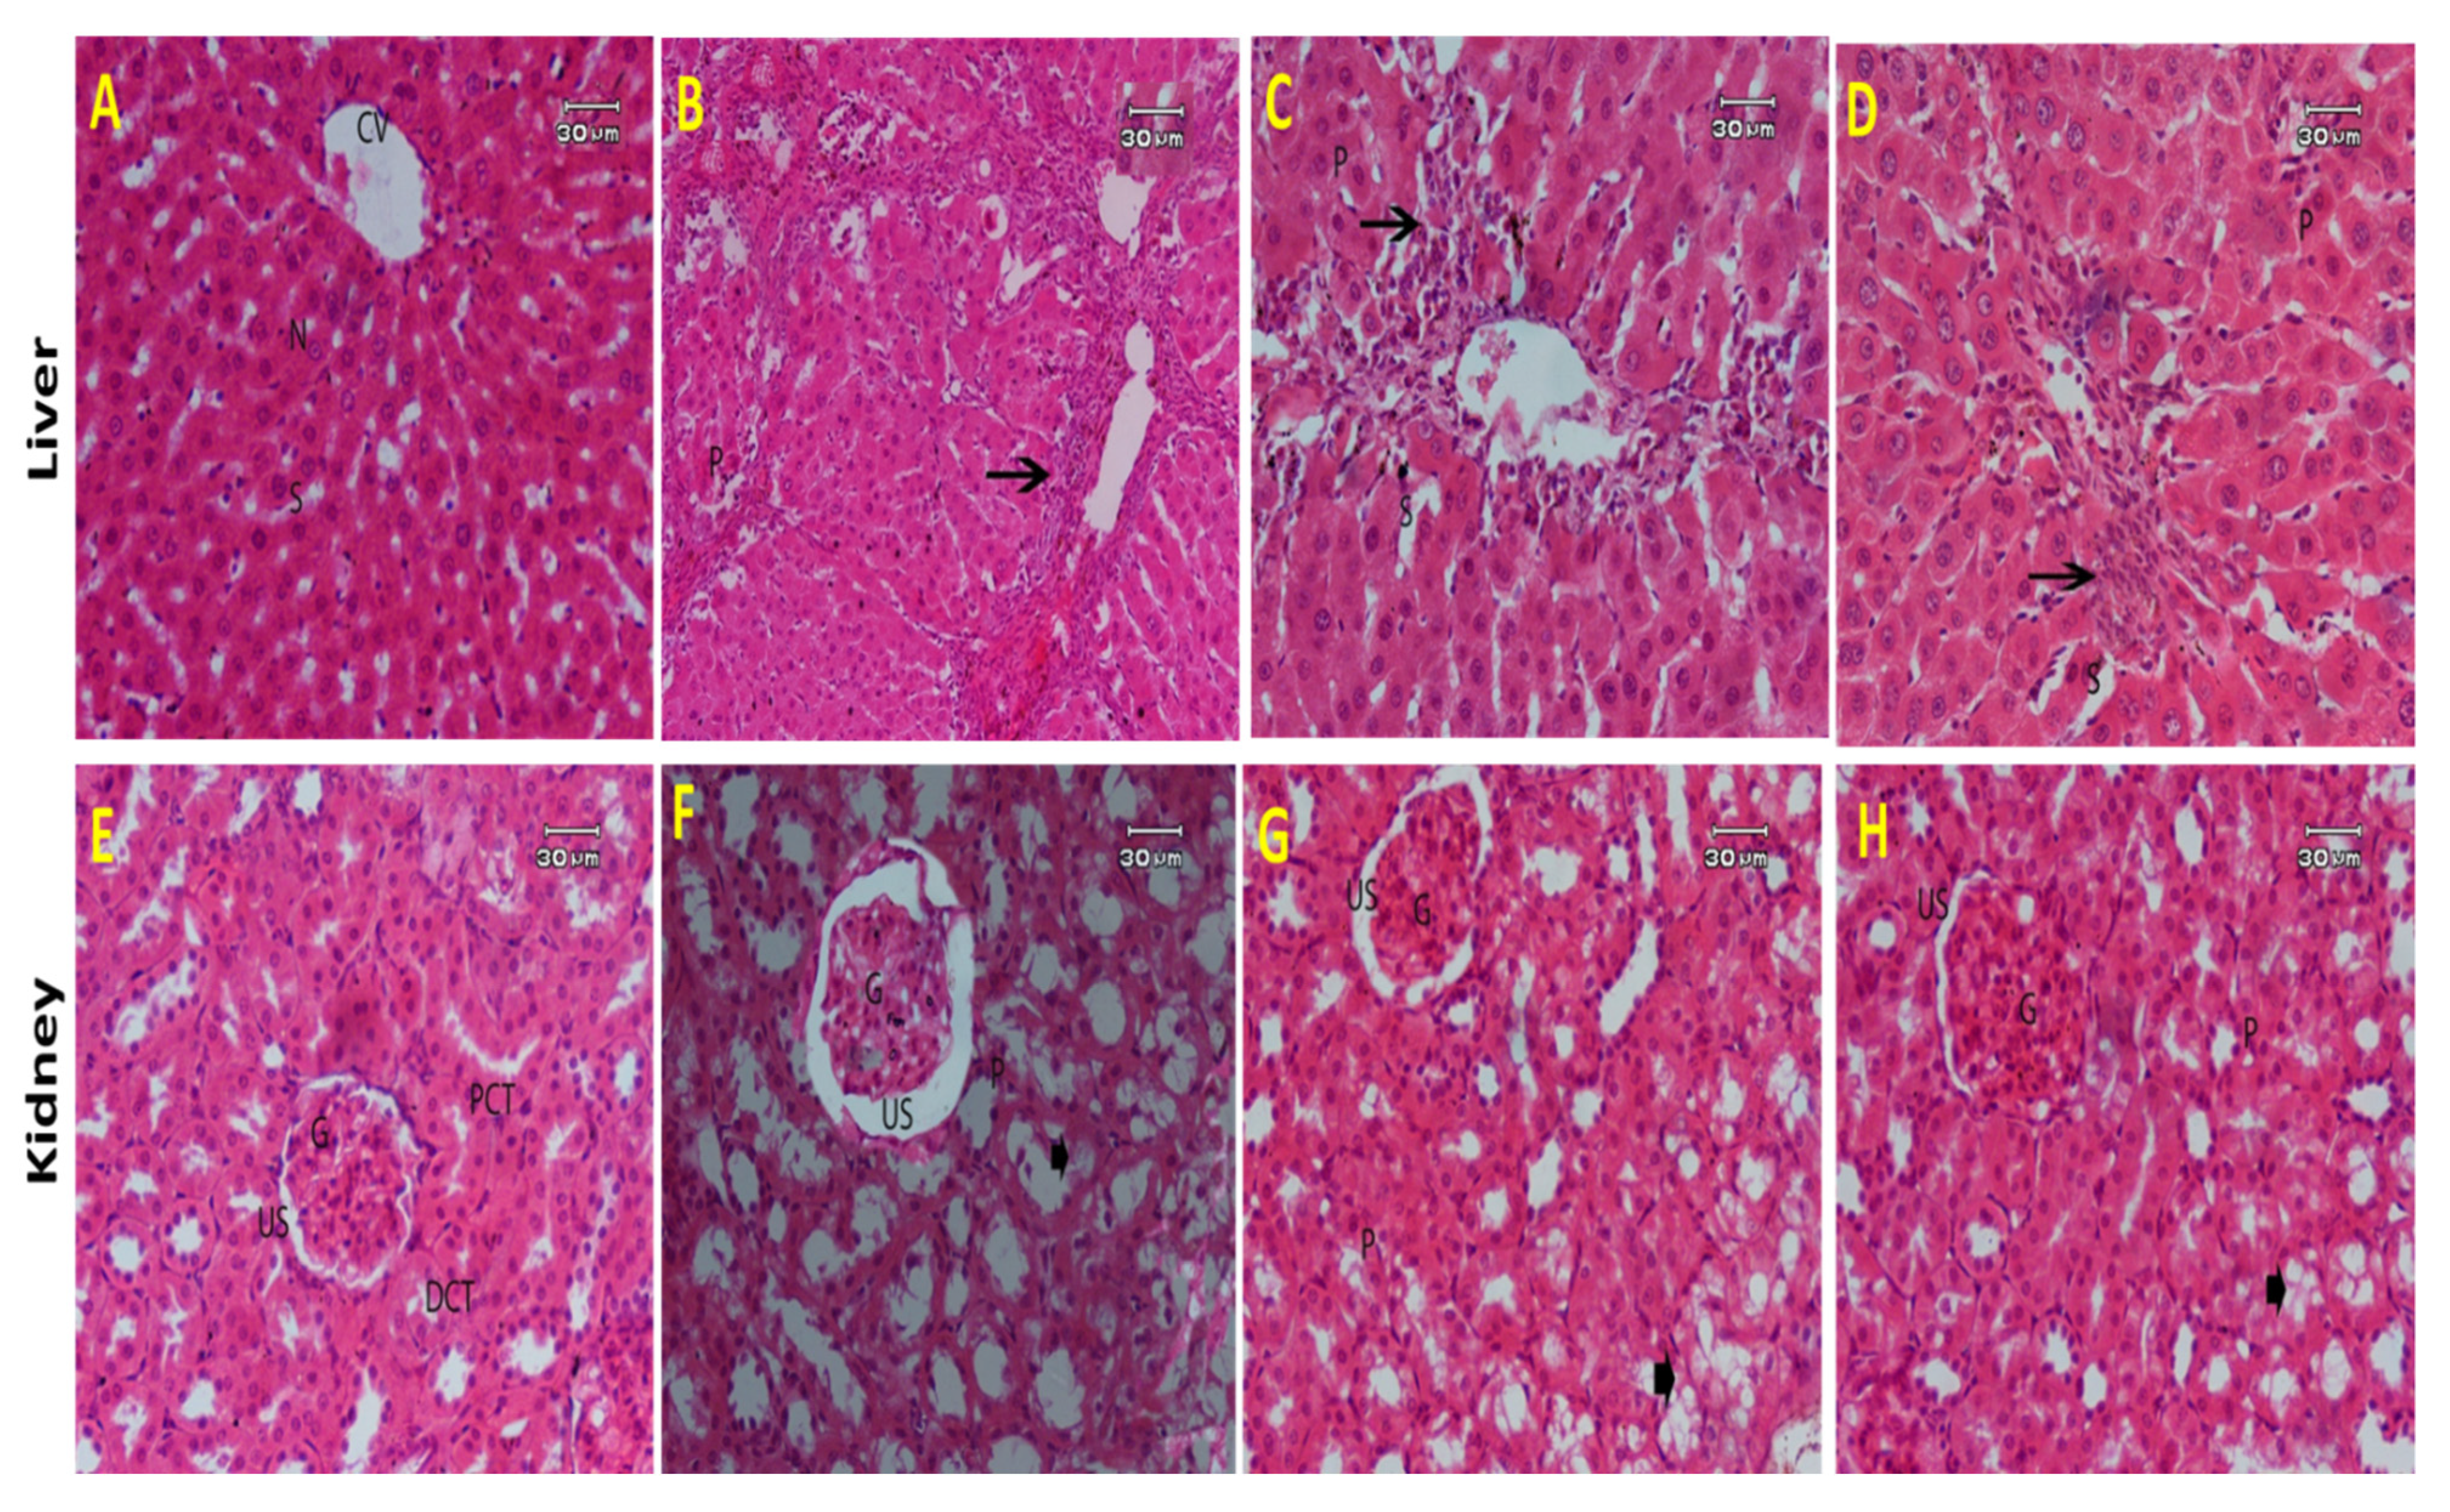
2.2.5. Histopathological Results

  • Liver
The liver tissue of the normal control groups exhibited normal architecture of the central vein, blood sinusoids, and nuclei (Figure 8A). TAA-intoxicated rats showed a noticeable degree of fibrosis, hepatic damage with disruption of hepatic cell cord, and necrotic hepatocytes, with infiltration of inflammatory cells around the central veins. Moreover, inflammatory cell infiltrations in the portal areas and pseudo-lobulation were also detected. Congestion of blood vessels and degenerative changes with nuclear pyknosis were also observed (Figure 8B). The liver section of TAA and 50 mg/kg b.w. of CLEE showed mild to moderate fibrosis with necrotic hepatocytes and inflammatory cell proliferation between the congested portal veins. Degenerative changes with nuclear pyknosis and dilated blood sinusoids were also observed (Figure 8C). The liver section of TAA and 100 mg/kg b.w. of CLEE group indicated fine fibroblastic cells and few inflammatory cells infiltration surrounding and adjacent to the central vein. Degenerative changes with nuclear pyknosis and dilated blood sinusoids were also observed (Figure 8D).
  • Kidney
Light microscopic pictures of renal tissues from the control group showed normal architecture of glomeruli, normal Bowman’s space in between, with normal tubular structures (Proximal convoluted tubule & distal convoluted tubule) (Figure 8E). Histopathological examination of sections from rat kidneys intoxicated by TAA showed impaired renal morphology throughout, shrunken glomeruli with wide dilated capsular spaces, and generalized tubular epithelial cell degeneration, necrosis associated with pyknotic nuclei, and inflammatory cell infiltration (Figure 8F). Kidneys from animals administered TAA and 50 mg/kg b.w. of CLEE showed partial damage to glomeruli with less dilated Bowman’s capsule and less tubular dilation (Figure 8G). Kidneys from animals administered TAA and 100 mg/kg b.w. of CLEE showed nearly normal kidney architecture in most of the glomeruli and Bowman’s capsules space with intact epithelial cell and tubules structures in addition to mild damage of proximal and distal tubules (Figure 8H).

3. Discussion

In the current study, the protective effect of CLEE was investigated against hepatorenal toxicity induced by thioacetamide. TAA is a frequent hepatotoxic agent resulting in free radical production and oxidative stress through its S-oxide metabolite characterized by high reactivity and instability [31]. The present study illustrated the capability of CLEE to mitigate oxidative stress induced by TAA, as confirmed by a significant decrease of hepatorenal MDA, 8-OHdG, and NO contents and enhancement of GSH and CQ10 content. Moreover, CLEE reduced oxidative stress in blood as evidenced by enhancement of GSH and catalase levels and reduced levels of MDA and SOD. CLEE exhibited antioxidant activity [7] attributed to its active flavonoid components. It was reported that flavonoids had various mechanisms to combat oxidative stress, including inhibiting enzymes used in ROS formation, scavenging ROS, and regulating the antioxidant defense system [32]. Here, CLEE reduced the histopathological changes in the liver and kidney induced by TAA. Oxidative stress is closely related to the pathological damage of hepatic cells representing a typical response to chronic liver injury [33]. Liver fibrosis is a wound-healing response to hepatocellular injury. It includes deposition of an extracellular matrix by activated hepatic stellate cells (HSCs) [34].
The decrease in pathological changes could be confirmed by a decrease in MDA and/or enhancement of GSH and CoQ10 contents. MDA is a product of lipid peroxidation that affects cell membranes, causing cell injury and necrotic cell death [35]. It was concluded that GSH and CoQ10 exhibited antioxidant activity and inhibited lipid peroxidation [36,37]. There is substantial evidence that TAA-induced liver damage is linked to increased oxidative stress and tissue damage caused by free radicals. Nevertheless, CLEE reduced the pathological changes via enhancement of catalase enzyme (antioxidant enzymes). Having the ability to decompose hydrogen peroxide to water and oxygen, catalase, as a therapeutic agent, is used to manage numerous oxidative stress-related diseases [38].
The increase in serums AST, ALT, and GGT in rats administered TAA is likely due to liver injury resulting in increased plasma membrane permeability and eventual leakage of the enzymes into the blood [39]. Also, serum ALP levels were elevated due to defective hepatic excretion as a reflection of hepatobiliary and hepatocellular injury [40]. These structural changes and this oxidative damage could also affect the liver’s secretory function, resulting in hypoproteinemia and hypoalbuminemia, leading to circulatory and renal dysfunction [41]. Here, CLEE suppressed the increase in liver enzymes induced by TAA, probably via decreasing oxidative stress in blood and liver and enhancing endogenous antioxidants. These findings were in agreement with a previous study on Cyperus laevigatus total extract revealing that the extract at 50 mg/kg daily dose exhibited antioxidant and antidiabetic effects with no toxic symptoms or mortality in rats [7]. These results completely agreed with previous data that revealed potent protective effects of Cyperus plants against inflammation, hepatic damage, ulcers, and diabetes such as C. laevigatus, C. rotundus, C. rotundus. C. alternifolius, and C. conglomeratus [7,10].
Moreover, another proposed mechanism for CLEE protection was evidenced by resistance to increase in inflammatory markers, TNF-α, IL6, CRP, and NO levels induced by TAA, indicating anti-inflammatory properties of the extract. It has been reported that TNF-α content was increased in many conditions of cellular injury [42]. A previous experiment indicated that TNF-α directly evoked mitochondrial ROS production and DNA damage and dysfunction [43]. Nitric oxide reacts with reactive oxygen species to form reactive nitrogen species, which generates peroxynitrite, a robust biological oxidant generally implicated in toxic effects on cells and tissues. Peroxynitrite represents a mediator of protein oxidation and nitration, lipid peroxidation, mitochondrial dysfunction, and cell death [44]. The increase in IL6 levels has been implicated in liver and kidney diseases [45,46].
Elevation of liver enzymes was associated with higher CRP concentrations [47]. Moreover, CLEE alleviated the decrease in hepatorenal ATP content, suggestive of its protective effect on mitochondria against the toxic impact of TAA that inhibited the mitochondrial respiratory chain [48]. The present study showed that CLEE could protect rats against TAA-induced liver fibrosis and kidney injury probably by (i) reduction of MDA, (ii) enhancement of GSH and CoQ10; and (iii) inhibition of the increase of inflammatory markers, IL2, CPR, TNF-α, NO that evoke oxidative stress.
Secondary metabolites are the main contributors to the biological potentialities of the plant extracts [49]. Polyphenolic compounds, including flavonoids and phenolic and organic acids, were documented as the most active compounds against free radicals and thus inflammation [49,50]. Current findings reveal that flavonoids were the main components of CLEE, encompassing flavones, flavonols, aurones, and flavanonequinones.
The annotated flavonoids exhibited potent free radical scavenging effects due to the polyhydroxylation in their aromatic systems comprising mobile hydrogens [49]. Structurally, the 3′,4′-O- and 5- hydroxylation of the B and A rings, along with the presence of 4-carbonyl moiety in the flavonoids, were the main mediators of increasing antioxidant and anti-inflammatory potentialities [4,49,51]. These structural moieties increased the protection against oxidative stress and damage via donating hydrogen and/or electrons to radicals [4]. Through this process, they are involved in (i) stabilization of the networks of cell membranes and (ii) inhibition of the inflammatory cytokines formation and expression such as TNF-α, Transforming Growth Factor beta (TGF-β), and interleukins [52,53]. The present chemical profiling revealed that luteolin derivatives such as methoxylated derivatives and/or glycosides, were the main identified components having anti-inflammatory and free radicals scavenging actions [4]. Luteolin and their methoxylated derivatives and/or glycosides were reported to have principal roles in the inhibition of liver and kidney injuries and inflammation via decreasing and/or inhibition of fatty liver development [54], liver cirrhosis [55] and hepatocellular carcinoma [56], in addition to renal apoptosis, epithelial injury [57], and elevation of fructose consumption on the kidney [58].
Phenolic acids are mainly derivatives of benzoic and cinnamic acids in which the phenolic ring methyl ester represents a pharmacophore with various possibilities of interaction with different cell membrane proteins [4]. Many phenolic and organic acids were assigned in CLEE, such as ferulic, caffeic, cinnamic, and quinic acids and their derivatives. Several reports described that these phenolic acids are active metabolites for liver and renal protection via (i) freezing of the free radicals, (ii) suppressing liver cholestasis via inhibition of the matrix of extracellular gene expression [59], (iii) activation of the AMP-activated protein kinase (AMPK) or mitogen-activated protein kinase (MAPK) via enhancement of lipid metabolism [60], (iv) decreasing inflammatory cytokines formation in the kidney [61], (v) enhancing oxidative kidney status, and vi) decreasing lipid peroxidation [5].

4. Materials and Methods

4.1. Chemicals and Reagents

All the organic solvents used for extraction and chromatographic experiments, as well as the chemical reagents, were of analytical grade. The thioacetamide with a purity of 98.5%, 1,1,3,3-tetraethoxypropane (malondialdehyde), and glutathione were obtained from Sigma-Aldrich (Saint Louis, MO USA).

4.2. Plant Material and Extract Preparation

The whole plant of C. laevigatus L. was collected from Kafr Elsheikh Governorate (31°35′34.19″ N; 31°05′18.00″ E, Kafr Elsheikh) Egypt in March 2020. Ahmed M. Abdel Gawad, Professor of Plant Ecology, Botany Department, Faculty of Science, Mansoura University, Egypt, carried out the plant collection and authentication. A plant voucher specimen (Man-20-X17CL-56) was deposited in the Faculty of Science herbarium, Mansoura University, Egypt.
Afterward, 600 g of the air-dried whole plant was extracted with 70% aqueous ethanol at room temperature for five days and then filtered. This extraction step was repeated three times. All the extract was collected and then evaporated under vacuum until complete dryness afforded a dark black gum (28.3 g). The extract was kept in the refrigerator at 4 °C until the start of the analysis.

4.3. High-Resolution Ultra-Performance Liquid Chromatography-Mass Spectrometry Analysis (UPLC-ESI–qTOF-MS)

The UPLC-MS analysis was carried out with the same documented protocol and conditions as El-Newary, et al. [62] and Farrag, Abdallah, Khattab, Elshamy, Gendy, Mohamed, Farag, Efferth and Hegazy [6].

4.4. Thioacetamide-Induced Hepatorenaltoxicity Experiments

4.4.1. Animals, Ethical Statement, and Acute Toxicological Studies

Adult male Wistar rats (150–160 g) were chosen from the animal house of the National Research Centre, Egypt. They were fed a standard pellet diet and water ad libitum and kept at adjusted temperature (22 ± 2 °C) with a 12 h light-dark cycle [63].
The overall study and animal handling were performed following the guidelines of the NRC ethics committee, National Institutes of Health, and Canadian Council on Animal Care [Acceptance No.: 19218]. The body weights of the rats were recorded weekly.
According to results of Elshamy, El-Shazly, Yassine, El-bana, Farrag, Nassar, Singab, Noji and Umeyama [7], CLEE was safe up to 5 g/kg b.w. without any mortality or toxic symptoms in rats.

4.4.2. Grouping and Experimental Design

Twenty-four rats were left for 14 days for acclimatization and then sorted equally into four groups. Group I (negative control group): All the rats in this group were administered orally with an equal volume of vehicles. Group II (positive control group): Rats were intraperitoneal (IP) administered with 100 mg/kg b.w. of TAA dissolved in distilled water [64]. Group III: Rats pre-treated with intragastric CLEE (50 mg/kg b.w.) dissolved in distilled water followed by treatment with TAA (IP). Group IV: Rats were pre-treated with intragastric CLEE (100 mg/kg b.w.) and treated with TAA (IP). The pre-treatment of used CLEE concentrations was performed half hour before the injection of TAA. The inductions of the rats by TAA were carried out three times weekly, while they were treated with CLEE daily throughout the experiment for 8 weeks.

4.4.3. Blood Samples Collection and Tissue Homogenates

At the end of the experimental period (8 weeks), the overall rats were euthanized using ethyl ether in a completely sealed container. The blood samples (3 mL each) were collected in heparinized tubes before euthanasia. The centrifugation for 15 min at 3000 rpm was carried out to isolate the plasma. The liver and kidney were rapidly removed and washed in ice-cooled saline. A weighted part of each tissue was homogenized with ice-cooled saline (0.9% NaCl) to prepare homogenate. The homogenate was centrifuged at 3000 rpm for 10 min at 5 °C using a cooling centrifuge [65]. The supernatant was used for various analyses. The remaining portion of the liver or kidney was fixed immediately in 10% neutral buffered formalin.

4.4.4. Liver and Kidney Function

The estimation of the liver and kidney functions, including the AST, ALT, ALP, GGT, total protein, creatinine, and uric acid levels, were performed using the kits produced by Salucea BV Medical Company (Haansberg, Netherlands).

4.4.5. Plasma Oxidative Stress and Inflammatory Markers

The MDA, GSH, SOD, and catalase were evaluated calorimetrically using the kits produced by Elabscience Biotechnology Inc. (Houston, Texas, USA). The levels of MDA, SOD, reduced GSH, and total protein were assessed and measured according to the described methods and techniques of Ohkawa, et al. [66], Beutler, et al. [67], Nishikimi, et al. [68] and Lowry, et al. [69], respectively. TNF-α, IL6, and CRP were assayed by enzyme-immunoassay using a kit manufactured in R&D Systems, McKinley Place NE, Minneapolis, USA.

4.4.6. Hepatic and Renal Oxidative Stress and Energy Parameters

The estimation of the MDA, 8OHdG, NO, GSH, ATP, ADP, AMP, and CoQ10 parameters were performed using the HPLC system of Agilent HP 1200 series (Santa Clara, CA, USA) that consisted of a quaternary pump, a column oven, Rheodine injector, 20 μL loop, and UV variable wavelength detector. The resulting chromatogram identified the sample concentration compared to the standard purchased from Sigma Aldrich (Missouri, MO, USA).

4.4.7. Histopathologic Investigation

The liver and kidneys were dissected directly after the rats’ sacrifice for histopathological investigations. Aliquots of the liver and kidney tissues were fixed in 10% formalin in phosphate-buffered normal saline for 7 days. Then they were washed for 2 h under running tap water and dehydrated gradually in ethanol, followed by embedding in the paraffin wax. After that, the sections were de-paraffinized using xylene and stained with hematoxylin and eosin (H&E, 4–5 µm thick) (Mc, 1946). A light microscope (Olympus CX41, San Marcos, TX, USA) and SC100-digital camera attached to the computer system were used for the examination.

4.5. Statistical Analysis

The variability of results was expressed as means ± standard error of means (n = 3, SE). Data were evaluated by one-way analysis of variance (ANOVA) followed by Tukey-Kramer multiple comparisons. The level of significance was accepted at p < 0.05. All the statistical assays were carried out using Graphpad Prism-8 (San Diego, CA, USA).

5. Conclusions

UPLC-ESI-QTOF–MS/MS analysis of CLEE derived from the whole plant resulted in the identification of 94 compounds belonging to various classes with relatively high concentrations of flavonoids and phenolic acid derivatives. Luteolin and tricin derivatives represented the main constituents in Cyperus laevigatus. CLEE exhibited antioxidant and anti-inflammatory effects against TAA-induced toxicity owing to the synergistic action of major phytochemicals detected in the former. A high dose of CLEE at 100 mg/kg b.w exhibited a higher protective effect against hepatorenal damage than did its lower dose at 50 mg/kg b.w. The possible mechanism of CLEE on the liver and kidney might implicate regulation of energy metabolism, oxidative stress, and inflammatory markers. The present findings reveal the protective effects of the main constituents of Cyperus laevigatus against hepatic and renal injuries. The results also suggest further and deeper biological evaluation to enrich the scientific background regarding using CLEE to manage various diseases. However, phytochemical studies should be evaluated to isolate and identify the significant compounds in CLEE, thus determining their precise mode of action and safety.

Author Contributions

Conceptualization, A.I.E., M.A.F., and A.R.H.F.; methodology, I.M.A., M.A.E.-B., M.M.E., S.A.E.B., F.A.A.I., O.A.H.A.-F., A.E.-N.G.E.G., S.M.A., A.R.H.F., M.A.F., and A.I.E.; investigation, I.M.A., M.A.E.-B., M.M.E., S.A.E.B., F.A.A.I., O.A.H.A.-F., A.R.H.F., M.A.F., T.E., and A.I.E.; visualization, A.R.H.F., M.A.F., and A.I.E.; writing—original draft preparation, I.M.A., M.A.E.-B., M.M.E., S.A.E.B., F.A.A.I., O.A.H.A.-F., A.R.H.F., M.A.F., and A.I.E.; writing—review and editing, I.M.A., M.A.E.-B., M.M.E., S.A.E.B., F.A.A.I., O.A.H.A.-F., A.R.H.F., M.A.F., S.M.A., T.E., and A.I.E.; funding acquisition, T.E. All authors have read and agreed to the published version of the manuscript.

Funding

The publication of this article was funded by the Open Access Fund of Leibniz Universität Hannover.

Institutional Review Board Statement

Not applicable.

Informed Consent Statement

Not applicable.

Data Availability Statement

Not applicable.

Conflicts of Interest

The authors declare no conflict of interest.

Sample Availability

Samples of the compounds are not available from the authors.

References

  1. Park, J.U.; Kang, J.H.; Rahman, M.A.A.; Hussain, A.; Cho, J.S.; Lee, Y.I. Gastroprotective effects of plants extracts on gastric mucosal injury in experimental sprague-dawley rats. Biomed. Res. Int. 2019, 2019, 8759708. [Google Scholar] [CrossRef] [PubMed] [Green Version]
  2. Asnaashari, S.; Dastmalchi, S.; Javadzadeh, Y. Gastroprotective effects of herbal medicines (roots). Int. J. Food Prop. 2018, 21, 902–920. [Google Scholar] [CrossRef] [Green Version]
  3. Elshamy, A.I.; Abdallah, H.M.I.; Farrag, A.R.H.; Riciputi, Y.; Pasini, F.; Taher, R.F.; Raslan, M.A.; Paré, P.W.; Hegazy, M.-E.F. Artichoke phenolics confer protection against acute kidney injury. Rev. Bras. Farmacogn. 2020, 30, 34–42. [Google Scholar] [CrossRef]
  4. Saha, P.; Talukdar, A.D.; Nath, R.; Sarker, S.D.; Nahar, L.; Sahu, J.; Choudhury, M.D. Role of natural phenolics in hepatoprotection: A mechanistic review and analysis of regulatory network of associated genes. Front. Pharmacol. 2019, 10, 509. [Google Scholar] [CrossRef]
  5. Elshamy, A.I.; Farrag, A.R.H.; Ayoub, I.M.; Mahdy, K.A.; Taher, R.F.; Gendy, A.E.-N.G.; Mohamed, T.A.; Al-Rejaie, S.S.; Ei-Amier, Y.A.; Abd-EIGawad, A.M. UPLC-qTOF-MS phytochemical profile and antiulcer potential of Cyperus conglomeratus Rottb. alcoholic extract. Molecules 2020, 25, 4234. [Google Scholar] [CrossRef] [PubMed]
  6. Farrag, A.R.H.; Abdallah, H.M.I.; Khattab, A.R.; Elshamy, A.I.; Gendy, A.; Mohamed, T.A.; Farag, M.A.; Efferth, T.; Hegazy, M.F. Antiulcer activity of Cyperus alternifolius in relation to its UPLC-MS metabolite fingerprint: A mechanistic study. Phytomedicine 2019, 62, 152970. [Google Scholar] [CrossRef] [PubMed]
  7. Elshamy, A.I.; El-Shazly, M.; Yassine, Y.M.; El-bana, M.A.; Farrag, A.R.H.; Nassar, M.; Singab, A.N.B.; Noji, M.; Umeyama, A. Phenolic constituents, anti-inflammatory and antidiabetic activities of Cyperus laevigatus L. Polym. J. 2017, 9, 828–833. [Google Scholar] [CrossRef] [Green Version]
  8. Kumar, S.S.; Mishra, S. Hepatoprotective activity of rhizomes of Cyperus rotundus Linn against carbon tetrachloride-induced hepatotoxicity. Indian J. Pharm. Sci. 2005, 67, 84–88. [Google Scholar]
  9. Thebtaranonth, C.; Thebtaranonth, Y.; Wanauppathamkul, S.; Yuthavong, Y. Antimalarial sesquiterpenes from tubers of Cyperus rotundus: Structure of 10,12-peroxycalamenene, a sesquiterpene endoperoxide. Phytochemistry 1995, 40, 125–128. [Google Scholar] [CrossRef]
  10. Raut, N.A.; Gaikwad, N.J. Antidiabetic activity of hydro-ethanolic extract of Cyperus rotundus in alloxan induced diabetes in rats. Fitoterapia 2006, 77, 585–588. [Google Scholar] [CrossRef]
  11. Abdel-Razik, A.F.; Nassar, M.I.; El-Khrisy, E.D.; Dawidar, A.A.; Mabry, T.J. New prenylflavans from Cyperus conglomeratus. Fitoterapia 2005, 76, 762–764. [Google Scholar] [CrossRef]
  12. Seabra, R.M.; Moreira, M.M.; Costa, M.A.C.; Paul, M.I. 6,3′,4′-Trihydroxy-4-methoxy-5-methylaurone from Cyperus capitatus. Phytochemistry 1995, 40, 1579–1580. [Google Scholar] [CrossRef]
  13. Xu, Y.; Zhang, H.W.; Yu, C.Y.; Lu, Y.; Chang, Y.; Zou, Z.M. Norcyperone, a novel skeleton norsesquiterpene from Cyperus rotundus L. Molecules 2008, 13, 2474–2481. [Google Scholar] [CrossRef] [PubMed]
  14. Gamal, M.A.; Hani, K.; Sameh, E.-S.; Sabrin, I.R.M. A review: Compounds isolated from Cyperus species (part I): Phenolics and nitrogenous. Internat. J. Pharmacog. Phytochem. Res. 2015, 7(1), 51–67. [Google Scholar]
  15. El Gendy, A.E.-N.G.; Abd El-Gawad, A.M.; Taher, R.F.; El-Khrisy, E.-D.A.; Omer, E.A.; Elshamy, A.I. Essential oils constituents of aerial parts of Cyperus capitatus L. and Cyperus difformis L. grown wild in Egypt. J. Essent. Oil Bear. Plants 2017, 20, 1659–1665. [Google Scholar] [CrossRef]
  16. Nassar, M.I.; Yassine, Y.M.; Elshamy, A.I.; El-Beih, A.A.; El-Shazly, M.; Singab, A.N.B. Essential oil and antimicrobial activity of aerial parts of Cyperus leavigatus L. (family: Cyperaceae). J. Essent. Oil Bear. Plants 2015, 18, 416–422. [Google Scholar] [CrossRef]
  17. Ichimura, R.; Mizukami, S.; Takahashi, M.; Taniai, E.; Kemmochi, S.; Mitsumori, K.; Shibutani, M. Disruption of Smad-dependent signaling for growth of GST-P-positive lesions from the early stage in a rat two-stage hepatocarcinogenesis model. Toxicol. Appl. Pharmacol. 2010, 246, 128–140. [Google Scholar] [CrossRef]
  18. Mladenović, D.; Hrnčić, D.; Rašić-Marković, A.; Stanojlović, O. Behavioral and electroencephalographic manifestations of thioacetamide-induced encephalopathy: Possible mechanisms of neurotoxic effects. Arch. Biol. Sci. 2012, 64, 829–841. [Google Scholar] [CrossRef]
  19. Ansil, P.N.; Nitha, A.; Prabha, S.P.; Wills, P.J.; Jazaira, V.; Latha, M.S. Protective effect of Amorphophallus campanulatus (Roxb.) Blume. tuber against thioacetamide induced oxidative stress in rats. Asian Pac. J. Trop. Med. 2011, 4, 870–877. [Google Scholar] [CrossRef] [Green Version]
  20. Elkady, W.M.; Ayoub, I.M.; Abdel-Mottaleb, Y.; Elshafie, M.F.; Wink, M. Euryops pectinatus L. Flower extract inhibits p-glycoprotein and reverses multi-drug resistance in cancer cells: A mechanistic study. Molecules 2020, 25, 647. [Google Scholar]
  21. Bhatt, S.; Sthapak, J.; Singh, K. New aurone from the leaves of Cyperus scariosus. Fitoterapia 1984, 55, 370–371. [Google Scholar]
  22. El-Habashy, I.; Mansour, R.M.A.; Zahran, M.A.; El-Hadidi, M.N.; Saleh, N.A.M. Leaf flavonoids of Cyperus species in Egypt. Biochem. Syst. Ecol. 1989, 17, 191–195. [Google Scholar] [CrossRef]
  23. Seabra, R.M.; Silva, A.M.S.; Andrade, P.B.; Manuela Moreira, M. Methylaurones from Cyperus capitatus. Phytochemistry 1998, 48, 1429–1432. [Google Scholar] [CrossRef]
  24. Harborne, J.B.; Williams, C.A.; Wilson, K.L. Flavonoids in leaves and inflorescences of australian cyperaceae. Phytochemistry 1985, 24, 751–766. [Google Scholar] [CrossRef]
  25. Harborne, J.B.; Williams, C.A.; Wilson, K.L. Flavonoids in leaves and inflorescences of australian Cyperus species. Phytochemistry 1982, 21, 2491–2507. [Google Scholar] [CrossRef]
  26. Farag, M.A.; Kabbash, E.M.; Mediani, A.; Döll, S.; Esatbeyoglu, T.; Afifi, S.M. Comparative metabolite fingerprinting of four different cinnamon species analyzed via UPLC-MS and GC-MS and chemometric tools. Molecules 2022, 27, 2935. [Google Scholar] [CrossRef]
  27. Babiaka, S.B.; Moumbock, A.F.A.; Günther, S.; Ntie-Kang, F. Natural products in Cyperus rotundus L. (Cyperaceae): An update of the chemistry and pharmacological activities. RSC Adv. 2021, 11, 15060–15077. [Google Scholar] [CrossRef]
  28. Ayoub, I.M.; Kořínek, M.; El-Shazly, M.; Wetterauer, B.; El-Beshbishy, H.A.; Hwang, T.-L.; Chen, B.-H.; Chang, F.R.; Wink, M.; Singab, A.N.B.; et al. Anti-allergic, anti-inflammatory, and anti-hyperglycemic activity of Chasmanthe aethiopica leaf extract and its profiling using LC/MS and GLC/MS. Plants 2021, 10, 1118. [Google Scholar] [CrossRef]
  29. Wojakowska, A.; Perkowski, J.; Góral, T.; Stobiecki, M. Structural characterization of flavonoid glycosides from leaves of wheat (Triticum aestivum L.) using LC/MS/MS profiling of the target compounds. J. Mass Spectrom. 2013, 48, 329–339. [Google Scholar] [CrossRef]
  30. Harborne, J.B.; Marby, H.; Marby, T. The Flavonoids; Springer: Berlin/Heidelberg, Germany, 2013. [Google Scholar]
  31. Yogalakshmi, B.; Viswanathan, P.; Anuradha, C.V. Investigation of antioxidant, anti-inflammatory and DNA-protective properties of eugenol in thioacetamide-induced liver injury in rats. Toxicology 2010, 268, 204–212. [Google Scholar] [CrossRef]
  32. Kumar, S.; Pandey, A.K. Chemistry and biological activities of flavonoids: An overview. Sci. World J. 2013, 2013, 162750. [Google Scholar] [CrossRef] [PubMed] [Green Version]
  33. Poli, G. Pathogenesis of liver fibrosis: Role of oxidative stress. Mol. Asp. Med. 2000, 21, 49–98. [Google Scholar] [CrossRef]
  34. Reeves, H.L.; Friedman, S.L. Activation of hepatic stellate cells—A key issue in liver fibrosis. Front. Biosci. J. Virtual Libr. 2002, 7, d808–d826. [Google Scholar] [CrossRef] [PubMed]
  35. Esterbauer, H.; Schaur, R.J.; Zollner, H. Chemistry and biochemistry of 4-hydroxynonenal, malonaldehyde and related aldehydes. Free. Radic. Biol. Med. 1991, 11, 81–128. [Google Scholar] [CrossRef]
  36. Jovanovic, J.M.; Nikolić, R.S.; Kocic, G.; Krstic, N.; Krsmanovic, M.M. Glutathione protects liver and kidney tissue from cadmium- and lead-provoked lipid peroxidation. J. Serb. Chem. Soc. 2013, 78, 197–207. [Google Scholar] [CrossRef]
  37. Samimi, F.; Baazm, M.; Eftekhar, E.; Rajabi, S.; Goodarzi, M.T.; Jalali Mashayekhi, F. Possible antioxidant mechanism of coenzyme Q10 in diabetes: Impact on Sirt1/Nrf2 signaling pathways. Res. Pharm. Sci. 2019, 14, 524–533. [Google Scholar]
  38. Nandi, A.; Yan, L.J.; Jana, C.K.; Das, N. Role of catalase in oxidative stress- and age-associated degenerative diseases. Oxidative Med. Cell. Longev. 2019, 2019, 9613090. [Google Scholar] [CrossRef] [Green Version]
  39. Jain, N.K.; Singhai, A.K. Protective effects of Phyllanthus acidus (L.) Skeels leaf extracts on acetaminophen and thioacetamide induced hepatic injuries in Wistar rats. Asian Pac. J. Trop. Med. 2011, 4, 470–474. [Google Scholar] [CrossRef] [Green Version]
  40. Abd Elhameed, M.F.; Salama, A.A.A.; Attia, T.M.; Elbatran, S.A.; Ismaeil, I.E.K.; Hassan, A. Protective effects of Moringa oleifera extract on isoniazid and rifampicin induced hepatotoxicity in rats: Involvment of adiponectin and tumor necrosis factor-α. Egypt. J. Vet. Sci. 2018, 49, 25–34. [Google Scholar] [CrossRef] [Green Version]
  41. Spinella, R.; Sawhney, R.; Jalan, R. Albumin in chronic liver disease: Structure, functions and therapeutic implications. Hepatol. Int. 2016, 10, 124–132. [Google Scholar] [CrossRef]
  42. Guo, C.; Liang, F.; Shah Masood, W.; Yan, X. Hydrogen sulfide protected gastric epithelial cell from ischemia/reperfusion injury by Keap1 s-sulfhydration, MAPK dependent anti-apoptosis and NF-κB dependent anti-inflammation pathway. Eur. J. Pharmacol. 2014, 725, 70–78. [Google Scholar] [CrossRef] [PubMed]
  43. Suematsu, N.; Tsutsui, H.; Wen, J.; Kang, D.; Ikeuchi, M.; Ide, T.; Hayashidani, S.; Shiomi, T.; Kubota, T.; Hamasaki, N.; et al. Oxidative stress mediates tumor necrosis factor-α-induced mitochondrial DNA damage and dysfunction in cardiac myocytes. Circulation 2003, 107, 1418–1423. [Google Scholar] [CrossRef] [PubMed] [Green Version]
  44. Radi, R. Oxygen radicals, nitric oxide, and peroxynitrite: Redox pathways in molecular medicine. Proc. Natl. Acad. Sci. USA 2018, 115, 5839–5848. [Google Scholar] [CrossRef] [PubMed] [Green Version]
  45. Porowski, D.; Wirkowska, A.; Hryniewiecka, E.; Wyzgał, J.; Pacholczyk, M.; Pączek, L. Liver failure impairs the intrahepatic elimination of interleukin-6, tumor necrosis factor-alpha, hepatocyte growth factor, and transforming growth factor-beta. BioMed Res. Int. 2015, 2015, 934065. [Google Scholar] [CrossRef] [PubMed] [Green Version]
  46. Su, H.; Lei, C.-T.; Zhang, C. Interleukin-6 signaling pathway and its role in kidney disease: An update. Front. Immunol. 2017, 8, 405. [Google Scholar] [CrossRef] [Green Version]
  47. Kerner, A.; Avizohar, O.; Sella, R.; Bartha, P.; Zinder, O.; Markiewicz, W.; Levy, Y.; Brook, G.J.; Aronson, D. Association between elevated liver enzymes and c-reactive protein. Arterioscler. Thromb. Vasc. Biol. 2005, 25, 193–197. [Google Scholar] [CrossRef] [Green Version]
  48. Chadipiralla, K.; Reddanna, P.; Chinta, R.M.; Reddy, P.V.B. Thioacetamide-induced fulminant hepatic failure induces cerebral mitochondrial dysfunction by altering the electron transport chain complexes. Neurochem. Res. 2012, 37, 59–68. [Google Scholar] [CrossRef]
  49. Shehab, N.G.; Abu-Gharbieh, E.; Bayoumi, F.A. Impact of phenolic composition on hepatoprotective and antioxidant effects of four desert medicinal plants. BMC Complement. Altern. Med. 2015, 15, 401. [Google Scholar] [CrossRef] [Green Version]
  50. Abdel Shakour, Z.T.; El-Akad, R.H.; Elshamy, A.I.; El Gendy, A.E.-N.G.; Wessjohann, L.A.; Farag, M.A. Dissection of Moringa oleifera leaf metabolome in context of its different extracts, origin and in relationship to its biological effects as analysed using molecular networking and chemometrics. Food Chem. 2023, 399, 133948. [Google Scholar] [CrossRef]
  51. Sekher Pannala, A.; Chan, T.S.; O’Brien, P.J.; Rice-Evans, C.A. Flavonoid B-ring chemistry and antioxidant activity: Fast reaction kinetics. Biochem. Biophys. Res. Commun. 2001, 282, 1161–1168. [Google Scholar] [CrossRef]
  52. Zhen, J.; Villani, T.S.; Guo, Y.; Qi, Y.; Chin, K.L.; Pan, M.-h.; Ho, C.-T.; Simon, J.E.; Wu, Q. Phytochemistry, antioxidant capacity, total phenolic content and anti-inflammatory activity of Hibiscus sabdariffa leaves. Food Chem. 2016, 190, 673–680. [Google Scholar] [CrossRef] [PubMed]
  53. Parhiz, H.; Roohbakhsh, A.; Soltani, F.; Rezaee, R.; Iranshahi, M. Antioxidant and anti-inflammatory properties of the Citrus flavonoids hesperidin and hesperetin: An updated review of their molecular mechanisms and experimental models. Phytother. Res. 2015, 29, 323–331. [Google Scholar] [CrossRef] [PubMed]
  54. Seydi, E.; Salimi, A.; Rasekh, H.R.; Mohsenifar, Z.; Pourahmad, J. Selective cytotoxicity of luteolin and kaempferol on cancerous hepatocytes obtained from rat model of hepatocellular carcinoma: Involvement of ros-mediated mitochondrial targeting. Nutr. Cancer 2018, 70, 594–604. [Google Scholar] [CrossRef]
  55. Seki, N.; Toh, U.; Kawaguchi, K.; Ninomiya, M.; Koketsu, M.; Watanabe, K.; Aoki, M.; Fujii, T.; Nakamura, A.; Akagi, Y.; et al. Tricin inhibits proliferation of human hepatic stellate cells in vitro by blocking tyrosine phosphorylation of PDGF receptor and its signaling pathways. J. Cell. Biochem. 2012, 113, 2346–2355. [Google Scholar] [CrossRef] [PubMed]
  56. Malvicini, M.; Gutiérrez-Moraga, A.; Rodríguez, M.M.; Gomez-Bustillo, S.; Salazar, L.; Sunkel, C.; Nozal, L.; Salgado, A.; Hidalgo, M.; López-Casas, P.P.; et al. A tricin derivative from Deschampsia antarctica Desv. Inhibits colorectal carcinoma growth and liver metastasis through the induction of a specific immune response. Mol. Cancer Ther. 2018, 17, 966–976. [Google Scholar] [CrossRef] [PubMed] [Green Version]
  57. Zeng, X.; Xi, Y.; Jiang, W. Protective roles of flavonoids and flavonoid-rich plant extracts against urolithiasis: A review. Crit. Rev. Food Sci. Nutr. 2018, 59, 2125–2135. [Google Scholar] [CrossRef]
  58. Vargas, F.; Romecín, P.A.; García-Guillén, A.I.; Wangesteen, R.; Vargas-Tendero, P.; Paredes, M.D.; Atucha, N.M.; García-Estañ, J. Flavonoids in kidney health and disease. Front. Physiol. 2018, 9, 394. [Google Scholar] [CrossRef] [Green Version]
  59. Gerin, F.; Erman, H.; Erboğa, M.; Sener, U.; Yilmaz, A.; Seyhan, H.; Gurel, A. The effects of ferulic acid against oxidative stress and inflammation in formaldehyde-induced hepatotoxicity. Inflammation 2016, 39, 1377–1386. [Google Scholar] [CrossRef]
  60. Cheng, Q.-L.; Li, Y.-W.; Yang, C.-F.; Zhong, Y.; He, H.; Zhu, F.-C.; Li, L. Methyl ferulic acid attenuates ethanol-induced hepatic steatosis by regulating AMPK and FoxO1 pathways in rats and L-02 cells. Chem.-Biol. Interact. 2018, 291, 180–189. [Google Scholar] [CrossRef]
  61. Lin, C.-Y.; Yin, M.-C. Renal protective effects of extracts from guava fruit (Psidium guajava L.) in diabetic mice. Plant Foods Hum. Nutr. 2012, 67, 303–308. [Google Scholar] [CrossRef]
  62. El-Newary, S.A.; Afifi, S.M.; Aly, M.S.; Ahmed, R.F.; El Gendy, A.E.-N.G.; Abd-ElGawad, A.M.; Farag, M.A.; Elgamal, A.M.; Elshamy, A.I. Chemical profile of Launaea nudicaulis ethanolic extract and its antidiabetic effect in streptozotocin-induced rats. Molecules 2021, 26, 1000. [Google Scholar] [CrossRef] [PubMed]
  63. Afifi, S.M.; Ammar, N.M.; Kamel, R.; Esatbeyoglu, T.; Hassan, H.A. β-Sitosterol glucoside-loaded nanosystem ameliorates insulin resistance and oxidative stress in streptozotocin-induced diabetic rats. Antioxidants 2022, 11, 1023. [Google Scholar] [CrossRef] [PubMed]
  64. Bahcecioglu, I.H.; Ispiroglu, M.; Tuzcu, M.; Orhan, C.; Ulas, M.; Demirel, U.; Yalniz, M.; Özercan, I.H.; Ilhan, N.; Sahin, K. Pistacia terebinthus coffee protects against thioacetamide-induced liver injury in rats. Acta Med. 2015, 58, 56–61. [Google Scholar]
  65. Hammam, A.M.M.; Elmotayam, A.K.; Elnattat, W.M.; Ali, G.A.; Madbouly, A.E.M.; El Khatteb, R.M.; Abd Elhamied, M.F.; Ali, A.H.; Qasim, S.; Ahmed, S.R. Assessment of Ferula hermonis Boiss fertility effects in immature female rats supported by quantification of ferutinin via HPLC and molecular docking. J. Ethnopharmacol. 2022, 289, 115062. [Google Scholar] [CrossRef] [PubMed]
  66. Ohkawa, H.; Ohishi, N.; Yagi, K. Assay for lipid peroxides in animal tissues by thiobarbituric acid reaction. Anal. Biochem. 1979, 95, 351–358. [Google Scholar] [CrossRef]
  67. Beutler, E.; Duron, O.; Kelly, B.M. Improved method for the determination of blood glutathione. J. Lab. Clin. Med. 1963, 61, 882–888. [Google Scholar] [PubMed]
  68. Nishikimi, M.; Appaji, N.; Yagi, K. The occurrence of superoxide anion in the reaction of reduced phenazine methosulfate and molecular oxygen. Biochem. Biophys. Res. Commun. 1972, 46, 849–854. [Google Scholar] [CrossRef]
  69. Lowry, O.H.; Rosebrough, N.J.; Farr, A.L.; Randall, R.J. Protein measurement with the Folin phenol reagent. J. Biol. Chem. 1951, 193, 265–275. [Google Scholar] [CrossRef]
Figure 1. UPLC-QTOF–MS base peak chromatogram of CLEE in negative ion mode. Peaks are numbered following that listed in Table 1.
Molecules 27 06470 g001
Figure 2. Representative structures of major metabolites identified in CLEE and peak names follow the numbers stated in Table 1.
Molecules 27 06470 g002
Figure 3. Effect of CLEE on liver function parameters of rats intoxicated by TAA. Each value represents the mean of six animals ± SE. Statistical analysis was performed using one-way ANOVA followed by the Tukey-Kramer multiple comparisons test. (* vs. control group, @ vs. TAA group and # vs. TAA + 50 mg /kg b.w. CLEE group) at p < 0.05.
Molecules 27 06470 g003
Figure 4. Effect of CLEE on kidney function parameters of rats intoxicated by TAA. Each value represents the mean of six animals ± SE. Statistical analysis was performed using one-way ANOVA followed by the Tukey-Kramer multiple comparisons test. (* vs. control group, @ vs. TAA group) at p < 0.05.
Molecules 27 06470 g004
Figure 5. Effect of C. laevigatus EtOH extract (CLEE) on plasma oxidative stress and inflammatory parameters of rats intoxicated by TAA. Each value represents the mean of six animals ± SE. Statistical analysis was performed using one-way ANOVA followed by the Tukey-Kramer multiple comparisons test. (* vs. control group, @ vs. TAA group and # vs. TAA + 50 mg /kg b.w. CLEE group) at p < 0.05.
Molecules 27 06470 g005
Figure 6. Effect of C. laevigatus EtOH extract (CLEE) on hepatic oxidative stress and energy parameters of rats intoxicated by TAA. Each value represents the mean of six animals ± SE. Statistical analysis was performed using one-way ANOVA followed by the Tukey-Kramer multiple comparisons test. (* vs. control group, and @ vs. TAA group) at p < 0.05.
Molecules 27 06470 g006
Figure 7. Effect of C. laevigatus EtOH extract (CLEE) on renal oxidative stress and energy parameters of rats intoxicated by TAA. Each value represents the mean of six animals ± SE. Statistical analysis was performed using one-way ANOVA followed by the Tukey-Kramer multiple comparisons test. (* vs. control group, and @ vs. TAA group) at p < 0.05.
Molecules 27 06470 g007
Figure 8. A photomicrograph of (A) rat liver of control group showing normal hepatic architecture. Central vein (CV), blood sinusoids (S) and nucleus (N) are found; (B) rat liver intoxicated by TAA showing disorganized hepatocytes, fibrosis with inflammatory cell proliferation in between the congested portal vein, aggregation of inflammatory cells (arrow), bridging of fibroblast-like cells, degeneration changes with cytoplasmic necrotic areas, and deeply pyknotic nuclei, (H & E stain, Scale bar: 60 µm); (C) liver from rats administered TAA and 50 mg/kg b.w. of CLEE showing mild to moderate fibrosis with thin bridging fibroblasts, inflammatory cell infiltration around central vein (arrow), degeneration, mild necrosis (arrowhead), dilated sinusoids (S), and pyknotic nuclei (P); and (D): liver from rats administered TAA with 100 mg /kg b.w. of CLEE showing few degenerative hepatocytes with less fibrosis and thin bridging fibroblasts, dilated sinusoids (S), and pyknotic nuclei; (E) kidney section of control group showing normal structure of the glomerulus (G), urinary space (US), Proximal convoluted tubule (PCT) and distal convoluted tubule (DCT); (F) kidney section of rats intoxicated by TAA, showing shrunken glomeruli (G) with dilated capsular spaces (US), tubular epithelial cell degeneration, and necrosis associated with pyknotic nuclei (P); (G) kidney section of rats administered TAA and 50 mg/kg b.w. of CLEE showing moderated degeneration (arrow head), pyknotic nuclei (P) observed in tubules epithelial cells; (H) kidney section of rats administered TAA and 100 mg/kg b.w. of CLEE showing improved degeneration of tubules (arrow head) and pyknotic nuclei (P). (H & E stain, Scale bar: 30 µm).
Molecules 27 06470 g008
Table 2. Effect of C. laevigatus ethanol extract (CLEE) on body weight of rats administered with TAA.
WeeksInitial1st 2nd 3rd 4th 5th 6th
Groups
Control145.33 ± 2.512182.33 ± 4.958220.67 ± 5.226252.33 ± 3.621273.67 ± 5.038287.83 ± 3.728275.5 ± 7.535
TAA151.67 ± 3.073173.17 ± 4.483 *178.33 ± 4.295 *203 ± 6.088 *195.83 ± 4.915 *209.83 ± 3.42 *201.67 ± 4.072 *
TAA + CLEE
(50 mg/kg)
157 ± 2.251195.83 ± 3.516211.83 ± 11.923223.67 ± 9.821 *221.17 ± 10.199 *227.17 ± 14.885 *240 ± 10.724 *
TAA + CLEE
(100 mg/kg)
150.83 ± 3.745187 ± 11.204195.83 ± 11.677207.33 ± 11.67213.33 ± 11.029 *224.17 ± 9.411 *224.83 ± 5.036 *@
Each value represents the mean of six animals ± SE. Statistical analysis was performed using one-way ANOVA followed by the Tukey-Kramer multiple comparisons test. (* vs. control group, and @ vs. TAA group) at p < 0.05.
Publisher’s Note: MDPI stays neutral with regard to jurisdictional claims in published maps and institutional affiliations.

