
Effect of Plant Bioactive Compounds Supplemented in Transition Dairy Cows on the Metabolic and Inflammatory Status

 , ,
, ,
Abstract
1. Introduction
2. Results
2.1. Milk Yield and Milk Composition
2.2. Body Condition Score
2.3. Energy Metabolism
2.4. Inflammation Markers and Antioxidant Capacity
2.5. Cell Immunity
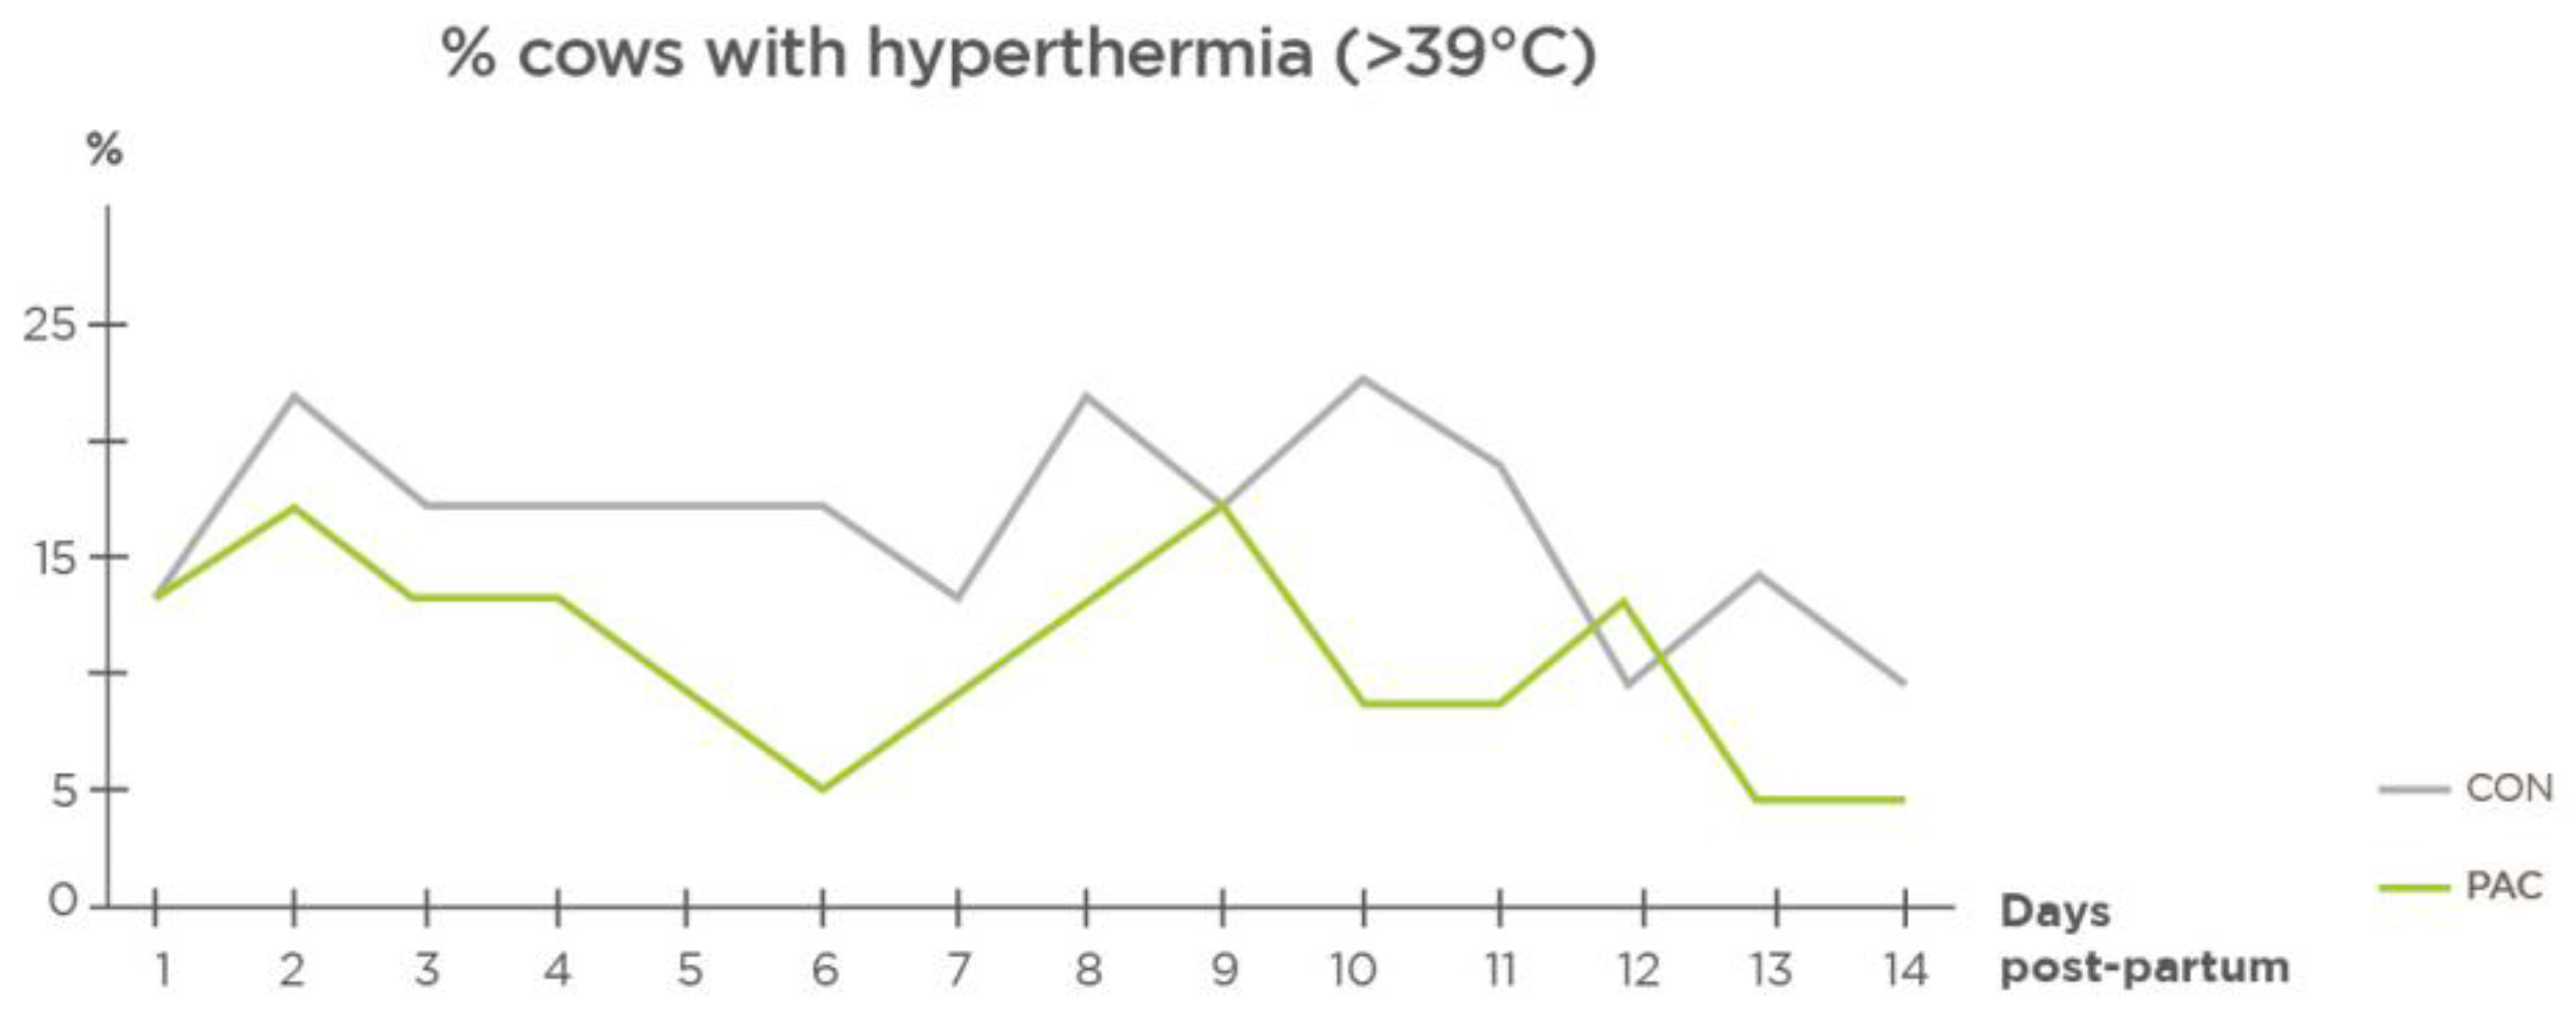
2.6. Health
3. Discussion
4. Materials and Methods
4.1. Animals, Treatments and Diets
4.2. Supplement Composition
4.3. Measurements and Sample Collection
4.4. Laboratory Analyses
- D-7 pre-calving: NEFAs, BHB, glucose, cholesterol, total protein, albumin, urea and calcium;
- D0 calving day: NEFAs, BHB, glucose, cholesterol, total protein (TP), albumin, urea, TAC, GSH-Px, calcium, haptoglobin and SAA; hematology;
- D7 post-calving: NEFAs, BHB, glucose, cholesterol, TP, albumin, urea, TAC, GSH-Px, calcium, haptoglobin and serum amyloid A; hematology;
- D14 post-calving: NEFAs, BHB, glucose, cholesterol, TP, albumin, urea, TAC, GSH-Px, calcium, haptoglobin and serum amyloid A; hematology.
4.5. Clinical Parameters
4.6. Statistical Analyses
5. Conclusions
Author Contributions
Funding
Institutional Review Board Statement
Informed Consent Statement
Data Availability Statement
Acknowledgments
Conflicts of Interest
Sample Availability
References
- Mikulková, K.; Illek, J.; Kadek, R. Glutathione redox state, glutathione peroxidase activity and selenium concentration in periparturient dairy cows, and their relation with negative energy balance. J. Anim. Feed Sci. 2020, 29, 19–26. [Google Scholar] [CrossRef]
- Trevisi, E.; Amadori, M.; Cogrossi, S.; Razzuoli, E.; Bertoni, G. Metabolic Stress and Inflammatory Response in High-Yielding, Periparturient Dairy Cows. Res. Vet. Sci. 2012, 93, 695–704. [Google Scholar] [CrossRef] [PubMed]
- LeBlanc, S. Interactions of Metabolism, Inflammation, and Reproductive Tract Health in the Postpartum Period in Dairy Cattle: Reproductive Tract Inflammation in Cattle. Reprod. Domest. Anim. 2012, 47, 18–30. [Google Scholar] [CrossRef] [PubMed]
- Chebel, R.C.; Mendonça, L.G.D.; Baruselli, P.S. Association between Body Condition Score Change during the Dry Period and Postpartum Health and Performance. J. Dairy Sci. 2018, 101, 4595–4614. [Google Scholar] [CrossRef]
- Sordillo, L.M.; Raphael, W. Significance of Metabolic Stress, Lipid Mobilization, and Inflammation on Transition Cow Disorders. Vet. Clin. N. Am. Food Anim. 2013, 29, 267–278. [Google Scholar] [CrossRef]
- Huzzey, J.M.; Mann, S.; Nydam, D.V.; Grant, R.J.; Overton, T.R. Associations of Peripartum Markers of Stress and Inflammation with Milk Yield and Reproductive Performance in Holstein Dairy Cows. Prev. Vet. Med. 2015, 120, 291–297. [Google Scholar] [CrossRef]
- Lopreiato, V.; Mezzetti, M.; Cattaneo, L.; Ferronato, G.; Minuti, A.; Trevisi, E. Role of Nutraceuticals during the Transition Period of Dairy Cows: A Review. J. Anim. Sci. Biotechnol. 2020, 11, 96. [Google Scholar] [CrossRef]
- Oh, J.; Wall, E.H.; Bravo, D.M.; Hristov, A.N. Host-Mediated Effects of Phytonutrients in Ruminants: A Review. J. Dairy Sci. 2017, 100, 5974–5983. [Google Scholar] [CrossRef]
- Jaiswal, L.; Ismail, H.; Worku, M.A. Review of the Effect of Plant-derived Bioactive Substances on the Inflammatory Response of Ruminants (Sheep, Cattle, and Goats). Int. J. Vet. Anim. Med. 2020, 3, 130. [Google Scholar]
- Hashemzadeh-Cigari, F.; Khorvash, M.; Ghorbani, G.R.; Kadivar, M.; Riasi, A.; Zebeli, Q. Effects of Supplementation with a Phytobiotics-Rich Herbal Mixture on Performance, Udder Health, and Metabolic Status of Holstein Cows with Various Levels of Milk Somatic Cell Counts. J. Dairy Sci. 2014, 97, 7487–7497. [Google Scholar] [CrossRef]
- Farney, J.K.; Mamedova, L.K.; Coetzee, J.F.; Minton, J.E.; Hollis, L.C.; Bradford, B.J. Sodium Salicylate Treatment in Early Lactation Increases Whole-Lactation Milk and Milk Fat Yield in Mature Dairy Cows. J. Dairy Sci. 2013, 96, 7709–7718. [Google Scholar] [CrossRef] [PubMed]
- Carpenter, A.J.; Ylioja, C.M.; Vargas, C.F.; Mamedova, L.K.; Mendonça, L.G.; Coetzee, J.F.; Hollis, L.C.; Gehring, R.; Bradford, B.J. Hot Topic: Early Postpartum Treatment of Commercial Dairy Cows with Nonsteroidal Antiinflammatory Drugs Increases Whole-Lactation Milk Yield. J. Dairy Sci. 2016, 99, 672–679. [Google Scholar] [CrossRef] [PubMed]
- Wathes, D.C.; Cheng, Z.; Bourne, N.; Taylor, V.J.; Coffey, M.P.; Brotherstone, S. Differences between Primiparous and Multiparous Dairy Cows in the Inter-Relationships between Metabolic Traits, Milk Yield and Body Condition Score in the Periparturient Period. Domest. Anim. Endocrinol. 2007, 33, 203–225. [Google Scholar] [CrossRef] [PubMed]
- Zhang, Y.; Li, X.; Zhang, H.; Zhao, Z.; Peng, Z.; Wang, Z.; Liu, G.; Li, X. Non-Esterified Fatty Acids Over-Activate the TLR2/4-NF-Κb Signaling Pathway to Increase Inflammatory Cytokine Synthesis in Neutrophils from Ketotic Cows. Cell. Physiol. Biochem. 2018, 48, 827–837. [Google Scholar] [CrossRef] [PubMed]
- Drackley, J.K. Use of NEFA as a Tool to Monitor Energy Balance in Transition Dairy Cows. Available online: http://livestocktrail.illinois.edu/dairynet/paperDisplay.cfm?ContentID=330 (accessed on 16 August 2022).
- Schulz, K.; Frahm, J.; Kersten, S.; Meyer, U.; Reiche, D.; Sauerwein, H.; Dänicke, S. Effects of Elevated Parameters of Subclinical Ketosis on the Immune System of Dairy Cows: In Vivo and In Vitro Results. Arch. Anim. Nutr. 2015, 69, 113–127. [Google Scholar] [CrossRef]
- Kováč, G.; Tóthová, C.; Nagy, O.; Seidel, H.; Konvičná, J. Acute Phase Proteins and their Relation to Energy Metabolites in Dairy Cows during the Pre- and Postpartal Period. Acta Vet. Brno 2009, 78, 441–447. [Google Scholar] [CrossRef]
- Winkler, A.; Weber, F.; Ringseis, R.; Eder, K.; Dusel, G. Determination of polyphenol and crude nutrient content and nutrient digestibility of dried and ensiled white and red grape pomace cultivars. Arch. Anim. Nutr. 2015, 69, 187–200. [Google Scholar] [CrossRef]
- Kaneene, J.B.; Miller, R.; Herdt, T.H.; Gardiner, J.C. The Association of Serum Nonesterified Fatty Acids and Cholesterol, Management and Feeding Practices with Peripartum Disease in Dairy Cows. Prev. Vet. Med. 1997, 31, 59–72. [Google Scholar] [CrossRef]
- Mikulková, K.; Kadek, R.; Filípek, J.; Illek, J. Evaluation of oxidant/antioxidant status, metabolic profile and milk production in cows with metritis. Ir. Vet. J. 2020, 73, 8. [Google Scholar] [CrossRef]
- SYNLAB. Biologie Clinique des Ruminants Guide d’interprétation; Synlab Heppignies: Fleurus, Belgium, 2017; p. 36. [Google Scholar]
- Smith, B.I.; Risco, C.A. Management of Periparturient Disorders in Dairy Cattle. Vet. Clin. N. Am. Food Anim. 2005, 21, 503–521. [Google Scholar] [CrossRef] [PubMed]
- Wenz, J.R.; Moore, D.A.; Kasimanickam, R. Factors Associated with the Rectal Temperature of Holstein Dairy Cows during the First 10 Days in Milk. J. Dairy Sci. 2011, 94, 1864–1872. [Google Scholar] [CrossRef] [PubMed]
- Benzaquen, M.E.; Risco, C.A.; Archbald, L.F.; Melendez, P.; Thatcher, M.-J.; Thatcher, W.W. Rectal Temperature, Calving-Related Factors, and the Incidence of Puerperal Metritis in Postpartum Dairy Cows. J. Dairy Sci. 2007, 90, 2804–2814. [Google Scholar] [CrossRef]
- Humblet, M.-F.; Guyot, H.; Boudry, B.; Mbayahi, F.; Hanzen, C.; Rollin, F.; Godeau, J.-M. Relationship between Haptoglobin, Serum Amyloid A, and Clinical Status in a Survey of Dairy Herds during a 6-Month Period. Vet. Clin. Pathol. 2006, 35, 188–193. [Google Scholar] [CrossRef] [PubMed]
- Williams, E.J.; Fischer, D.P.; Noakes, D.E.; England, G.C.W.; Rycroft, A.; Dobson, H.; Sheldon, I.M. The Relationship between Uterine Pathogen Growth Density and Ovarian Function in the Postpartum Dairy Cow. Theriogenology 2007, 68, 549–559. [Google Scholar] [CrossRef] [PubMed]
- Huzzey, J.M.; Duffield, T.F.; LeBlanc, S.J.; Veira, D.M.; Weary, D.M.; von Keyserlingk, M.A.G. Short Communication: Haptoglobin as an Early Indicator of Metritis. J. Dairy Sci. 2009, 92, 621–625. [Google Scholar] [CrossRef]
- Kim, I.-H.; Na, K.-J.; Yang, M.-P. Immune Responses during the Peripartum Period in Dairy Cows with Postpartum Endometritis. J. Reprod. Dev. 2005, 51, 757–764. [Google Scholar] [CrossRef][Green Version]
- Aguiar, S.C.; Zeoula, L.M.; Franco, S.L.; Peres, L.P.; Arcuri, P.B.; Forano, E. Antimicrobial Activity of Brazilian Propolis Extracts against Rumen Bacteria In Vitro. World J. Microbiol. Biotechnol. 2013, 29, 1951–1959. [Google Scholar] [CrossRef]
- Aguiar, S.C.; Cottica, S.M.; Boeing, J.S.; Samensari, R.B.; Santos, G.T.; Visentainer, J.V.; Zeoula, L.M. Effect of Feeding Phenolic Compounds from Propolis Extracts to Dairy Cows on Milk Production, Milk Fatty Acid Composition, and the Antioxidant Capacity of Milk. Anim. Feed Sci. Technol. 2014, 193, 148–154. [Google Scholar] [CrossRef]
- Hori, J.I.; Zamboni, D.S.; Carrão, D.B.; Goldman, G.H.; Berretta, A.A. The Inhibition of Inflammasome by Brazilian Propolis (EPP-AF). J. Evid. Based Complementary Altern. Med. 2013, 2013, 418508. [Google Scholar] [CrossRef]
- Kelly, P.; Meade, K.G.; O’Farrelly, C. Non-Canonical Inflammasome-Mediated IL-1β Production by Primary Endometrial Epithelial and Stromal Fibroblast Cells Is NLRP3 and Caspase-4 Dependent. Front. Immunol. 2019, 10, 102. [Google Scholar] [CrossRef] [PubMed]
- Machado, J.L.; Assunção, A.K.M.; da Silva, M.C.P.; Reis, A.S.d.; Costa, G.C.; Arruda, D.d.S.; Rocha, B.A.; Vaz, M.M.d.O.L.L.; Paes, A.M.d.A.; Guerra, R.N.M.; et al. Brazilian Green Propolis: Anti-Inflammatory Property by an Immunomodulatory Activity. J. Evid. Based Complementary Altern. Med. 2012, 2012, 157652. [Google Scholar] [CrossRef] [PubMed]
- Nishikawa, S.; Kamiya, M.; Aoyama, H.; Yoshimura, K.; Miyata, R.; Kumazawa, S.; Tsuda, T. Co-Administration of Curcumin and Artepillin C Induces Development of Brown-Like Adipocytes in Association with Local Norepinephrine Production by Alternatively Activated Macrophages in Mice. J. Nutr. Sci. Vitaminol. 2019, 65, 328–334. [Google Scholar] [CrossRef] [PubMed]
- Wang, J.; Ghosh, S.S.; Ghosh, S. Curcumin Improves Intestinal Barrier Function: Modulation of Intracellular Signaling, and Organization of Tight Junctions. Am. J. Physiol. Cell. Physiol. 2017, 312, C438–C445. [Google Scholar] [CrossRef]
- Masella, R.; Di Benedetto, R.; Varì, R.; Filesi, C.; Giovannini, C. Novel Mechanisms of Natural Antioxidant Compounds in Biological Systems: Involvement of Glutathione and Glutathione-Related Enzymes. J. Nutr. Biochem. 2005, 16, 577–586. [Google Scholar] [CrossRef] [PubMed]
- Gladine, C.; Rock, E.; Morand, C.; Bauchart, D.; Durand, D. Bioavailability and Antioxidant Capacity of Plant Extracts Rich in Polyphenols, given as a Single Acute Dose, in Sheep Made Highly Susceptible to Lipoperoxidation. BJN 2007, 98, 691–701. [Google Scholar] [CrossRef]
- Gobert, M.; Martin, B.; Ferlay, A.; Chilliard, Y.; Graulet, B.; Pradel, P.; Bauchart, D.; Durand, D. Plant Polyphenols Associated with Vitamin E Can Reduce Plasma Lipoperoxidation in Dairy Cows given N-3 Polyunsaturated Fatty Acids. J. Dairy Sci. 2009, 92, 6095–6104. [Google Scholar] [CrossRef]
- Sjaunja, O.; Bævre, L.; Junkkarinen, L.; Pedersen, J.; Setälä, J. A nordic proposal for an energy corrected milk (ECM) formula. In Performance Recording of Animals: State of the Art, 1st ed.; Gaillon, P., Chabert, Y., Eds.; PUDOC: Wageningen, The Netherlands, 1991; pp. 156–157. [Google Scholar]
- Edmonson, A.J.; Lean, I.J.; Weaver, L.D.; Farver, T.; Webster, G. A Body Condition Scoring Chart for Holstein Dairy Cows. J. Dairy Sci. 1989, 72, 68–78. [Google Scholar] [CrossRef]
- Illek, J.; Mikulková, K.; Danielová, L.; Kadek, R.; Geboliszová, K.; Staffa, A.; Gricová, J. Laboratory Diagnostics in Large Animals: Practical Classes, 1st ed.; University of Veterinary and Pharmaceutical Sciences Brno: Brno, Czech Republic, 2020; pp. 26–27. ISBN 978-80-7305-838-8. [Google Scholar]
- Paglia, D.E.; Valentine, W.N. Studies on the Quantitative and Qualitative Characterization of Erythrocyte Glutathione Peroxidase. J. Lab. Clin. Med. 1967, 70, 158–169. [Google Scholar]
- Zemjanis, R. Diagnostic and Therapeutic Techniques in Animal Reproduction, 2nd ed.; Williams and Wilson Co.: Baltimore, MD, USA, 1970; pp. 3–87. [Google Scholar]


| Treatment | ||||||||
|---|---|---|---|---|---|---|---|---|
| CON 1 (n = 23) | PAC 2 (n = 23) | p-Value | ||||||
| Item | Multiparous | Primiparous | Multiparous | Primiparous | SEM | Treatment | × Parity | Treatment × Parity |
| Milk yield (kg/d) | 41.8 | 35.47 | 40.33 | 34.53 | 6.57 | 0.345 | <0.0001 | <0.0001 |
| Fat (%) | 4.02 | 3.92 | 3.93 | 3.86 | 0.24 | 0.936 | 0.316 | 0.145 |
| Protein (%) | 3.19 | 3.36 | 3.29 | 3.23 | 0.44 | 0.577 | 0.291 | 0.665 |
| Lactose (%) | 5.01 | 5.13 | 5.01 | 5.13 | 0.17 | 0.884 | 0.001 | 0.010 |
| ECM 3 (kg/d) | 41.41 | 35.00 | 40.75 | 33.33 | 6.88 | 0.421 | <0.0001 | 0.000 |
| Somatic Cell Count | 367.33 | 247.17 | 88.53 | 93.90 | 248.62 | 0.157 | 0.697 | 0.470 |
| Body Condition Score (BCS) | BCS Evolution | |||||
|---|---|---|---|---|---|---|
| D-14 | D14 | D40 | p (Time) | p (Treatment × Time) | D14 minus D-14 | |
| CON 1 | 3.55 a | 2.97 b | 2.87 b | <0.01 | −0.58 | |
| PAC 2 | 3.49 a | 3.07 b | 2.89 b | <0.01 | −0.42 | |
| SEM | 0.13 | 0.19 | 0.18 | 0.21 | ||
| p (Treatment) | 0.327 | 0.256 | 0.739 | <0.01 | 0.073 | |
| Parameter | Day -7 | Day 0 | Day 7 | Day 14 | p (Time) | p (Treatment × Time) | |
|---|---|---|---|---|---|---|---|
| Total protein | CON 1 | 73.24 ab | 69.54 a | 73.44 ab | 77.80 b | 0.002 | |
| (g/L) | PAC 2 | 72.28 | 71.82 | 74.17 | 77.56 | 0.10 | |
| SEM | 5.76 | 5.96 | 5.45 | 6.40 | |||
| p (Treatment) | 0.500 | 0.370 | 0.670 | 0.890 | 0.004 | ||
| Albumin | CON | 36.33 | 35.39 | 35.81 | 37.00 | 0.30 | |
| (g/L) | PAC | 36.03 | 35.44 | 35.98 | 36.55 | 0.16 | |
| SEM | 1.85 | 2.07 | 2.07 | 2.04 | |||
| p (Treatment) | 0.930 | 0.950 | 0.410 | 0.590 | 0.23 | ||
| Globulins | CON | 36.91 ab | 34.15 a | 37.63 ab | 40.80 b | 0.04 | |
| (g/L) | PAC | 36.26 | 36.38 | 39.19 | 41.01 | 0.16 | |
| SEM | 6.21 | 5.89 | 6.34 | 7.16 | |||
| p (Treatment) | 0.772 | 0.379 | 0.501 | 0.930 | 0.06 | ||
| Albumin/globulin ratio | CON | 1.030 | 1.076 | 0.994 | 0.947 | 0.34 | |
| PAC | 1.036 | 1.028 | 0.927 | 0.929 | 0.19 | ||
| SEM | 0.199 | 0.196 | 0.184 | 0.187 | |||
| p (Treatment) | 0.770 | 0.370 | 0.310 | 0.950 | 0.27 | ||
| Glucose | p (Treatment) | 3.51 a | 3.43 ab | 3.17 b | 3.10 b | 0.05 | |
| (mM) | PAC | 3.69 b | 3.93 | 3.26 b | 3.20 b | <0.001 | |
| SEM | 0.21 | 0.53 | 0.42 | 0.34 | |||
| p (Treatment) | 0.020 | 0.1500 | 0.54 | 0.870 | 0.001 | ||
| Blood urea | CON | 4.79 c | 4.49 bc | 3.69 a | 3.81 ab | 0.001 | |
| (mM) | PAC | 4.71 b | 4.13 a | 3.89 a | 4.04 a | 0.01 | |
| SEM | 0.82 | 0.21 | 0.50 | 0.51 | |||
| p (Treatment) | 0.810 | 0.130 | 0.310 | 0.240 | <0.001 | ||
| Cholesterol | CON | 1.982 a | 1.72 a | 2.03 a | 2.69 b | <0.001 | |
| (mM) | PAC | 2.30 ab | 2.00 a | 2.50 bc | 2.99 c | <0.001 | |
| SEM | 0.31 | 0.42 | 0.43 | 0.55 | |||
| p (Treatment) | 0.012 | 0.460 | 0.003 | 0.140 | <0.001 | ||
| BHB 3 | CON | 0.42 a | 0.69 b | 1.11 b | 1.09 b | <0.001 | |
| (mM) | PAC | 0.51 a | 0.56 ab | 0.76 c | 0.73 bc | <0.001 | |
| SEM | 0.31 | 0.19 | 0.46 | 0.44 | |||
| p (Treatment) | 0.150 | 0.470 | 0.870 | 0.530 | <0.001 | ||
| NEFAs 4 | CON | 0.21 a | 0.57 b | 0.65 b | 0.68 b | <0.001 | |
| (mM) | PAC | 0.28 | 0.34 | 0.46 | 0.44 a | 0.12 | |
| SEM | 0.16 | 0.26 | 0.23 | 0.31 | |||
| p (Treatment) | 0.920 | 0.230 | 0.045 | 0.030 | <0.001 | ||
| NEFA/cholesterol ratio | CON | 0.11 a | 0.36 b | 0.36 b | 0.32 b | <0.001 | |
| PAC | 0.14 a | 0.21 b | 0.19 b | 0.15 b | 0.01 | ||
| SEM | 0.09 | 0.18 | 0.15 | 0.17 | |||
| p (Treatment) | 0.422 | 0.084 | 0.005 | 0.034 | <0.001 |
| Parameter | Day 0 | Day 7 | Day 14 | p (Time) | p (Treatment × Time) | |
|---|---|---|---|---|---|---|
| TAC3 | CON 1 | 0.78 a | 0.81 a | 0.85 b | 0.03 | |
| (mM) | PAC 2 | 0.83 | 0.85 | 0.88 | 0.25 | |
| SEM | 0.11 | 0.08 | 0.08 | |||
| p (Treatment) | 0.830 | 0.120 | 0.640 | 0.09 | ||
| SAA4 | CON | 55.00 a | 38.22 ab | 27.19 b | 0.01 | |
| (mg/mL) | PAC | 43.97 a | 28.58 ab | 20.63 b | 0.01 | |
| SEM | 21.21 | 20.72 | 17.92 | |||
| p (Treatment) | 0.130 | 0.120 | 0.170 | 0.00 | ||
| Haptoglobin | CON | 0.76 b | 0.79 b | 0.66 a | 0.05 | |
| (mg/mL) | PAC | 0.70 b | 0.55 ab | 0.44 a | 0.01 | |
| SEM | 0.26 | 0.35 | 0.28 | |||
| p (Treatment) | 0.170 | 0.035 | 0.027 | 0.06 | ||
| GSH-Px5 | CON | 1095.74 | 1077.47 | 1061.32 | 0.74 | |
| (ukat/L) | PAC | 1065.15 | 1028.31 | 1000.51 | 0.20 | |
| SEM | 99.24 | 93.02 | 101.23 | |||
| p (Treatment) | 0.470 | 0.160 | 0.110 | 0.13 |
| Parameter | Day-7 | Day 0 | Day 7 | Day 14 | p (Time) | p (Treatment × Time) | |
|---|---|---|---|---|---|---|---|
| Leucocytes (× 109/L) | CON 1 | 10.62 | 9.82 | 14.81 | 11.54 | 0.284 | |
| PAC 2 | 12.14 | 8.34 | 7.84 | 8.75 | 0.189 | ||
| SEM | 3.74 | 2.26 | 6.42 | 2.77 | |||
| p (Treatment) | 0.08 | 0.13 | 0.08 | 0.08 | 0.583 | ||
| Lymphocytes (× 109/L) | CON | 3.29 | 2.74 | 3.54 | 3.26 | 0.239 | |
| PAC | 2.77 | 2.63 | 2.80 | 2.69 | 0.902 | ||
| SEM | 0.96 | 0.53 | 1.28 | 0.90 | |||
| p (Treatment) | 0.06 | 0.83 | 0.78 | 0.63 | 0.389 | ||
| Monocytes (× 109/L) | CON | 0.95 | 0.88 | 0.81 | 0.90 | 0.201 | |
| PAC | 0.86 | 0.84 | 0.77 | 0.89 | 0.363 | ||
| SEM | 0.20 | 0.23 | 0.2 | 0.24 | |||
| p (Treatment) | 0.21 | 0.87 | 0.52 | 0.98 | 0.333 | ||
| Granulocytes (× 109/L) | CON | 6.38 | 6.63 | 5.66 | 5.90 | 0.695 | |
| PAC | 5.58 | 5.67 | 4.27 | 5.17 | 0.066 | ||
| SEM | 1.36 | 1.70 | 1.85 | 1.34 | |||
| p (Treatment) | 0.130 | 0.180 | 0.035 | 0.150 | 0.007 | ||
| Lymphocytes (%) | CON | 29.00 | 27.95 | 30.08 | 38.90 | 0.789 | |
| PAC | 30.11 a | 30.20 a | 38.11 b | 31.51 a | 0.039 | ||
| SEM | 7.08 | 7.51 | 9.79 | 12.37 | |||
| p (Treatment) | 0.970 | 0.320 | 0.020 | 0.210 | 0.513 | ||
| Monocytes (%) | CON | 9.05 | 8.82 | 9.28 | 9.68 | 0.068 | |
| PAC | 9.53 | 9.28 | 10.09 | 10.62 | 0.096 | ||
| SEM | 1.35 | 1.45 | 1.44 | 1.32 | |||
| p (Treatment) | 0.300 | 0.120 | 0.300 | 0.066 | 0.042 | ||
| Granulocytes (%) | CON | 60.26 | 63.2 | 60.6 | 59.87 | 0.580 | |
| PAC | 61.60 b | 60.5 b | 51.8 a | 58.10 b | 0.017 | ||
| SEM | 5.96 | 7.93 | 10.09 | 6.94 | |||
| p (Treatment) | 0.620 | 0.400 | 0.017 | 0.058 | 0.040 | ||
| Hemoglobin g/L | CON | 103.09 c | 99.7 b | 95.8 ab | 94.70 a | 0.006 | |
| PAC | 100.17 c | 95.3 c | 93.5 b | 89.83 a | <0.001 | ||
| SEM | 7.29 | 8.37 | 6.60 | 6.68 | |||
| p (Treatment) | 0.410 | 0.860 | 0.370 | 0.043 | 0.004 | ||
| Erythrocytes (× 1012/L) | CON | 6.92 | 6.55 | 6.42 | 6.32 | 0.053 | |
| PAC | 6.80 | 6.73 | 6.57 | 6.40 | 0.078 | ||
| SEM | 0.61 | 0.66 | 0.55 | 0.56 | |||
| p (Treatment) | 0.880 | 0.270 | 0.200 | 0.660 | 0.330 | ||
| Hematocrit (%) | CON | 34.61 | 35.10 | 33.80 | 34.51 | 0.498 | |
| PAC | 34.42 a | 34.20 a | 33.01 b | 31.37 b | 0.002 | ||
| SEM | 2.82 | 3.01 | 2.58 | 4.79 | |||
| p (Treatment) | 0.877 | 0.498 | 0.440 | 0.059 | 0.155 | ||
| Platelets (× 109/L) | CON | 255.91 a | 295.4 a | 338.6 b | 561.48 c | <0.0001 | |
| PAC | 271.09 a | 310.2 ab | 339.4 bc | 340.30 c | 0.045 | ||
| SEM | 88.00 | 72.69 | 58.11 | 182.26 | |||
| p (Treatment) | 0.670 | 0.655 | 0.974 | 0.217 | 0.047 |
| Item | CON1 (n = 23) | PAC 2 (n = 23) | SEM | p |
|---|---|---|---|---|
| Average parity rank | 1.69 | 1.61 | 0.11 | NS 3 |
| Number of heifers | 11 | 11 | - | - |
| Number of cows | 12 | 12 | - | - |
| Ingredients | Close-Up Diet (kg) | Fresh Cow Diet (kg) |
|---|---|---|
| Maize silage | 19.0 | 22.0 |
| Alfalfa silage | 2.0 | 3.0 |
| Whole crop rye silage | 0.0 | 4.0 |
| Barley straw | 2.0 | 0.0 |
| Alfalfa hay | 0.0 | 1.0 |
| Brewers’ grains | 1.5 | 6.0 |
| High moisture corn | 0.0 | 2.0 |
| Rapeseed meal | 0.6 | 0.0 |
| WDGS 3 | 0.0 | 1.0 |
| Concentrate 2 | 2.8 | 5.8 |
| Palmitate | 0.0 | 0.15 |
| MP ion (anionic salts) | 0.5 | 0.0 |
| Water | 3 | 4 |
| Total fresh matter/cow/day | 31.40 | 48.95 |
| Compound | Content (mg/kg) |
|---|---|
| Curcuminoids | 3290 |
| Carnosic derivatives | 5010 |
| Salicylic derivatives | 6360 |
| Flavonoids (naringin) | 9665 |
| Artepillin C | 180 1 |
| Total polyphenols | 20,900 |
Publisher’s Note: MDPI stays neutral with regard to jurisdictional claims in published maps and institutional affiliations. |
© 2022 by the authors. Licensee MDPI, Basel, Switzerland. This article is an open access article distributed under the terms and conditions of the Creative Commons Attribution (CC BY) license (https://creativecommons.org/licenses/by/4.0/).
Share and Cite
Kumprechtová, D.; Chabrillat, T.; Guillaume, S.; Kerros, S.; Kadek, R.; Indrová, E.; Illek, J. Effect of Plant Bioactive Compounds Supplemented in Transition Dairy Cows on the Metabolic and Inflammatory Status. Molecules 2022, 27, 6092. https://doi.org/10.3390/molecules27186092
Kumprechtová D, Chabrillat T, Guillaume S, Kerros S, Kadek R, Indrová E, Illek J. Effect of Plant Bioactive Compounds Supplemented in Transition Dairy Cows on the Metabolic and Inflammatory Status. Molecules. 2022; 27(18):6092. https://doi.org/10.3390/molecules27186092
Chicago/Turabian StyleKumprechtová, Dana, Thibaut Chabrillat, Simon Guillaume, Sylvain Kerros, Romana Kadek, Eva Indrová, and Josef Illek. 2022. "Effect of Plant Bioactive Compounds Supplemented in Transition Dairy Cows on the Metabolic and Inflammatory Status" Molecules 27, no. 18: 6092. https://doi.org/10.3390/molecules27186092
APA StyleKumprechtová, D., Chabrillat, T., Guillaume, S., Kerros, S., Kadek, R., Indrová, E., & Illek, J. (2022). Effect of Plant Bioactive Compounds Supplemented in Transition Dairy Cows on the Metabolic and Inflammatory Status. Molecules, 27(18), 6092. https://doi.org/10.3390/molecules27186092