Article

Modeling Binary and Multicomponent Systems Containing Supercritical CO2 with Polyethylene Glycols and Compounds Relevant to the Biodiesel Production

by
Ioannis Tsivintzelis
1,*,
Georgios Koutsou
1 and
Georgios M. Kontogeorgis
2
1
Department of Chemical Engineering, Aristotle University of Thessaloniki, GR-54124 Thessaloniki, Greece
2
Center for Energy Resources Engineering (CERE), Department of Chemical and Biochemical Engineering, Technical University of Denmark, DK-2800 Kgs. Lyngby, Denmark
*
Author to whom correspondence should be addressed.
Molecules 2022, 27(18), 5785; https://doi.org/10.3390/molecules27185785
Submission received: 5 August 2022 / Revised: 30 August 2022 / Accepted: 2 September 2022 / Published: 7 September 2022
(This article belongs to the Special Issue Supercritical Fluid Techniques)

Abstract

:
The CPA equation of state is applied to model binary, ternary, and multicomponent mixtures that contain CO2 with polyethylene glycols or compounds relevant to biodiesel production, such as glycerol and various triglycerides. Effort has been made to evaluate the model performance on correlating both the liquid and the vapor phase compositions, which is a demanding task, revealing the model’s and parameters’ limitations, due to the rather low concentrations of heavy compounds in the vapor phase. Initially the model’s binary parameters, which in all cases were temperature independent, were estimated using experimental data for binary systems. Those parameters were used to predict the phase behavior of supercritical CO2 containing ternary and multicomponent mixtures. Since no parameter was adjusted to ternary or multicomponent systems’ data, the reported CPA results for such mixtures are considered as pure predictions. This is the final part of a series of studies [Tsivintzelis et al. Fluid Phase Equilibria 430 (2016) 75–92 and 504 (2020) 112337] that complete the parameterization of the CPA equation of state for systems relevant to the biodiesel production, which allows the application of the model to multicomponent mixtures of the relevant processes.

1. Introduction

The processing of vegetable seeds and oils with supercritical CO2 has attracted significant attention mainly because the relevant extraction or purification processes require lower temperatures, while CO2 is nontoxic, and it is easily removed from the products simply by depressurizing the system. Such pressure-induced separation diminishes the need for adequate thermal separations, as in the traditional processes with liquid and often toxic solvents. Another important advantage is that the solubility of other substances in such a supercritical solvent is strongly affected by moderate changes in temperature and pressure, rendering the solvent power of supercritical CO2 as a tunable parameter that can be adjusted to the needs of specific processes. This allows its successful use in various demanding separations of high-value compounds from mixtures of similar fluids, such as the separation of antioxidants from natural products. Despite the disadvantage of higher capital and operational costs imposed by the use of high pressures, the aforementioned advantages are often crucial in the food, cosmetic, pharmaceutical, and nutraceutical industries [1,2,3].
However, vegetable oils are also used to produce biodiesel, whose production volume increases following the need for replacing traditional fossil fuels with fuels from renewable sources. Biodiesel is produced through the transesterification reaction of various vegetable oils with methanol (or ethanol), which results in multicomponent mixtures containing methyl (or ethyl) esters of fatty acids and glycerol as a byproduct. Recently, the supercritical CO2 was suggested as a reaction medium or as a co-solvent for the transesterification reaction and the purification of biodiesel, i.e., removal of glycerol and other contaminants [4].
Despite considering supercritical CO2 as a valuable solvent or reaction medium, and despite its nontoxic character, such fluid, when massively released to the atmosphere from the combustion of fossil fuels, is considered as an environmental threat due to its action in the greenhouse phenomenon. Thus, an important research effort has been made to develop processes for capturing CO2 from flue gases, which should be economically feasible and environmentally friendly. In this direction, polyethylene glycols and various alcohols have been suggested, among a vast amount of other potential solvents, for the physical absorption of CO2 [5].
Despite the differences of the three groups of CO2 processes mentioned above, i.e., extraction and purification of natural products, biodiesel production, and CO2 capture with physical absorption, all of them require the successful prediction of the phase behavior of binary and multicomponent CO2 mixtures that, among others, may contain glycols, glycerol, low-molecular-weight alcohols, water, glycerides, fatty acids, and alkyl esters of fatty acids.
Modeling the thermodynamic properties of such mixtures is rather demanding, mainly due to the non-ideal behavior of some systems (i.e., mixtures with organic acids and other hydrogen-bonding or high-molecular-weight compounds) and the use of high pressures [6,7,8]. In such systems, the hydrogen-bonding behavior significantly affects the phase behavior and other thermodynamic properties, especially the vaporization enthalpies and the heats of mixing [6,7,8]. Thus, explicitly accounting for various self- and cross-association interactions is the safest way for modeling using equations of state. However, as mentioned in the first two studies of this series of articles, in many cases, there is a lack of accurate experimental data, which renders difficult the parameterization and the evaluation of thermodynamic models [7,8]. In more detail, measuring the critical properties, or the vapor pressures, at relatively high temperatures of such high-molecular-weight compounds (i.e., fatty acids, glycerides and esters of fatty acids) is often non feasible due to decomposition. Furthermore, most often, those compounds are produced in mixtures with various isomers or similar substances, and thus, the experimental data refer to samples of low purity. Finally, many mixtures of interest, such as systems with alcohols and fatty acids, glycerides, or esters, are reactive, rendering the experimental investigation of their phase behavior rather demanding. For this reason, many contradictory data are often found in literature despite the fact that many experimental data of good quality were measured during the last years.
The CPA equation of state [9] was used to describe a vast number of fluids as recently reviewed [10,11]. In addition, glycol-containing systems, including the demanding glycol–water LLE, were modeled [12,13,14,15,16]; however, the polyethylene glycols have not been studied so far. Biodiesel systems, mainly at low pressures, have been modeled by Coutinho and co-workers in various studies [17,18,19,20,21,22,23,24,25], which in many cases contain correlations of pure and binary CPA parameters allowing predictions for systems for which there is lack of experimental data, while many of such studies also contain experimental data. Finally, systems at high pressures containing CO2 with water, alcohols, glycols, and/or hydrocarbons were extensively studied [15,26,27,28,29,30,31].
This study is the final part of a series of articles [7,8]. In the first part [7], the CPA pure fluid parameters for various compounds such as glycerol, heavy esters, fatty acids, and glycerides were presented, along with correlations that allow the prediction of pure fluid parameters in cases of lack of experimental data (such correlations were used in this study in case of triolein, as described in Section 3.1). Moreover, binary and multicomponent mixtures containing alcohols, water, glycerol, fatty acids, heavy esters, or glycerides were considered. In the second part [8], the model was applied to describe binary mixtures of CO2 with fatty acids and their methyl- or ethyl-esters, while a limited number of multicomponent systems was considered. However, no glycerol- or glyceride-containing systems were studied. In both previous studies, correlations of the binary parameters are presented, allowing the prediction of their values in cases of lack of experimental data. Some multicomponent biodiesel systems were recently modeled [30].
In this study, the CPA equation of state was applied for first time to polyethylene glycols of rather low polymer molecular weight, and correlations of the pure fluid parameters are presented allowing the prediction of their values for various molecular weights. Then, the model was applied to binary systems that contain CO2 with polyethylene glycols, glycerol, or various glycerides, and the binary parameters were obtained. Using binary parameters optimized solely to experimental data for binary mixtures, the predicting ability of the model was evaluated for ternary and multicomponent systems.

2. The CPA Equation of State

The cubic-plus-association (CPA) equation of state (EoS) is a combination of the SRK EoS and the association term of the SAFT type models [9,10,11]. Thus, this model is capable of describing systems with hydrogen-bonding fluids such as water, alcohols, and glycols. The EoS, in terms of pressure, is given by the following equation:
P = R T V m b α ( T ) V m ( V m + b ) 1 2 R T V m ( 1 + ρ l n g ρ ) i x i A i ( 1 X A i )
where xi is the mole fraction of component i, and XAi is the fraction of the free (not associated with other sites) sites of type A on molecule i, related to the association strength ΔAiBj as follows:
X A i = 1 1 + ρ · j x j B j ( X B j · Δ A i B j )
Δ A i B j = g ( ρ ) [ e x p ( ε A i B j R · T ) 1 ] b i j · β A i B j
where g ( ρ ) = 1 / ( 1 1.9 n ) is the radial distribution function, n = ( 1 / 4 ) b ρ the reduced density, ρ the molar density, εAiBj the association energy, βAiBj the association volume, and b i j = ( b i + b j ) / 2 . The co-volume parameter, bi, of component i is considered temperature independent.
A Soave-type relationship is used for the interaction energy of the physical term, as follows:
a i ( T ) = a 0 , i [ 1 + c 1 , i · ( 1 T r , i ) ] 2
where a0 and c1 are pure fluid parameters, and Tr is the reduced temperature.
The next mixing and combining rules are used for the SRK physical term [9], whereas the one temperature-independent binary interaction parameter, kij, was used according to the following relationships:
α = i j x i x j α i j
α i j = α i α j ( 1 k i j )
b = i x i · b i
For interactions between two self-associating fluids, i and j, the CR-1 rule is used through the following relationships:
ε A i B j = ε A i B i + ε A j B j 2 ,   β A i B j = β A i B i · β A j B j  
For interactions between one self-associating with one non self-associating fluid, the modified CR-1 (mCR-1) combining rule is used [31]:
ε A i B j = ε A i B i + ε A j B j 2 ,   β A i B j = a d j u s t a b l e

3. Results and Discussion

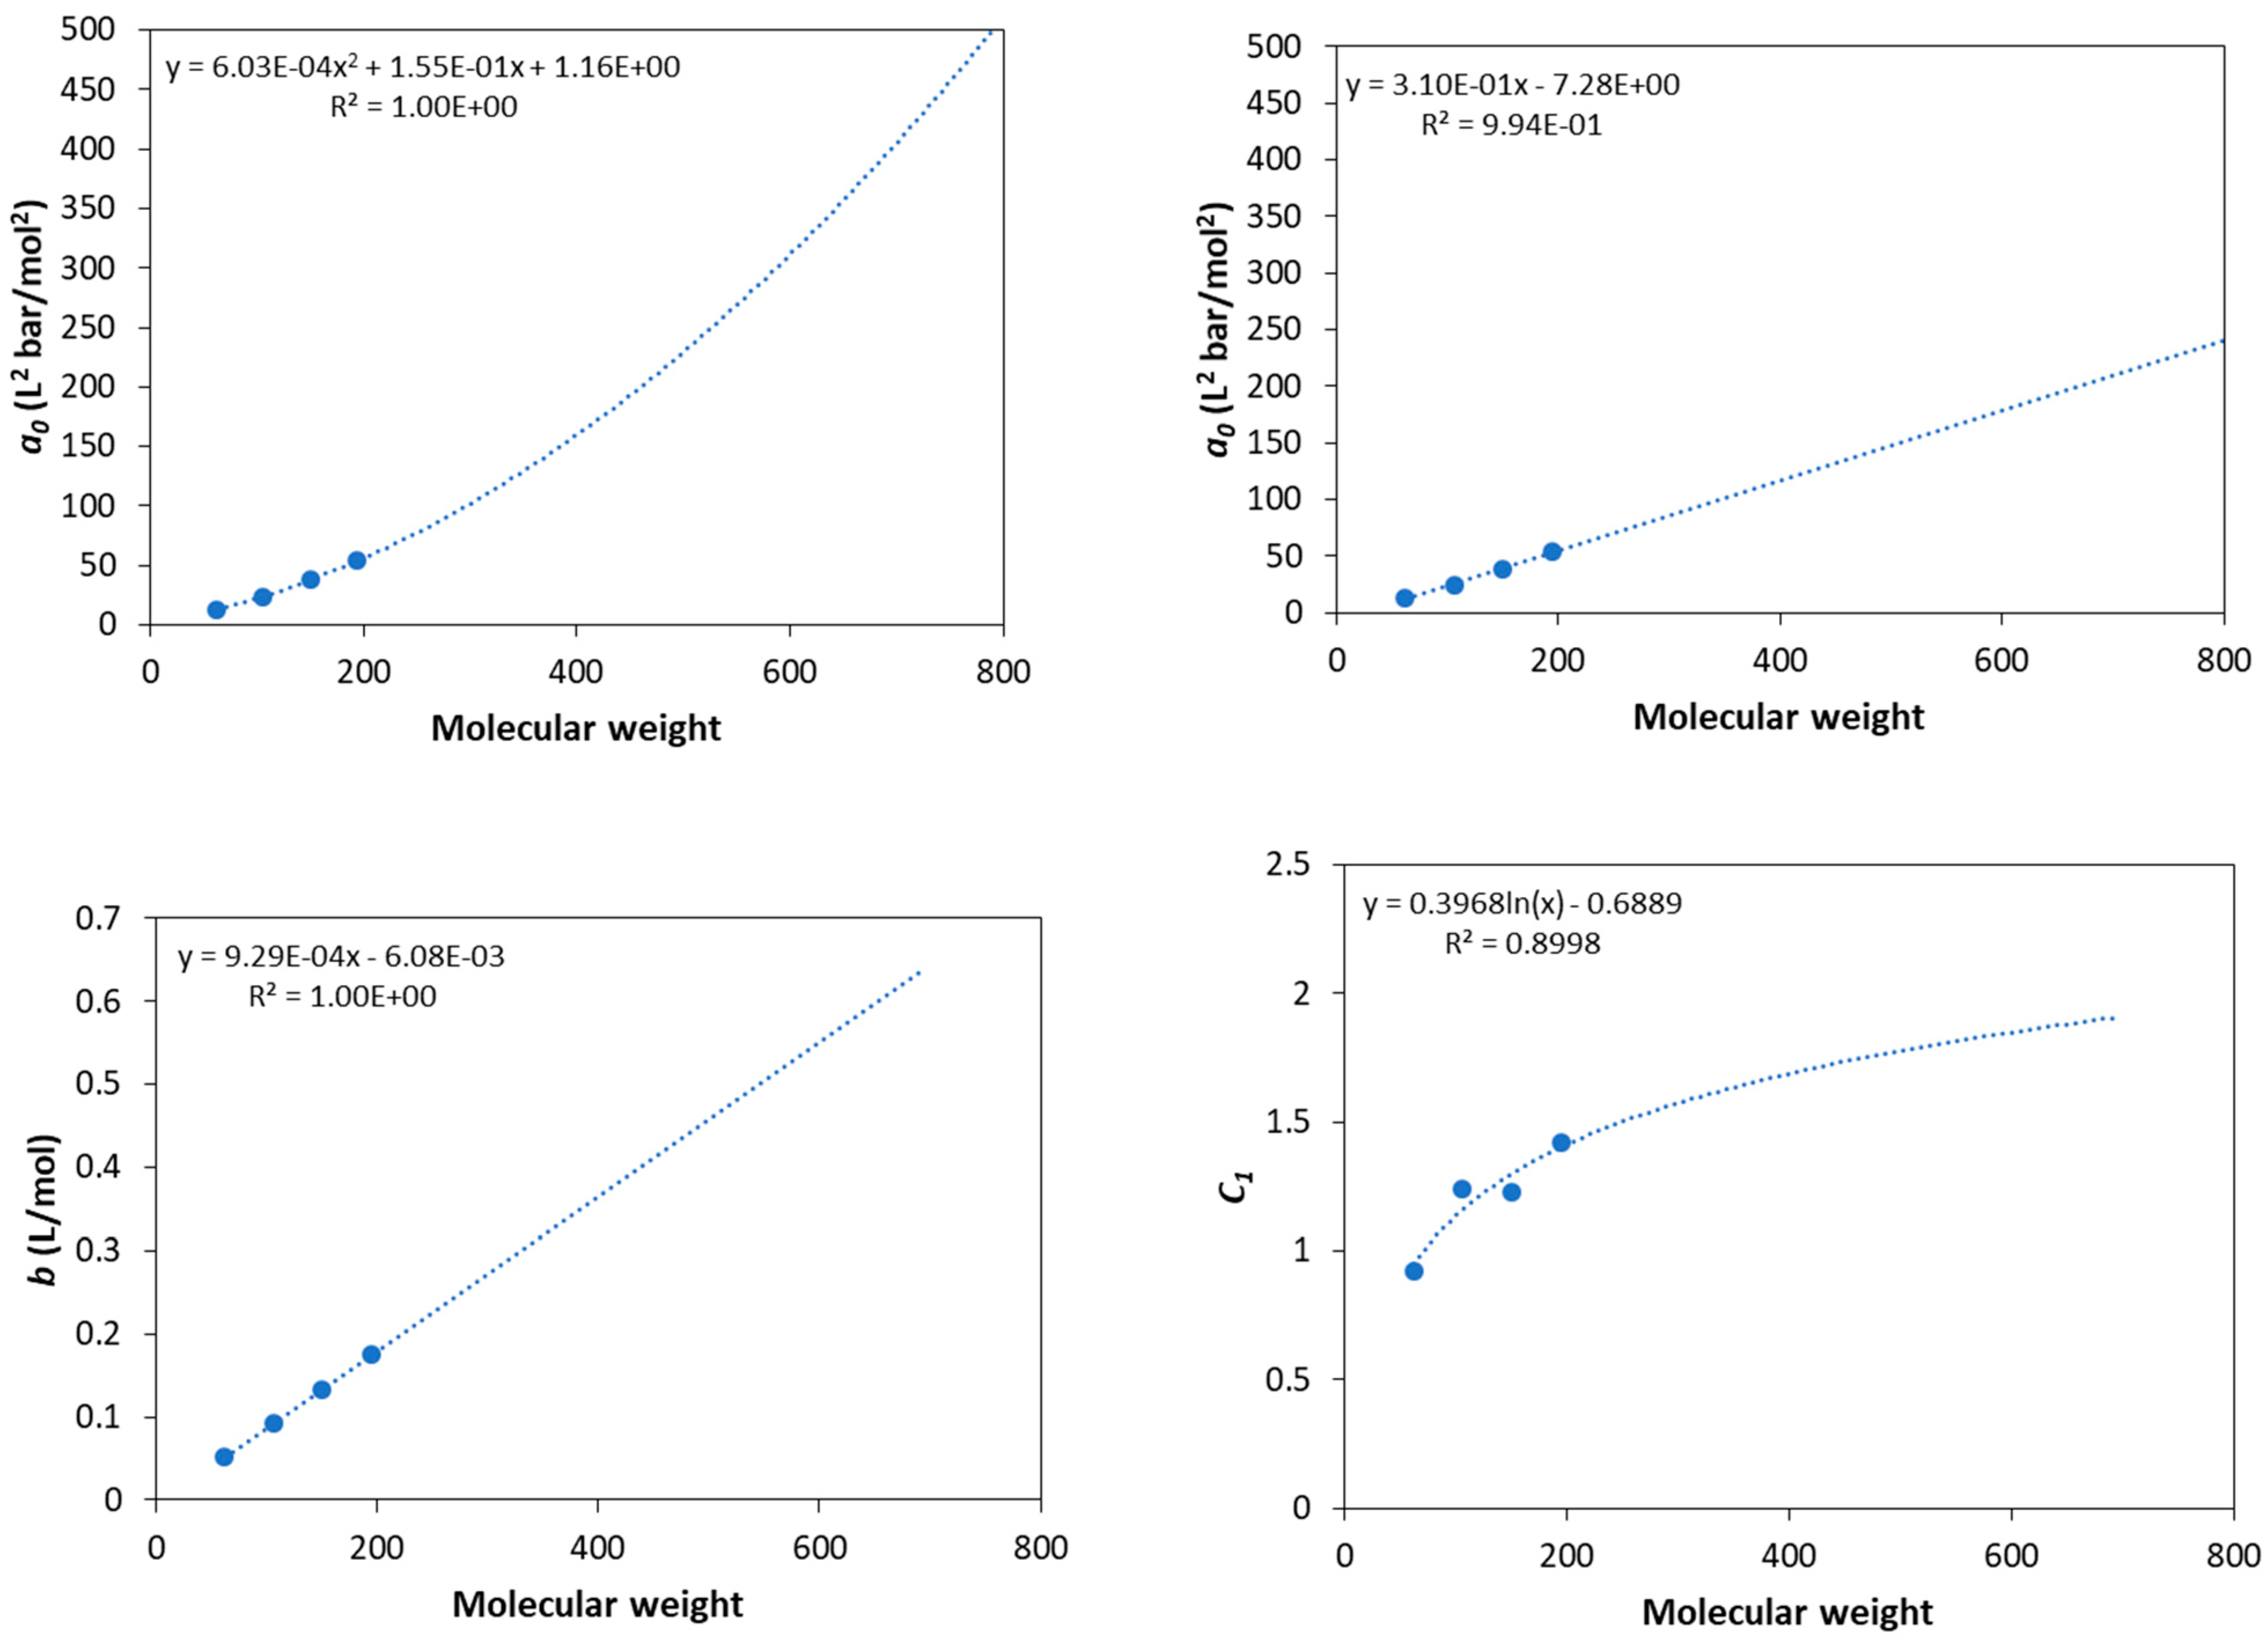
3.1. CPA Pure Fluid Parameters

For non-associating pure fluids, the CPA EoS is reduced to the SRK model and requires the knowledge of three pure fluid parameters, which, in contrast with the SRK EoS, are not estimated form the critical properties but are adjusted to pure fluid experimental vapor pressures and liquid densities. In cases of self-associating fluids, the application of the model requires the knowledge of two additional parameters, namely the association energy and the association volume, which may be simultaneously adjusted with the three physical parameters, but they can also be adopted form experimental values or ab initio calculations [31].
All the pure fluid parameters needed for calculations of this study were adopted from the literature except for the parameters of glycols, which were estimated by adjusting the model predictions to DIPPR data for vapor pressures and liquid molar volumes [32]. All parameters used in this study are presented in Table 1. For glycerol, the 3 × 2B association scheme is used to describe the self-associating behavior since glycerol contains three hydroxyl groups in each molecule [7]. In addition, here, it is worth mentioning that the parameters of triolein were predicted using the correlations presented by Tsivintzelis et al. [7] due to lack of (confirmed) experimental data.Since experimental data for vapor pressures do not exist for various polyethylene glycols, the estimation of the CPA pure fluid parameters becomes difficult. Many studies showed that the estimation of pure fluid parameters of various models, including the SAFT type ones and lattice fluid theories, by using only volumetric properties does not result in optimum parameters for phase equilibrium calculations of binary systems [33]. For this reason, various approaches to predict such parameters were developed, including group contribution methods [33,34,35]. Using the CPA model for compounds of the same family, it was shown that the co-volume parameter, b, is a linear function of molecular weight (or the van der Waals volume of the fluid), the c1 parameter reaches a plateau for relatively high molecular weights, while the energetic parameter, a0, of the physical term shows a linear or a mild polynomial dependence from molecular weight (or the van der Waals volume of the fluid) [7,17,28]. However, it was shown that appropriate correlations of the three physical CPA parameters are facilitated when the association parameters are kept constant for all fluids of the same family since the two energetic parameters, i.e., the a0 and ε parameters, are highly correlated to each other [7]. Having in mind such findings for the CPA model, correlations of the pure fluid parameters for glycols were estimated as presented in Figure 1. For a0, both a linear and a second-order polynomial dependence was used. Such correlations allow for the prediction of pure fluid parameters for polyethylene glycols of various molecular weights, as shown in Table 2. The critical temperature reported in Table 2 was predicted using the Joback’s group contribution method for the closest ethylene glycol [36].

3.2. CO2–Polyethylene Glycols VLE

Next, the model was applied to describe the solubility of CO2 in polyethylene glycols of various molecular weights. In all cases, the a0 was adopted from the linear correlation (see Figure 1 and Table 2) since it was shown that it gives slightly more accurate results, especially for higher molecular weights.
Tsivintzelis et al. modeled the CO2–glycol vapor–liquid equilibrium (in systems containing ethylene glycol, diethylene glycol, and triethylene glycol) using two major approaches, i.e., assuming CO2 as inert compound and assuming that CO2 has one site that is able to cross-associate with glycols [15]. Using the first approach, the model satisfactorily describes the liquid phase compositions; while only using the second approach (and, consequently, using one extra binary parameter) the model satisfactorily describes the vapor phase compositions. However, since in systems with polyethylene glycols, the liquid phase is of interest; the first approach was used in this study for simplicity, and CO2 was modeled as inert compound.
The results using one temperature-independent binary interaction parameter, kij, are presented in Table 3 and in Figure 2. In all cases, the CPA correlations show a satisfactory agreement with the experimental data. The values of the binary interaction parameters are low and positive for low molecular weights, while they become negative for higher molecular weights. Since increasing the molecular weight, the strong intermolecular interactions are expected to decrease, the negative values of kij for higher molecular weights mainly reflect the inaccuracies of PEG’s pure fluid parameters due to the approximate way of their estimation, i.e., prediction using the correlations of Figure 1.

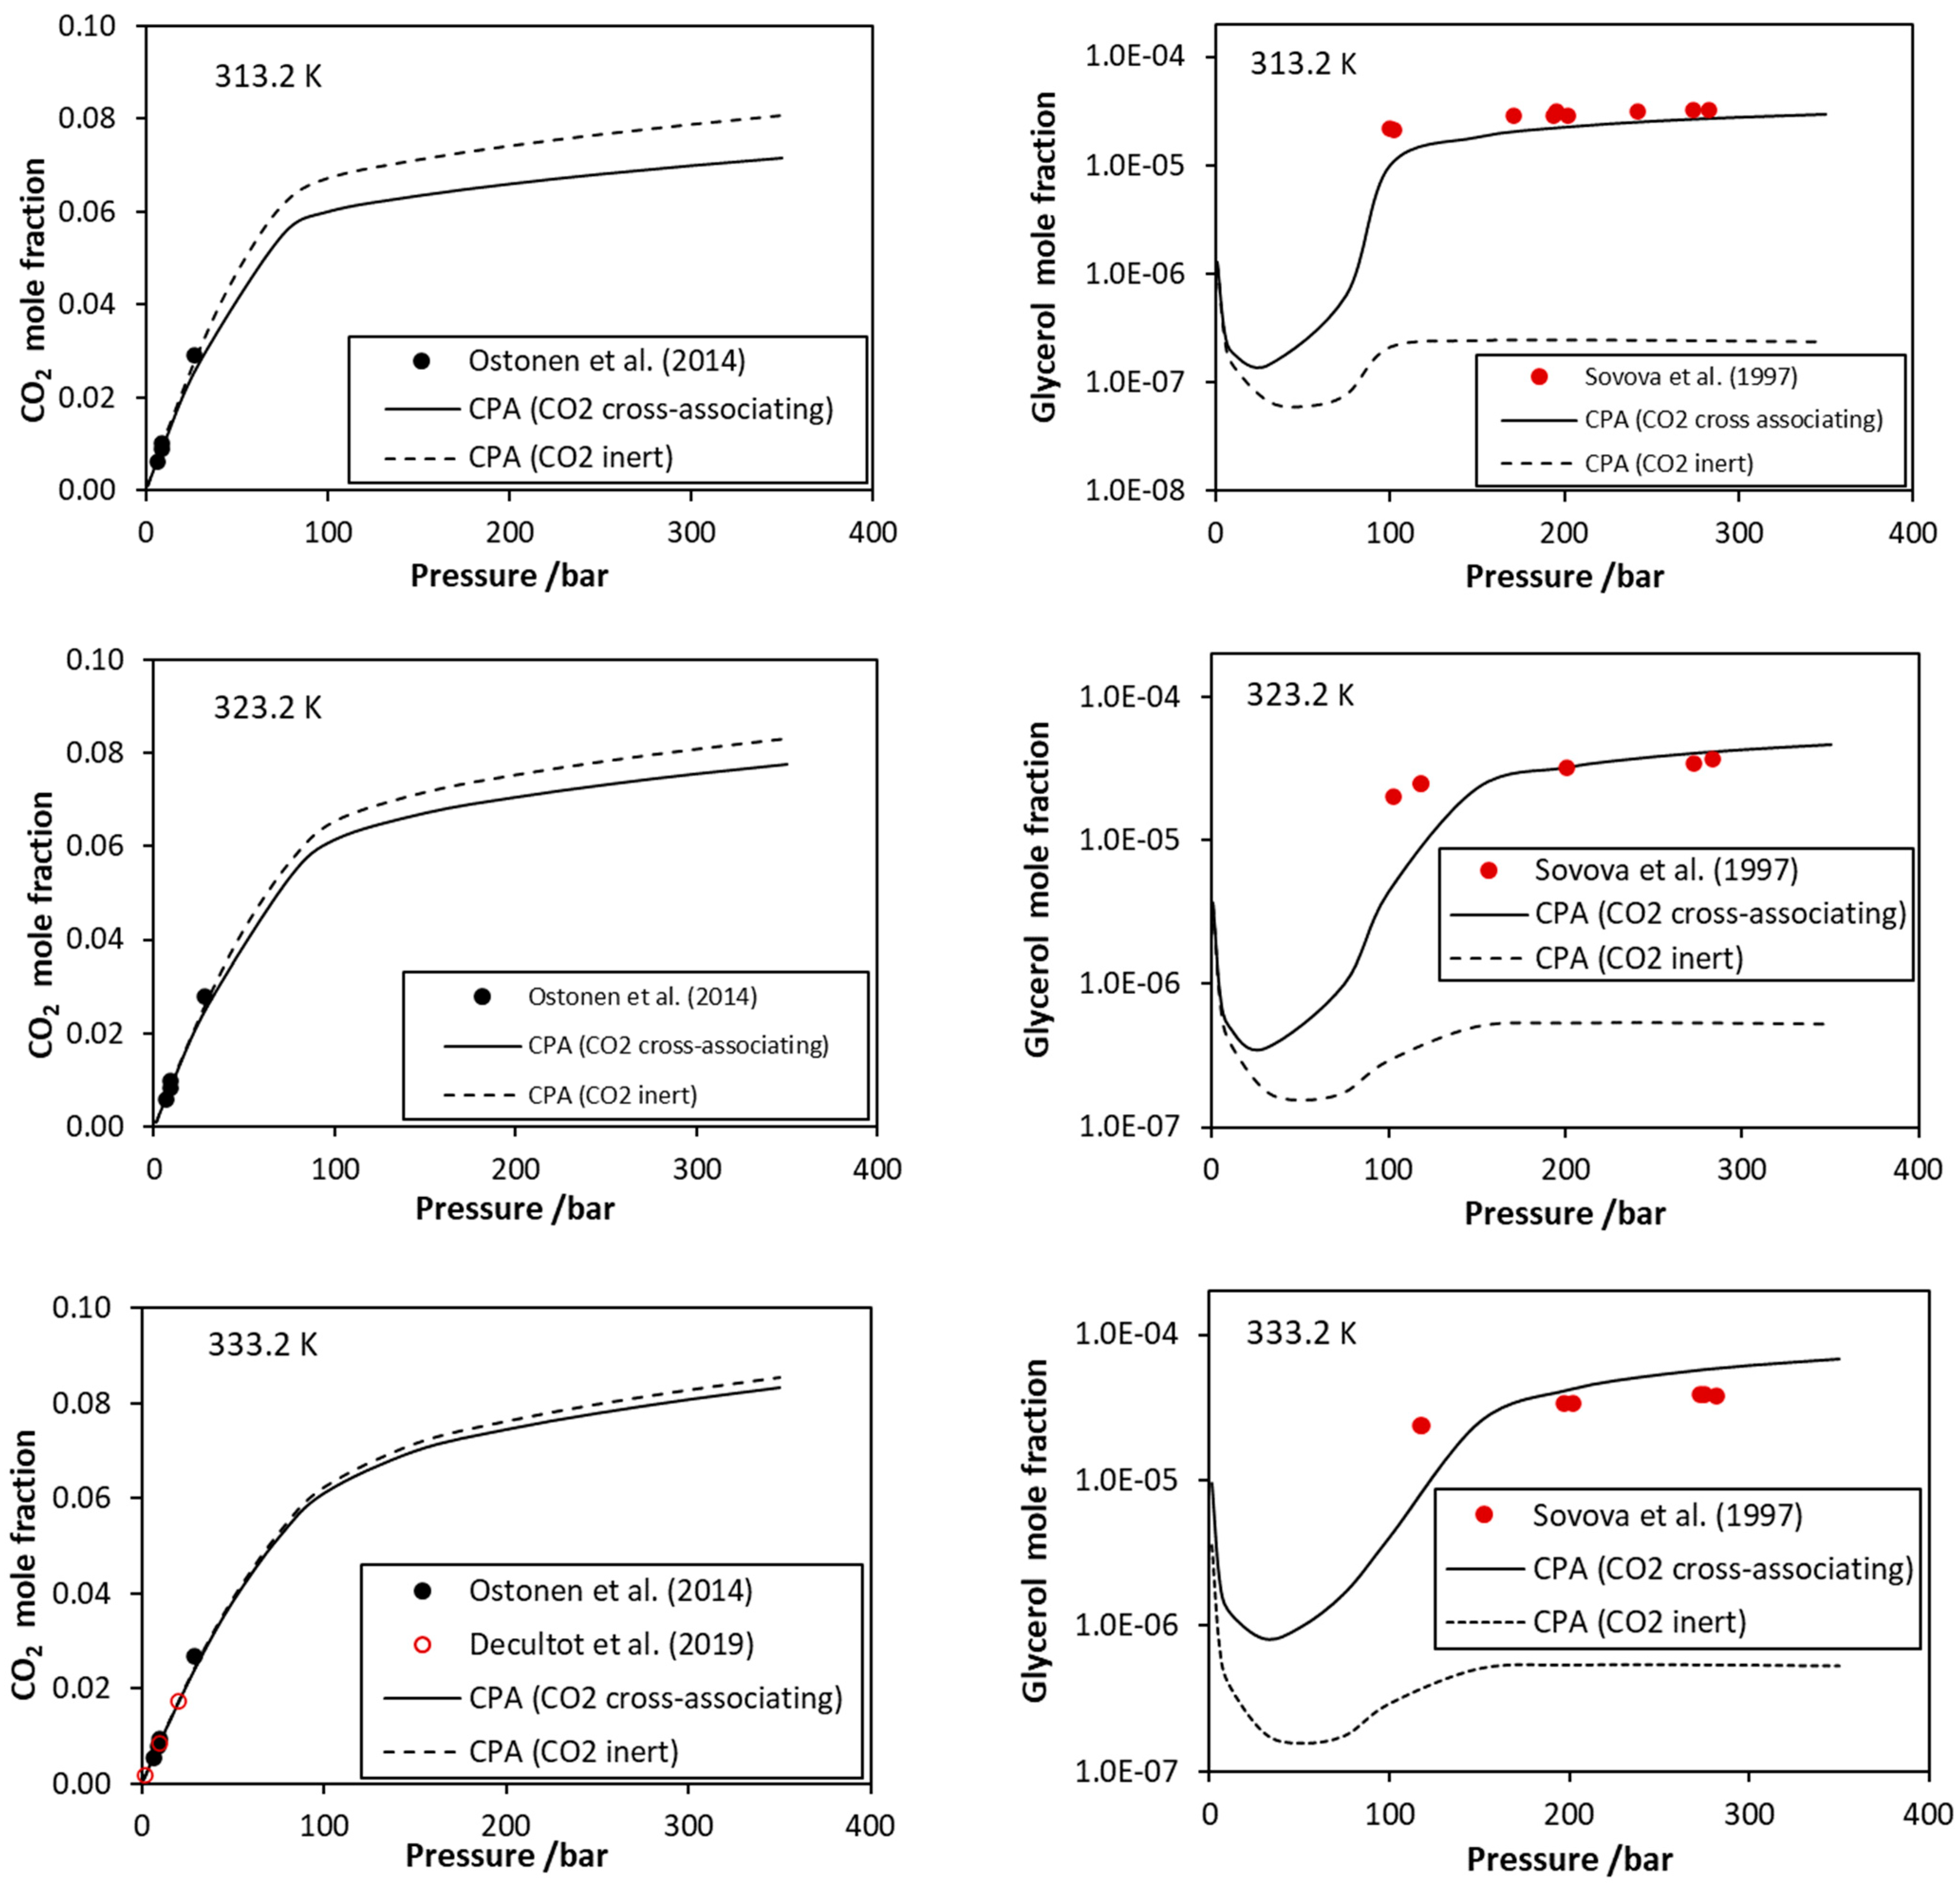
3.3. CO2–Glycerol Binary System
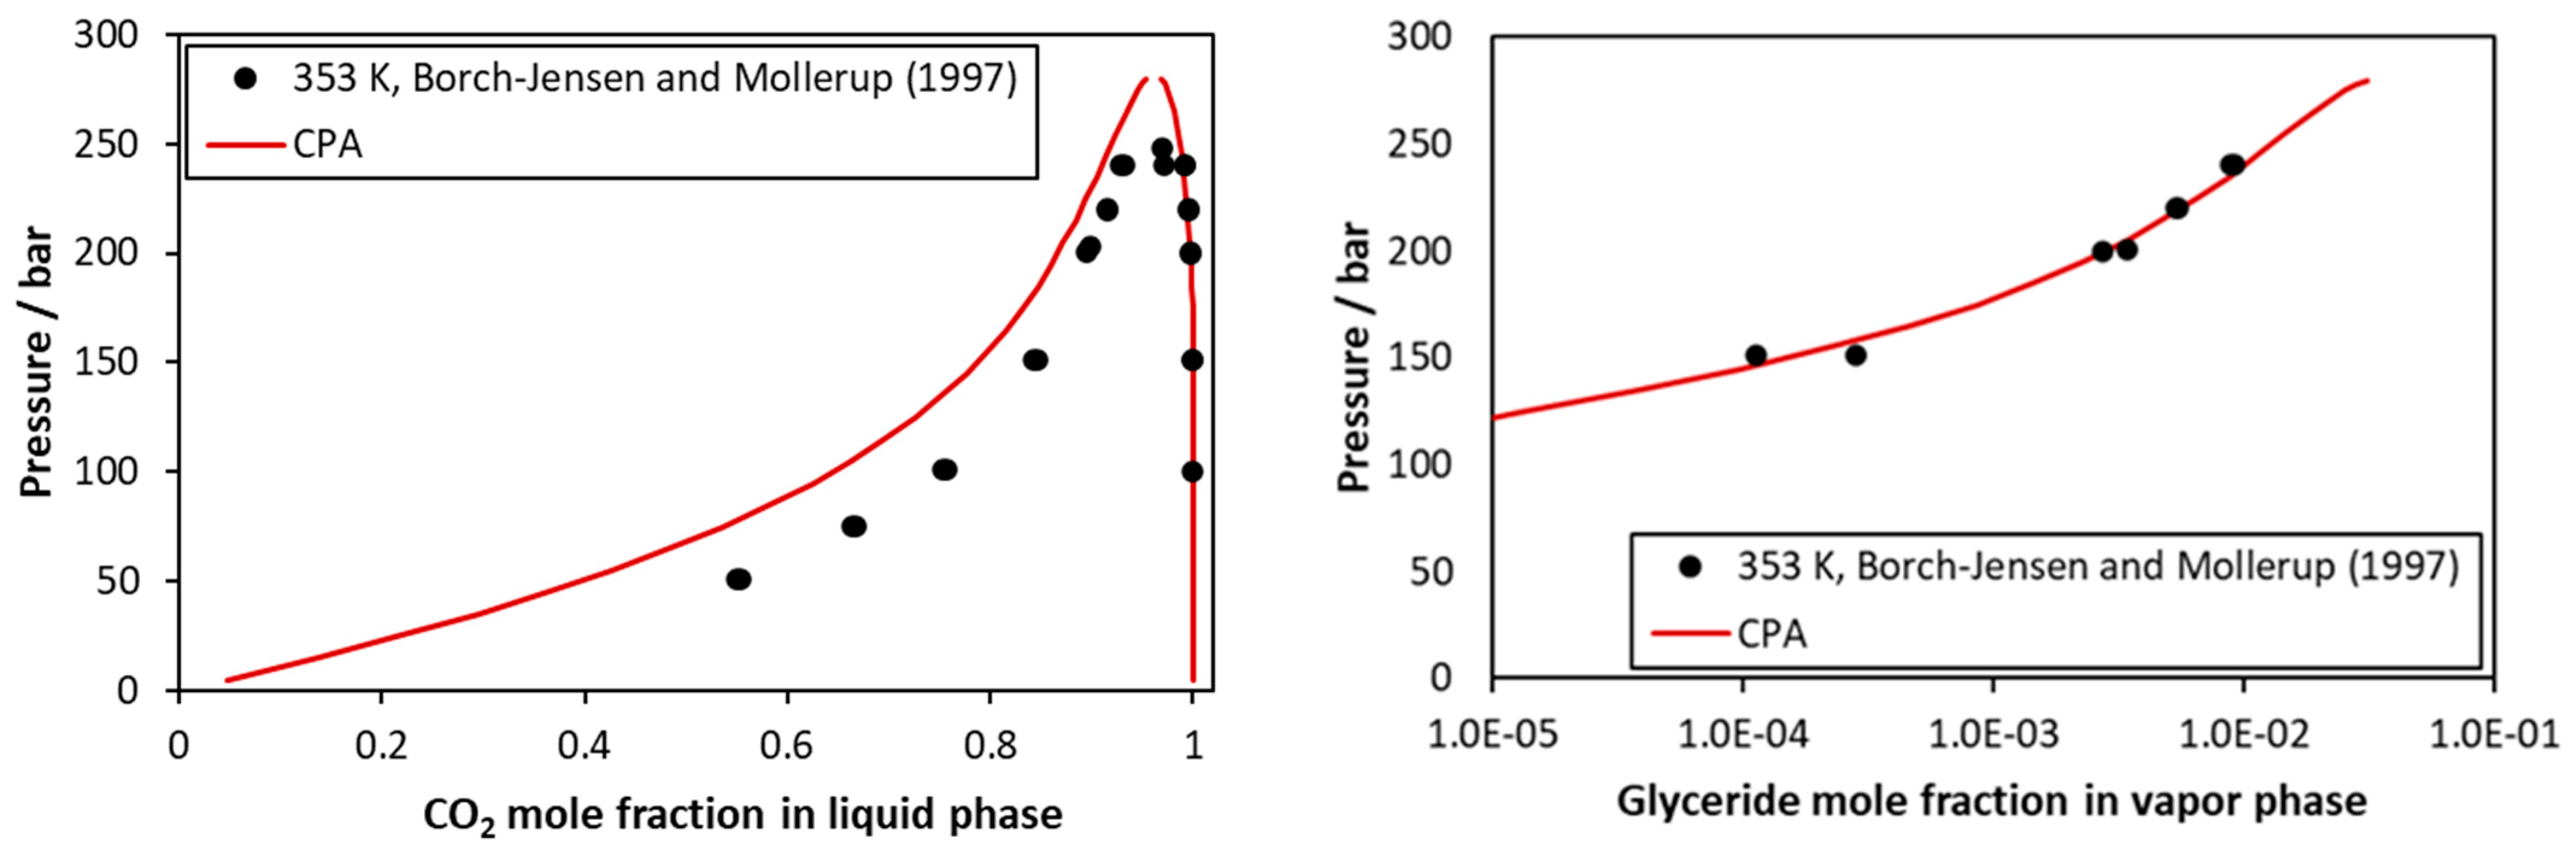
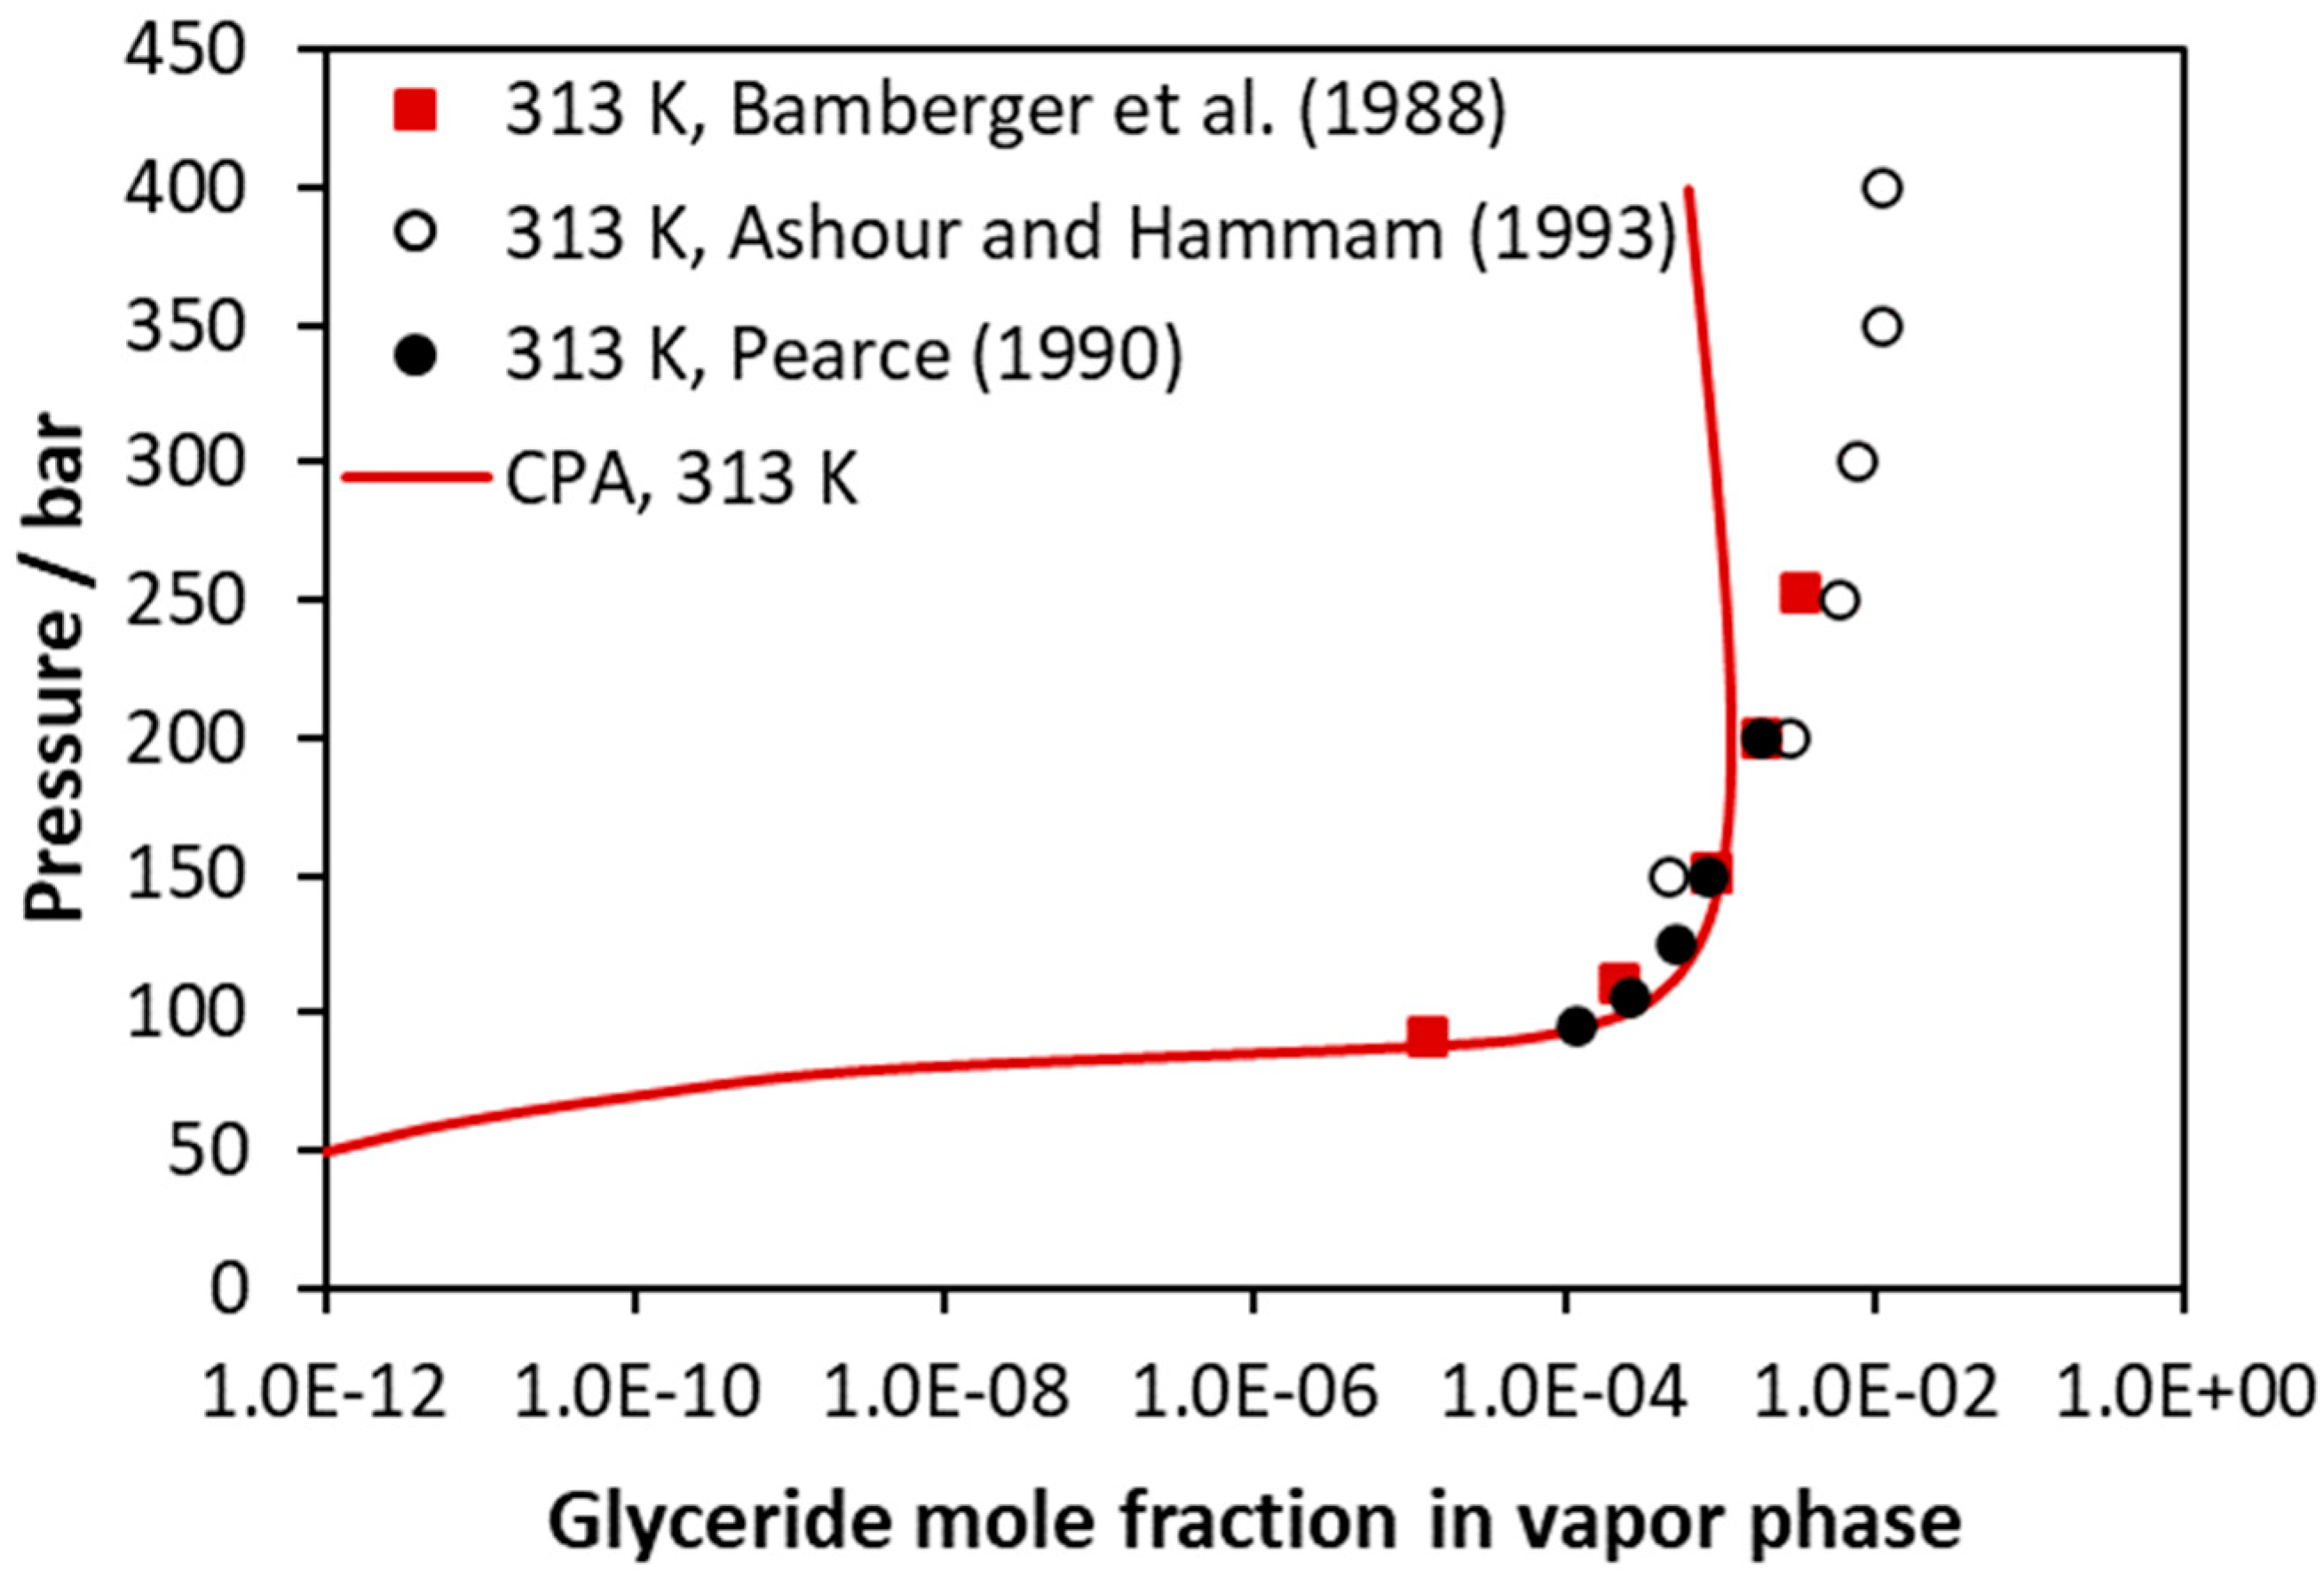
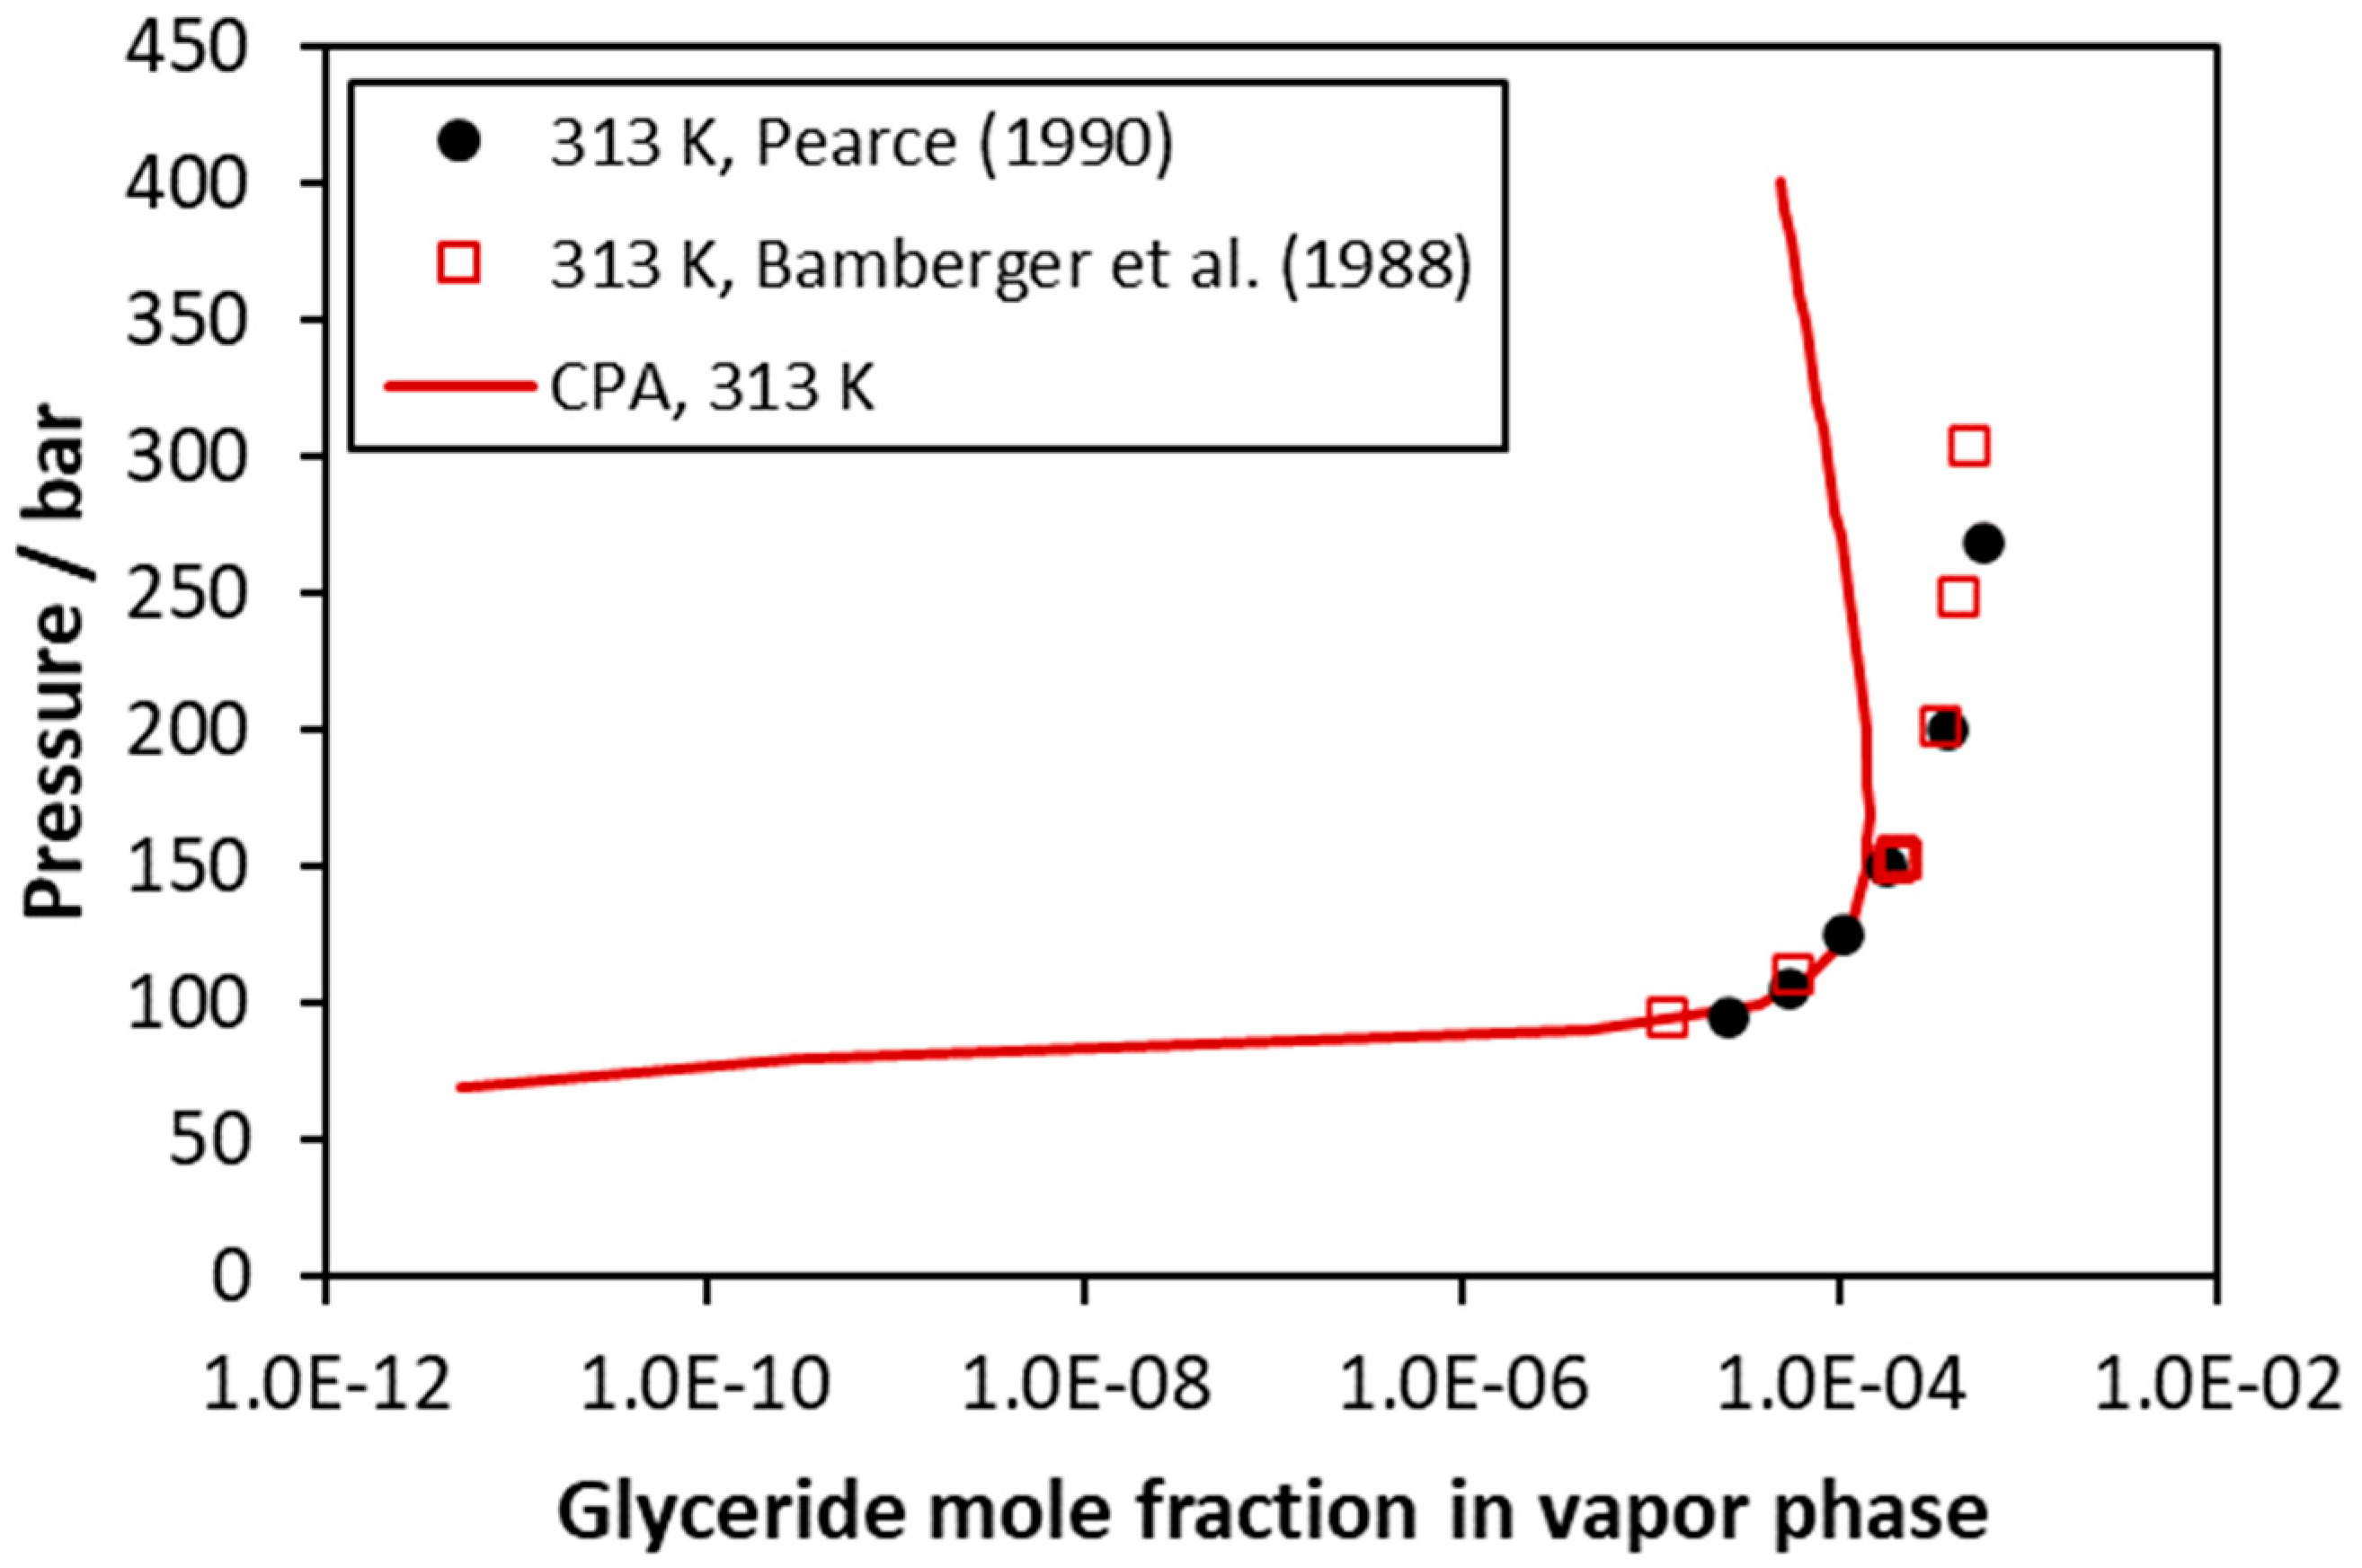
In contrast to polyethylene glycols, glycerol is a low-molecular-weight compound. It has three hydroxyls in each molecule, and consequently, it presents considerable hydrogen bonding. Furthermore, Tsivintzelis et al. showed that systems containing CO2 and alcohols are better described by the CPA model if strong specific interactions between the positively charged carbon atom of CO2 and the oxygen of the hydroxyl group are taken into consideration, as indicated by various ab initio studies, assuming one site that is able to cross-associate with alcohols on every CO2 molecule [29,31]. In addition, only using the same approach for CO2–low-molecular glycol systems, the very small concentration of glycols in the vapor phase can be adequately described [15].
In this work, the CO2–glycerol VLE was modeled using two approaches, i.e., assuming CO2 as inert compound and, secondly, assuming one positive site on every CO2 molecule that is only able to cross-associate with glycerol’s negative sites (the 3 × 2B association scheme was used for glycerol). Thus, only the binary interaction parameter (kij) was adjusted in the first case, while both the kij and the cross-association volume (βcross) were optimized in the second one (using the mCR-1 rule). The obtained binary parameters and the deviations of model calculations from experimental data are presented in Table 4. Some representative results are presented in Figure 3, while more results are shown in Figures S1–S6 of the supplementary information file. Similar conclusions to CO2–glycol mixtures [15] were obtained; i.e., using a single binary interaction parameter, the model satisfactorily describes the liquid phase, but only considering CO2 as a cross-associating compound and, consequently, using two adjustable binary parameters, the model satisfactorily describes the vapor phase compositions. Thus, such a mixture that presents various self- and cross-hydrogen-bonding interactions is better described if, in the CPA model, all possible association interactions are explicitly accounted for.
Here, it is worth mentioning that, as shown by the CPA correlations, the glycerol mole fraction in the vapor phase presents a minimum when plotted against pressure (Figure 3). This resembles the minimum that is observed for the CO2–water system and reflects the existence of vapor–liquid–liquid equilibrium in relatively low temperatures. Similarly to the minimum of CO2–water system, such behavior of the CO2–glycerol mixture, predicted by the model, may be of interest in various separation processes.

3.4. CO2–Glycerides

The phase behavior of five CO2–triglyceride mixtures containing tricaprylin, tributyrin, trilaurin, trimyristin, and triolein was investigated. In all cases, both CO2 and triglycerides were modeled as inert compounds, and only one temperature-independent binary parameter, kij, was used. The obtained binary parameter and the deviations of model calculations from experimental data are presented in Table 5. Overall, it was observed that the modeling of such mixtures present significant difficulty, mainly due to the very low concentration of the heavy compound (triglyceride) in the vapor phase. Forcing the model to satisfactorily describe the vapor phase increases the deviations for the liquid phase compositions. Consequently, in all cases the model correlations for the CO2 mole fraction of the liquid phase range between 5–11%.
In more detail, considering the CO2–tricaprylin system, representative calculations are presented in Figure 4 and in Figures S7 and S8 of the supplementary information file. The model represents very satisfactorily the very low vapor phase content of tricaprylin but underestimates to a low extent the CO2 mole fraction of the liquid phase.
Results for the CO2–tributyrin are shown in Figure 5 and Figures S9–S11 of the supplementary information file. For this system, the binary interaction parameter was adjusted solely to liquid phase data since data for the vapor phase are not available. The model shows satisfactory agreement with the experimental data.
Results for the CO2–trilaurin system are illustrated in Figure 6 and in Figures S12–S14 of the supporting information file. For this system, only one set of data for liquid phase compositions is available (see Figure S14 of the supporting information file), and consequently, the binary parameter was regressed using mainly vapor phase compositions, which, however, are available for high pressures. It is shown that the model satisfactorily describes the solubility of the glyceride in the vapor or the supercritical fluid phase up to approximately 200 bar, while higher deviations are observed for higher pressures.
Representative calculations for the CO2–trimyristin system are presented in Figure 7 and in Figures S15 and S16 of the supporting information file. No liquid phase compositions are available for this system, and consequently, the binary interaction parameter was adjusted only to vapor phase compositions. Similarly, for the CO2–trilaurin system, the model satisfactorily describes the very small solubility of trymyristin in the fluid phase up to approximately 200 bar, while higher deviations are observed at higher pressures.
Results for the CO2–triolein mixture are presented in Figure 8 and in Figures S17–S20 of the supplementary information file. As presented in these Figures, the experimental data are scattered, while for the glyceride content of the vapor phase, data from different sources may differ up to two orders of magnitude. As presented in Table 5, the model correlations present an average deviation form experimental glyceride mole fraction of the vapor phase equal to 139%, but to a large extent, such value is attributed to the scattering of the experimental data, and Figure 8 and Figures S17–S20 present the capabilities of the model in a more realistic way. Furthermore, the reader should have in mind that, as mentioned above, the triolein pure fluid parameters were predicted using appropriate correlations in absence of (confirmed) experimental data.

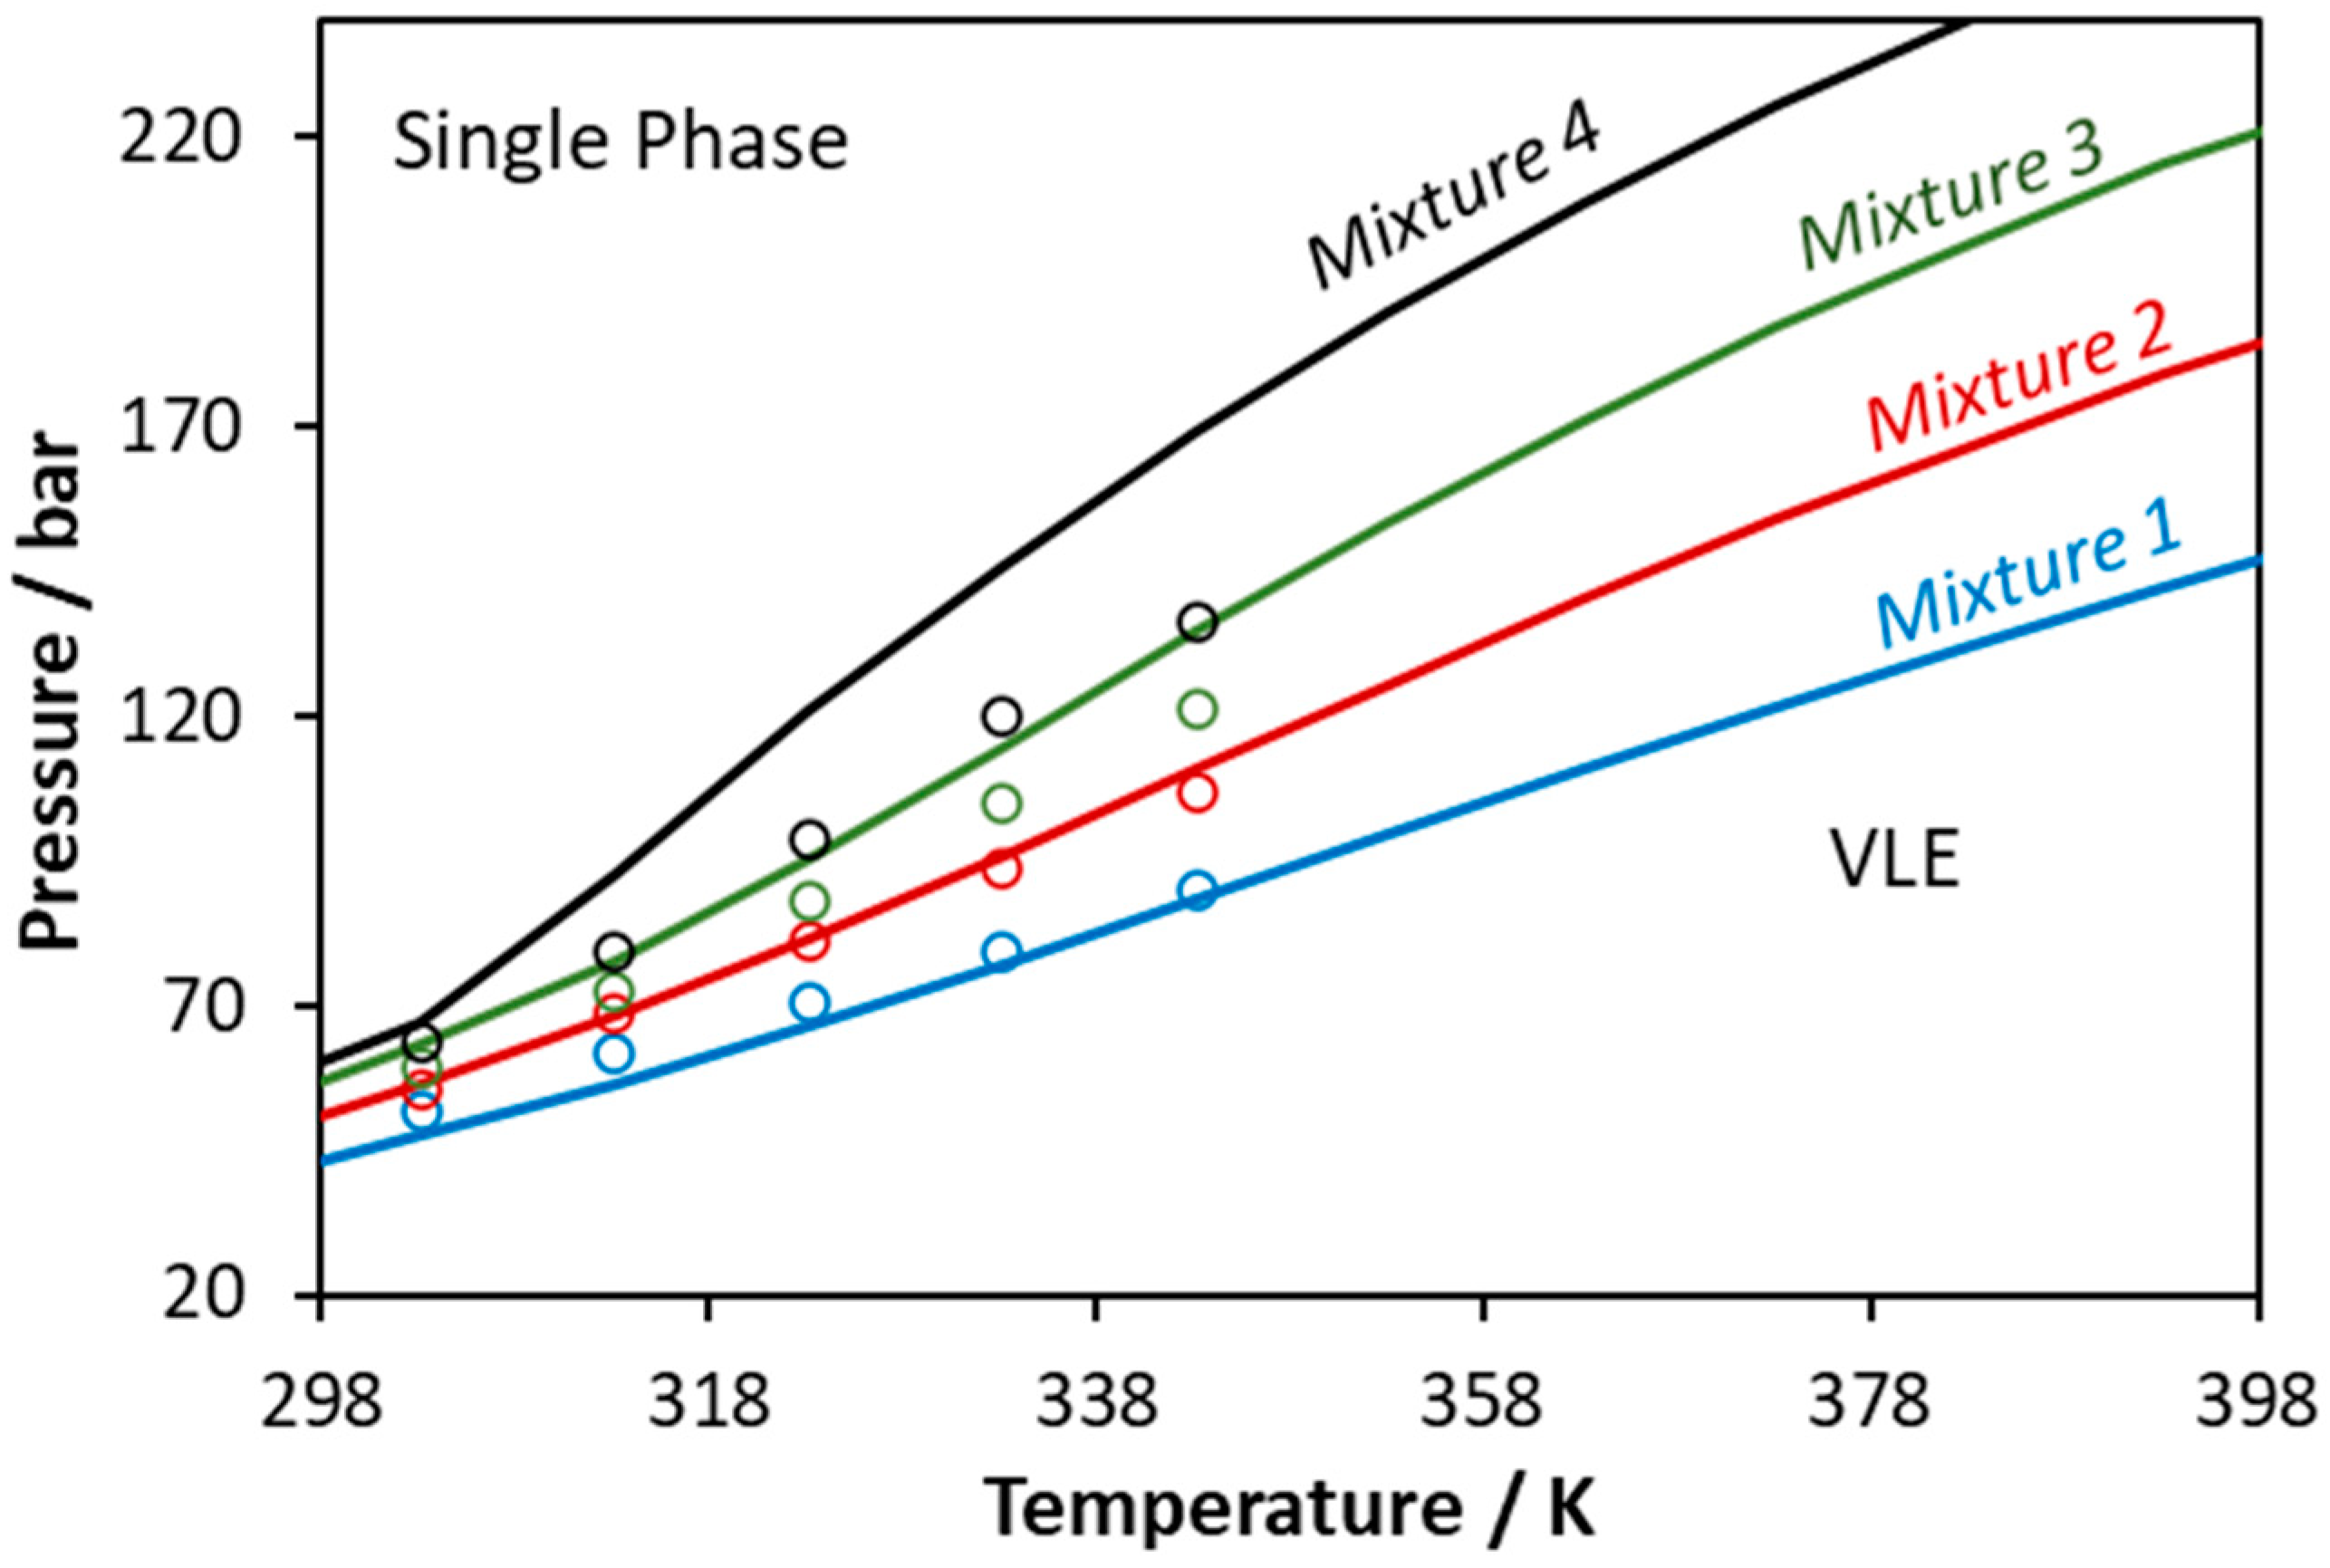
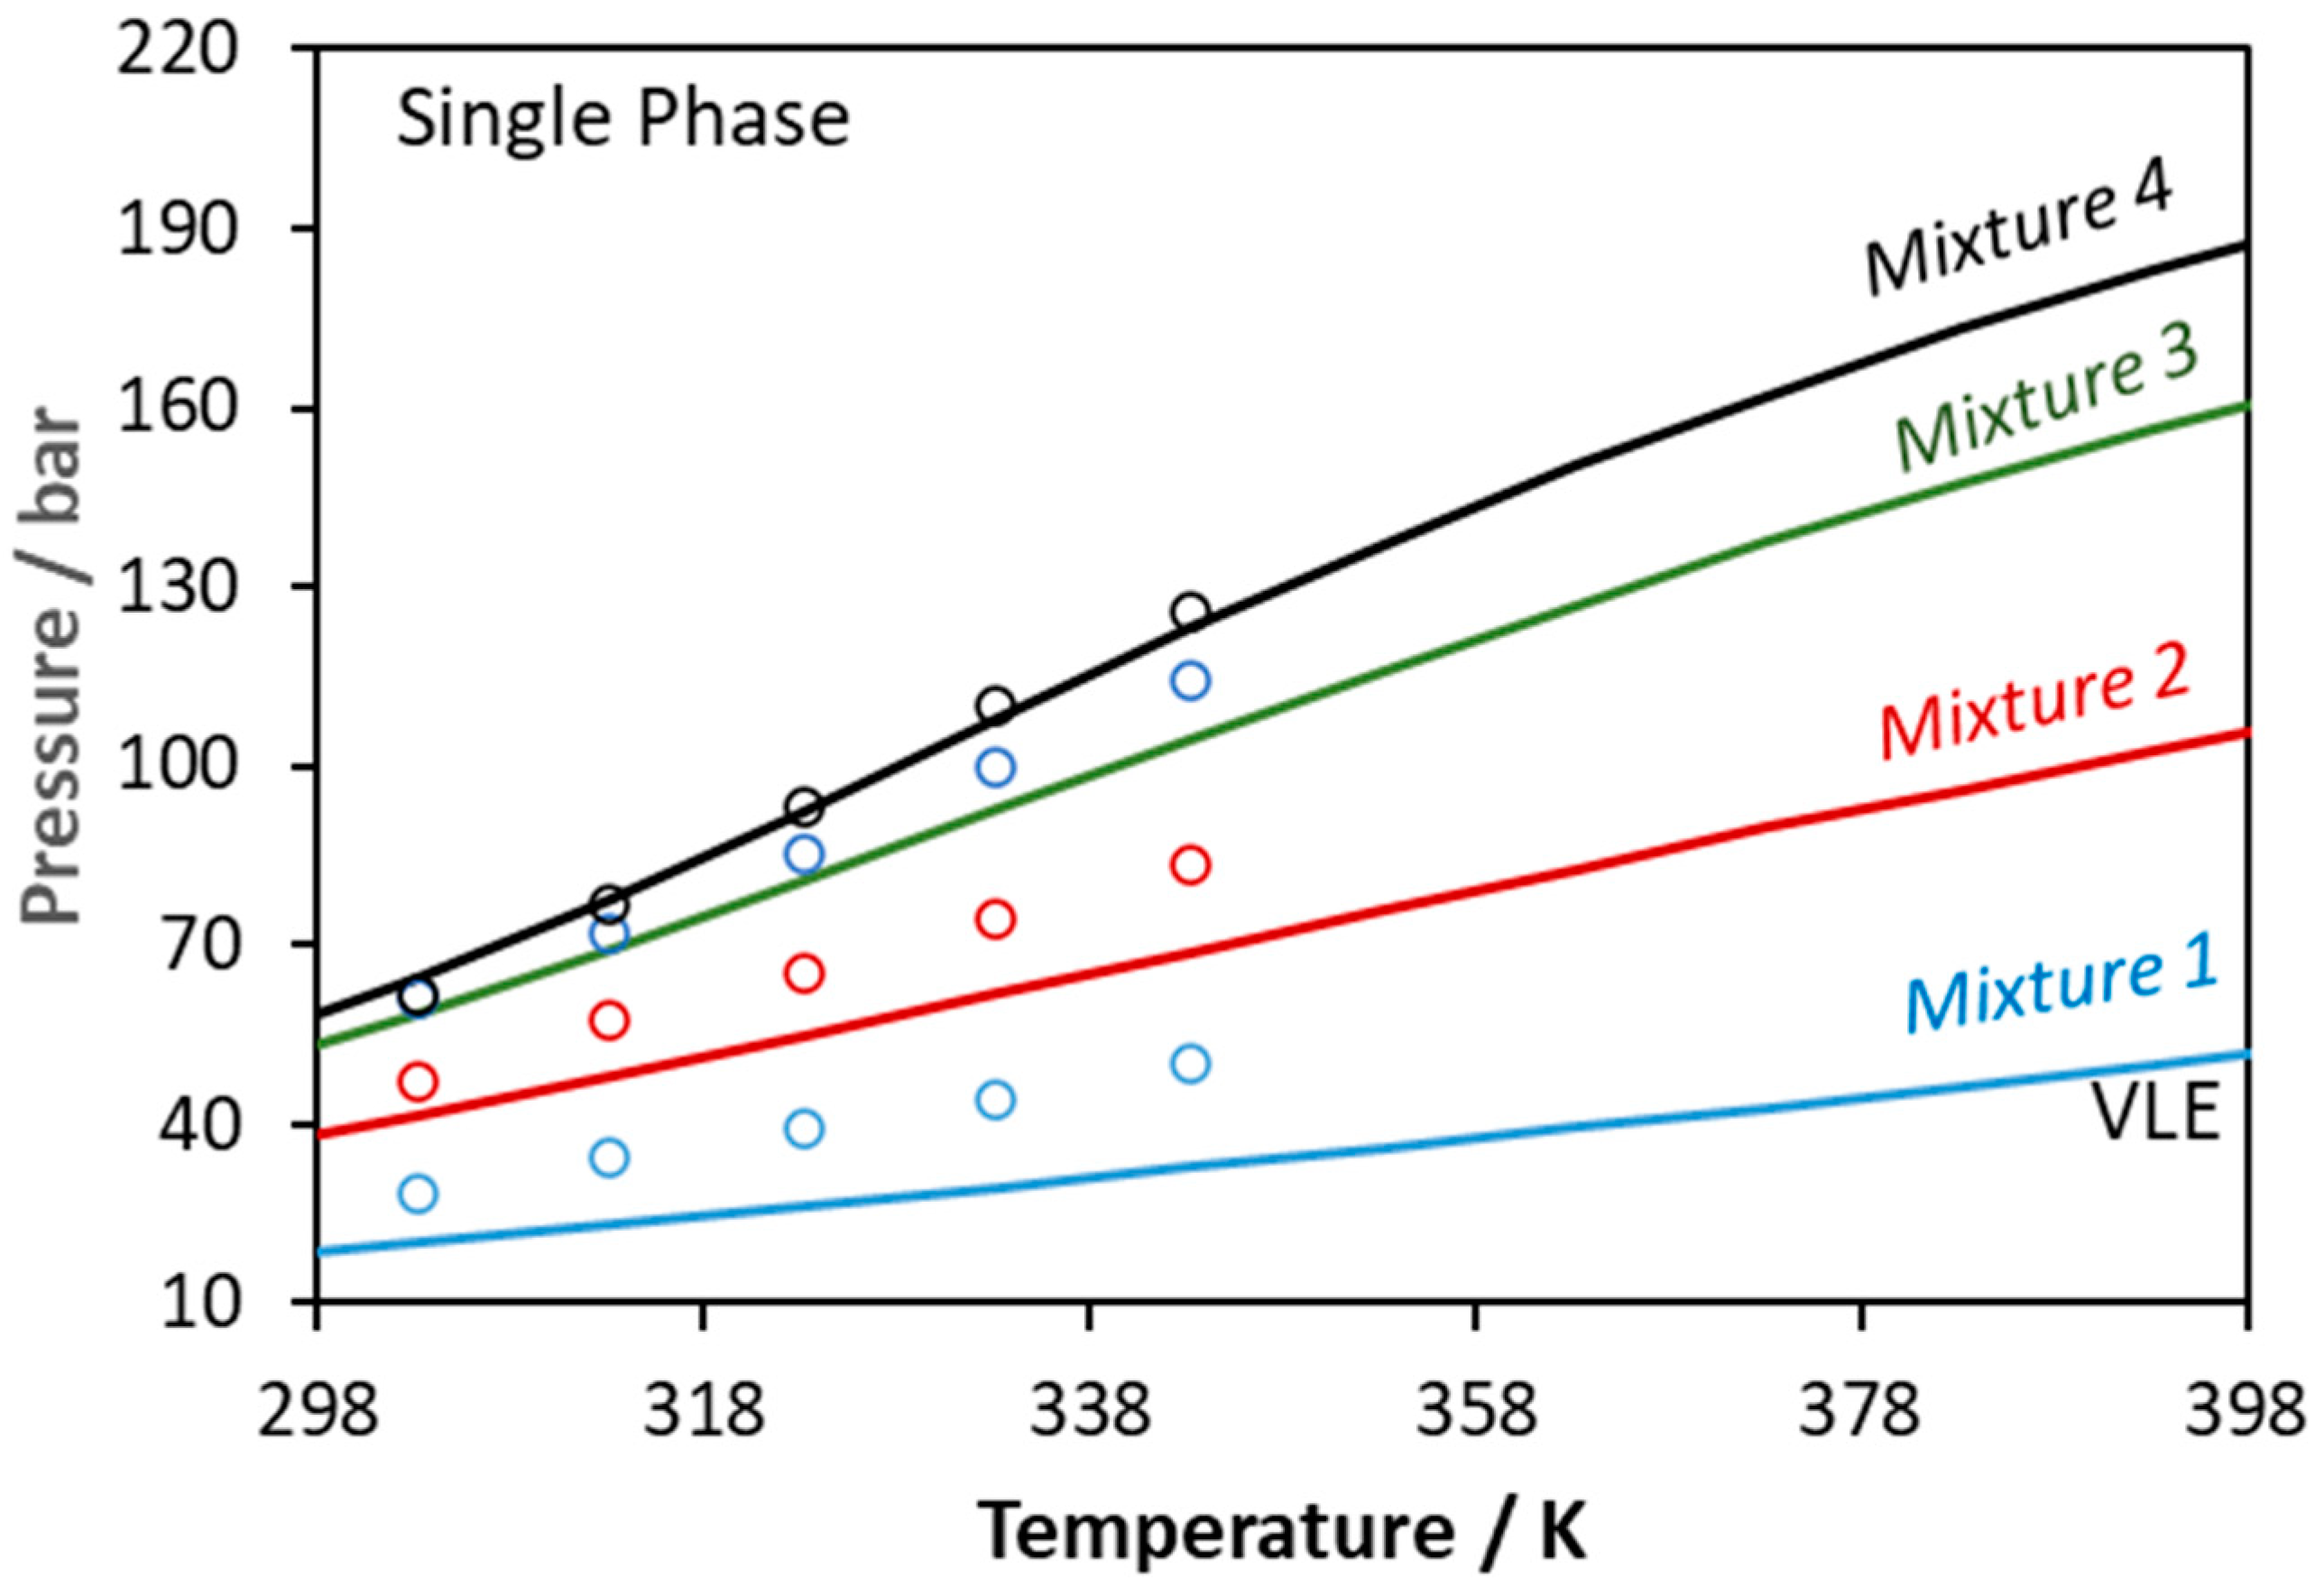
3.5. Ternary and Multicomponent Systems

Next, the model was applied to predict the phase behavior of ternary and multicomponent mixtures and the results were compared to experimental data from literature [55,56,57,58,59,60]. In all cases, no parameter was regressed using ternary or multicomponent systems data, but all binary parameters were adopted from the respective sub-binary mixtures. Consequently, the calculations that are presented in this section are considered as pure predictions. All the used binary parameters are presented in Table 6.
Initially, the model was applied to describe the vapor-liquid equilibrium of mixtures containing CO2 with glycerol and methanol or ethanol. In all cases, one positive association site was assumed on every CO2 molecule that is only able to cross-associate with the negative sites of glycerol, methanol, or ethanol, and consequently, the modified CR-1 (mCR-1) combining rule was used for estimating the cross-association parameters [31]. Further, as shown in Table 6, the glycerol–methanol (or ethanol) cross-association parameters were calculated using the CR-1 combining rule [31].
The obtained results are shown in Figure 9, Figure 10 and Figure 11. Considering the CO2–glycerol–methanol system, the model presents an average absolute deviation (in bubble point pressure) from the experimental data shown in Figure 9 [55] equal to 8% and from experimental data shown in Figure 11a [59] equal to 4%. As shown in Figure 9, deviations increase as the mixtures become richer in CO2.
On the other hand, considering the CO2–glycerol-ethanol system shown in Figure 10, the model describes in a more accurate way mixtures that are rich in CO2. In this case, the average absolute deviation (in bubble point pressure) from the experimental data shown in Figure 10 [56] and Figure 11b [60] is equal to 14% and 2%, respectively.
Next, CPA was applied to predict the phase behavior of the ternary CO2–methanol–lauric acid mixture. Such mixture is reactive since it contains both an alcohol and an organic acid, which renders the accurate measurement and modeling of the phase behavior a demanding task. Similarly to the previous systems, CO2 was modeled assuming one positive association site that can only cross-associate with methanol. The obtained results are presented in Figure 12. The model shows an average absolute deviation (in bubble point pressure) from the experimental data shown in Figure 12 [57] equal to 9%. Ferreira et al., who obtained the experimental data, used the Peng–Robinson EoS and in total six binary parameters (two binary parameters per sub-binary system), while two of them (those referring to the methanol–lauric acid mixture) were adjusted to the ternary system’s data [57]. According to their results, the experimental data are satisfactorily correlated.
Finally, the CPA EoS was applied to predict the phase behavior of a CO2 mixture with a real biodiesel sample (Figure 13). The experimental data from Araujo et al. were used, and biodiesel was considered as a multicomponent mixture of C16:0, C18:0, C18:1, C18:2, and C18:3 methyl esters, according to the analysis mentioned in that study [58]. The CO2–methyl ester binary interaction parameters were adopted from Tsivintzelis et al. [7], while, since such compounds have similar molecular structure, the corresponding ester-ester binary interaction parameter was set equal to zero. The overall average absolute deviations of model predictions from experimental data in CO2 mole fraction is 8% (7% for 323 K, 8% for 333 K, and 10% for 343 K). It is observed that the deviation increases with temperature; however, the performance of the model is considered rather satisfactory if we take into account that calculations are pure predictions and also the complexity of such multicomponent mixture.

4. Overview of Multicomponent Systems Modeled with the CPA EoS

This work completes an extensive work on modeling with the CPA EoS the phase behavior of mixtures relevant to the biodiesel process, which may contain methanol, ethanol, glycerol, fatty acids, esters of fatty acids, glycerides, and CO2. In this series of articles (this work and [7,8,30]), pure fluid parameters for such compounds are reported, along with correlations against the molecular weight or the van der Waals volume, which allow the prediction in cases of lack of experimental data. Moreover, the binary parameters for all corresponding binary systems are provided, and in many cases, correlations of such parameters with the van der Waals volume are reported. The capabilities and the limitations of the model are revealed through the prediction of the phase behavior of ternary and multicomponent systems without adjusting any parameter to such experimental data, but only using the sub-binary mixture parameters that were estimated solely from data for binary mixtures. Thus, no “fine-tuning” of those interaction parameters was performed by considering ternary or multicomponent systems data. In this sense, all calculations for ternary or multicomponent mixtures are considered as pure predictions.
In this work and in all our related previous works [7,8,30], we modeled alcohols using the 2B association scheme, water with the 4C association scheme, and glycerol with the 3 × 2B association scheme. In all cases, cross-association interactions among those hydrogen-bonding fluids were taken into consideration. Furthermore, esters of fatty acids, glycerides, and CO2 were modeled assuming that their molecules have sites that are only able to cross-associate with other hydrogen-bonding fluids such as alcohols, water, and glycerol. Using one or two binary parameters per binary system, the CPA EoS was able to satisfactorily correlate the phase behavior of binary mixtures. The same approach to account for cross-association interactions was used in ternary or multicomponent mixtures, and it was shown that the model presents a rather satisfactory prediction ability. Numerous ternary or multicomponent mixtures were investigated. Table 7 provides an overview of multicomponent mixtures considered in this work and our previous studies [7,8,30,61] but also in other literature studies with CPA calculations [18,19,20,21,22,23,24,25].

5. Conclusions

In this study, the CPA pure fluid parameters for polyethylene glycols were obtained by estimating the trends of such parameters with the molecular weight. Using one temperature-independent binary interaction parameter, the model accurately correlates the solubility of CO2 in liquid polyethylene glycols of various molecular weights.
Subsequently, the model was applied to describe the phase behavior of the CO2–glycerol system, and it was shown that accounting for cross-association interactions and using two temperature-independent binary parameters, the model accurately describes both phases in equilibrium and especially the vapor phase, which contains a very low amount of the heavy compound, rendering the accurate modeling of such systems difficult. In addition, CPA correlations revealed that the glycerol content of the vapor phase shows a minimum when plotted against pressure, which may be of interest in separation processes, similarly to the CO2–water system.
Then, the model was applied to correlate the phase behavior of CO2–triglycerides in a wide temperature range in cases for which experimental data are available. Using one temperature-independent parameter, the CPA EoS is able to describe rather satisfactorily the phase behavior, including the very low vapor phase content of the heavy compound. In order to obtain reasonable compositions for the vapor phase, relatively increased but still satisfactory deviations for the liquid phase were obtained.
Subsequently, the model was applied to predict the dew points of three ternary systems. Using no optimized parameters to such data, the model presents average absolute deviations in dew point pressures ranging from 6–14%. Finally, the CPA EoS rather satisfactorily predicted the VLE of a multicomponent mixture containing CO2 and a real biodiesel sample, showing an average absolute deviation on CO2 mole fractions equal to 8.2%.
This work completes a series of studies in modeling the phase behavior of mixtures relevant to the production of biodiesel [7,8,30]. In such studies, all pure fluid and binary parameters of most important systems are presented, and the predicting ability of the model is evaluated. It is shown that the CPA model presents a satisfactory prediction ability for such systems including mixtures of real biodiesel samples.

Supplementary Materials

The following supporting information can be downloaded at: https://www.mdpi.com/article/10.3390/molecules27185785/s1, Figure S1: CO2–glycerol VLE. Glycerol mole fraction in the vapor phase. Experimental data and CPA correlations using the interaction parameters of Table 4 of the main article; Figure S2: CO2–glycerol VLE. CO2 mole fraction in the liquid phase. Experimental data [41,42] and CPA correlations using the interaction parameters of Table 4 of the main article; Figure S3: CO2–glycerol VLE. CO2 mole fraction in the liquid phase. Experimental data [39,41,42] and CPA correlations using the interaction parameters of Table 4 of the main article; Figure S4: CO2–glycerol VLE. CO2 mole fraction in the liquid phase. Experimental data [42] and CPA correlations using the interaction parameters of Table 4 of the main article; Figure S5: CO2–glycerol VLE. CO2 mole fraction in the liquid phase. Experimental data [42] and CPA correlations using the interaction parameters of Table 4 of the main article; Figure S6: CO2–glycerol VLE. CO2 mole fraction in the liquid phase. Experimental data [39] and CPA correlations using the interaction parameters of Table 4 of the main article; Figure S7: CO2–tricaprilyn VLE at 313 K. Experimental data [43,44] and CPA correlations using the binary parameter of Table 5 of the main article; Figure S8: CO2–tricaprilyn VLE at 393 K. Experimental data [43] and CPA correlations using the binary parameter of Table 5 of the main article; Figure S9: CO2–tributyrin VLE at 288 K. Experimental data [44,45] and CPA correlations using the binary parameter of Table 5 of the main article; Figure S10: CO2–tributyrin VLE at 303 K. Experimental data [44,45] and CPA correlations using the binary parameter of Table 5 of the main article; Figure S11: CO2–tributyrin VLE at 338 K. data [44,45] and CPA correlations using the binary parameter of Table 5 of the main article; Figure S12: CO2–trilaurin VLE and LLE at 308 K. Experimental data [48,49] and CPA correlations using the binary parameter of Table 5 of the main article; Figure S13: CO2–trilaurin VLE at 328 K. Experimental data [48] and CPA correlations using the binary parameter of Table 5 of the main article; Figure S14: CO2–trilaurin VLE at 353 K. Experimental data [47] and CPA correlations using the binary parameter of Table 5 of the main article; Figure S15: CO2–trimyristin VLE at 308 K. Experimental data [48] and CPA correlations using the binary parameter of Table 5 of the main article; Figure S16: CO2–trimyristin VLE at 328 K. Experimental data [48] and CPA correlations using the binary parameter of Table 5 of the main article; Figure S17: CO2–triolein VLE at 313 K (vapor phase compositions). Experimental data [53,54] and CPA correlations using the binary parameter of Table 5 of the main article; Figure S18: CO2–triolein VLE at 323 K (vapor phase compositions). Experimental data [50,53,54] and CPA correlations using the binary parameter of Table 5 of the main article; Figure S19: CO2–triolein VLE at 333 K. Experimental data [51,52,53] and CPA correlations using the binary parameter of Table 5 of the main article; Figure S20. CO2–triolein VLE at 343 K. Experimental data [52,53] and CPA correlations using the binary parameter of Table 5 of the main article.

Author Contributions

Conceptualization, I.T. and G.M.K.; methodology, I.T.; software, I.T. and G.K.; validation, I.T. and G.M.K.; formal analysis, I.T. and G.K.; investigation, I.T. and G.K.; resources, I.T.; writing—original draft preparation, I.T.; writing—review and editing, I.T. and G.M.K.; visualization, I.T. and G.K.; supervision, I.T. All authors have read and agreed to the published version of the manuscript.

Funding

This research received no external funding.

Institutional Review Board Statement

Not applicable.

Informed Consent Statement

Not applicable.

Data Availability Statement

Not applicable.

Conflicts of Interest

The authors declare no conflict of interest.

Sample Availability

Not applicable.

References

  1. Temelli, F. Perspectives on supercritical fluid processing of fats and oils. J. Supercrit. Fluids 2009, 47, 583–590. [Google Scholar] [CrossRef]
  2. Kultys, E.; Kurek, M.A. Green Extraction of Carotenoids from Fruit and Vegetable Byproducts: A Review. Molecules 2022, 27, 518. [Google Scholar] [CrossRef] [PubMed]
  3. Baranauskienė, R.; Venskutonis, P.R. Supercritical CO2 Extraction of Narcissus poeticus L. Flowers for the Isolation of Volatile Fragrance Compounds. Molecules 2022, 27, 353. [Google Scholar] [CrossRef] [PubMed]
  4. Macaira, J.; Santana, A.; Costa, A.; Ramirez, E.; Larroyoz, M.A. Process intensification using CO2 as a cosolvent under super-critical conditions applied to design of biodiesel production. Ind. Eng. Chem. Res. 2014, 53, 3985–3995. [Google Scholar] [CrossRef]
  5. Kenarsari, S.D.; Yang, D.; Jiang, G.; Zhang, S.; Wang, J.; Russell, A.G.; Wei, Q.; Fan, M. Review of recent advances in carbon dioxide separation and capture. RSC Adv. 2013, 3, 22739–22773. [Google Scholar] [CrossRef]
  6. Tsivintzelis, I.; Kontogeorgis, G.M.; Panayiotou, C. Dimerization of Carboxylic Acids: An Equation of State Approach. J. Phys. Chem. B 2017, 121, 2153–2163. [Google Scholar] [CrossRef]
  7. Tsivintzelis, I.; Ali, S.; Kontogeorgis, G.M. Modeling systems relevant to the biodiesel production using the CPA equation of state. Fluid Phase Equilibria 2016, 430, 75–92. [Google Scholar] [CrossRef]
  8. Tsivintzelis, I.; Ali, S.; Kontogeorgis, G.M. Modeling systems relevant to the biodiesel production using the CPA equation of state. Part 2. Systems with supercritical CO2. Fluid Phase Equilibria 2019, 504, 112337. [Google Scholar] [CrossRef]
  9. Kontogeorgis, G.M.; Voutsas, E.C.; Yakoumis, I.V.; Tassios, D.P. An Equation of State for Associating Fluids. Ind. Eng. Chem. Res. 1996, 35, 4310–4318. [Google Scholar] [CrossRef]
  10. Kontogeorgis, G.M.; Michelsen, M.L.; Folas, G.K.; Derawi, S.; von Solms, N.; Stenby, E.H. Ten years with the CPA (Cubic-Plus-Association) equation of state. Part 1. Pure compounds and self-associating systems. Ind. Eng. Chem. Res. 2006, 45, 4855–4868. [Google Scholar] [CrossRef]
  11. Kontogeorgis, G.M.; Michelsen, M.L.; Folas, G.K.; Derawi, S.; von Solms, N.; Stenby, E.H. Ten years with the CPA (Cubic-Plus-Association) equation of state. Part 2. Cross-associating and multicomponent systems. Ind. Eng. Chem. Res. 2006, 45, 4869–4878. [Google Scholar] [CrossRef]
  12. Derawi, S.O.; Kontogeorgis, G.M.; Michelsen, M.L.; Stenby, E.H. Extension of the Cubic-Plus-Association Equation of State to Glycol−Water Cross-Associating Systems. Ind. Eng. Chem. Res. 2003, 42, 1470–1477. [Google Scholar] [CrossRef]
  13. Breil, M.P.; Kontogeorgis, G.M. Thermodynamics of Triethylene Glycol and Tetraethylene Glycol Containing Systems De-scribed by the Cubic-Plus-Association Equation of State. Ind. Eng. Chem. Res. 2009, 48, 5472–5480. [Google Scholar] [CrossRef]
  14. Arya, A.; Maribo-Mogensen, B.; Tsivintzelis, I.; Kontogeorgis, G. Process Design of Industrial Triethylene Glycol Processes Using the Cubic-Plus-Association (CPA) Equation of State. Ind. Eng. Chem. Res. 2014, 53, 11766–11778. [Google Scholar] [CrossRef]
  15. Tsivintzelis, I.; Kontogeorgis, G.M. Modelling phase equilibria for acid gas mixtures using the CPA equation of state. Part VI. Multicomponent mixtures with glycols relevant to oil and gas and to liquid or supercritical CO2 transport applications. J. Chem. Thermodyn. 2016, 93, 305–319. [Google Scholar] [CrossRef]
  16. Tsivintzelis, I.; Bjørner, M.G.; Kontogeorgis, G.M. Recent advances with association models for practical applications. Mol. Phys. 2018, 116, 1921–1944. [Google Scholar] [CrossRef]
  17. Oliveira, M.; Marrucho, I.; Coutinho, J.; Queimada, A. Surface tension of chain molecules through a combination of the gradient theory with the CPA EoS. Fluid Phase Equilibria 2008, 267, 83–91. [Google Scholar] [CrossRef]
  18. Oliveira, M.B.; Varanda, F.R.; Marrucho, I.; Queimada, A.J.; Coutinho, J. Prediction of Water Solubility in Biodiesel with the CPA Equation of State. Ind. Eng. Chem. Res. 2008, 47, 4278–4285. [Google Scholar] [CrossRef]
  19. Oliveira, M.B.; Teles, A.R.R.; Queimada, A.J.; Coutinho, J.A.P. Phase equilibria of glycerol containing systems and their de-scription with the Cubic-Plus-Association (CPA) equation of state. Fluid Phase Equilibria 2009, 280, 22–29. [Google Scholar] [CrossRef]
  20. Oliveira, M.B.; Queimada, A.J.; Coutinho, J.A. Modeling of Biodiesel Multicomponent Systems with the Cubic-Plus-Association (CPA) Equation of State. Ind. Eng. Chem. Res. 2009, 49, 1419–1427. [Google Scholar] [CrossRef]
  21. Oliveira, M.B.; Queimada, A.J.; Kontogeorgisc, G.M.; Coutinho, J.A.P. Evaluation of the CO2 behavior in binary mixtures with alkanes, alcohols, acids and esters using the Cubic-Plus-Association equation of state. J. Supercrit. Fluids 2011, 55, 876–892. [Google Scholar] [CrossRef]
  22. Follegatti-Romero, L.A.; Lanza, M.; Batista, F.R.M.; Batista, E.A.C.; Oliveira, M.B.; Coutinho, J.A.P.; Meirelles, J.A. Liquid-Liquid equilibrium for ternary systems containing ethyl esters, anhydrous ethanol and water at 298.15, 313.15 and 333.15 K. Ind. Eng. Chem. Res. 2010, 49, 12613–12619. [Google Scholar] [CrossRef]
  23. Oliveira, M.B.; Barbedo, S.; Soletti, J.I.; Carvalho, S.H.; Queimada, A.J.; Coutinho, J.A. Liquid–liquid equilibria for the canola oil biodiesel + ethanol + glycerol system. Fuel 2011, 90, 2738–2745. [Google Scholar] [CrossRef]
  24. Oliveira, M.B.; Ribeiro, V.; Quemada, A.J.; Coutinho, J.A.P. Modeling phase equilibria relevant to biodiesel production: A comparison of GE models, Cubic EoS, EoS-GE and association EoS. Ind. Eng. Chem. Res. 2011, 50, 2348–2358. [Google Scholar] [CrossRef]
  25. Follegatti-Romero, L.A.; Oliveira, M.B.; Batista, F.R.M.; Batista, E.A.C.; Coutinho, J.A.P.; Meirelles, J.A.A. Liquid-Liquid equilibrium for ternary systems containing ethyl esters, ethanol and glycerol at 323.15 and 353.15 K. Fuel 2012, 94, 386–394. [Google Scholar] [CrossRef]
  26. Li, Y.; Qiao, Z.; Sun, S.; Zhang, T. Thermodynamic modeling of CO2 solubility in saline water using NVT flash with the cubic-plus-association equation of state. Fluid Phase Equilib. 2020, 520, 112657. [Google Scholar] [CrossRef]
  27. Tsivintzelis, I.; Shahid, A.; Kontogeorgis, G.M. Modeling phase equilibria for acid gas mixtures using the CPA equation of state. Part 3. Applications relevant to liquid or supercritical CO2 transport. J. Chem. Eng. Data 2014, 59, 2955–2972. [Google Scholar] [CrossRef]
  28. Tsivintzelis, I.; Ali, S.; Kontogeorgis, G.M. Modeling phase equilibria for acid gas mixtures using the CPA equation of state. Part IV. Applications to mixtures of CO2 with alkanes. Fluid Phase Equilibria 2015, 397, 1–17. [Google Scholar] [CrossRef]
  29. Tsivintzelis, I.; Kontogeorgis, G.M. Modeling Phase Equilibria for Acid Gas Mixtures using the CPA Equation of State. Part V. Multicomponent mixtures of containing CO2 and alcohols. J. Supercrit. Fluids 2015, 104, 29–39. [Google Scholar] [CrossRef]
  30. Tsivintzelis, I.; Karakatsani, E.; Kontogeorgis, G.M. Costa Tsonopoulos—his legacy and some personal reflections on cubic equations of state and beyond. Fluid Phase Equilibria 2020, 533, 112895. [Google Scholar] [CrossRef]
  31. Tsivintzelis, I.; Kontogeorgis, G.M.; Michelsen, M.L.; Stenby, E.H. Modeling phase equilibria for acid gas mixtures using the CPA equation of state. Part II: Binary mixtures with CO2. Fluid Phase Equilibria 2011, 306, 38–56. [Google Scholar] [CrossRef]
  32. DIPPR 801 Thermophysical Property Database and DIADEM Predictive Proffesional 2011 Version 5.0.1.
  33. Kontogeorgis, G.M.; Folas, G.K. Thermodynamic models for industrial applications. In From Classical and Advanced Mixing Rules to Association Theories, 1st ed.; John Wiley and Sons: Hoboken, NJ, USA, 2010. [Google Scholar]
  34. Stefanis, E.; Constantinou, L.; Tsivintzelis, I.; Panayiotou, C. New group-contribution method for predicting temperature-dependent properties of pure organic compounds. Int. J. Thermophys. 2005, 26, 1369–1388. [Google Scholar] [CrossRef]
  35. Papaioannou, V.; Adjiman, C.S.; Jackson, G.; Galindo, A. Group contribution methodologies for the prediction of thermodynamic properties and phase behavior in mixtures. In Process Systems Engineering: Molecular Systems Engineering; Adjiman, C.S., Galindo, A., Eds.; Wiley-VCH: Weinheim, Germany, 2011; Volume 6, Chapter 4; pp. 135–172. [Google Scholar]
  36. Poling, B.E.; Prausnitz, J.M.; O’Connel, J.P. The Properties of Gases and Liquids, 5th ed.; Mc-Graw Hill: New York, NY, USA, 2001. [Google Scholar]
  37. Folas, G.K.; Kontogeorgis, G.M.; Michelsen, A.M.L.; Stenby, E.H. Application of the Cubic-Plus-Association Equation of State to Mixtures with Polar Chemicals and High Pressures. Ind. Eng. Chem. Res. 2006, 45, 1516–1526. [Google Scholar] [CrossRef]
  38. Li, J.; Ye, Y.; Chen, L.; Qi, Z. Solubilities of CO2 in Poly(ethylene glycols) from (303.15 to 333.15) K. J. Chem. Eng. Data 2012, 57, 610–616. [Google Scholar]
  39. Nunes, A.V.; Carrera, G.V.; Najdanovic-Visak, V.; da Ponte, M.N. Solubility of CO2 in glycerol at high pressures. Fluid Phase Equilibria 2013, 358, 105–107. [Google Scholar] [CrossRef]
  40. Sovová, H.; Jez, J.; Khachaturyan, M. Solubility of squalane, dinonyl phthalate and glycerol in supercritical CO2. Fluid Phase Equilibria 1997, 137, 185–191. [Google Scholar] [CrossRef]
  41. Ostonen, A.; Sapei, E.; Uusi-Kyyny, P.; Klemela, A.; Alopaeus, V. Measurements and modeling of CO2 solubility in1,8-diazabicyclo-[5.4.0]-undec-7-ene-Glycerol solutions. Fluid Phase Equilibria 2014, 374, 25–36. [Google Scholar] [CrossRef]
  42. Décultot, M.; Ledoux, A.; Fournier-Salaün, M.-C.; Estel, L. Solubility of CO2 in methanol, ethanol, 1,2-propanediol and glycerol from 283.15 K to 373.15 K and up to 6.0 MPa. J. Chem. Thermodyn. 2019, 138, 67–77. [Google Scholar] [CrossRef]
  43. Borch-Jensen, C.; Mollerup, J. Phase equilibria of carbon dioxide and tricaprylin. J. Supercrit. Fluids 1997, 10, 87–93. [Google Scholar] [CrossRef]
  44. Florusse, L.; Fornari, T.; Bottini, S.; Peters, C. Phase behavior of carbon dioxide—low-molecular weight triglycerides binary systems: Measurements and thermodynamic modeling. J. Supercrit. Fluids 2004, 31, 123–132. [Google Scholar] [CrossRef]
  45. Howlader, S.; Venkatesan, S.; Goel, H.; Huda, M.; French, W.T.; Rai, N. Solubility of CO2 in triglycerides using Monte Carlo simulations. Fluid Phase Equilibria 2018, 476, 39–47. [Google Scholar] [CrossRef]
  46. Bamberger, T.; Erickson, J.C.; Cooney, C.L.; Kumar, S.K. Measurement and model prediction of solubilities of pure fatty acids, pure triglycerides, and mixtures of triglycerides in supercritical carbon dioxide. J. Chem. Eng. Data 1988, 33, 327–333. [Google Scholar] [CrossRef]
  47. Bharath, R.; Yamane, S.; Inomata, H.; Adschiri, T.; Arai, K. Phase equilibria of supercritical CO2-fatty oil component binary systems. Fluid Phase Equilibria 1993, 83, 183–192. [Google Scholar] [CrossRef]
  48. Pearce, D.L. Solubility of Triglycerides in Supercritical Carbon Dioxide. Ph.D. Thesis, University of Canterbury, Christchurch, New Zealand, 1990. [Google Scholar]
  49. Ashour, I.; Hammam, H. Equilibrium Solubility of Pure Mono-, Di-, and Trilaurin in Supercritical Carbon Dioxide-Experimental Measurements and Model Prediction. J. Supercrit. Fluids 1993, 6, 3–8. [Google Scholar] [CrossRef]
  50. Nilsson, W.B.; Gauglitz, E.J., Jr.; Hudson, J.K. Solubilities of Methyl Oleate, Oleic Acid, Oleyl Glycerols, Glycerol Mixtures in Supercritical Carbon Dioxide. JAOCS 1991, 68, 87–91. [Google Scholar] [CrossRef]
  51. Weber, W.; Petkov, S.; Brunner, G. Vapour–liquid-equilibria and calculations using the Redlich–Kwong-Aspen-equation of state for tristearin, tripalmitin, and triolein in CO2 and propane. Fluid Phase Equilibria 1999, 158–160, 695–706. [Google Scholar] [CrossRef]
  52. Perko, T.; Knez, Z.; Škerget, M. Phase Equilibria of Glycerol Tristearate and Glycerol Trioleate in Carbon Dioxide and Sulfur Hexafluoride. J. Chem. Eng. Data 2012, 57, 3604–3610. [Google Scholar] [CrossRef]
  53. Chrastil, J. Solubility of solids and liquids in supercritical gases. J. Phys. Chem. 1982, 86, 3016–3021. [Google Scholar] [CrossRef]
  54. Ribeiro, M.A.; Bernardo-Gil, M.G. Solubilities of Triolein in Supercritical CO2. J. Chem. Eng. Data 1995, 40, 1188–1192. [Google Scholar] [CrossRef]
  55. Ferreira-Pinto, L.; Ndiaye, P.; Ramos, L.P.; Corazza, M.L. Phase equilibrium data of the system CO2+glycerol+methanol at high pressures. J. Supercrit. Fluids 2011, 59, 1–7. [Google Scholar] [CrossRef]
  56. Araújo, O.A.; Ndiaye, P.M.; Ramos, L.P.; Corazza, M.L. Phase behavior measurement for the system CO2+glycerol+ethanol at high pressures. J. Supercrit. Fluids 2011, 62, 41–46. [Google Scholar] [CrossRef]
  57. Ferreira, F.M.; Ramos, L.P.; Ndiaye, P.M.; Corazza, M.L. Phase behavior of (CO2+methanol+lauric acid) system. J. Chem. Thermodyn. 2011, 43, 1074–1082. [Google Scholar] [CrossRef]
  58. Araújo, O.A.; Silva, F.R.; Ramos, L.P.; Lenzi, M.K.; Ndiaye, P.M.; Corazza, M.L. Phase behaviour measurements for the system (carbon dioxide + biodiesel + ethanol) at high pressures. J. Chem. Thermodyn. 2012, 47, 412–419. [Google Scholar] [CrossRef]
  59. Carrera, G.V.; Visak, Z.P.; Lukasik, R.M.; Da Ponte, M.N. CO2 + Methanol + Glycerol: Multiphase behaviour. J. Supercrit. Fluids 2018, 141, 260–264. [Google Scholar] [CrossRef]
  60. Carrera, G.; Visak, Z.; Bogel-Lukasik, R.; da Ponte, M.N. VLE of CO2+glycerol+(ethanol or 1-propanol or 1-butanol). Fluid Phase Equilibria 2011, 303, 180–183. [Google Scholar] [CrossRef]
  61. Tsivintzelis, I.; Musko, N.E.; Baiker, A.; Grunwaldt, J.-D.; Kontogeorgis, G.M. Experimental determination and modeling of the phase behavior for the direct synthesis of dimethyl carbonate from methanol and carbon dioxide. J. Supercrit. Fluids 2013, 84, 155–163. [Google Scholar] [CrossRef]
Figure 1. Correlations of pure fluid parameters for glycols and extension to higher molecular weights.
Molecules 27 05785 g001
Figure 2. Solubility of CO2 in polyethylene glycols. Experimental data (points [38]) and CPA calculations (lines) using the kij values of Table 3.
Molecules 27 05785 g002
Figure 3. CO2–glycerol VLE. CO2 mole fraction in the liquid phase and glycerol mole fraction in the vapor phase. Experimental data [39,40,41,42] and CPA correlations using the interaction parameters of Table 4.
Molecules 27 05785 g003
Figure 4. CO2–tricaprilyn VLE at 353 K. Experimental data [43] and CPA correlations using the binary interaction parameter of Table 5.
Molecules 27 05785 g004
Figure 5. CO2–tributyrin VLE at 298 K. Experimental data [44,45] and CPA correlations using the binary interaction parameter of Table 5.
Molecules 27 05785 g005
Figure 6. CO2–trilaurin VLE at 313 K (vapor phase compositions). Experimental data [46,48,49] and CPA correlations using the binary interaction parameter of Table 5.
Molecules 27 05785 g006
Figure 7. CO2–trimyristin VLE at 313 K (vapor phase compositions). Experimental data [46,48] and CPA correlations using the binary interaction parameter of Table 5.
Molecules 27 05785 g007
Figure 8. CO2–triolein VLE at 353 K. Experimental data [51,53] and CPA correlations using the binary interaction parameter of Table 5.
Molecules 27 05785 g008
Figure 9. Phase boundaries for CO2–glycerol–methanol ternary system. Experimental data (points, [55]) and CPA predictions using the binary interaction parameters of Table 6 (Mixture 1: xCO2 = 0.3373, xglycerol = 0.0212, xmethanol = 0.6415; Mixture 2: xCO2 = 0.4352, xglycerol = 0.0180, xmethanol = 0.5468; Mixture 3: xCO2 = 0.5359, xglycerol = 0.0148, xmethanol = 0.4493; Mixture 4: xCO2 = 0.6430, xglycerol = 0.0114, xmethanol = 0.3456).
Molecules 27 05785 g009
Figure 10. Phase boundaries for CO2–glycerol–ethanol ternary system. Experimental data (points, [56]) and CPA predictions using the binary interaction parameters of Table 6 (Mixture 1: xCO2 = 0.1333, xglycerol = 0.0413, xethanol = 0.8254; Mixture 2: xCO2 = 0.2808, xglycerol = 0.0342, xethanol = 0.6850; Mixture 3: xCO2 = 0.4276, xglycerol = 0.0273, xethanol = 0.5451; Mixture 4: xCO2 = 0.4985, xglycerol = 0.0239, xethanol = 0.4776).
Molecules 27 05785 g010
Figure 11. CO2 mole fractions in liquid and vapor phases of (a) CO2–glycerol–methanol and (b) CO2–glycerol–ethanol ternary systems containing alcohol to glycerol ratio equal to 113. Experimental data [59,60] and CPA predictions using the binary interaction parameters of Table 6.
Molecules 27 05785 g011
Figure 12. Phase boundaries for CO2–methanol–lauric acid ternary system. Experimental data (points, [57]) and CPA predictions using the binary interaction parameters of Table 6 (Mixture 1: xCO2 = 0.6675, xmethanol = 0.2217, xlauric acid = 0.1108; Mixture 2: xCO2 = 0.7492, xmethanol = 0.1672, xlauric acid = 0.0836; Mixture 3: xCO2 = 0.8248, xmethanol = 0.1168, xlauric acid = 0.0584).
Molecules 27 05785 g012
Figure 13. VLE of CO2–biodiesel system. Experimental data (points, [58]) and CPA predictions (lines) using the binary interaction parameters of Table 6.
Molecules 27 05785 g013
Table 1. Pure fluid parameters (the association scheme is mentioned in parenthesis).
FluidTemp. Range (K)Tc (K)a0
(L2 bar/moL2)
b
(L/moL)
c1ε
(bar L/moL)
β% AAD a
Psat/Vmolar
Ref.
CO2216–274304.23.50790.02720.7602-- [31]
Methanol-512.64.05310.03100.4310245.910.01610.6/0.5[37]
Ethanol-513.98.67160.04910.7369215.320.00801.3/0.3[37]
Glycerol (3 × 2B)340–680850.011.800.06960.90207.850.01330.7/1.8[7]
Ethylene glycol (4C)290–576720.013.2590.05210.9245143.370.01882.6/1.5This work
Diethylene glycol (4C)324–596744.624.0290.09221.2409143.370.01884.2/1.3This work
Triethylene glycol (4C)347–616769.538.4850.13231.2254143.370.01884.1/1.5This work
Tetraethylene glycol (4C)376–636795.053.9360.17511.4228143.370.01880.6/2.0This work
Lauric acid (1A)334–668743.072.9580.22701.6113236.087.75 × 10−40.7/2.1[7]
Methyl palmitate304–609762.2105.0490.31551.5496--0.4/3.1[7]
Methyl stearate312–622781.1122.5850.35181.5966--0.8/3.1[7]
Methyl oleate305–611764.0115.4160.33241.6709--2.1/3.2[7]
Methyl linoleate278–363795.3105.2500.31891.7639--1.9/1.1[7]
Methyl linolenate340–435797.2105.3100.31171.7642--2.1/1.1[7]
Tributyrin318–364658.7135.390.30051.0563--0.7/-[7]
Tricaprylin401–452793.4239.400.52021.5765--2.4/-[7]
Trilaurin461–517869.8369.120.74001.8191--0.9/-[7]
Trimyristin489–548898.6444.950.84981.9035--1.1/-[7]
Triolein-977.9555.891.05062.1070--(prediction)[7]
a % A A D = 100 · | X e x p X c a l c | / X e x p , where X is the property of interest, while exp and calc stand for experimental and calculated, respectively.
Table 2. Pure fluid parameters for polyethylene glycols; the average molecular weight is shown in parenthesis.
a FluidTc (K)ba0
(L2 bar/moL2)
ca0
(L2 bar/moL2)
b
(L/moL)
c1ε
(bar L/moL)
β
PEG (150)76638.02339.1970.13321.2993143.370.0188
PEG (200)81256.33754.6880.17971.4135143.370.0188
PEG (300)961102.00485.6700.27261.5744143.370.0188
PEG (400)1186159.723116.6520.36541.6885143.370.0188
PEG (600)1860311.315178.6160.55121.8494143.370.0188
a The 4C association scheme was used; b obtained from polynomial correlation; c obtained from linear correlation.
Table 3. Binary interaction parameters (kij) and deviations from experimental data for CO2–polyethylene glycols (the average molecular weight is shown in parenthesis).
SystemTemp. Range (K)kij% AAD in PressureExp. Data
CO2–PEG (150)303–3330.04203.5[38]
CO2–PEG (200)303–3330.01954.0[38]
CO2–PEG (300)303–333−0.02004.3[38]
CO2–PEG (400)303–333−0.06173.8[38]
Table 4. Binary parameters and CPA deviations from experimental data [39,40,41,42] (296–393 K) for CO2 (1)–glycerol (2).
ApproachkijβcrossLiquid Phase
AAD in x1
Vapor Phase
AAD in y2
CO2 inert0.1643-15.0998.5
CO2 with one association site0.30840.097920.040.2
Table 5. Binary parameters and CPA deviations from experimental data CO2 (1)–glycerides (2).
SystemTemp. Range (K)kijLiquid Phase
AAD in x1
Vapor Phase
AAD in y2
Exp. Data
CO2–Tricaprylin313–3930.05228.935.8[43]
CO2–Tributyrin278–368−0.01655.3-[44,45]
CO2–Trilaurin308–3530.070811.363.7[46,47,48,49]
CO2–Trimyristin308–3280.0905-56.3[46,48]
CO2–Triolein308–3630.05858.9139[50,51,52,53,54]
Table 6. Binary parameters used in calculations for ternary or multicomponent systems.
Sub-Binary Mixturekijεcross
(bar L/mol)
βcrossReference
CO2–Methanol0.0479123.8 (exp.)0.0196[31]
CO2–Ethanol0.1132123.8 (exp.)0.0320[31]
CO2–Glycerol0.3084mCR1 a0.0979This work, see Table 4
CO2–Lauric acid0.0380--[7]
CO2–Methyl linoleate0.0480--[7]
CO2–Methyl oleate0.0566--[7]
CO2–Methyl linolenate0.3000--[7]
CO2–Methyl palmitate0.0653--[7]
CO2–Methyl stearate0.0715--[7]
Glycerol–Methanol0.0836CR1 aCR1 a[7]
Glycerol–Ethanol0.0226CR1 aCR1 a[7]
Lauric acid–Methanol−0.0181mCR1 a0.1028 b[7]
a For combining rule 1 (CR1) and modified combining rule 1 (mCR-1), see ref. [31]. b Parameters adopted from methanol–methyl laurate in absence of parameters for the particular system.
Table 7. Overview of multicomponent systems modeled with the CPA EoS.
SystemReference
CO2–methyl myristate–methyl palmitate[8]
CO2–methyl oleate–methyl linoleate[8]
CO2–methanol–lauric acidThis work
CO2–glycerol–methanolThis work
CO2–glycerol–ethanolThis work
CO2–water–methanol[16,29,61]
CO2–water–ethanol[29]
CO2–various biodiesel samplesThis work, [8]
Methanol–glycerol–methyl oleate[19,20,24,30]
Methanol–glycerol–methyl ricinoleate[20]
Methanol–glycerol–methyl oleate–hexane [20,30]
Ethanol–glycerol–ethyl laurate[7,24]
Ethanol–glycerol–ethyl oleate[25,30]
Ethanol–glycerol–ethyl linoleate[25,30]
Ethanol–glycerol–ethyl palmitate[25,30]
Ethanol–glycerol–ethyl myristate[20]
Ethanol–glycerol–methyl stearate[20]
Ethanol–water–ethyl laurate[22,24]
Ethanol–water–ethyl myristate[22]
Various biodiesel samples–CO2This work, [8]
Various biodiesel samples–water[18,30]
Various biodiesel samples–glycerol–methanol[7]
Various biodiesel samples–glycerol–ethanol[23]
Publisher’s Note: MDPI stays neutral with regard to jurisdictional claims in published maps and institutional affiliations.

