
QSTR Modeling to Find Relevant DFT Descriptors Related to the Toxicity of Carbamates

 , , ,
, , ,
Abstract
:1. Introduction
2. Results and Discussion
2.1. Structure and Optimization
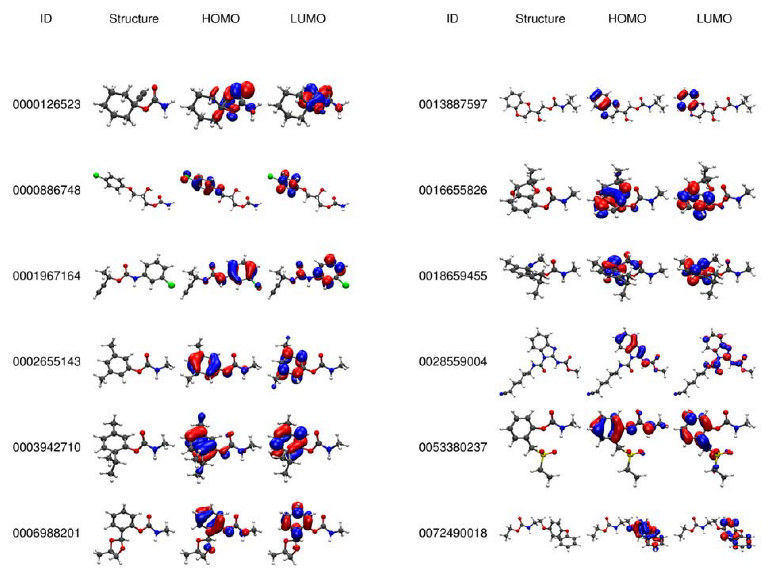
2.2. Electronic Analysis and DFT Descriptors of Carbamates
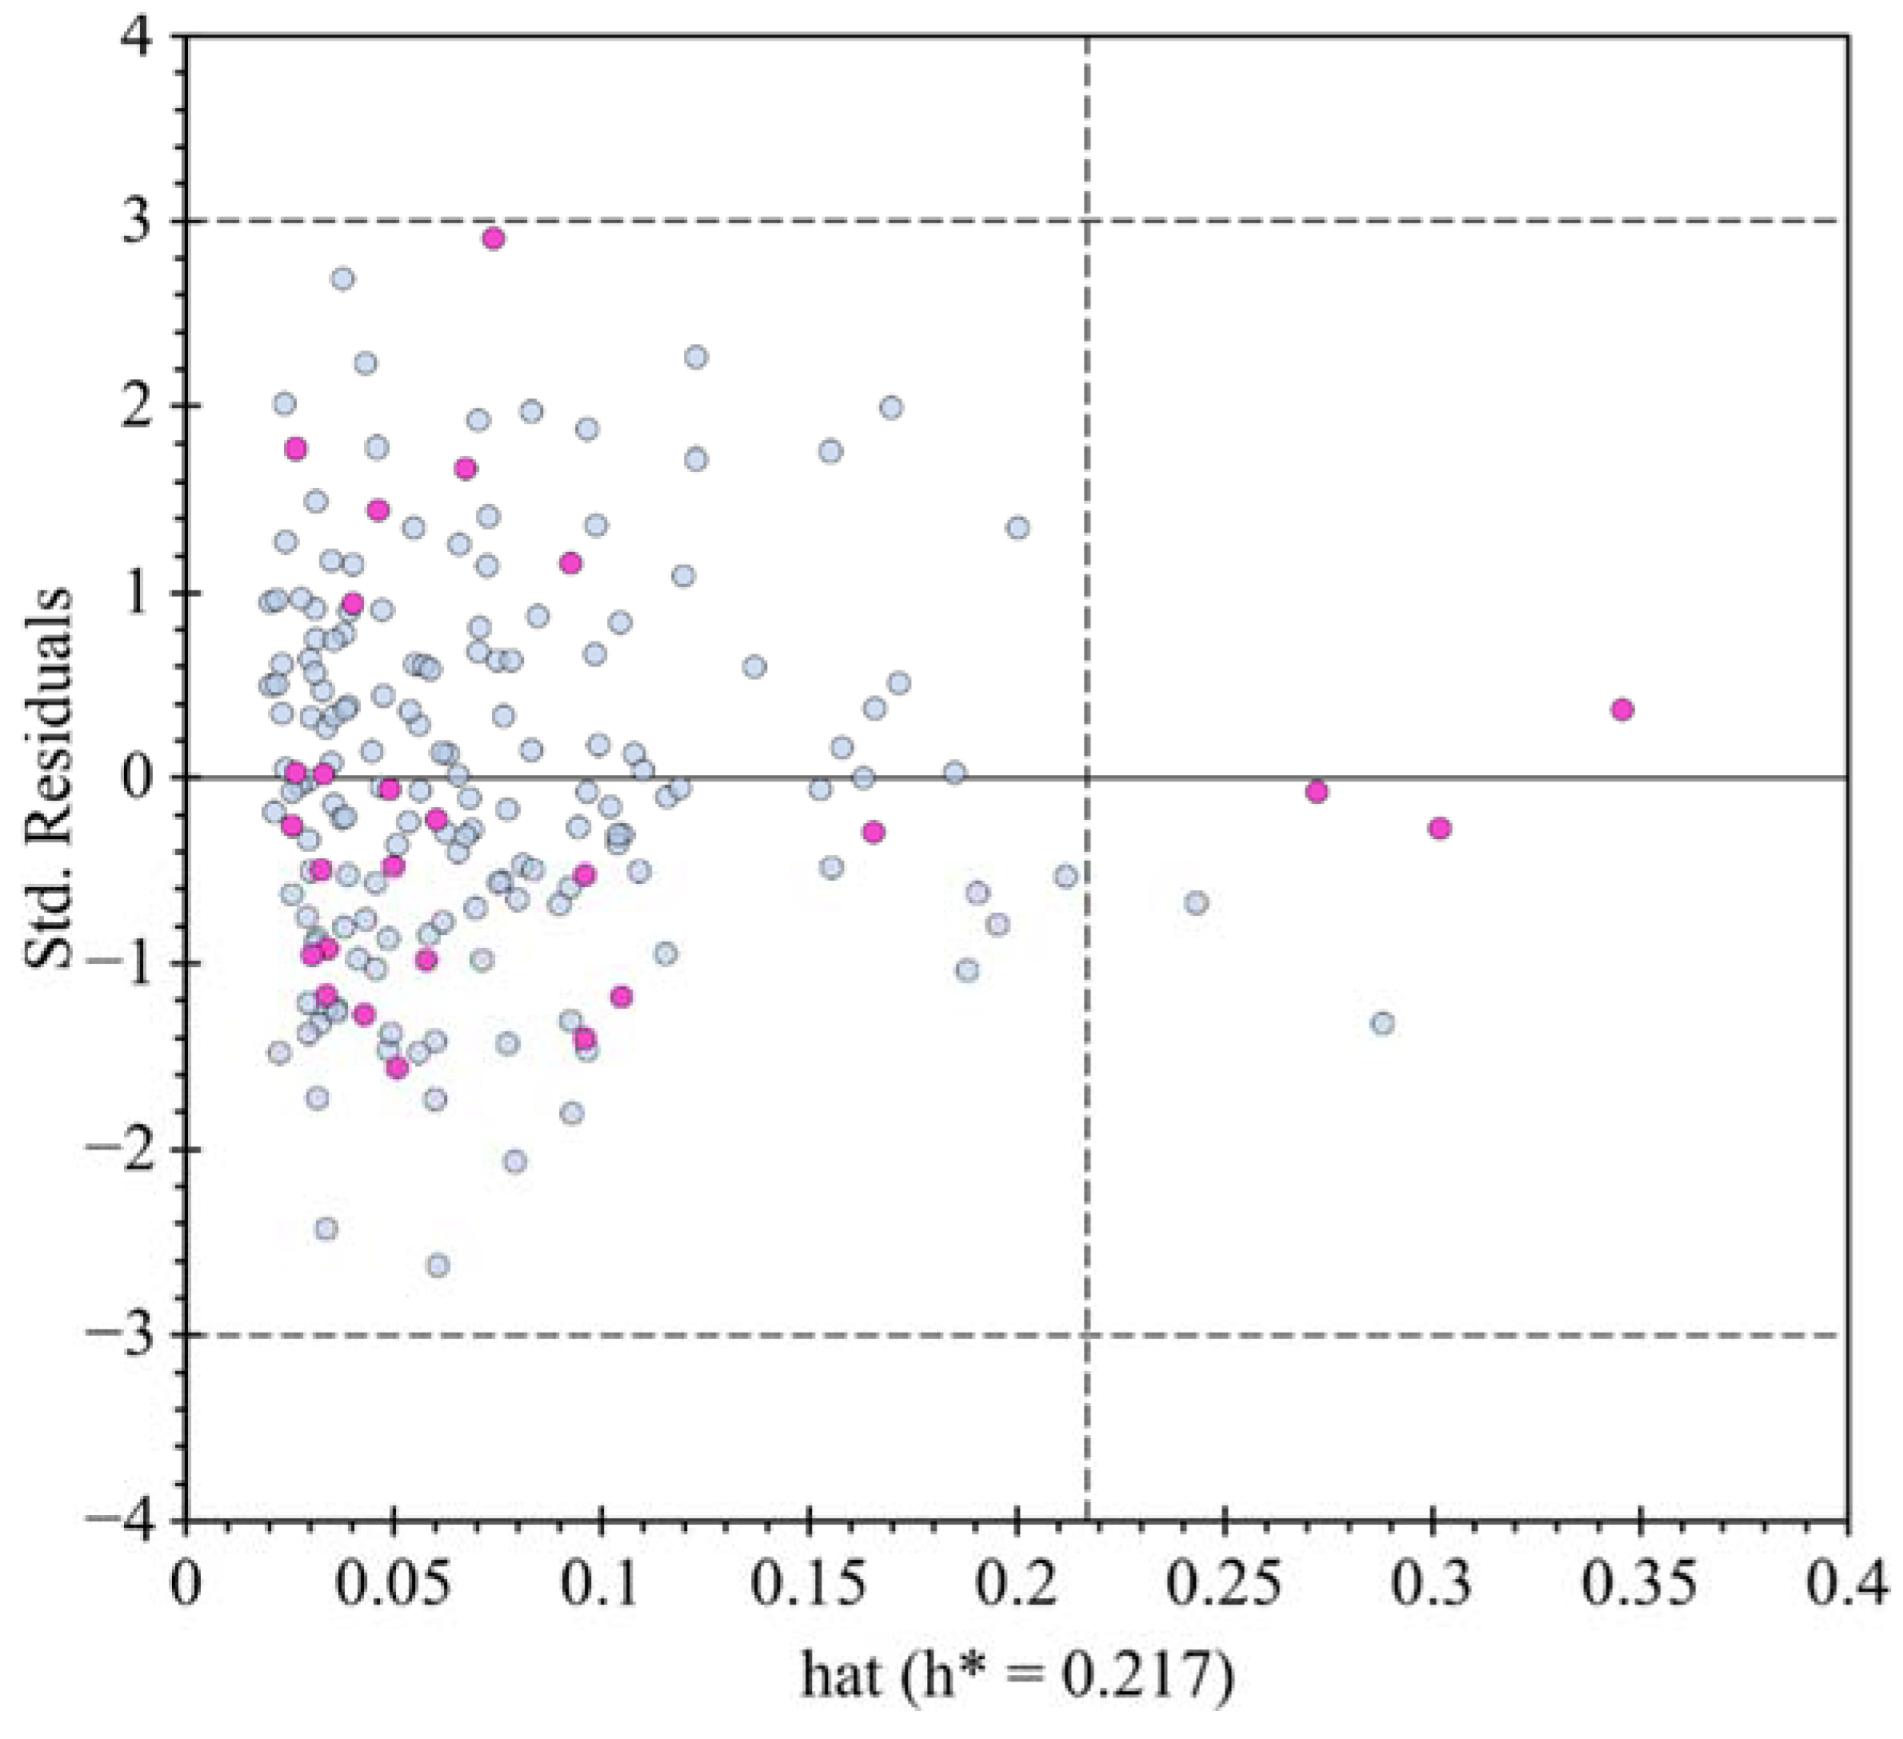
2.3. QSTR Modeling
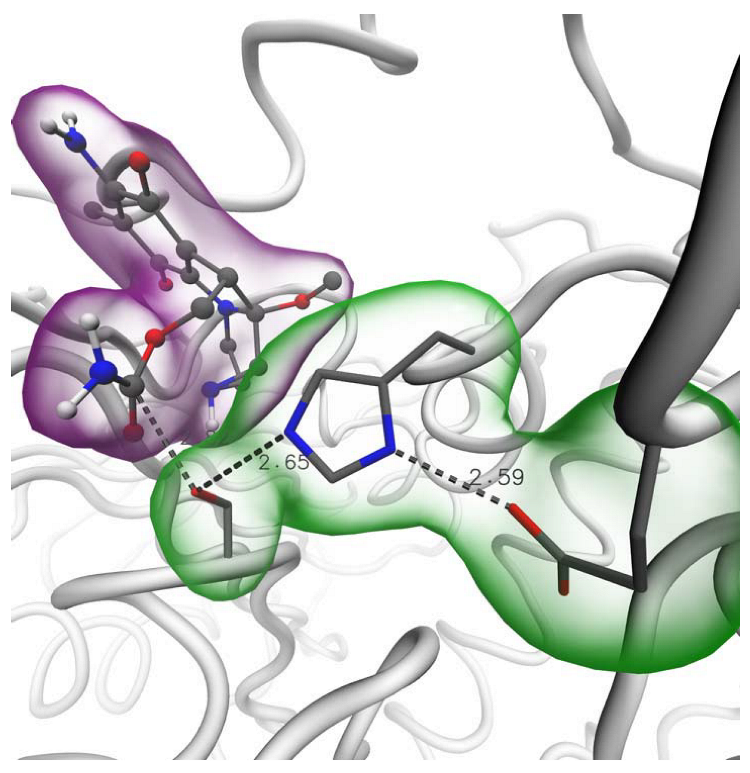
2.4. Binding of Carbamate Compounds to the Catalytic Site of AChE
3. Materials and Methods
3.1. Data Collection and Electronic Descriptors
3.2. Dragon Molecular Descriptors
3.3. QSTR Model Building and Validation
3.4. Molecular Docking Calculations
4. Conclusions
Supplementary Materials
Author Contributions
Funding
Institutional Review Board Statement
Informed Consent Statement
Data Availability Statement
Acknowledgments
Conflicts of Interest
References
- Bhatt, P.; Zhou, X.; Huang, Y.; Zhang, W.; Chen, S. Characterization of the role of esterases in the biodegradation of organophosphate, carbamate, and pyrethroid pesticides. J. Hazard. Mater. 2021, 411, 125026. [Google Scholar] [CrossRef] [PubMed]
- Dos Anjos, J.P.; de Andrade, J.B. Determination of nineteen pesticides residues (organophosphates, organochlorine, pyrethroids, carbamate, thiocarbamate and strobilurin) in coconut water by SDME/GC–MS. Microchem. J. 2014, 112, 119–126. [Google Scholar] [CrossRef]
- Rawn, D.F.K.; Roscoe, V.; Trelka, R.; Hanson, C.; Krakalovich, T.; Dabeka, R.W. N-methyl carbamate pesticide residues in conventional and organic infant foods available on the Canadian retail market, 2001–2003. Food Addit. Contam. 2006, 23, 651–659. [Google Scholar] [CrossRef]
- Yang, S.S.; Goldsmith, A.I.; Smetena, I. Recent advances in the residue analysis of N-methylcarbamate pesticides. J. Chromatogr. A 1996, 754, 3–16. [Google Scholar] [CrossRef]
- Kaur, P.; Balomajumder, C. Simultaneous biodegradation of mixture of carbamates by newly isolated Ascochyta sp. CBS 237.37. Ecotoxicol. Environ. Saf. 2019, 169, 590–599. [Google Scholar] [CrossRef]
- Barceló, D.; Hennion, M.-C. Chapter 1—Pesticides their Degradation Products: Characteristics Usage Environmental Behaviour. In Trace Determination of Pesticides and Their Degradation Products in Water; Elsevier Science Inc.: New York, NY, USA, 1997; Volume 19, pp. 1–94. [Google Scholar] [CrossRef]
- Goto, T.; Ito, Y.; Yamada, S.; Matsumoto, H.; Oka, H.; Nagase, H.; Ito, Y. High Throughput Analysis of N-Methyl Carbamate Pesticides in Cereals and Beans by Dual Countercurrent Chromatography and Liquid Chromatography Electrospray Ionization Tandem Mass Spectrometry. J. Liq. Chromatogr. Relat. Technol. 2006, 29, 2651–2661. [Google Scholar] [CrossRef]
- Wei, J.-C.; Wei, B.; Yang, W.; He, C.-W.; Su, H.-X.; Wan, J.-B.; Wang, Y.-T. Trace determination of carbamate pesticides in medicinal plants by a fluorescent technique. Food Chem. Toxicol. 2018, 119, 430–437. [Google Scholar] [CrossRef]
- Fukuto, T.R. Mechanism of action of organophosphorus and carbamate insecticides. Environ. Health Perspect. 1990, 87, 245–254. [Google Scholar] [CrossRef]
- Vilar, S.; Costanzi, S. Predicting the Biological Activities Through QSAR Analysis and Docking-Based Scoring. Membr. Protein Struct. Dyn. 2012, 914, 271–284. [Google Scholar] [CrossRef] [Green Version]
- Miladiyah, I.; Jumina, J.; Haryana, S.M.; Mustofa, M. Biological activity, quantitative structure–activity relationship analysis, and molecular docking of xanthone derivatives as anticancer drugs. Drug Des. Dev. Ther. 2018, 12, 149–158. [Google Scholar] [CrossRef]
- Balaban, A.T. Chemical graphs. Theor. Chim. Acta 1979, 53, 355–375. [Google Scholar] [CrossRef]
- Consonni, V.; Todeschini, R.; Pavan, M. Structure/Response Correlations and Similarity/Diversity Analysis by GETAWAY Descriptors. 1. Theory of the Novel 3D Molecular Descriptors. J. Chem. Inf. Modeling 2002, 42, 682–692. [Google Scholar] [CrossRef] [PubMed]
- Zheng, S.; Luo, X.; Chen, G.; Zhu, W.; Shen, J.; Chen, K.; Jiang, H. A New Rapid and Effective Chemistry Space Filter in Recognizing a Druglike Database. J. Chem. Inf. Modeling 2005, 45, 856–862. [Google Scholar] [CrossRef] [PubMed]
- Golbraikh, A.; Tropsha, A. Predictive QSAR modeling based on diversity sampling of experimental datasets for the training and test set selection. J. Comput.-Aided Mol. Des. 2002, 16, 357–369. [Google Scholar] [CrossRef]
- Kiralj, R.; Ferreira, M. Basic validation procedures for regression models in QSAR and QSPR studies: Theory and application. J. Braz. Chem. Soc. 2009, 20, 770–787. [Google Scholar] [CrossRef]
- Adeniji, S.; Uba, S.; Uzairu, A.; Arthur, D. A Derived QSAR Model for Predicting Some Compounds as Potent Antagonist against Mycobacterium tuberculosis: A Theoretical Approach. Adv. Prev. Med. 2019, 2019, 1–18. [Google Scholar] [CrossRef]
- Ghomisheh, Z.; Gorji, A.; Sobati, M. Prediction of critical properties of sulfur-containing compounds: New QSPR models. J. Mol. Graph. Model. 2020, 101, 107700. [Google Scholar] [CrossRef]
- ChemID: ChemIDplus Advanced. United States National Library of Medicine: Bethesda, MD, USA, 2021. Available online: https://chem.nlm.nih.gov/chemidplus/ (accessed on 2 May 2022).
- Campos, R.; Joaquín, M.; Camacho Quesada, M.E. 6. Quantitative drug design: Parameters and quantitative structure activity relationships. In Volume 1 Drug Design and Action; De Gruyter: Berlin, Germany, 2017; pp. 90–106. [Google Scholar] [CrossRef]
- Roy, K.; Kar Supratik, D.; Rudra, N. A Primer on QSAR/QSPR Modeling Fundamental Concepts; Springer: Cham, Switzerland, 2015; pp. 2–7. [Google Scholar] [CrossRef]
- Frisch, M.J.; Trucks, G.W.; Schlegel, H.B.; Scuseria, G.E.; Robb, M.A.; Cheeseman, J.R.; Scalmani, G.; Barone, V.; Mennucci, B.; Petersson, G.A.; et al. Gaussian 09; Gaussian, Inc.: Wallingford, CT, USA, 2009. [Google Scholar]
- Perdew, J.P.; Burke, K.; Ernzerhof, M. Generalized Gradient Approximation Made Simple. Phys. Rev. Lett. 1996, 77, 3865–3868. [Google Scholar] [CrossRef]
- Camacho-Mendoza, R.L.; Aquino-Torres, E.; Cordero-Pensado, V.; Cruz-Borbolla, J.; Alvarado-Rodríguez, J.G.; Thangarasu, P.; Gómez-Castro, C.Z. A new computational model for the prediction of toxicity of phosphonate derivatives using QSPR. Mol. Divers. 2018, 22, 269–280. [Google Scholar] [CrossRef]
- Gázquez, J.L.; Cedillo, A.; Vela, A. Electrodonating and Electroaccepting Powers. J. Phys. Chem. A 2007, 111, 1966–1970. [Google Scholar] [CrossRef]
- Franco-Pérez, M.; Polanco-Ramírez, C.A.; Gázquez, J.L.; Ayers, P.W.; Vela, A. Study of organic reactions using chemical reactivity descriptors derived through a temperature-dependent approach. Theor. Chem. Acc. 2020, 139, 44. [Google Scholar] [CrossRef]
- Lu, T.; Chen, F. Multiwfn: A multifunctional wavefunction analyzer. J. Comput. Chem. 2012, 33, 580–592. [Google Scholar] [CrossRef] [PubMed]
- Talete srl, DRAGON (Software for Molecular Descriptor Calculation), Version 6.0. 2010. Available online: http://www.talete.mi.it/ (accessed on 2 May 2022).
- Gramatica, P.; Chirico, N.; Papa, E.; Cassani, S.; Kovarich, S. QSARINS: A new software for the development, analysis, and validation of QSAR MLR models. J. Comput. Chem. 2013, 34, 2121–2132. [Google Scholar] [CrossRef]
- Gramatica, P. Principles of QSAR models validation: Internal and external. QSAR Comb. Sci. 2007, 26, 694–701. [Google Scholar] [CrossRef]
- Morris, G.; Goodsell, D.; Halliday, R.; Huey, R.; Hart, W.; Belew, R.; Olson, A. Automated docking using a Lamarckian genetic algorithm and an empirical binding free energy function. J. Comput. Chem. 1998, 19, 1639–1662. [Google Scholar] [CrossRef]
- Sanson, B.; Nachon, F.; Colletier, J.P.; Froment, M.T.; Toker, L.; Greenblatt, H.M.; Sussman, J.L.; Ashani, Y.; Masson, P.; Silman, I.; et al. Crystallographic snapshots of nonaged and aged conjugates of soman with acetylcholinesterase, and of a ternary complex of the aged conjugate with pralidoxime. J. Med. Chem. 2009, 52, 7593–7603. [Google Scholar] [CrossRef]


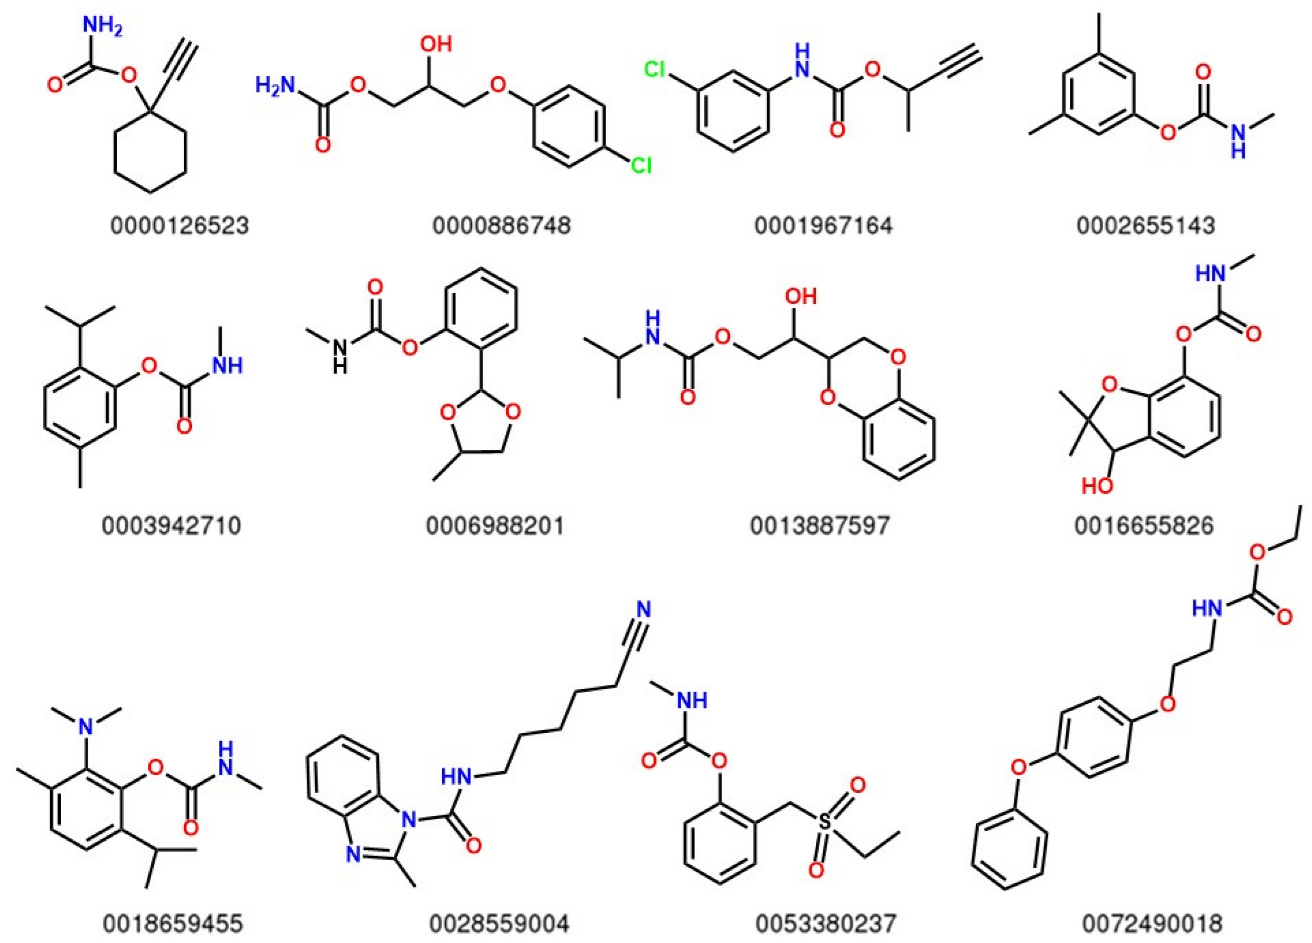
| ID | Set | log(1/C) | EA | qC | LOC | SpPosA_RG | H4m | nCt | nROCON | B05[C-N] | B05[N-O] | DLS_05 |
|---|---|---|---|---|---|---|---|---|---|---|---|---|
| 0000126523 | Test | −0.29657 | −8.643 | 0.1862 | 1.528 | 0.438 | 0.091 | 1 | 1 | 1 | 0 | 1 |
| 0000886748 | Training | −0.48124 | −7.7613 | 0.1931 | 2.25 | 0.424 | 0.26 | 0 | 1 | 1 | 1 | 1 |
| 0001967164 | Training | −1.02699 | −7.9976 | 0.198 | 2.071 | 0.415 | 0.257 | 0 | 0 | 1 | 0 | 0.5 |
| 0002655143 | Training | −0.13579 | −7.9584 | 0.1875 | 1.662 | 0.43 | 0.06 | 0 | 0 | 1 | 0 | 1 |
| 0003942710 | Training | −0.38243 | −7.8397 | 0.1869 | 1.697 | 0.432 | 0.093 | 1 | 0 | 1 | 0 | 1 |
| 0006988201 | Training | 0.33382 | −7.938 | 0.189 | 1.403 | 0.425 | 0.112 | 0 | 0 | 1 | 0 | 1 |
| 0013887597 | Test | −0.72691 | −7.4242 | 0.1839 | 1.977 | 0.433 | 0.335 | 0 | 1 | 1 | 1 | 1 |
| 0016655826 | Training | 1.11994 | −7.6752 | 0.186 | 1.481 | 0.431 | 0.107 | 1 | 0 | 1 | 1 | 1 |
| 0018659455 | Training | 0.57246 | −7.084 | 0.1917 | 1.656 | 0.431 | 0.169 | 1 | 0 | 1 | 1 | 1 |
| 0028559004 | Training | −0.88027 | −7.7277 | 0.1988 | 2.473 | 0.429 | 0.371 | 0 | 0 | 1 | 0 | 0.5 |
| 0053380237 | Training | −0.2937 | −7.8825 | 0.1937 | 1.849 | 0.417 | 0.138 | 0 | 0 | 1 | 0 | 0.5 |
| Variable | Type | Coeff. | Std. Coeff. | Co. Int. |
|---|---|---|---|---|
| EA | G | 0.3231 | 0.2267 | 0.2055 |
| qC | L | −34.0837 | −0.1732 | 23.1746 |
| LOC | S | −0.6319 | −0.2946 | 0.2317 |
| SpPosA_RG | S | −22.6053 | −0.2935 | 8.3602 |
| H4m | S | −1.5012 | −0.3124 | 0.6143 |
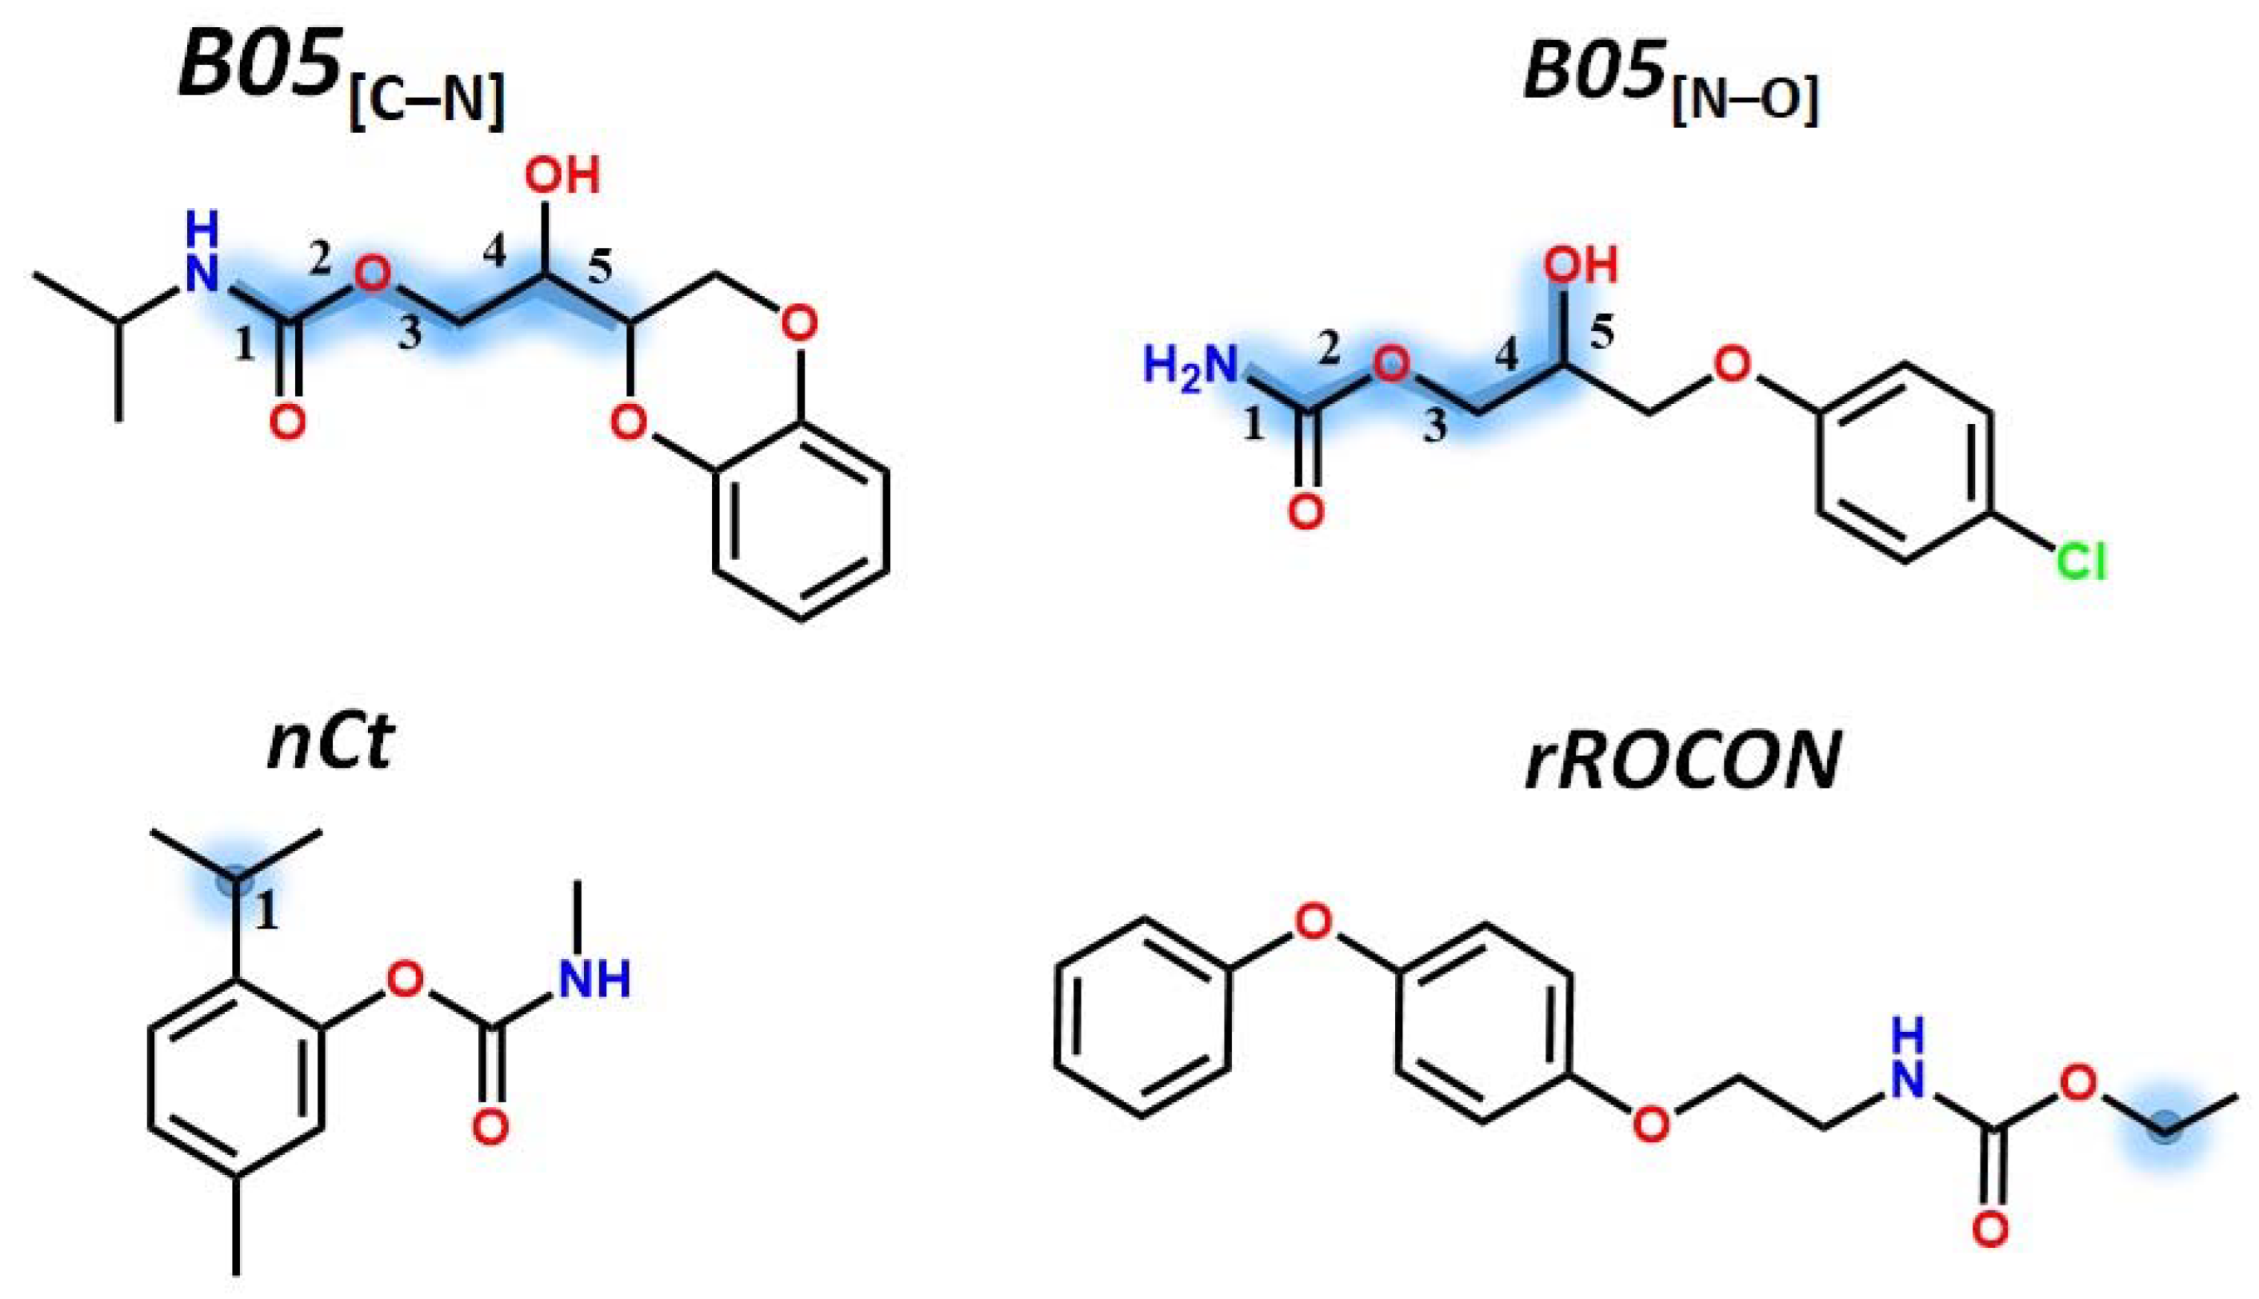
| nCt | S | 0.2275 | 0.1312 | 0.1733 |
| nROCON | S | −0.6919 | −0.3527 | 0.2705 |
| B05[C-N] | S | 0.6524 | 0.1764 | 0.374 |
| B05[N-O] | S | 0.3996 | 0.2365 | 0.1956 |
| DLS5 | S | 0.6244 | 0.2671 | 0.2492 |
| Intercept | - | 18.7033 | - | 6.3069 |
| EA | qC | LOC | SpPosA_RG | H4m | nCt | nROCON | B05[C-N] | B05[N-O] | DLS_05 | |
|---|---|---|---|---|---|---|---|---|---|---|
| EA | 1.00 | |||||||||
| qC | 0.12 | 1.00 | ||||||||
| LOC | −0.31 | 0.17 | 1.00 | |||||||
| SpPosA_RG | −0.09 | −0.32 | 0.05 | 1.00 | ||||||
| H4m | 0.44 | 0.09 | −0.22 | −0.16 | 1.00 | |||||
| nCt | −0.08 | −0.09 | −0.05 | 0.19 | 0.02 | 1.00 | ||||
| nROCON | −0.37 | −0.45 | 0.14 | 0.25 | 0.19 | 0.08 | 1.00 | |||
| B05[C-N] | 0.32 | −0.07 | −0.05 | 0.00 | 0.14 | 0.12 | −0.12 | 1.00 | ||
| B05[N-O] | 0.43 | −0.13 | −0.16 | 0.01 | 0.43 | −0.07 | 0.16 | 0.03 | 1.00 | |
| DLS_05 | 0.07 | −0.25 | 0.05 | 0.33 | −0.04 | 0.24 | 0.14 | 0.14 | 0.03 | 1.00 |
Publisher’s Note: MDPI stays neutral with regard to jurisdictional claims in published maps and institutional affiliations. |
© 2022 by the authors. Licensee MDPI, Basel, Switzerland. This article is an open access article distributed under the terms and conditions of the Creative Commons Attribution (CC BY) license (https://creativecommons.org/licenses/by/4.0/).
Share and Cite
Acosta-Jiménez, E.H.; Zárate-Hernández, L.A.; Camacho-Mendoza, R.L.; González-Montiel, S.; Alvarado-Rodríguez, J.G.; Gómez-Castro, C.Z.; Pescador-Rojas, M.; Meneses-Viveros, A.; Cruz-Borbolla, J. QSTR Modeling to Find Relevant DFT Descriptors Related to the Toxicity of Carbamates. Molecules 2022, 27, 5530. https://doi.org/10.3390/molecules27175530
Acosta-Jiménez EH, Zárate-Hernández LA, Camacho-Mendoza RL, González-Montiel S, Alvarado-Rodríguez JG, Gómez-Castro CZ, Pescador-Rojas M, Meneses-Viveros A, Cruz-Borbolla J. QSTR Modeling to Find Relevant DFT Descriptors Related to the Toxicity of Carbamates. Molecules. 2022; 27(17):5530. https://doi.org/10.3390/molecules27175530
Chicago/Turabian StyleAcosta-Jiménez, Emma H., Luis A. Zárate-Hernández, Rosa L. Camacho-Mendoza, Simplicio González-Montiel, José G. Alvarado-Rodríguez, Carlos Z. Gómez-Castro, Miriam Pescador-Rojas, Amilcar Meneses-Viveros, and Julián Cruz-Borbolla. 2022. "QSTR Modeling to Find Relevant DFT Descriptors Related to the Toxicity of Carbamates" Molecules 27, no. 17: 5530. https://doi.org/10.3390/molecules27175530
APA StyleAcosta-Jiménez, E. H., Zárate-Hernández, L. A., Camacho-Mendoza, R. L., González-Montiel, S., Alvarado-Rodríguez, J. G., Gómez-Castro, C. Z., Pescador-Rojas, M., Meneses-Viveros, A., & Cruz-Borbolla, J. (2022). QSTR Modeling to Find Relevant DFT Descriptors Related to the Toxicity of Carbamates. Molecules, 27(17), 5530. https://doi.org/10.3390/molecules27175530