
Vanadium(V) Removal from Aqueous Solutions and Real Wastewaters onto Anion Exchangers and Lewatit AF5


Abstract
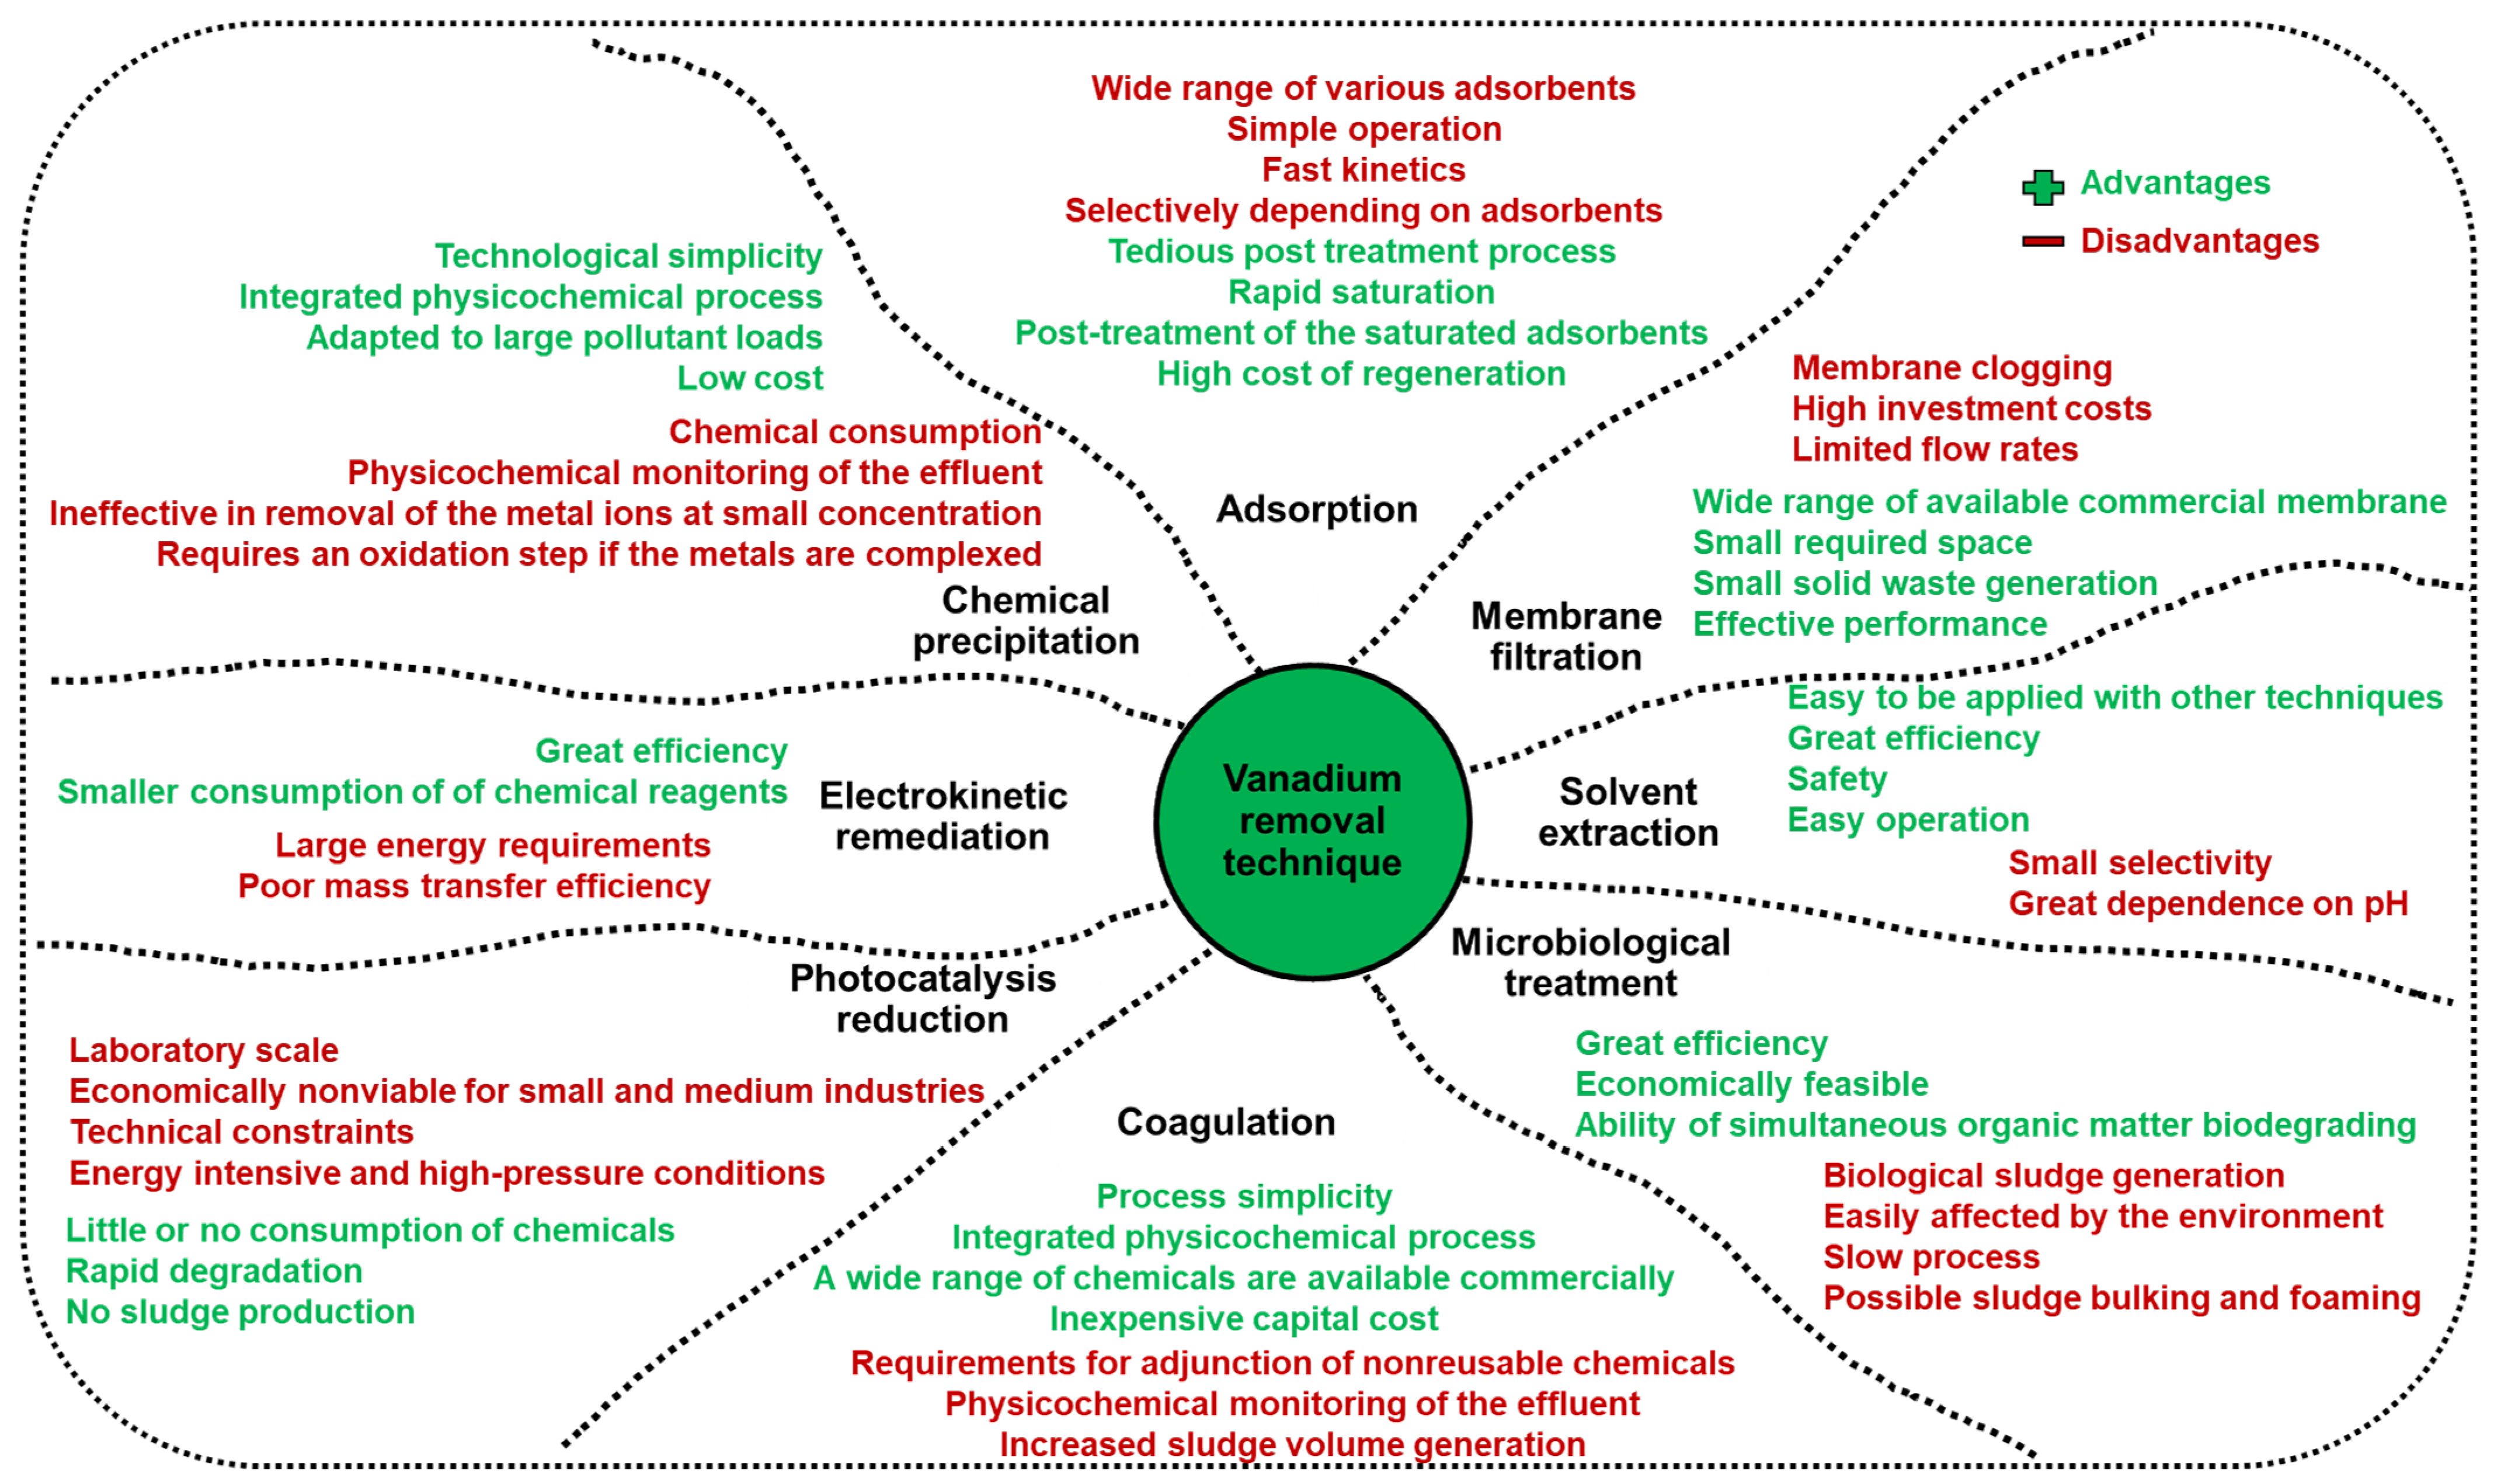
:1. Introduction
2. Results
2.1. Sorbent Characteristics
2.2. Adsorption Studies–Static and Dynamic Methods
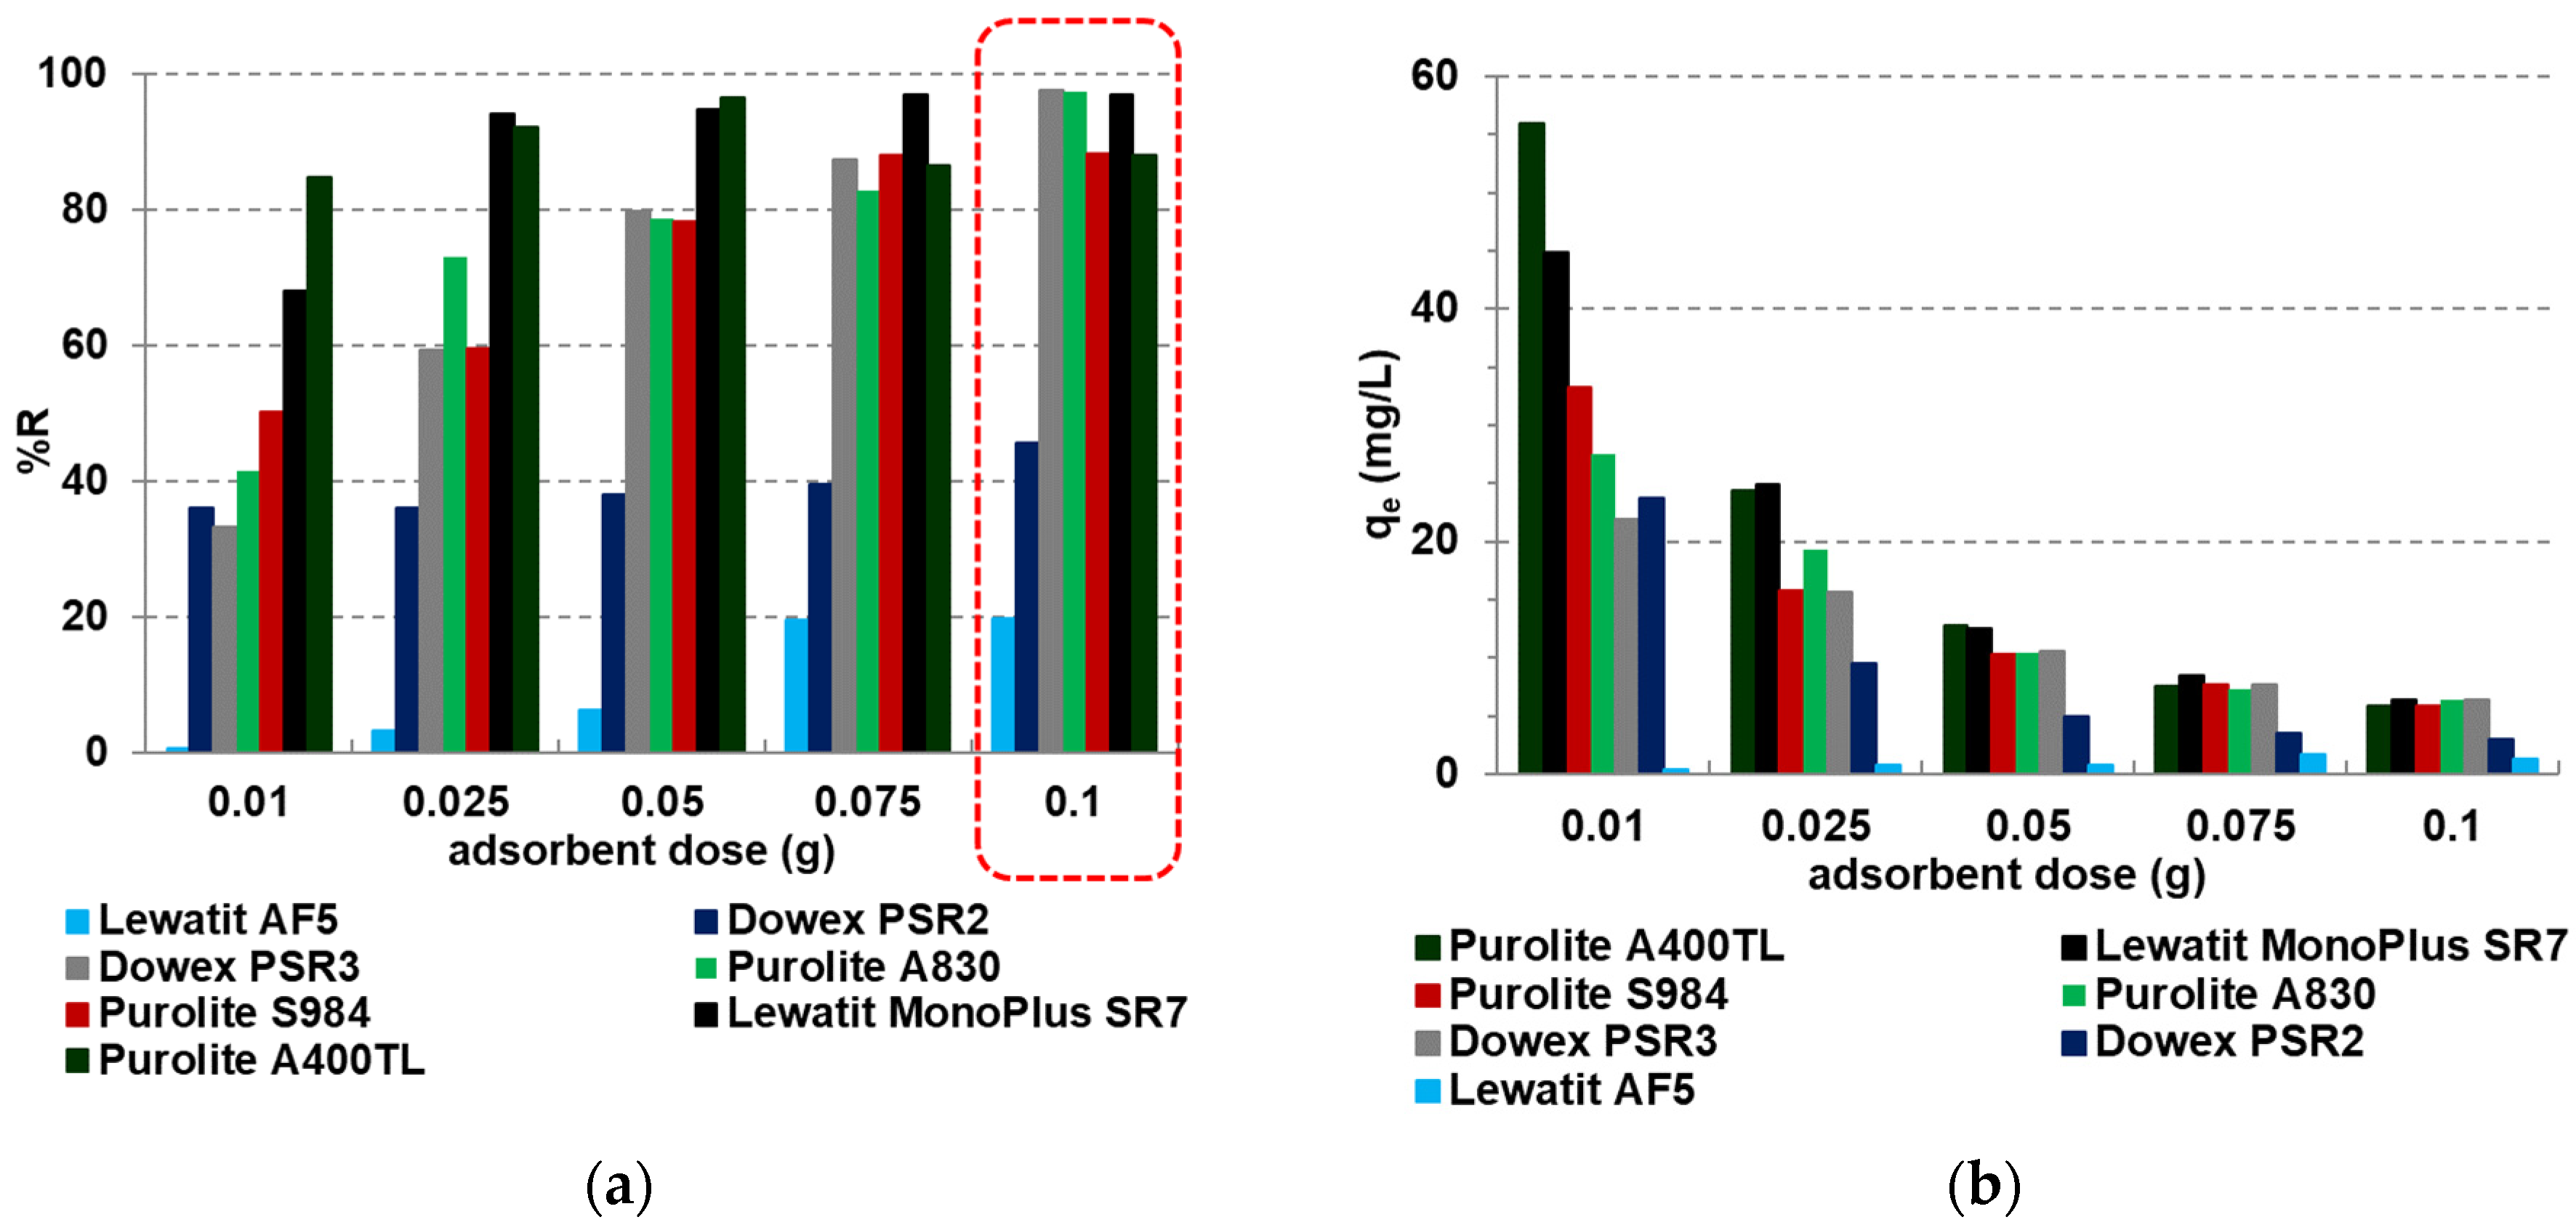
2.2.1. Batch Adsorption—Effect of Adsorbent Doses
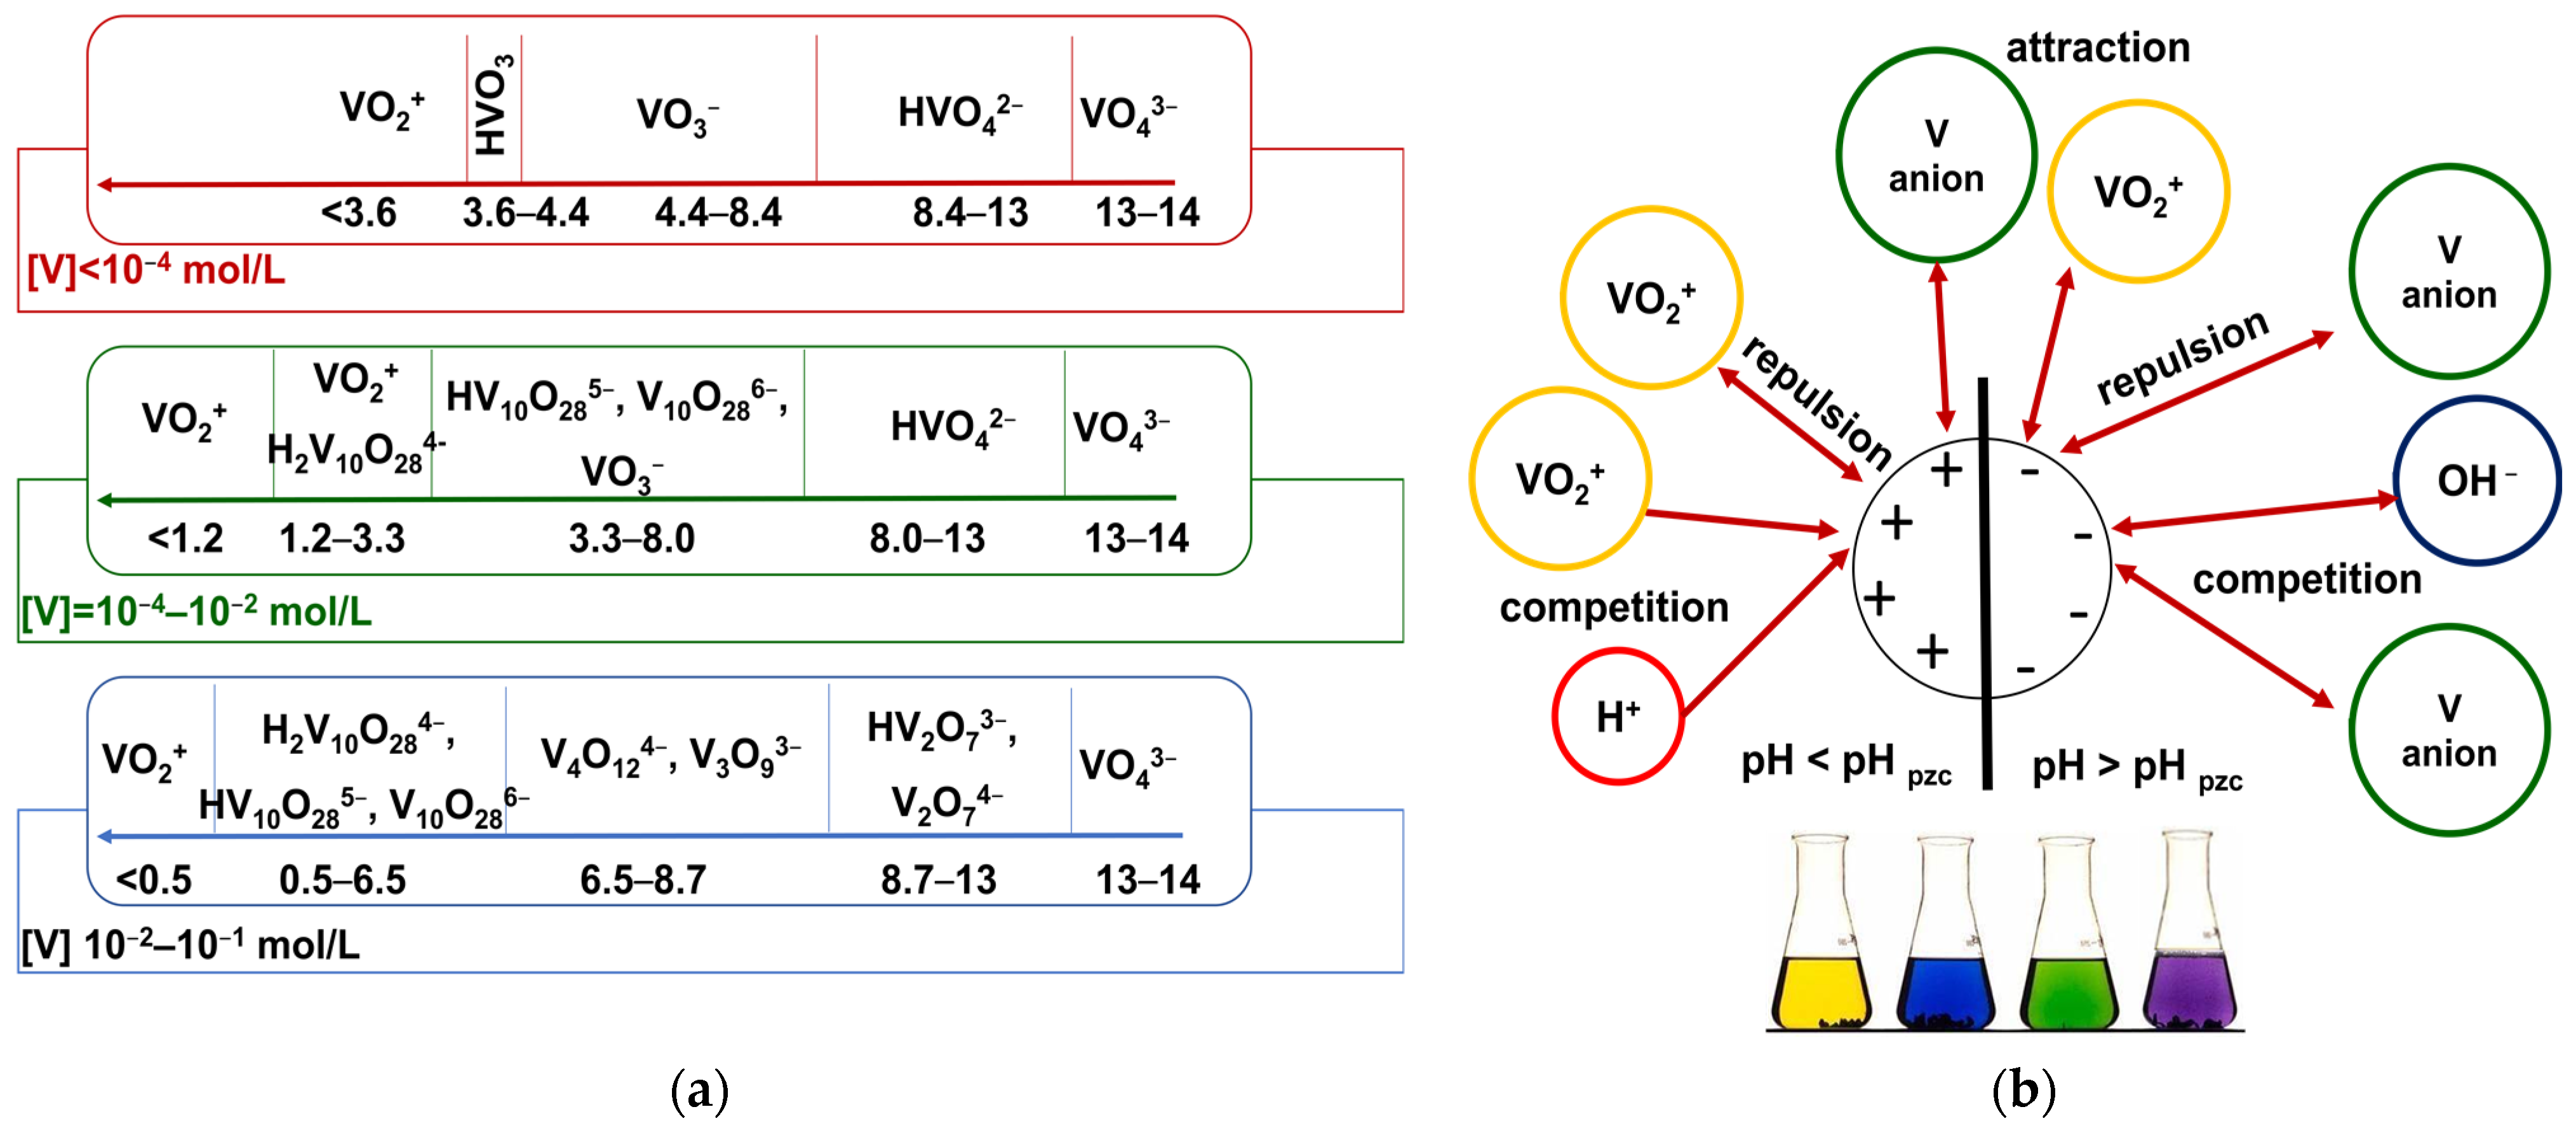
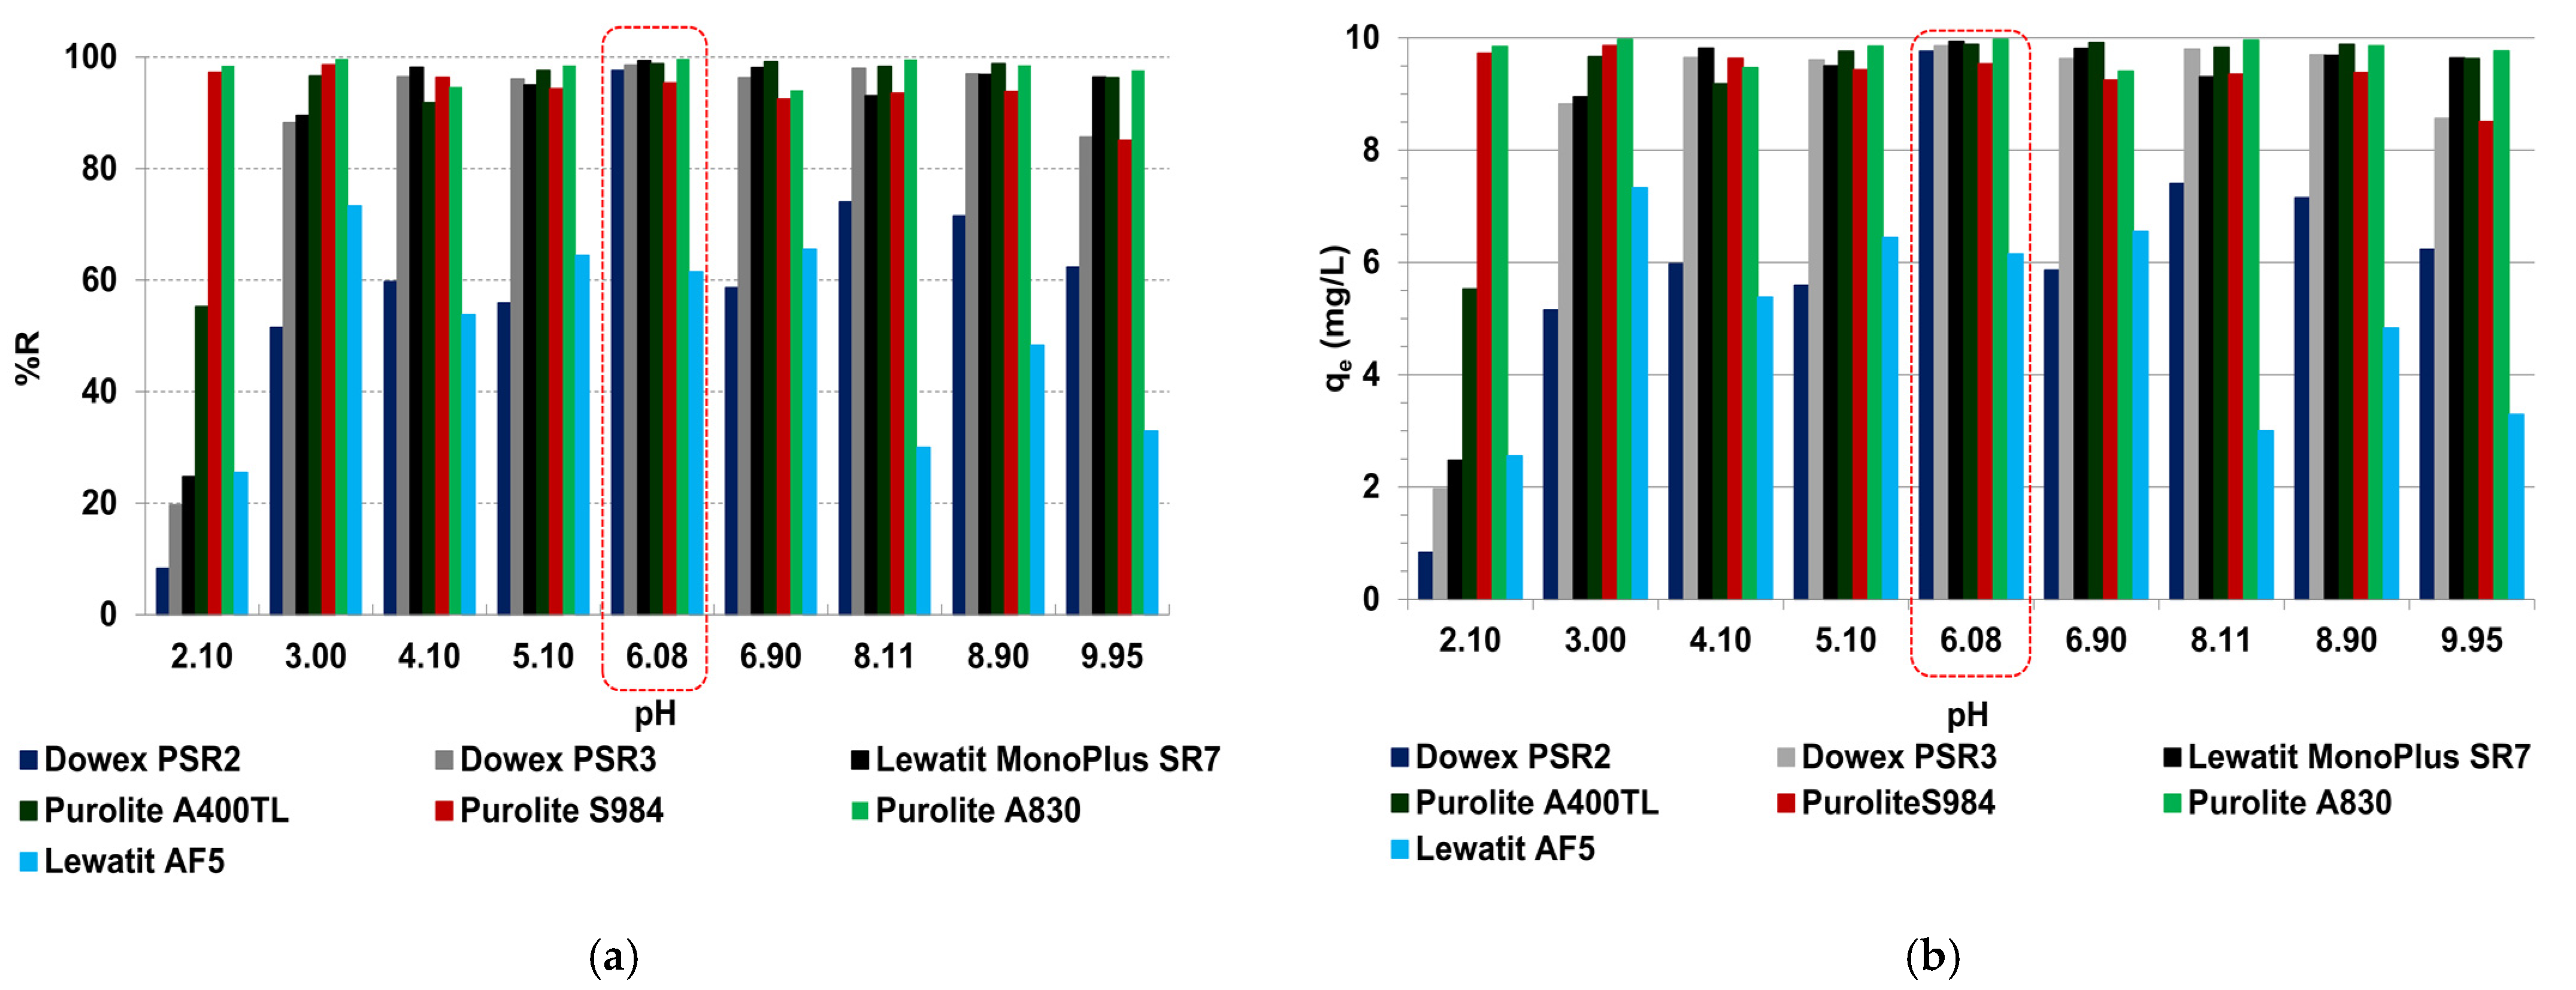
2.2.2. Batch Adsorption—Effects of Solutions pH
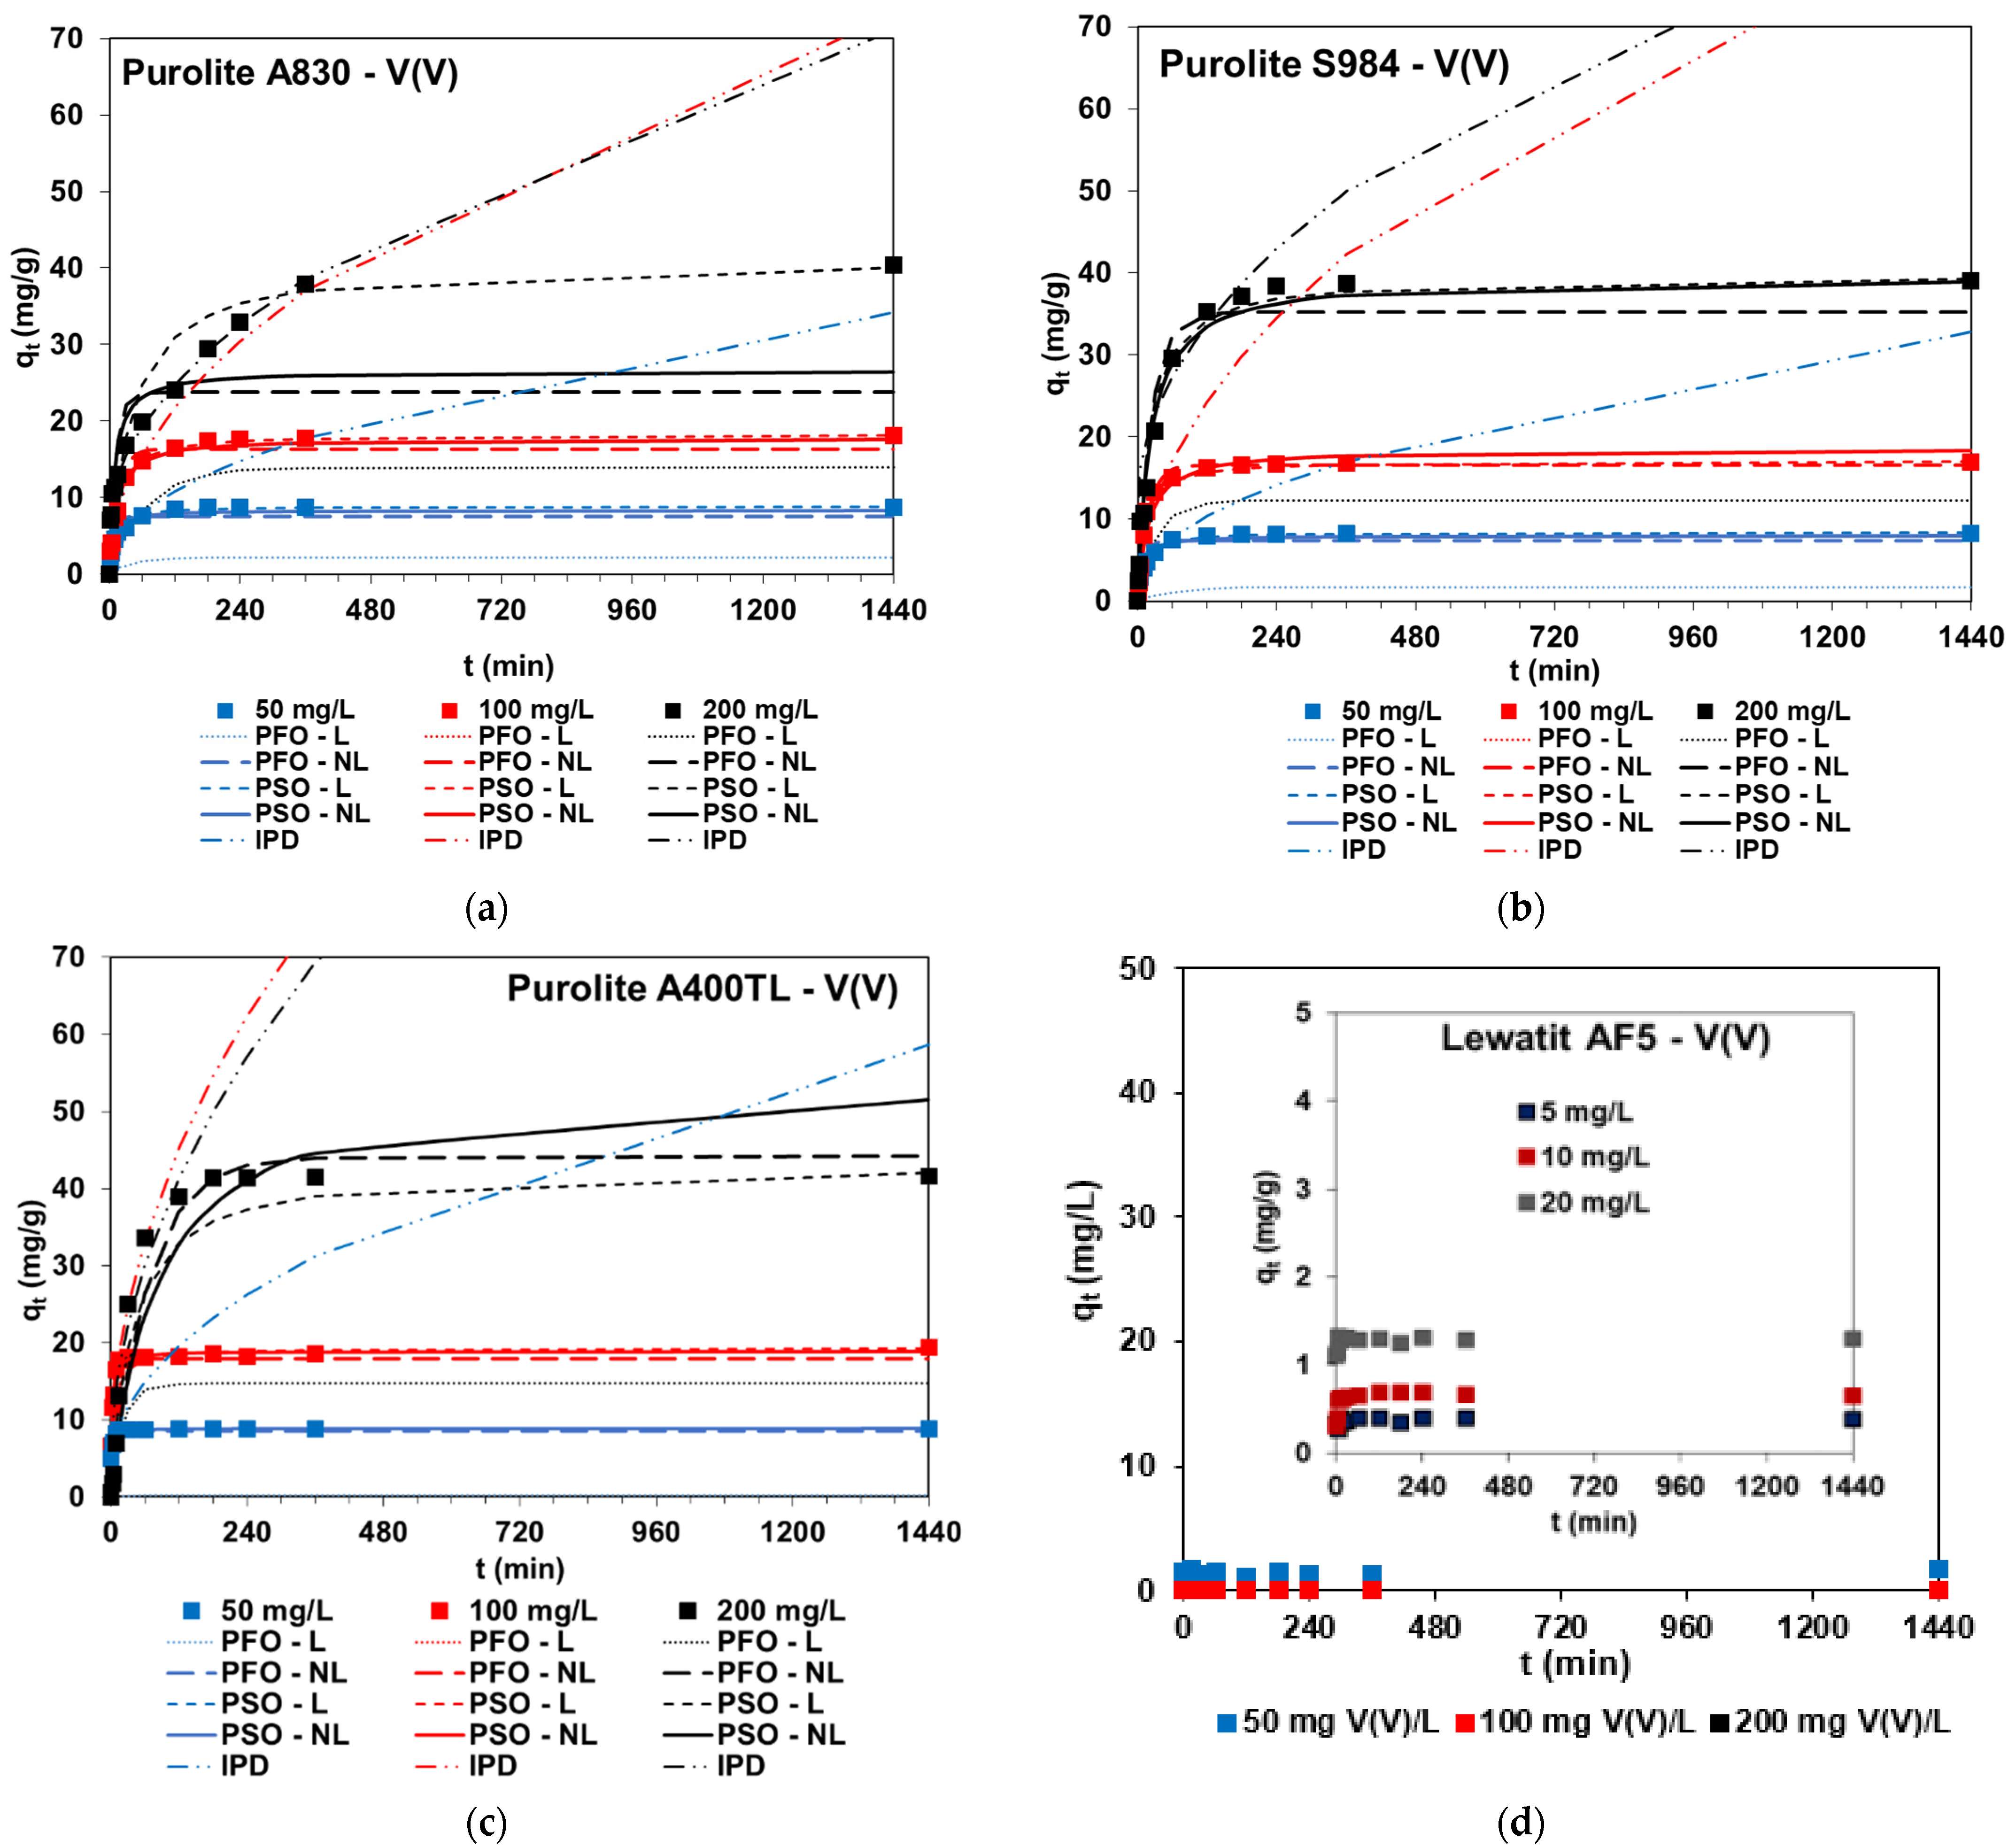
2.2.3. Batch Adsorption—Effects of Contact Time
- ➢
- Vanadium kinetic plots usually included two stages: (1) fast adsorption due to great accessibility of free adsorption sites and (2) slower adsorption stage and reaching equilibrium—the remaining adsorption site’s availability is more difficult [17]. In the case of 200 mg V(V)/L concentrations, three stages can usually be distinguished.
- ➢
- The amount of V(V) ions adsorbed increase with the increasing phase contact time, e.g., qt = 5 mg/g (t = 1 min) and qt = 8.7 mg/g (t = 30 min) for C0 = 50 mg/L and A400TL, but the shape of the kinetic curves and their “steepness” depend on the initial concentrations of V(V) ions present in the solution.
- ➢
- The adsorption capacities usually increase with increasing initial concentrations, e.g., qe = 8.8 mg/g (C0 = 50 mg/L), qe = 19.3 mg/g (C0 = 100 mg/L), and qe = 40.1 mg/g (C0 = 20 mg/L) for A400TL.
- ➢
- The time required for equilibrium establishment depends on the initial vanadium concentration: longer times are needed for the equilibrium establishment for systems containing 100 and 200 mg V(V)/L compared to 50 mg V(V)/L. Comparing the equilibrium time for vanadium removal (teq) by various sorbents, e.g., SBA resin Amberlite IRA-400 (teq = 5 min) [6], SBA resin Amberlite IRA-400 (teq = 60 min) [5], SBA resin D296 (teq = 12 h) [8], WBA resin 201*7 (teq = 20 min) [38], WBA resin ZGA414 (teq = 8 min) [10], nano-hydrous zirconium oxide-modified anion exchange resin, (teq = 2 h) [34], N235 impregnated resin (NIRs) (teq=10 h), N235-TBS-impregnated resin (N-TIRs) (teq = 6 h) [39], di-(2-ethylhexyl) phosphoric acid (D2EHPA)-Tributyl phosphate (TBP)-impregnated resin (teq = 36 h) [40] and that presented in the review paper in Table 2 [2] and taking into account this paper, teq is highly variable, ranging from a few minutes to 48 h.
- ➢
- With the higher V(V) concentration, the percentage removal of vanadium is smaller, e.g., 99.9%, 98.6%, 94.4% for 50, 100, and 200 mg V(V)/L, and A400TL or 38.9%, 33.0%, 32.7%, and 18.5% for 5, 10, 20, and 50 mg V(V)/L, and AF5, respectively.
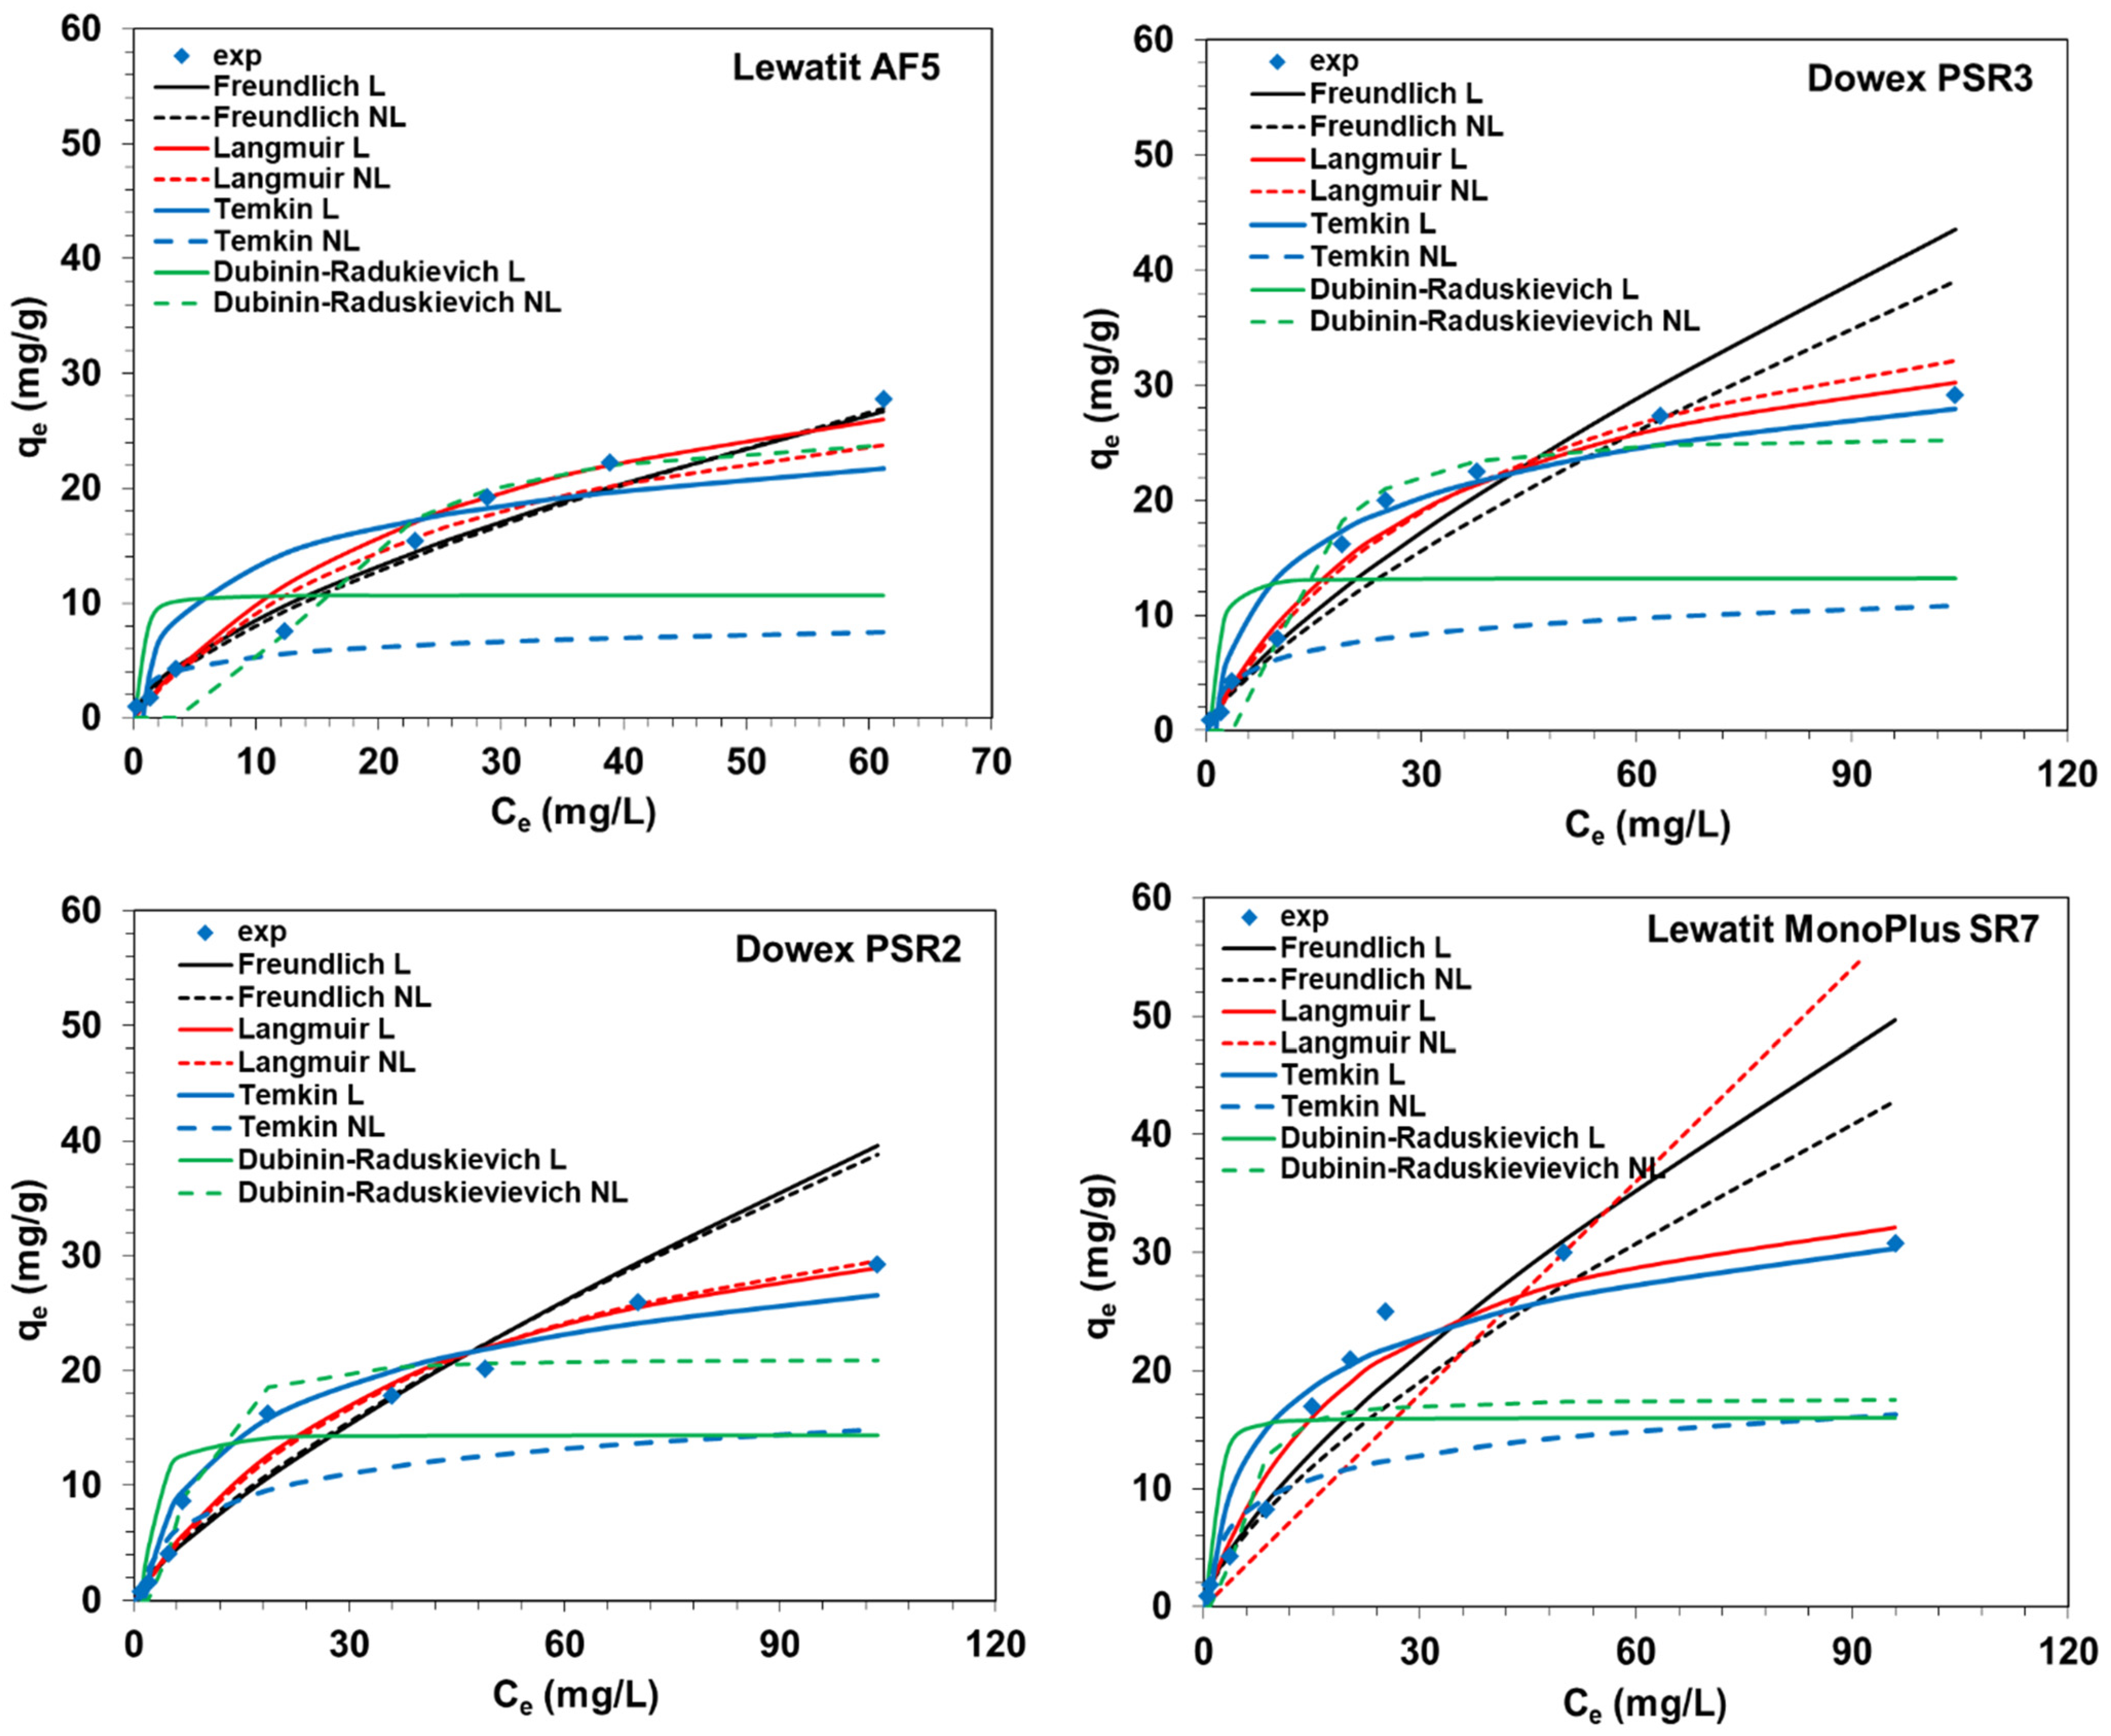
2.3. Equilibrium Studies
2.4. Desorption Studies
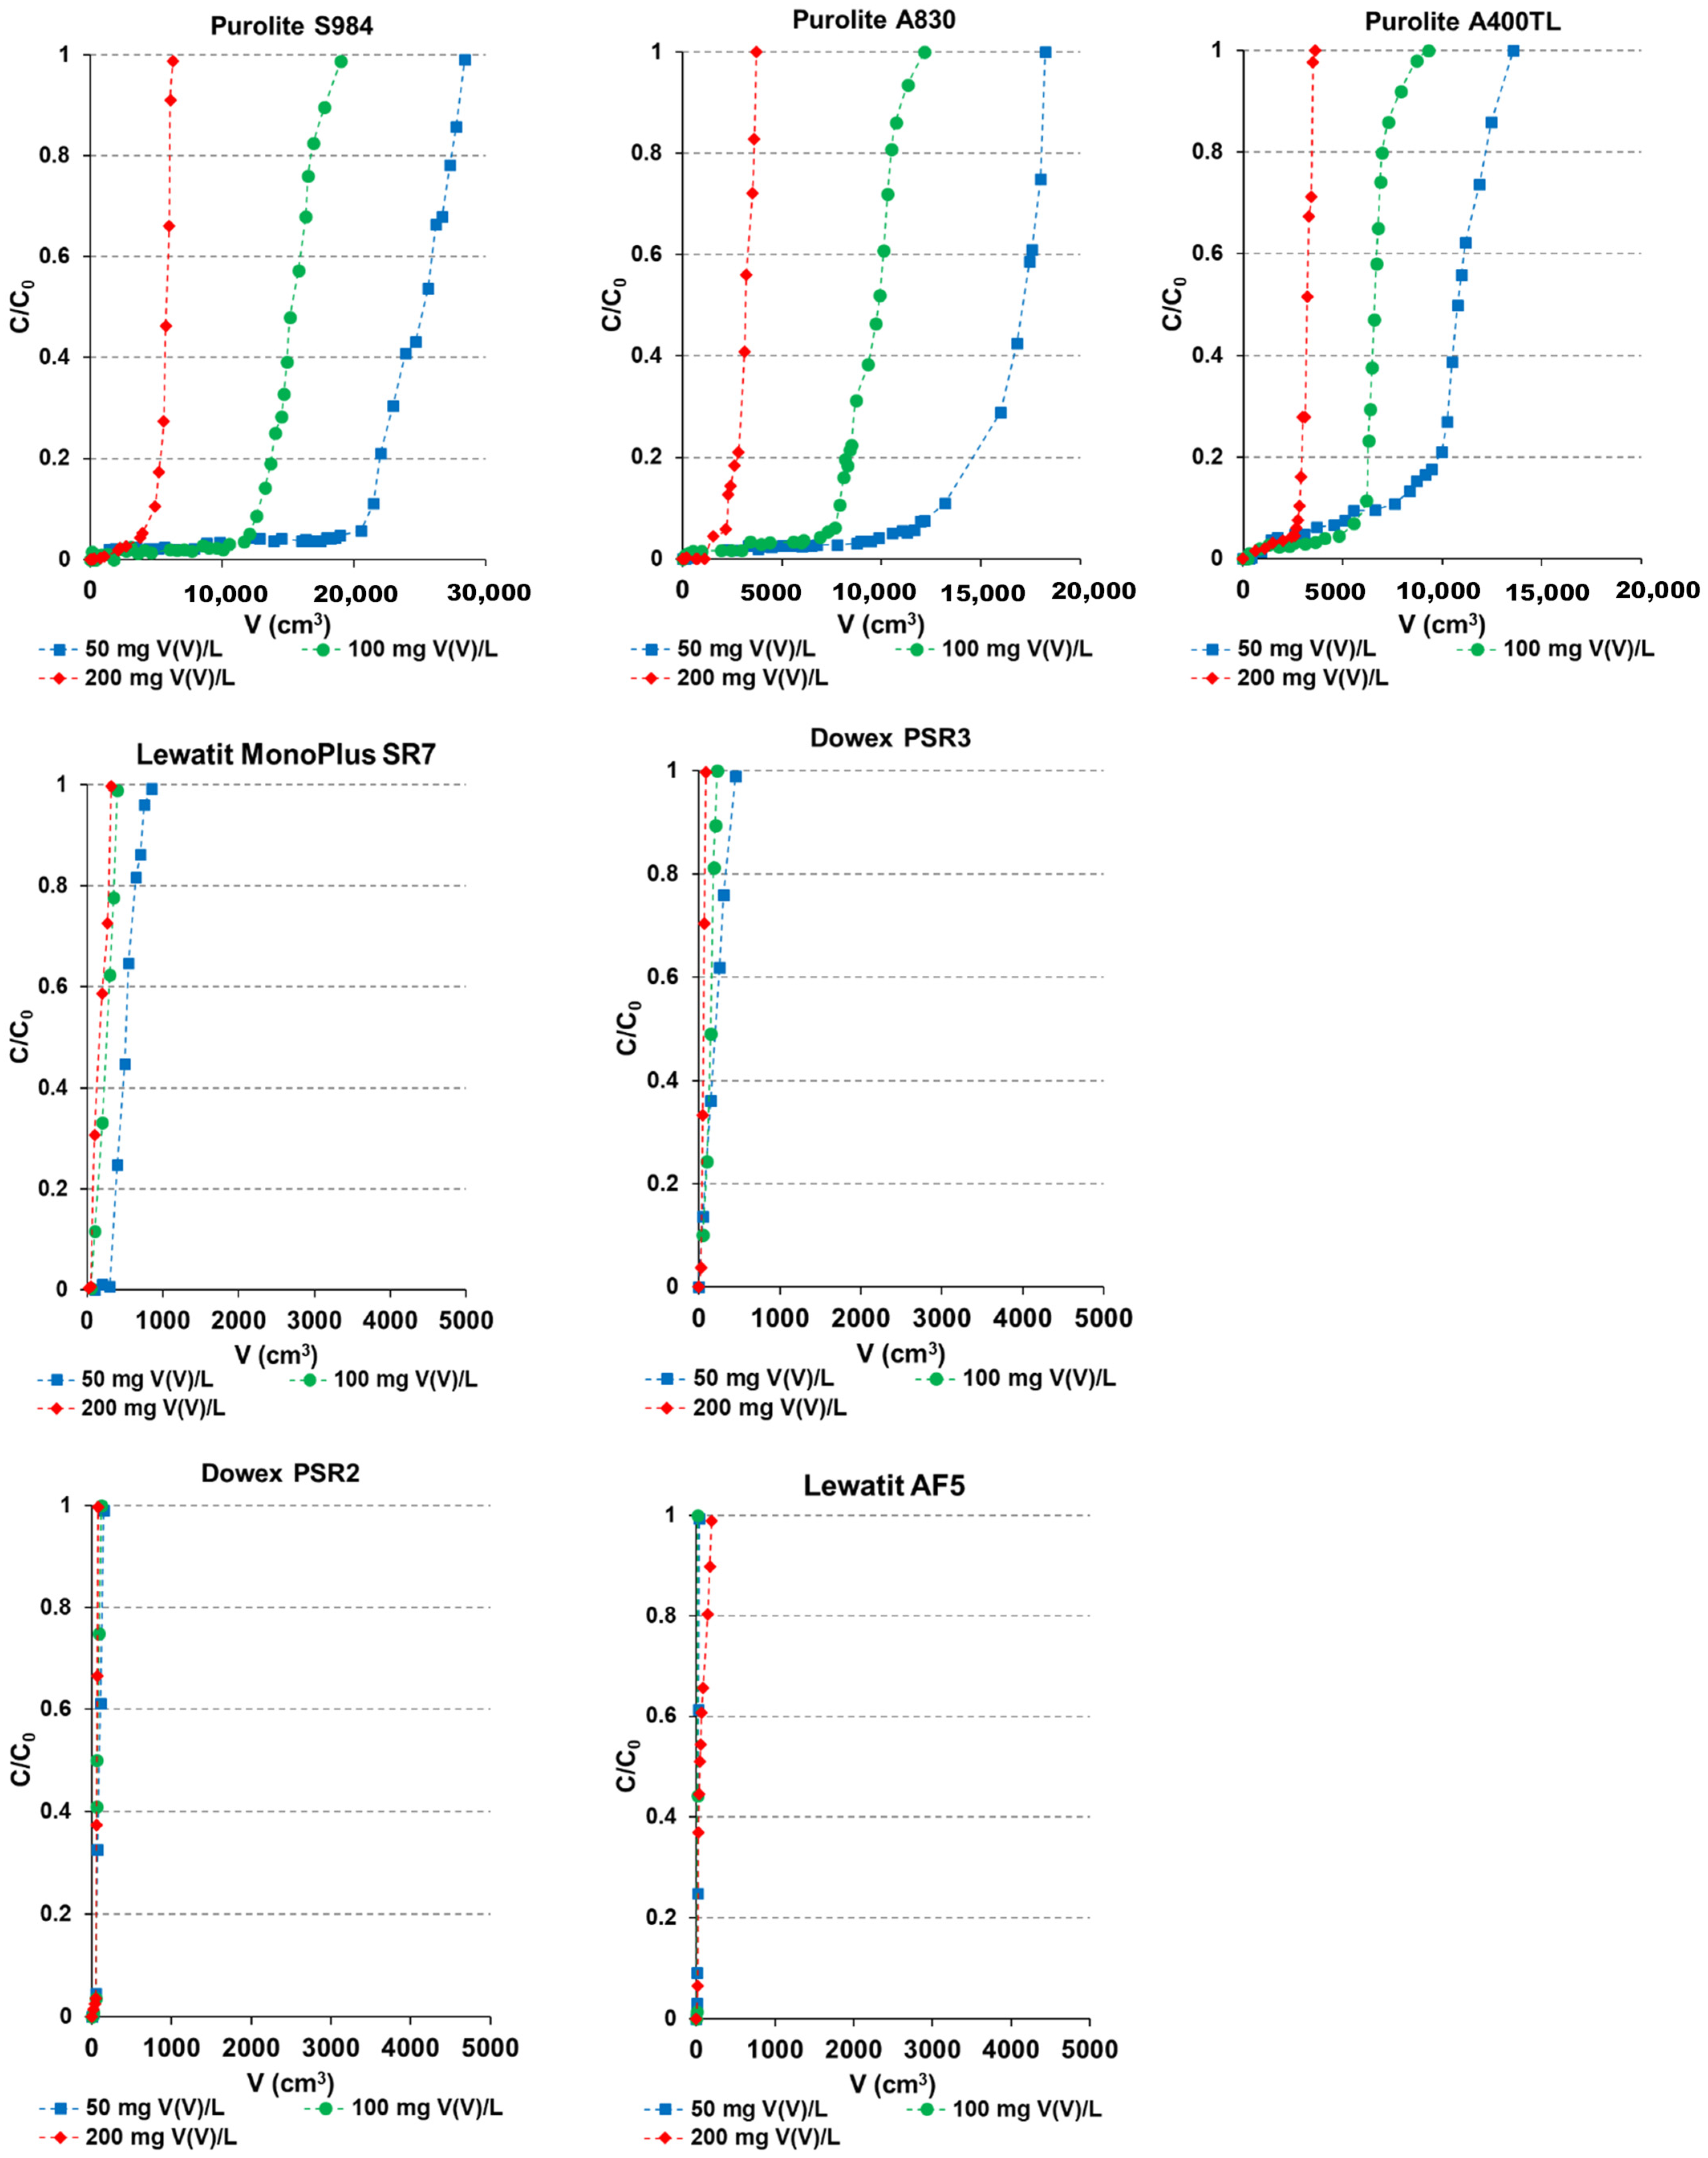
2.5. Column Studies
- C0 = 50 mg/L: S984 > A400TL > A830 > SR7 > PSR3 > PSR2 > AF5;
- C0 = 100 mg/L: S984 > A830 > A400TL > SR7 > PSR3 > PSR2 > AF5;
- C0 = 200 mg/L: S984 > A830 >A400TL > SR7 > PSR3 > PSR2 > AF5.
2.6. Removal of Vanadium from Real Wastewaters
3. Materials and Methods
3.1. Reagents and Instruments
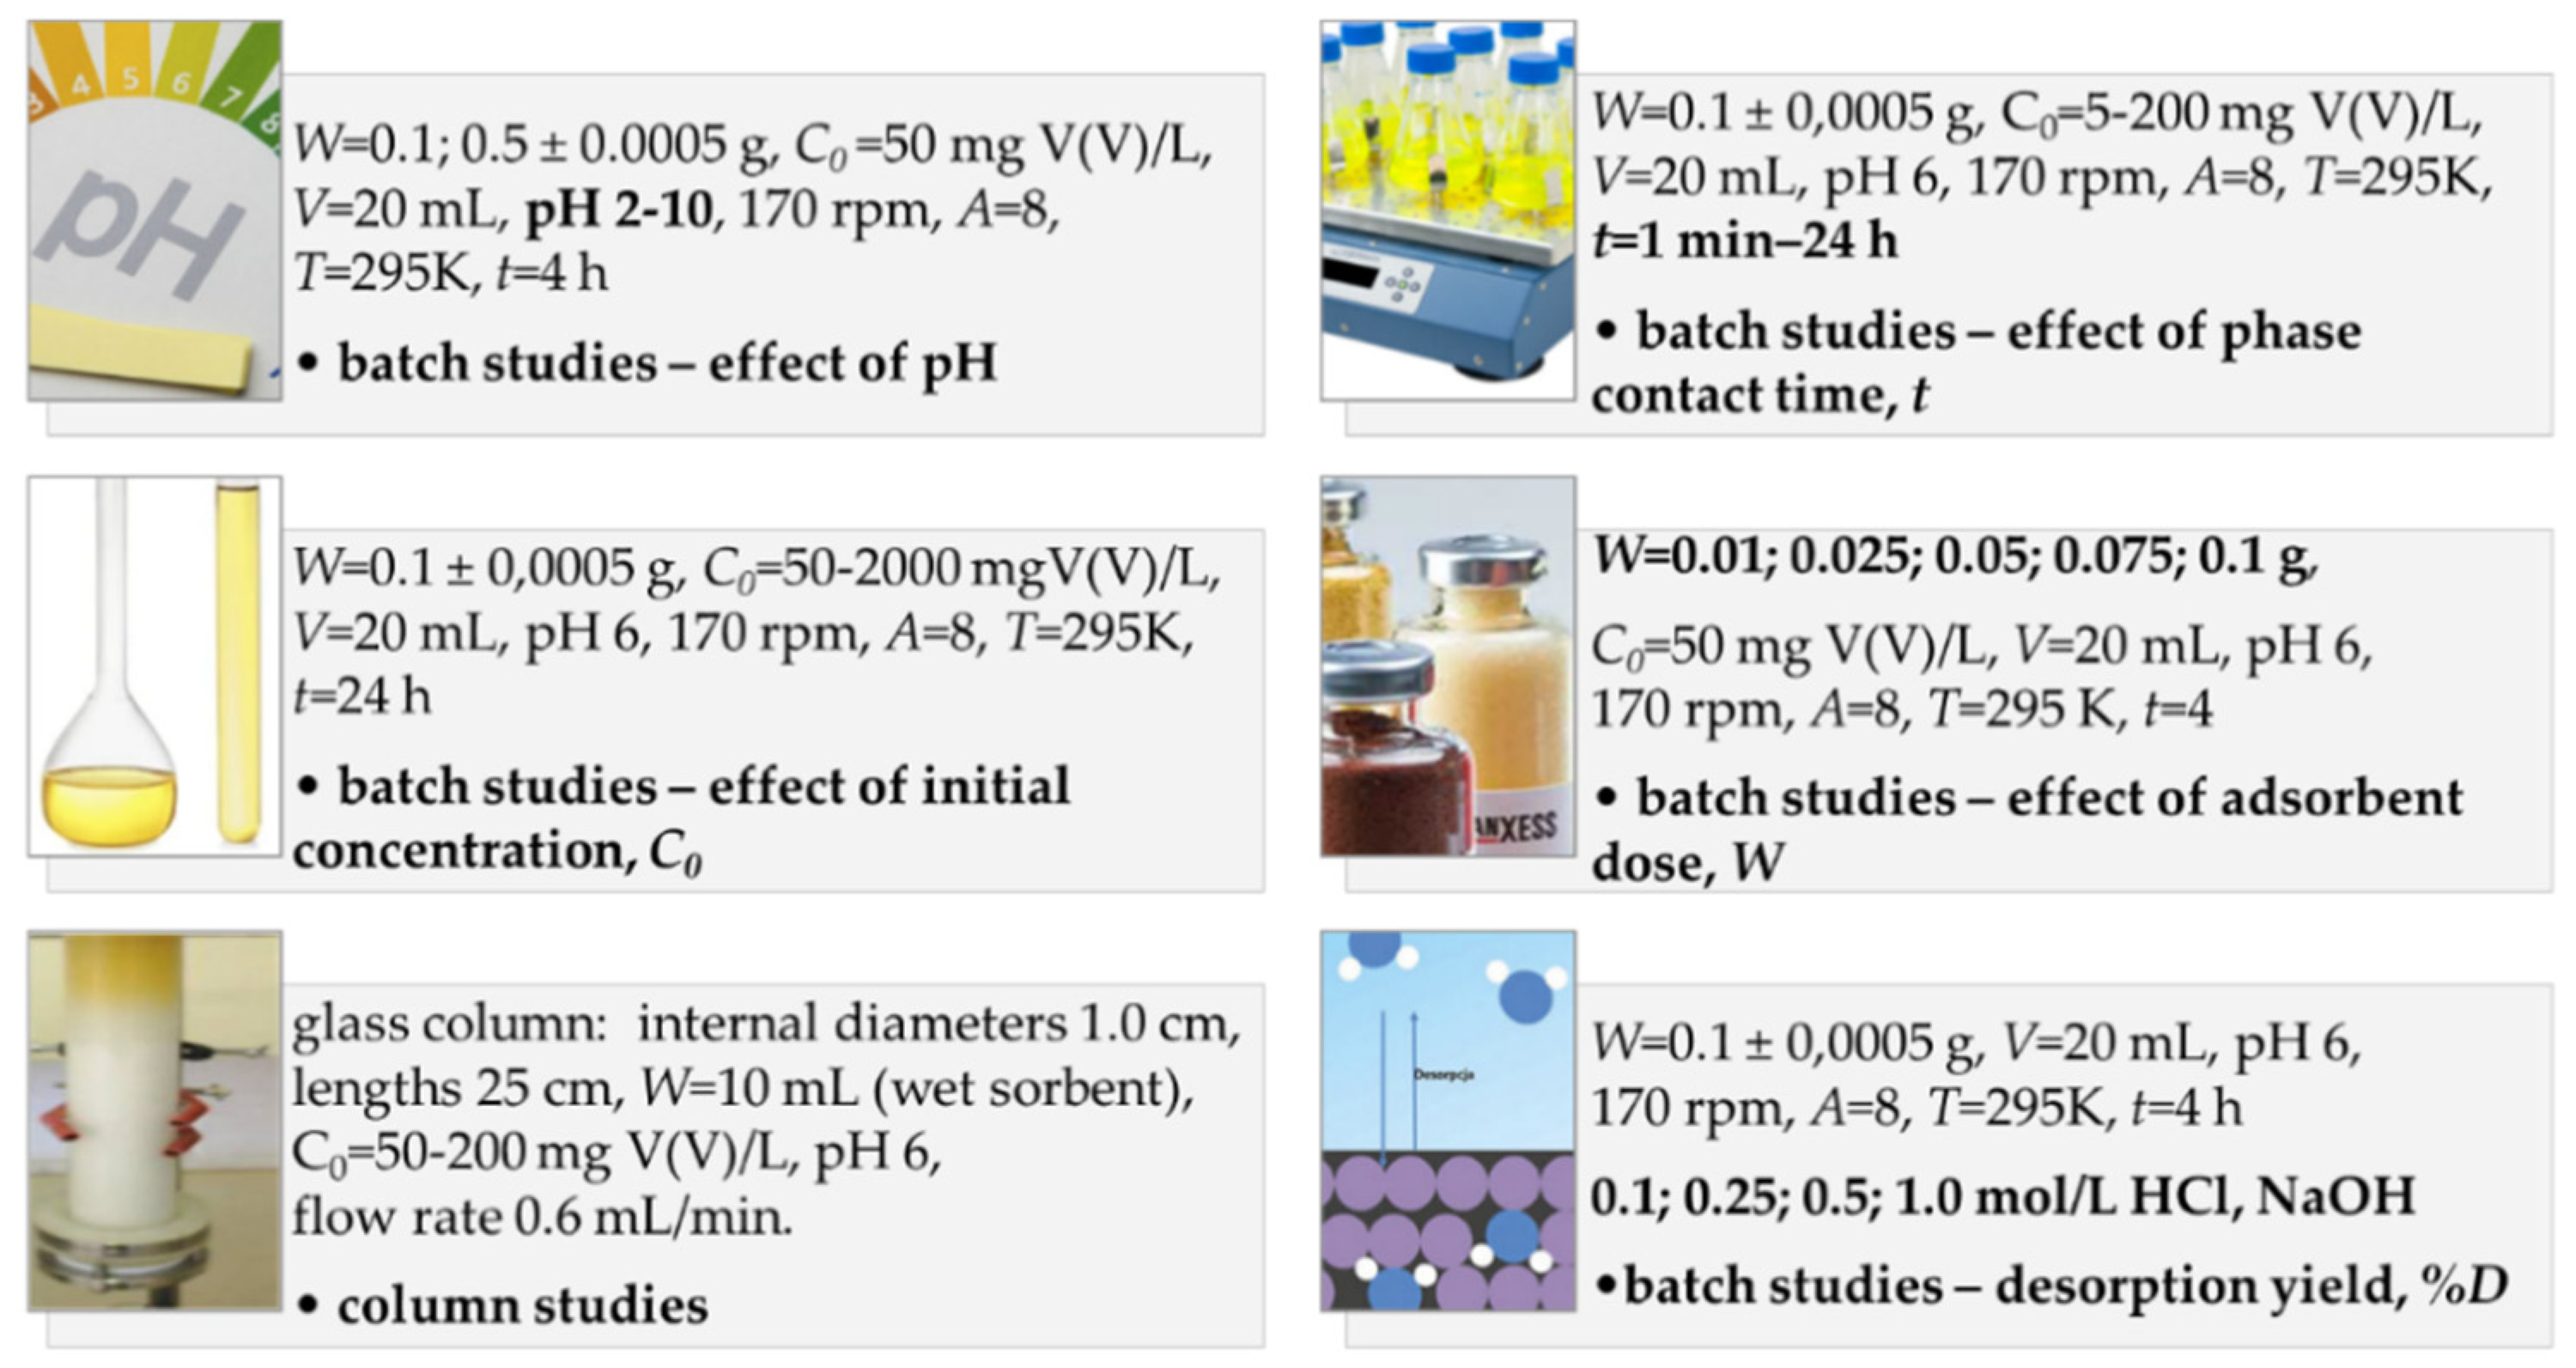
3.2. Batch and Column Studies—Experimental Conditions
4. Conclusions
Author Contributions
Funding
Institutional Review Board Statement
Informed Consent Statement
Data Availability Statement
Acknowledgments
Conflicts of Interest
Sample Availability
References
- Lee, J.-C.; Kim, E.Y.; Chung, K.W.; Kim, R.; Jeon, H.S. A review on the metallurgical recycling of vanadium from slags: Towards a sustainable vanadium production. J. Mater. Res. Technol. 2021, 12, 343–364. [Google Scholar] [CrossRef]
- Liu, J.; Huang, Y.; Li, H.; Duan, H. Recent advances in removal techniques of vanadium from water: A comprehensive review. Chemosphere 2022, 287, 132021. [Google Scholar] [CrossRef] [PubMed]
- Peng, H.; Guo, J.; Li, B.; Huang, H.; Shi, W.; Liu, Z. Removal and recovery of vanadium from waste by chemical precipitation, adsorption, solvent extraction, remediation, photo-catalyst reduction and membrane filtration. A review. Environ. Chem. Lett. 2022, 20, 1763–1776. [Google Scholar] [CrossRef]
- Kończyk, J.; Kluziak, K.; Kołodyńska, D. Adsorption of vanadium(V) ions from the aqueous solutions on different biomass-derived biochars. J. Environ. Manag. 2022, 313, 114958. [Google Scholar] [CrossRef] [PubMed]
- Polowczyk, I.; Cyganowski, P.; Urbano, B.F.; Rivas, B.L.; Bryjak, M.; Kabay, N. Amberlite IRA-400 and IRA-743 chelating resins for the sorption and recovery of molybdenum(VI) and vanadium(V): Equilibrium and kinetic studies. Hydrometallurgy 2017, 169, 496–507. [Google Scholar] [CrossRef]
- Gomes, H.I.; Jones, A.; Rogerson, M.; Greenway, G.M.; Lisbona, D.F.; Burke, I.T.; Mayes, W.M. Removal and recovery of vanadium from alkaline steel slag leachates with anion exchange resins. J. Environ. Manag. 2017, 187, 384–392. [Google Scholar] [CrossRef]
- Zhu, X.; Li, W.; Zhang, Q.; Zhang, C.; Chen, L. Separation characteristics of vanadium from leach liquor of red mud by ion exchange with different resins. Hydrometallurgy 2018, 176, 42–48. [Google Scholar] [CrossRef]
- Hu, J.; Wang, X.; Xiao, L.; Song, S.; Zhang, B. Removal of vanadium from molybdate solution by ion exchange. Hydrometallurgy 2009, 95, 203–206. [Google Scholar] [CrossRef]
- Zeng, L.; Li, Q.G.; Xiao, L.S. Extraction of vanadium from the leach solution of stone coal using ion exchange resin. Hydrometallurgy 2009, 97, 194–197. [Google Scholar] [CrossRef]
- Li, W.; Zhang, Y.; Liu, T.; Huang, J.; Wang, Y. Comparison of ion exchange and solvent extraction in recovering vanadium from sulfuric acid leach solutions of stone coal. Hydrometallurgy 2013, 131, 1–7. [Google Scholar] [CrossRef]
- Wołowicz, A.; Hubicki, Z. Removal of vanadium by ion exchange resins from model and real solutions from spent V2O5 catalyst. Hydrometallurgy 2022, 211, 105871. [Google Scholar] [CrossRef]
- Li, Q.G.; Zeng, L.; Xiao, L.S.; Yang, Y.N.; Zhang, Q.X. Completely removing vanadium from ammonium molybdate solution using chelating ion exchange resins. Hydrometallurgy 2009, 98, 287–290. [Google Scholar] [CrossRef]
- Fang, H.X.; Li, H.Y.; Xie, B. Effective chromium extraction from chromium containing vanadium slag by sodium roasting and water leaching. ISIJ Int. 2012, 52, 1958–1965. [Google Scholar] [CrossRef]
- Li, H.Y.; Li, C.; Zhang, M.; Wang, K.; Xie, B. Removal of V(V) from aqueous Cr(VI)- bearing solution using anion exchange resin: Equilibrium and kinetics in batch studies. Hydrometallurgy 2016, 165, 381–389. [Google Scholar] [CrossRef]
- Wołowicz, A.; Hubicki, Z. Enhanced Removal of Copper(II) from Acidic Streams Using Functional Resins: Batch and Column Studies. J. Mater. Sci. 2020, 55, 13687–13715. [Google Scholar] [CrossRef]
- Prekob, Á.; Hajdu, V.; Muránszky, G.; Kocserha, I.; Fiser, B.; Viskolcz, B.; Vanyorek, L. Application of carbonized ion exchange resin beads as catalyst support for gas phase hydrogenation processes. React. Kinet. Mech. Catal. 2020, 129, 85–94. [Google Scholar] [CrossRef]
- Burdzy, K.; Chen, Y.-G.; Lv, G.-Y.; Chen, S.-H.; Kołodyńska, D. Application of Ion Exchangers with the N-Methyl-D-Glucamine Groups in the V(V) Ions Adsorption Process. Materials 2022, 15, 1026. [Google Scholar] [CrossRef]
- Ezzeldin, H.A.; Apblett, A.; Foutch, G.L. Synthesis and properties of anion exchangers derived from chloromethyl styrene codivinylbenzene and their use in water treatment. Int. J. Polym. Sci. 2010, 2010, 684051. [Google Scholar] [CrossRef]
- Humelnicu, D.; Dragan, E.S. Evaluation of phosphate adsorption by porous strong base anion exchangers having hydroxyethyl substituents: Kinetics, equilibrium, and thermodynamics. Environ. Sci. Pollut. Res. 2021, 28, 7105–7115. [Google Scholar] [CrossRef]
- Kim, J.; Park, C.W.; Lee, K.-W.; Lee, T.S. Adsorption of Ethylenediaminetetraacetic Acid on a Gel-Type Ion-Exchange Resin for Purification of Liquid Waste Containing Cs Ions. Polymers 2019, 11, 297. [Google Scholar] [CrossRef] [Green Version]
- Application Note 50829, Carbon Black Analysis Using FT-IR with Germanium and Diamond ATR. Available online: thermoscientific.com (accessed on 20 August 2022).
- Wołowicz, A.; Hubicki, Z. Carbon-based adsorber resin Lewatit AF 5 applicability in metal ion recovery. Microporous Mesoporous Mater. 2016, 224, 400–414. [Google Scholar] [CrossRef]
- Fan, C.; Chen, N.; Qin, J.; Yang, Y.; Feng, C.; Li, M.; Gao, Y. Biochar stabilized nano zero-valent iron and its removal performance and mechanism of pentavalent vanadium(V(V)). Colloids Surf. A Physicochem. Eng. Asp. 2020, 599, 124882. [Google Scholar] [CrossRef]
- Keränen, A.; Leiviskä, T.; Salakka, A.; Tanskanen, J. Removal of nickel and vanadium from ammoniacal industrial wastewater by ion exchange and adsorption on activated carbon. Desalination Water Treat. 2013, 53, 2645–2654. [Google Scholar] [CrossRef]
- Leiviskä, T.; Matusik, J.; Muir, B.; Tanskanen, J. Vanadium removal by organo-zeolites and iron-based products from contaminated natural water. J. Clean. Prod. 2017, 167, 589–600. [Google Scholar] [CrossRef]
- Kong, X.; Chen, J.; Tang, Y.; Lv, Y.; Chen, T.; Wang, H. Enhanced removal of vanadium(V) from groundwater by layered double hydroxide-supported nanoscale zerovalent iron. J. Hazard. Mater. 2020, 392, 122392. [Google Scholar] [CrossRef]
- Greenwood, N.N.; Earnshaw, A. 22-Vanadium, Niobium and Tantalum. In Chemistry of the Elements, 2nd ed.; Butterworth-Heinemann: Oxford, UK, 1997; pp. 976–1001. [Google Scholar] [CrossRef]
- Guzmán-Pantoja, J.; Saucedo, I.; Navarro, R.; Revilla, J.; Guibal, E. Vanadium Interactions with Chitosan: Influence of Polymer Protonation and Metal Speciation. Langmuir 2002, 18, 1567–1573. [Google Scholar] [CrossRef]
- Dorsey, B.M.; McLauchlan, C.C.; Jones, M.A. Evidence That Speciation of Oxovanadium Complexes Does Not Solely Account for Inhibition of Leishmania Acid Phosphatases. Front. Chem. 2018, 6, 109. [Google Scholar] [CrossRef]
- Peacock, C.L.; Sherman, D.M. Vanadium(V) adsorption onto goethite (α-FeOOH) at pH 1.5 to 12: A surface complexation model based on ab initio molecular geometries and EXAFS spectroscopy. Geochim. Cosmochim. Acta 2004, 68, 1723–1733. [Google Scholar] [CrossRef]
- Livage, J. Hydrothermal Synthesis of Nanostructured Vanadium Oxides. Materials 2010, 3, 4175–4195. [Google Scholar] [CrossRef]
- Bello, A.; Leiviskä, T.; Zhang, R.; Tanskanen, J.; Maziarz, P.; Matusik, J.; Bhatnagar, A. Synthesis of zerovalent iron from water treatment residue as a conjugate with kaolin and its application for vanadium removal. J. Hazard. Mater. 2019, 374, 372–381. [Google Scholar] [CrossRef]
- Wołowicz, A.; Wawrzkiewicz, M.; Hubicki, Z. Toxic heavy metal ions and metal-complex dyes removal from aqueous solutions using an ion exchanger and titanium dioxide. Fibres Text. East. Eur. 2018, 26, 108–115. [Google Scholar] [CrossRef]
- Li, M.; Zhang, B.; Zou, S.; Liu, Q.; Yang, M. Highly selective adsorption of vanadium(V) by nano-hydrous zirconium oxide-modified anion exchange resin. J. Hazard. Mater. 2020, 384, 121386. [Google Scholar] [CrossRef] [PubMed]
- Zhang, R.; Leiviskä, T. Surface modification of pine bark with quaternary ammonium groups and its use for vanadium removal. Chem. Eng. J. 2020, 385, 123967. [Google Scholar] [CrossRef]
- Gomes, H.I.; Jones, A.; Rogerson, M.; Burke, I.T.; Mayes, W.M. Vanadium removal and recovery from bauxite residue leachates by ion exchange. Environ. Sci. Pollut. Res. 2016, 23, 23034–23042. [Google Scholar] [CrossRef]
- Pyrzyńska, K.; Wierzbicki, T. Pre-concentration and separation of vanadium on Amberlite IRA-904 resin functionalized with porphyrin ligands. Anal. Chim. Acta. 2005, 540, 91–94. [Google Scholar] [CrossRef]
- Zhu, X.; Li, W.; Zhang, C. Extraction and removal of vanadium by adsorption with resin 201*7 from vanadium waste liquid. Environ. Res. 2020, 180, 108865. [Google Scholar] [CrossRef]
- Chen, B.; Bao, S.X.; Zhang, Y.M.; Zheng, R.W. A high-efficiency approach for the synthesis of N235-impregnated resins and the application in enhanced adsorption and separation of vanadium(V). Minerals 2018, 8, 358. [Google Scholar] [CrossRef]
- Zheng, R.W.; Bao, S.X.; Zhang, Y.M.; Chen, B. Synthesis of di-(2-ethylhexyl) phosphoric acid (D2EHPA)-Tributyl phosphate (TBP) impregnated resin and application in adsorption of vanadium(IV). Minerals 2018, 8, 206. [Google Scholar] [CrossRef]
- Lagergren, S.K. About the theory of so-called adsorption of soluble substances. Sven. Vetenskapsakad. Handingarl 1898, 24, 1–39. [Google Scholar]
- Ho, Y.S.; McKay, G. Pseudo-second order model for sorption processes. Process Biochem. 1999, 34, 451–465. [Google Scholar] [CrossRef]
- Weber, W.J.; Morris, J.C. Kinetics of adsorption on carbon from solution. J. Sanit. Eng. Div. 1963, 89, 31–60. [Google Scholar] [CrossRef]
- Stanisz, M.; Klapiszewski, Ł.; Kołodyńska, D.; Jesionowski, T. Development of functional lignin-based spherical particles for the removal of vanadium(V) from an aqueous system. Inter. J. Biol. Macromol. 2021, 186, 181–193. [Google Scholar] [CrossRef] [PubMed]
- Kajjumba, G.W.; Aydın, S.; Güneysu, S. Adsorption isotherms and kinetics of vanadium by shale and coal waste. Adsorp. Sci. Technol. 2018, 36, 936–952. [Google Scholar] [CrossRef]
- Gurjar, V.R.; Koujalagi, P.S.; Revankar, H.N.; Kulkarni, R.M. Adsorptive removal of vanadium from aqueous media by ion exchange resin. Emerg. Mater. 2021. [Google Scholar] [CrossRef]
- Langmuir, I. The adsorption of gases on plane surfaces of glass, mica and platinum. J. Am. Chem. Soc. 1918, 40, 1361–1403. [Google Scholar] [CrossRef]
- Freundlich, H.M.F. Over the adsorption in solution. J. Phys. Chem. 1906, 57, 385–471. [Google Scholar]
- Wawrzkiewicz, M.; Wołowicz, A.; Hubicki, Z. Strongly Basic Anion Exchange Resin Based on a Cross-Linked Polyacrylate for Simultaneous, C.I. Acid Green 16, Zn(II), Cu(II), Ni(II) and Phenol Removal. Molecules 2022, 27, 2096. [Google Scholar] [CrossRef]
- Temkin, M.I.; Pyzhev, V. Kinetics of ammonia synthesis on promoted iron catalysts. Acta Physicochim. URSS 1940, 12, 327–356. [Google Scholar]
- Redlich, O.; Peterson, D.L. A useful adsorption isotherm. J. Phys. Chem. 1959, 63, 1024. [Google Scholar] [CrossRef]
- Zhu, H.W.; Xiao, X.Y.; Guo, Z.H.; Han, X.Q.; Liang, Y.Q.; Zhang, Y.; Zhou, C. Adsorption of vanadium(V) on natural kaolinite and montmorillonite: Characteristics and mechanism. Appl. Clay Sci. 2018, 161, 310–316. [Google Scholar] [CrossRef]
- Liu, X.; Zhang, L. Insight into the adsorption mechanisms of vanadium(V) on a high-efficiency biosorbent (Ti-doped chitosan bead). Int. J. Biol. Macromol. 2015, 79, 110–117. [Google Scholar] [CrossRef] [PubMed]
- Zeng, L.; Cheng, C.Y. A literature review of the recovery of molybdenum and vanadium from spent hydrodesulphurisation catalysts Part II: Separation and purification. Hydrometallurgy 2009, 98, 10–20. [Google Scholar] [CrossRef]
- Huang, J.; Su, P.; Wu, W.; Liao, S.; Qin, H.; Wu, X.; He, X.; Tao, L.; Fan, Y. Concentration and separation of vanadium from alkaline media by strong alkaline anion-exchange resin 717. Rare Met. 2010, 29, 439–443. [Google Scholar] [CrossRef]
- Zhao, Z.; Li, X.; Zhao, Q. Recovery of V2O5 from Bayer liquor by ion exchange. Rare Met. 2010, 29, 117–120. [Google Scholar] [CrossRef]
- Mangini, L.F.K.; Valt, R.B.G.; de Santana Ponte, M.J.J.; de Araújo Ponte, H. Vanadium removal from spent catalyst used in the manufacture of sulfuric acid by electrical potential application. Sep. Purif. Technol. 2020, 246, 116854. [Google Scholar] [CrossRef]
- Mohanty, J.; Rath, P.C.; Bhattacharya, I.N.; Paramguru, R.K. The recovery of vanadium from spent catalyst: A case study. Miner. Process. Extr. Metall. 2011, 120, 56–60. [Google Scholar] [CrossRef]
- Park, K.H.; Mohapatra, D.; Reddy, B.R. Selective recovery of molybdenum from spent HDS catalyst using oxidative soda ash leach/carbon adsorption method. J. Hazard. Mater. 2006, 138, 311–316. [Google Scholar] [CrossRef]
- Popoola, L.T. Characterization and adsorptive behaviour of snail shell-rice husk (SS-RH) calcined particles (CPs) towards cationic dye. Heliyon 2019, 5, e01153. [Google Scholar] [CrossRef] [PubMed] [Green Version]


| Properties | SR7 | A400TL | PSR2 | PSR3 | A830 | S984 | AF5 | |
|---|---|---|---|---|---|---|---|---|
| Manufacturer | Lanxess | Lanxess | Dow | Dow | Purolite | Purolite | Lanxess | |
| Type | SBA | SBA | SBA | SBA | WBA | WBA/chelating | sorbent without FG | |
| Matrix | DVB cross-linked polystyrene | DVB cross-linked polystyrene | DVB cross-linked polystyrene | DVB cross-linked polystyrene | DVB cross-linked polyacrylic | DVB cross-linked polyacrylic | carbonaceous | |
| Structure | macroporous | microporous | microporous | macroporous | macroporous | macroporous | microporous | |
| Functional Groups (FG) | quaternary ammonium, type 3 | quaternary ammonium, type 1 | quaternary ammonium, tri-n-butyl amine | complex amine | polyamine * | without | ||
| Size (mm) | 0.57–0.67 | 0.425–0.85 | 0.3–1.2 | 0.3–1.2 | 0.3–1.2 | - | 0.4–0.8 | |
| Max temp. (°C) | 80 | 100 (Cl−)60 (OH−) | 60 | 60 | 100 (Cl−)40 (OH−) | 100 (Cl−) | 300 | |
| pH range | 0–14 | 0–14 | 0–14 | 0–14 | 0–9 | 0–10 | 0–14 | |
| Total capacity (eq/L) | 0.6 | 1.3 | 0.65 | 0.6 | 2.75 | 2.7 | - | |
| Water retention (%) | 59–64 | 48–54 | 40–48 | 50–65 | 47–53 | 45–55 | 48–60 | |
| Appearance |  |  |  |  |  |  |  | |
| %N | 2.58 | 4.54 | 2.49 | 2.25 | 16.35 | 18.13 | 0.02 | [11] |
| %C | 70.79 | 59.64 | 71.38 | 73.89 | 46.00 | 46.95 | 93.81 | |
| %H | 6.49 | 9.76 | 8.02 | 10.89 | 8.39 | 7.62 | 1.58 | |
| %S | 0.26 | 0.24 | 1.28 | 0.06 | 0.00 | 0.87 | 0.91 | |
| SBET (m2/g) | 19.69 | 4.20 | 6.32 | 6.36 | 9.66 | 3.80 | 988.8 | |
| Ps (nm) | 44.61 | 2.35 | 10.08 | 3.65 | 48.83 | 89.36 | 2.31 | |
| Pv (cm3/g) | 0.220 | 0.002 | 0.016 | 0.006 | 0.012 | 0.085 | 0.572 | |
| pHPZC | 1.48 | 1.00 | 1.00 | 1.03 | 6.05 | 9.01 | 7.09 | [15] |
| Parameters | Equation | No. |
|---|---|---|
| Static method | ||
| percentage removal (%R) | (1) | |
| sorption capacity (qe) (mg/g) | (2) | |
| amount of V(V) adsorbed after time t (qt) (mg/g) | (3) | |
| Dynamic method | ||
| weight distribution coefficient (Dw) | (4) | |
| bed distribution coefficient (Db) | (5) | |
| working ion exchange capacity (Cw) (g/mL) | (6) | |
| Parameters | A830 | S984 | A400TL | SR7 | PSR2 | PSR3 | |||||||
|---|---|---|---|---|---|---|---|---|---|---|---|---|---|
| C0(mg/L) | 50 | 100 | 200 | 50 | 100 | 200 | 50 | 100 | 200 | 200 | 200 | 200 | |
| qe, exp | 8.77 | 18.09 | 40.38 | 8.30 | 16.95 | 39.10 | 8.82 | 19.34 | 41.54 | 40.52 | 38.88 | 23.92 | |
| PFO-L | qe, cal | 4.88 | 10.35 | 32.04 | 3.94 | 8.46 | 28.27 | 0.62 | 3.44 | 33.91 | 10.30 | 14.23 | 17.04 |
| k1 | 0.022 | 0.012 | 0.007 | 0.013 | 0.014 | 0.013 | 0.019 | 0.005 | 0.021 | 0.025 | 0.007 | 0.004 | |
| R2 | 0.957 | 0.906 | 0.985 | 0.906 | 0.896 | 0.959 | 0.710 | 0.439 | 0.954 | 0.959 | 0.904 | 0.909 | |
| PFO-NL | qe, cal | 7.56 | 16.32 | 23.83 | 7.40 | 16.54 | 35.18 | 8.45 | 17.90 | 44.18 | 37.95 | 30.03 | 12.85 |
| k1 | 0.137 | 0.066 | 0.088 | 0.104 | 0.058 | 0.043 | 0.772 | 0.384 | 0.015 | 0.384 | 0.561 | 0.147 | |
| R2 | 0.865 | 0.950 | 0.645 | 0.886 | 0.991 | 0.962 | 0.798 | 0.938 | 0.960 | 0.853 | 0.429 | 0.610 | |
| R2adj | 0.834 | 0.939 | 0.566 | 0.861 | 0.989 | 0.953 | 0.753 | 0.924 | 0.951 | 0.821 | 0.302 | 0.524 | |
| MPSD | 0.379 | 0.638 | 1.359 | 0.645 | 0.062 | 0.411 | 0.067 | 0.061 | 0.398 | 0.185 | 0.455 | 0.695 | |
| χ2 | 1.79 | 2.93 | 24.79 | 2.06 | 0.39 | 4.58 | 13.40 | 29.47 | 19.89 | 4.22 | 12.43 | 11.14 | |
| SSE | 11.36 | 21.23 | 690.39 | 8.45 | 3.94 | 92.82 | 92.11 | 392.62 | 237.27 | 106.95 | 367.31 | 212.68 | |
| PSO-L | qe, cal | 8.83 | 18.26 | 41.22 | 8.35 | 17.11 | 39.74 | 8.82 | 19.35 | 43.10 | 40.59 | 39.02 | 24.25 |
| k2 | 0.017 | 0.004 | 0.001 | 0.015 | 0.006 | 0.001 | 0.178 | 0.010 | 0.001 | 0.014 | 0.003 | 0.001 | |
| R2 | 1.000 | 1.000 | 0.996 | 1.000 | 1.000 | 1.000 | 1.000 | 1.000 | 0.996 | 1.000 | 1.000 | 0.991 | |
| h | 1.32 | 1.49 | 1.04 | 1.07 | 1.62 | 2.10 | 13.87 | 3.76 | 1.16 | 22.98 | 4.22 | 0.49 | |
| PSO-NL | qe, cal | 8.33 | 17.77 | 26.63 | 7.98 | 18.53 | 39.51 | 8.83 | 18.88 | 54.40 | 39.79 | 32.74 | 14.82 |
| k2 | 0.020 | 0.004 | 0.004 | 0.017 | 0.003 | 0.001 | 0.138 | 0.028 | 0.000 | 0.015 | 0.022 | 0.010 | |
| MPSD | 0.1245 | 0.4581 | 0.9113 | 0.416 | 0.139 | 0.225 | 0.009 | 0.009 | 0.603 | 0.058 | 0.226 | 0.410 | |
| R2 | 0.963 | 0.980 | 0.768 | 0.947 | 0.972 | 0.988 | 0.973 | 0.984 | 0.909 | 0.960 | 0.727 | 0.765 | |
| R2adj | 0.952 | 0.975 | 0.702 | 0.936 | 0.966 | 0.985 | 0.967 | 0.981 | 0.888 | 0.951 | 0.666 | 0.712 | |
| χ2 | 0.55 | 1.75 | 16.73 | 3.78 | 8.33 | 12.15 | 0.06 | 0.15 | 12.86 | 1.25 | 5.91 | 6.78 | |
| SSE | 3.31 | 8.72 | 471.92 | 11.37 | 74.72 | 184.29 | 0.45 | 2.53 | 387.61 | 28.22 | 167.68 | 131.14 | |
| IPD | qe, cal | 34.22 | 73.36 | 71.14 | 32.79 | 84.76 | 88.06 | 58.62 | 147.0 | 135.4 | 50.25 | 49.01 | 32.45 |
| ki | 0.87 | 1.91 | 1.72 | 0.83 | 2.24 | 2.01 | 1.44 | 3.76 | 3.48 | 0.39 | 0.54 | 0.69 | |
| R2 | 0.943 | 0.967 | 0.995 | 0.979 | 0.908 | 0.913 | 0.960 | 0.950 | 0.901 | 0.860 | 0.859 | 0.948 | |
| R2adj | 0.914 | 0.950 | 0.993 | 0.968 | 0.862 | 0.738 | 0.881 | 0.900 | 0.703 | 0.581 | 0.577 | 0.922 | |
| Adsorbent | Kinetic Studies | Isotherm Studies | Ref. |
|---|---|---|---|
| * linear, ** non-linear regression | |||
| Amberlite® IRA-400 | W = 10 g; V = 150 mL; 150 rpm; t = 1–30 min; T = 20 °C Post-closure effluent: C0 = 5.3 mg/L; pH 11.5 Op. BRDA leachate: C0 = 4.7 mg/L; pH 13.3 * PFO Post-closure effluent: k1 = 1.181 1/min; R2 = 0.977 Op. BRDA leachate: k1 = 0.545 1/min; R2 = 0.985 | V = 20 mL; C0 = 1–50 g/L; 150 rpm; t =30 min; T = 20 °C Langmuir (L), Freundlich (F) Post-closure effluent: pH 11.5 L: qmax = 1.135 mg/g; b = 3.218 L/mg; R2 = 0.859, F: kF = 0.547; n = 2.383; R2 = 0.999, Op. BRDA leachate: pH 13.3 L: qmax = 9.759 mg/g; b = 0.060 L/mg; R2 = 0.919, F: kF = 0.285; n = 1.050; R2 = 0.993 | [36] |
| Lewatit MonoPlus TP220; Dowex M4195 | W = 0.1 ± 0,0005 g; C0 = 50; 100; 200 mg V(V)/L; V = 20 mL; pH 4; 170 rpm, A = 8; T = 295 K, t = 1 min–24 h *, ** PFO, PSO, IPD C0 = 50 mg/L, * PSO: qe cal = 7.68 mg/g; k2 =0.018 g/mg min; R2 = 0.998, TP220 C0 = 50 mg/L, * PSO: qe cal=9.54 mg/g; k2 = 0.021 g/mg min; R2 = 0.999, M4195 | W = 0.1 ± 0.0005 g; C0 = 50–2000 mg V(V)/L; V = 20 mL; pH 4; 170 rpm, A = 8; T = 295 K; t=24 h *, ** Langmuir (L), Freundlich (F), Temkin (T), Dubinin-Radushkevich (D-R) * L: qmax = 247.8 mg/g; kL = 0.014 L/mg; R2 = 0.963, TP220; * L: qmax = 208.8 mg/g; kL = 0.037 L/mg; R2 = 0.998, M4195 **F and L, TP220; ** L and T, M4195 | [11] |
| Amberlite IRA743; Lewatit MK51; Purolite S110; Purolite S108 | 1 g/L; C0 = 10–100 mg V(V)/L; pH 5; 180 rpm, A = 7; T = 293 K, t = 1–240 min ** PFO, PSO, IPD, Boyd C0 = 50 mg/L: ** PSO: qe cal = 31.28 mg/g; k2 = 0.0017 g/mg min; R2 = 0.978, IRA473 ** PSO: qe cal = 32.35 mg/g; k2 = 0.0015 g/mg min; R2 = 0.992, MK51 ** PSO: qe cal = 39.18 mg/g; k2 = 0.0014 g/mg min; R2 = 0.988, S110 ** PSO: qe cal = 41.06 mg/g; k2 = 0.0021 g/mg min; R2 = 0.994, S108 ** PFO R2 = 0.882–0.999; IPD R2 = 0.933–0.993, Boyd 0.947–0.998 for all resin and concentration | 1 g/L; C0 = 10–150 mg V(V)/L; pH 5; T=293, 313, 333 K, t = 240 min ** Langmuir (L), Freundlich (F), Temkin (T) at 333K: ** L: qmax = 68.27 mg/g; kL = 0.122 L/mg; R2 = 0.940, IRA473; ** L: qmax = 72.51 mg/g; kL = 0.150 L/mg; R2 = 0.975, MK51; ** L: qmax = 66.42 mg/g; kL = 0.277 L/mg; R2 = 0.989, S110; ** L: qmax = 77.03 mg/g; kL = 0.416 L/mg; R2 = 0.992, S108; at 293, 313, 333 K: L: R2 = 0.992–0.997; F: R2 = 0.958–0.998; T: R2 = 0.802–0.996 | [17] |
| Tulsion A-62 | W = 0.1 g; V = 40 mL; 160 rpm, t = 10–200 min %R = 70% (15 min), %R = 97.5% (180 min) no kinetic model was used | * Langmuir (L), Freundlich (F) L: qmax = 36.9 mg/g; kL = 0.585 1/mol; R2 = 0.964; F: kF = 15.33 mg/g; n = 3.2 L/g; R2 = 0.980 | [46] |
| biochars BC2 | W=0.5 g; C0 =10–50 mg V(V)/L; V=20 mL; pH 3; t=5–360 min * PFO, PSO, IPD C0 = 50 mg/L: *PSO: qe cal = 0.83 mg/g; k2 =0.07 g/mg min; R2 = 0.999 C0 = 10–50 mg/L: *PFO R2 = 0.912–0.990; IPD R2=0.816–0.997 | W=0.5 g; C0 = 5–150 mg V(V)/L; V = 20 mL; pH 3; t = 300 min, T = 298K * Langmuir (L), Freundlich (F), Temkin (T), Dubinin-Radushkevich (D-R) * L: qmax = 0.52 mg/g; kL = 0.05 L/mg; R2 = 0.974 * F: kF = 0.06 mg/g; n = 1.96 L/g; R2 = 0.998 * T: kT = 0.82 L/g; bT = 21.62 kJ/mol; R2 = 0.952 * D-R: qm = 0.31 × 10⁻⁴ mol/g; KDR = 4.7 × 10⁻³ mol2/kJ2; R2 = 0.993 | [4] |
| Purolite A830, Purolite S984, Purolite A400TL, Lewatit MonoPlus SR7, Dowex PSR2, Dowex PSR3, Lewatit AF5 | W = 0.1 ± 0,0005 g; C0 = 50; 100; 200 mg V(V)/L; V = 20 mL; pH 6; 170 rpm, A = 8; T = 295 K, t = 1 min–24 h *, ** PFO, PSO, IPD C0 = 50 mg/L: * PSO: qe cal = 8.83 mg/g; k2 = 0.017 g/mg min; R2 = 1.000, A830; * PSO: qe cal = 8.35 mg/g; k2 = 0.015 g/mg min; R2 = 1.000, S984; * PSO: qe cal = 8.82 mg/g; k2 = 0.178 g/mg min; R2 = 1.000, A400TL; * PSO: qe cal = 8.79 mg/g; k2 = 0.055 g/mg min; R2 = 1.000, SR7; * PSO: qe cal = 8.02 mg/g; k2 = 0.005 g/mg min; R2 = 0.997, PSR2; * PSO: qe cal = 8.77 mg/g; k2 = 0.039 g/mg min; R2 = 1.000, PSR3; AF5-no kinetic model was used | W = 0.1 ± 0,0005 g; C0 = 50; 100; 200 mg V(V)/L; V = 20 mL; pH 6; 170 rpm, A = 8; T = 295 K, t = 24 h *, ** Langmuir (L), Freundlich (F), Temkin (T), Dubinin-Radushkevich (D-R) * L: qmax = 204.1 mg/g; kL = 0.098 L/mg; R2 = 1.000, A830 * L: qmax = 256.62 mg/g; kL = 0.008 L/mg; R2 = 0.927, S984; * L: qmax = 204.27 mg/g; kL = 0.0049 L/mg; R2 = 0.999, A400TL; * L: qmax = 39.49 mg/g; kL = 0.045 L/mg; R2 = 0.959, SR7; * L: qmax = 40.42 mg/g; kL = 0.024 L/mg; R2 = 0.940, PSR2; * L: qmax = 39.57 mg/g; kL = 0.31 L/mg; R2 = 0.955, PSR3; * F: kF = 2.00 mg1−1/n L1/n/g; 1/n = 0.63; R2 = 0.972, AF5 | This paper |
| Isotherm | Non-linear Forms | Equation | Linear Forms | Equation | ||||
|---|---|---|---|---|---|---|---|---|
| Langmuir | (16) | (17) | ||||||
| Freundlich | (18) | (19) | ||||||
| Temkin | (20) | (21) | ||||||
| Dubinin-Radushkevich | (22) | (25) | ||||||
| (23) | ||||||||
| (24) | ||||||||
| Isotherm Parameters | ||||||||
| Model | Parameters | S984 | A830 | A400TL | SR7 | PSR2 | PSR3 | AF5 |
| Qe, exp. (mg/g) | 221.4 | 202.00 | 200.4 | 30.80 | 29.28 | 29.12 | 27.76 | |
| Langmuir | Q0 (mg/g) | 256.62 | 204.10 | 204.27 | 39.49 | 40.42 | 39.57 | 37.98 |
| kL (L/mg) | 0.008 | 0.098 | 0.049 | 0.045 | 0.024 | 0.031 | 0.035 | |
| R2 | 0.927 | 1.000 | 0.999 | 0.959 | 0.940 | 0.955 | 0.772 | |
| Freundlich | kF (mg1−1/n L1/n/g) | 5.58 | 24.19 | 19.87 | 1.84 | 1.13 | 1.37 | 2.00 |
| 1/n | 0.613 | 0.377 | 0.395 | 0.722 | 0.766 | 0.745 | 0.630 | |
| R2 | 0.691 | 0.820 | 0.769 | 0.963 | 0.942 | 0.962 | 0.972 | |
| Temkin | bT (J g/mol mg) | 52.40 | 87.12 | 82.78 | 386.72 | 394.73 | 397.73 | 537.26 |
| A (L/mg) | 0.170 | 2.730 | 1.466 | 1.198 | 0.668 | 0.847 | 1.806 | |
| R2 | 0.904 | 0.947 | 0.960 | 0.897 | 0.954 | 0.924 | 0.793 | |
| Dubinin–Raduskievich | qm (mg/g) | 159.50 | 118.45 | 136.78 | 15.99 | 14.39 | 13.24 | 10.70 |
| kDR (mol2J2) | 6.1 × 10⁻⁵ | 3.76 × 10⁻⁷ | 1.57 × 10⁻⁶ | 4.40 × 10⁻⁷ | 11.3 × 10⁻⁷ | 5.16 × 10⁻⁷ | 1.31 × 10⁻⁷ | |
| E (kJ/mol) | 0.091 | 1.154 | 0.565 | 1.068 | 0.665 | 0.985 | 1.957 | |
| R2 | 0.921 | 0.694 | 0.774 | 0.747 | 0.736 | 0.596 | 0.513 | |
| S984 | A830 | A400TL | SR7 | PSR2 | PSR3 | AF5 | |
|---|---|---|---|---|---|---|---|
| 0.1 mol/L HCl | 57.6 | 27.1 | 5.9 | 6.5 | 5.0 | 4.3 | 15.5 |
| 0.25 mol/L HCl | 85.8 | 42.7 | 15.0 | 6.1 | 5.7 | 2.4 | 11.0 |
| 0.5 mol/L HCl | ≈ 100% | 59.1 | 26.0 | 7.4 | 8.8 | 6.1 | 11.2 |
| 1 mol/L HCl | 76.6 | 77.5 | 14.4 | 5.4 | 7.6 | 11.5 | |
| 0.1 mol/L NaOH | ≈ 100% | 45.5 | 66.6 | 6.4 | 58.8 | 11.5 | |
| 0.25 mol/L NaOH | 70.6 | 82.6 | 6.2 | 58.8 | 19.5 | ||
| 0.5 mol/L NaOH | 99.9 | 84.2 | 7.0 | 60.4 | 26.8 | ||
| 1 mol/L NaOH | 99.7 | 78.2 | 5.3 | 59.4 | 14.8 |
 The largest desorption yield.
| Sorbent | Cw (g/mL) | Dw | Dv |
|---|---|---|---|
| A830 | 3.5 | 4914.9 | 1710.4 |
| 9.5 | 2831.6 | 985.4 | |
| 17.7 | 2629.0 | 914.9 | |
| A400TL | 4.5 | 3172.7 | 1074.9 |
| 8.0 | 1946.3 | 659.4 | |
| 12.0 | 940.7 | 318.7 | |
| S984 | 7.0 | 6755.4 | 2529.9 |
| 23.0 | 4082.5 | 1528.9 | |
| 25.6 | 1543.9 | 578.2 | |
| SR7 | 1.0 | 190.7 | 50.7 |
| 1.0 | 95.1 | 25.3 | |
| 1.0 | 59.8 | 15.9 | |
| PSR3 | 0.3 | 63.6 | 19.9 |
| 0.5 | 44.7 | 14.0 | |
| 0.5 | 16.9 | 5.3 | |
| PSR2 | 0.1 | 22.0 | 8.5 |
| 0.3 | 15.2 | 5.9 | |
| 0.4 | 15.0 | 5.8 | |
| AF5 | 0 | 3.6 | 2.1 |
| 0 | 1.6 | 1.0 | |
| 0 | 7.2 | 4.2 |
Publisher’s Note: MDPI stays neutral with regard to jurisdictional claims in published maps and institutional affiliations. |
© 2022 by the authors. Licensee MDPI, Basel, Switzerland. This article is an open access article distributed under the terms and conditions of the Creative Commons Attribution (CC BY) license (https://creativecommons.org/licenses/by/4.0/).
Share and Cite
Wołowicz, A.; Hubicki, Z. Vanadium(V) Removal from Aqueous Solutions and Real Wastewaters onto Anion Exchangers and Lewatit AF5. Molecules 2022, 27, 5432. https://doi.org/10.3390/molecules27175432
Wołowicz A, Hubicki Z. Vanadium(V) Removal from Aqueous Solutions and Real Wastewaters onto Anion Exchangers and Lewatit AF5. Molecules. 2022; 27(17):5432. https://doi.org/10.3390/molecules27175432
Chicago/Turabian StyleWołowicz, Anna, and Zbigniew Hubicki. 2022. "Vanadium(V) Removal from Aqueous Solutions and Real Wastewaters onto Anion Exchangers and Lewatit AF5" Molecules 27, no. 17: 5432. https://doi.org/10.3390/molecules27175432
APA StyleWołowicz, A., & Hubicki, Z. (2022). Vanadium(V) Removal from Aqueous Solutions and Real Wastewaters onto Anion Exchangers and Lewatit AF5. Molecules, 27(17), 5432. https://doi.org/10.3390/molecules27175432