Abstract
Metronidazole (MNZ) is an antibiotic widely used for the treatment of various infectious diseases and as an effective pesticide agent for the cultivation of chickens and fish. Its high resistance to purification processes and biological activity has led to the classification of MNZ as an emerging contaminant. A speciation study, aimed to define the acid-base properties of MNZ and its interaction with Ca2+, commonly present in natural waters, is reported. The protonation constants of MNZ, as well as the formation constant value of Ca2+-MNZ species, were obtained by potentiometric titrations in an aqueous solution, using NaCl as background salt at different ionic strengths (0.15, 0.5, 1 mol L−1) and temperature (15, 25 and 37 °C) conditions. The acid-base behavior and the complexation with Ca2+ were also investigated by 1H NMR and UV-Vis titrations, with results in very good agreement with the potentiometric ones. The dependence of the formation constants on the ionic strength and temperature was also determined. The sequestering ability of MNZ towards Ca2+ was defined by the empirical parameter pL0.5 at different pH and temperature values. The speciation of MNZ simulating sea water conditions was calculated.
1. Introduction
Metronidazole (2-Methyl-5-nitroimidazole-1-ethanol, MNZ) is a synthetic nitroimidazole widely employed in human and veterinary medicine as an antibiotic drug for its broad-spectrum antibacterial and antiprotozoal activity [1,2,3,4]. It represents one of the most used drugs around the world [5], also exploited as an additive to remove parasites in poultry and fish feed. Its widespread use has led to its classification as an emerging organic contaminant (CEC) [6]. MNZ, characterized by a ring-like structure, shown in Figure 1, is known as carcinogenic to animals, and as a potential human carcinogen and mutant [7,8,9,10].
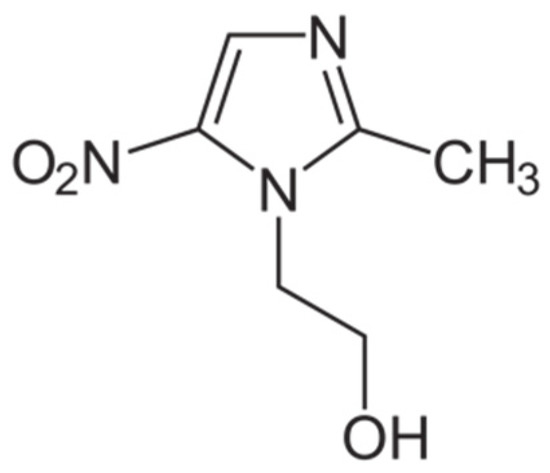
Figure 1.
Metronidazole (2-Methyl-5-nitroimidazole-1-ethanol, MNZ (L)).
In the literature, the use of different techniques was reported for separation or quantitative MNZ detection in environmental and biological samples, human plasma, drugs, and food products. They include high-performance liquid chromatography [11], liquid chromatography-tandem mass spectrometric method (LC-MS/MS) [12], chemiluminescence [13] fluorescence [14,15], near-infrared spectrophotometry (NIRS) [16], spectrophotometry [17,18,19], voltammetry with chemically modified electrodes [20,21,22,23,24,25,26,27,28,29].
MNZ belongs to pharmaceutical active compounds (PhAC), its accumulation in natural waters due to improper disposal of pharmaceutical waste represents a threat to the environment and to humans due to its high solubility in water, limited biodegradability, photo and hydrolytic stability, and toxicity [30,31]. Therefore, it is particularly relevant to explore effective methods for the removal and degradation of MNZ from several environmental sources, including natural waters. Among the various techniques, adsorption, oxidation processes, ultraviolet light degradation, biological methods, and thermocatalytic activation, were employed to remove antibiotics from polluted waters [11,29,32,33,34,35,36]. Adsorption methods are promising as they are widely accepted as an economic, benign, and easily applicable technique [37]. As is well known, the sorption processes were strictly dependent on pH, therefore preliminary studies on acid-base properties of MNZ under different conditions are crucial for this kind of application.
Moreover, in natural waters, wherein MNZ is present, other inorganic components, such as metal cations and anions are also widely available. The main natural water constituents influence removal efficiency, depending on the properties of both the pollutants and components. For example, bivalent cations, such as Ca2+, and Mg2+, have a more negative effect than monovalent cations (Na+, K+) [38]. Calcium is the fifth most abundant element in the environment as well as in the human body. It is an essential element for life, playing relevant biological roles in cellular, molecular, and systemic processes in vertebrates. It is one of the principal ions in sea water, together with Na+, K+, Mg2+, Cl−, and SO42−. Calcium ion is a large divalent cation widely available in most natural waters as its common salts are not very insoluble. In the oceans, its content is an average of 390 mg kg−1, with higher values of 440 mg kg−1 close to riff regions [39]. Rivers present quite different calcium contents, depending on their geological origin. As an example, in European rivers calcium content varies from 3.6 mg L−1 in Norwegian rivers to 84 mg L−1 in the lower polluted Rhine River [39]. By considering all these reasons, i.e., the presence of MNZ in natural waters and its potential interactions with the most abundant cations in sea waters, the purpose of this study is to elucidate the acid-base behavior and the speciation of MNZ with Ca2+. The results of the investigation can find applications in improving MNZ removal strategies.
2. Results and Discussion
The knowledge of the protonation constants of a ligand is crucial to defining the ionization state which influences several characteristics, such as aqueous solubility, and complexation ability. The equilibrium reactions associated with the protonation constant values are the following, where the charges are omitted for simplicity and MNZ was indicated as L:
iH + L = HiL βHiL
H + Hi−1L = HiL KHiL
The first step involves the protonation of the alcoholic group, and the second step refers to the imidazole residue, as indicated in the paper of Rivera-Utrilla et al. [40]. The experimental protonation constant values obtained by potentiometry, at different ionic strengths (0.15, 0.5, 1 mol L−1) and temperature (15, 25, and 37 °C) conditions, are listed in Table 1.

Table 1.
Experimental protonation constants of MNZ (L) and formation constants of Ca2+(M)-MNZ (L) species obtained by potentiometry.
As can be observed in the distribution diagram in Figure 2a, at t = 25 °C and I = 0.15 mol L−1, the mono-protonated species is formed in all pH ranges, reaching its maximum ligand fraction, corresponding to over 0.9, in the range 4 ≤ pH ≤ 10. Differently, the fractions of the di-protonated and deprotonated species became significant at very acid pH (pH = 2) and alkaline pH values (pH = 11), respectively.
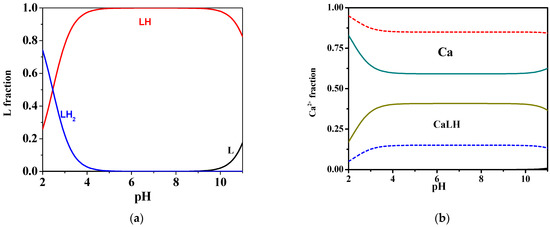
Figure 2.
Distribution diagrams at I = 0.15 mol L−1 in NaCl of: (a) MNZ (L) system at CL = 2 mmol L−1 and t = 25 °C; (b) Ca2+-MNZ (L) system at CL = 2 mmol L−1, CCa = 1 mmol L−1, t = 25 °C (solid lines) and t = 37 °C (dotted lines).
To investigate the interaction between MNZ and Ca2+, various potentiometric titrations were also performed on solutions containing different metal/ligand ratios. The reactions related to formation constants are indicated below, where the charges are omitted for simplicity and MNZ was indicated as L:
Ca + L + rH = MLHr βMLHr
Ca + LHr = MLHr KMLHr
Hydrolysis constant values of Ca2+ species at various temperatures and ionic strength in NaCl, taken into account in the calculations relating to the M-L system, are reported in Supplementary Material. The most accurate speciation model is chosen by evaluating several factors, which are the statistical parameters standard and mean deviation, the formation percentages of the considered species, and the simplicity of the model [41]. Based on potentiometric results, several computational tests were carried out considering different speciation models. The only model that produced results at all investigated ionic strengths and temperatures is very simple, including the formation of CaLH species, whose values of formation constants are listed in Table 1.
More in detail, at 25 °C and I = 0.15 mol L−1, as shown in the speciation diagram in Figure 2b, the CaLH species is formed throughout the pH range, and reaches its maximum metal fraction, corresponding to 0.4, in the range 4 ≤ pH ≤ 10. The stability of complex species in terms of logK, referring to reaction (4), is 2.29, indicating rather weak interactions. Increasing the temperature from 25 °C to 37 °C, a decrease in the formation constant value can be observed from 2.29 to 1.68, and a consequent significant reduction of the fraction of the species is evidenced, with a maximum of just over 0.1 in the same pH range.
As widely reported in the literature, the high ability of L to absorb in the UV range has often been used to determine quantitatively and qualitatively this antibiotic in waters [18,42,43]. Various spectrophotometric titrations on solutions containing L and M-L mixtures were performed to investigate L spectral behavior and to confirm the protonation and formation constants values as well as the speciation model obtained by potentiometry, as already shown with other systems [44,45]. The analysis of the UV data, by using the HypSpec program, showed a very good agreement with potentiometric results, highlighted by the similarity of both the values of the protonation constants, as reported in Table 2. The formation constant value of MLH species was also confirmed by UV results. Figure 3 shows, by way of example, some of the spectra acquired on solutions containing L at selected pH in the spectral range 200 ≤ λ ≤ 400 nm. Spectra referring to M-L solutions in the same spectral and pH range show a very similar behavior, as reported in Supplementary Material.

Table 2.
Comparison between experimental protonation constants of MNZ (L) and formation constant of Ca2+-MNZ (L) species obtained by potentiometry, 1H-NMR and UV spectrophotometry at t = 25 °C and I = 0.15 mol L−1.
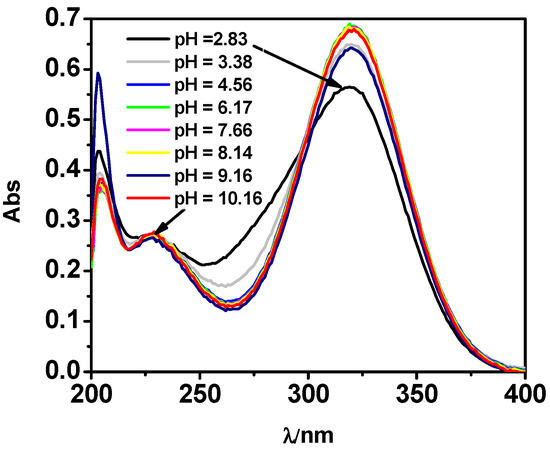
Figure 3.
UV spectra at t = 25 °C and I = 0.15 mol L−1 of MNZ (L) solution at CL = 0.075 mmol L−1.
Figure 3 shows three maximum absorptions at λ = 203, 227, and 319 nm, and points out that all these signals undergo a hyperchromic effect with the increase of pH. An isosbestic point is visible for the LH2/LH equilibria. Through spectrophotometric measurements, it was also possible to study the spectral behavior of the species formed in solution. The molar absorbances of the protonated and unprotonated species of the ligand together with ones of the M-L species were reported in Figure 4. In particular, the totally deprotonated species L reaches its maximum value of ε corresponding to 63,000 L mol−1 cm−1 at λ = 204 nm, while the values of ε reached by the two protonated species LH and LH2 are lower (9000 L mol−1 cm−1 at λ = 319 nm and 4600 L mol−1 cm−1 a λ = 205 nm, respectively). A second maximum at λ = 319 nm was observed for L species with ε of 10,100 L mol−1 cm−1. The MLH species reaches its maximum ε value, corresponding to 13000 L mol−1 cm−1 at λ = 318 nm.
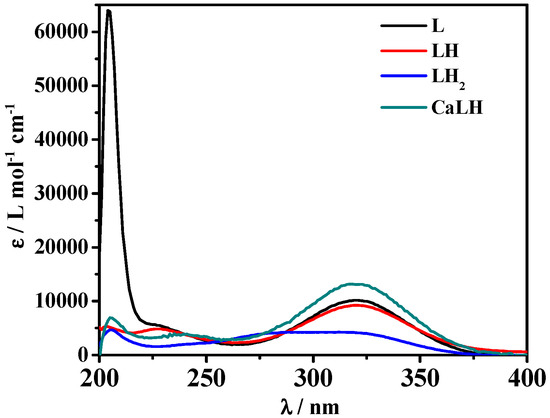
Figure 4.
ε vs. λ of Ca2+-MNZ (L) and MNZ (L) species at t = 25 °C, I = 0.15 mol L−1.
The acid-base behavior of the ligand was also investigated by 1H NMR. Various spectroscopic titrations were therefore carried out on solutions containing L to determine the values of the chemical shifts, and to refine the protonation constant values. The 1H NMR spectra, shown in Figure 5 at various pH values and t = 25 °C, show four distinct signals: a singlet associated with CH3 protons, two triplets related to the protons of the two CH2, indicated as CH2a and CH2b, and a singlet of the CH proton present in the imidazole ring. An upfield of 0.3 ppm of the CH chemical shift can be observed as a consequence of the deprotonation of the imidazole group for the pH increase. A similar behavior can be observed for the CH3 in which the chemical shift is 0.2 ppm. A 1H NMR characterization, reported in the literature [46], shows a trend and chemical shift values close to the ones here found. Furthermore, M-L solutions were analyzed by 1H NMR at t = 25 °C and I = 0.15 mol L−1, using a procedure already employed for other systems [47,48]. The experimental spectra were reported in the Supplementary Materials. The comparison of these spectra with those obtained on ligand solutions shows that the chemical shift values have the same trend as those recorded for the free ligand, confirming a weak metal-ligand interaction.
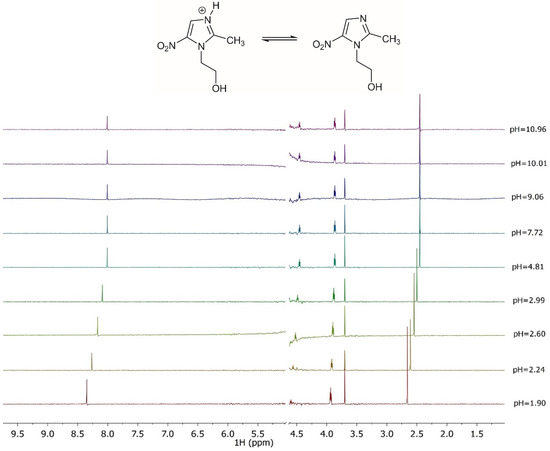
Figure 5.
1H NMR spectra on solutions containing MNZ (L) at CL = 5 mmol L−1, t = 25 °C, I = 0.15 mol L−1 in NaCl, 1.90 ≤ pH ≤ 10.96.
2.1. Dependence of Protonation and Formation Constants on Ionic Strength
The choice to carry out the experiments at various ionic strengths made it possible to study the dependence of the values of the protonation and formation constants on the ionic strength, expressed by a Debye-Hückel type equation, reported below [49,50]:
where βT is the protonation constant at infinite dilution, z* is the parameter that refers to the charges present in the solution corresponding to ∑z2reagents − ∑z2products, and C refers to the empirical parameter that depends on the stoichiometric coefficients and on the charges. Using Equation (5) and equilibrium constants at various ionic strength values, the formation constants extrapolated to I = 0 mol L−1, together with the empirical parameter C, were obtained. These values are summarized in Table 3. The knowledge of these parameters made it possible to calculate the value of logβ at any desired ionic strength in the range investigated and therefore for any natural or biological fluid.

Table 3.
Protonation constants at infinite dilution and parameters for the dependence on ionic strength (Equation (5)), of MNZ (L) and Ca2+-MNZ (L) species at t = 25 °C in NaCl.
2.2. Dependence of Protonation and Formation Constants on Temperature
The protonation and formation constants values acquired at the three different temperatures of 15, 25, and 37 °C, listed in Table 1, were used to study their dependence on temperature, as already shown for several systems [51,52]. The data obtained by the potentiometric measurements were analyzed using the following van’t Hoff equation:
where logβT is the stability constant at a certain temperature (expressed in kelvin), while logβθ is the stability constant at t = 298.15 K, and R is the universal gas constant expressed as 8.314 J K−1 mol−1. Using the equation just reported, it was possible to calculate the protonation and formation enthalpies change values, together with Gibbs free energy and entropy changes. The obtained thermodynamic parameters are summarized in Table 4 and shown in Figure 6. As expected, the interaction between Ca2+ and L is weak, with a weakly exothermic enthalpy change and a negative entropy change. The protonation equilibria were also characterized by exothermic enthalpy changes.
logβT = logβθ + ΔH0(1/θ − 1/T) R ln 10

Table 4.
Thermodynamic parameters of MNZ (L) and Ca2+-MNZ (L) species at t = 298.15 K and I = 0.15 mol L−1 in NaCl.
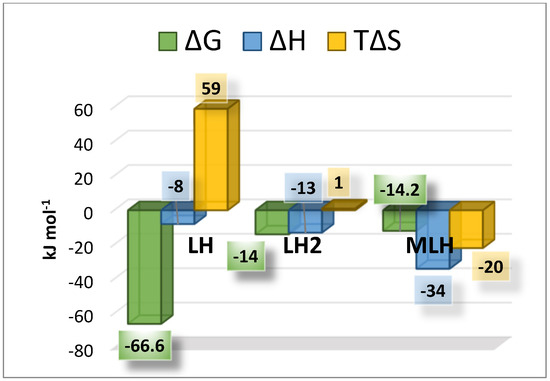
Figure 6.
Bar plot of the thermodynamic parameters referred to LH, LH2 and MLH species at t = 25 °C and I = 0.15 mol L−1 in NaCl.
2.3. Sequestering Ability
The study on the interaction of a ligand toward metal cations normally present in natural waters is extremely interesting for the development of systems capable of removing these pollutants from the environment. However, it is known that the mere knowledge of the values of the formation constants is not sufficient for such studies, as it is necessary to consider all the equilibria involved in the analyzed system that could interfere with this interaction. The evaluation of the sequestering ability of L against Ca2+, widely present in natural waters, therefore, becomes interesting in order to be able to describe the effectiveness of the system studied. To evaluate this capacity for quantitative purposes, as already widely reported in other previous papers [53,54], the empirical parameter pL0.5 was calculated. It represents the total ligand concentration necessary for the sequestration of a mole fraction equal to 0.5 of a specific cation present in trace. The calculation is based on a Boltzmann-type sigmoidal equation:
where χ is the sum of mole fractions of the different complex species and pL is the anti-logarithm of the total ligand concentration. To evaluate the sequestering ability of the ligands under study toward Ca2+, pL0.5 values were calculated under different pH and temperatures. Figure 7 shows a comparison of the sequestering ability of L toward Ca2+ at different values of ionic strength, at t = 25 °C and an average pH of sea water of 8.1. According to the calculated pL0.5 values, the following order is:
pL0.5 (I = 0.15 mol L−1) > pL0.5 (I = 1 mol L−1) > pL0.5 (I = 0.7 mol L−1)
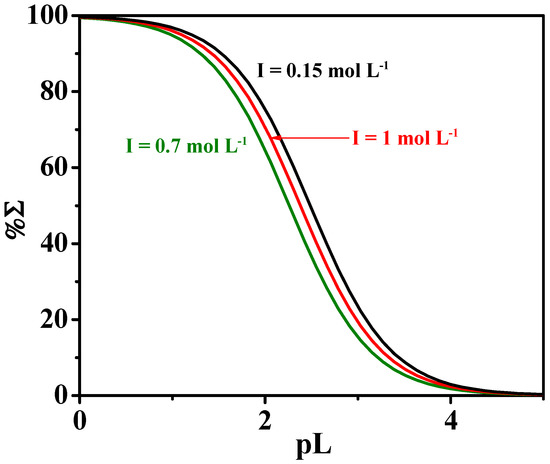
Figure 7.
Sequestering ability of MNZ (L) toward Ca2+ at different ionic strength values, at t = 25 °C and pH = 8.1.
2.4. Speciation in Natural Waters
In the environmental field, it was crucial to assess pollutant speciation and transformation in the aquatic system to improve strategies for its removal from natural waters.
In order to assess the relevance of the Ca2+ complex in sea water conditions, the average concentrations of MNZ (L), Ca2+, Mg2+, and other divalent cations such as Cu2+ and Zn2+, were considered. With the use of the thermodynamic data here determined, it is possible to carry out simulations in sea water conditions. More in detail, the protonation constants of L and the stability constants of Ca2+-L complex species were calculated by data in Table 3 at I = 0.7 mol L−1, i.e., the mean ionic strength of sea water. For Cu2+-L and Zn2+-L complexes, data of formation constants determined by us and not yet published were used. The simulation was obtained by considering the real concentrations of main divalent cations in sea water, Ca2+ and Mg2+, and other interfering divalent metal cations, such as Cu2+ and Zn2+, with L in trace amount (CL = 8·10−10 mol L−1, CCa = 0.01 mol L−1, CMg = 0.043 mol L−1, CCu = 4·10−5 mol L−1, CZn= 1.5·10−9 mol L−1, I = 0.7 mol L−1, t = 25 °C) [39,55]. Formation constant values of Cu2+- and Zn2+-L species under sea water conditions, belonging to our unpublished study, are summarized in the Supplementary Materials. Under these conditions, at pH = 8.1 typical of sea waters, a significant percentage equal to 29% of CaLH species was obtained, together with 10% of CuL, 4% of ZnL, 35% of ZnLOH, and 22% of LH (see Figure 8). These results underline that although CaLH species is weak, under sea water conditions, its formation percentage is significant even in the presence of other interfering divalent cations. Therefore, its presence cannot be ignored in the development of L removal strategies.
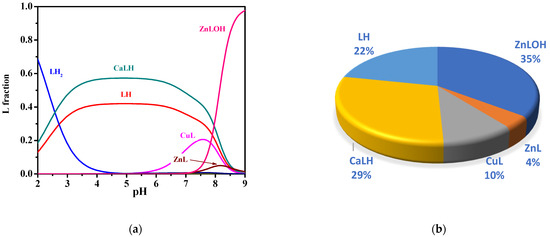
Figure 8.
Diagrams of MNZ (L) species under sea water conditions (CL = 8·10−10 mol L−1, CCa = 0.01 mol L−1, CMg = 0.043 mol L−1, CCu = 4·10−5 mol L−1, CZn = 1.5·10−9 mol L−1, I = 0.7 mol L−1, t = 25 °C): (a) Speciation diagram; (b) Pie chart at pH = 8.1.
2.5. Comparison with Literature Data
In the literature and in the main thermodynamic databases, the data on MNZ (L) protonation constants are few and to our knowledge, no data are present on the Ca-L complexes [56,57,58]. Among them, a protonation constant value of logK2 = 2.15 of L at t = 25 °C and I = 0.1 mol L−1 in NaClO4, obtained by spectrophotometry, was reported in the paper [18]. This value is fairly different from the one here reported with the same technique, logK2 = 2.47 at I = 0.15 mol L−1 in NaCl (see Table 2). The difference is attributable to the slight difference in ionic strength and to the different ionic medium. IUPAC stability constants database reports a logK2 = 2.68 at t = 25 °C and I = 0.5 mol L−1 in KCl obtained by potentiometry [58], very close to the value here reported at the same temperature and ionic strength in NaCl (logK2 = 2.67, see Table 1). The acid-base study was conducted through potentiometric titrations at 25 °C, I = 0.2 mol L−1 in NaCl in water–ethanol (90:10, v/v) mixture, reports three protonation constants values, logK1 =18.1, logK2 = 7.01 and logK3 = 2.64, respectively [46]. The logK3 value is particularly similar to the one here proposed under the same conditions of temperature and ionic strength, despite the presence of a minimal percentage of methanol.
3. Materials and Methods
3.1. Materials
Metronidazole and calcium chloride solutions were prepared by weighing and dissolving the commercial product MNZ (purity ≥ 97%, Alfa-Aesar/Thermo Fisher, Kandel, Germany) and calcium(II) chloride dihydrate (purity > 99%, Fluka/Honeywell, Charlotte, NC, USA). The exact concentration of the calcium solution was determined by titration with EDTA. The NaOH solutions were prepared, according to the standard procedure, by dilution from the Fluka® concentrated vial and standardized with potassium acid phthalate, previously dried in an oven for at least one hour at a temperature of 110 °C. Similarly, the HCl solutions were prepared by dilution from the Fluka® concentrated solution and standardized with sodium carbonate pre-dried in an oven at 110 °C. The NaCl solutions were often prepared by direct weighing of Sigma-Aldrich® NaCl (purity ≥ 99.5%), first dried in an oven at 110 °C. Distilled water (conductivity < 0.1 μS cm−1) and class A glassware were used for all solutions.
3.2. Potentiometric Apparatus and Procedure
The potentiometric titrations were employed by Metrohm-Titrando 809 automated potentiometer with a combined glass electrode ORION, type Ross 8102SC and a Metrohm Dosino 800 automatic dispenser. The titrations were performed in cells with a capacity of 25 mL, characterized by a double wall inside which thermostated water circulates. The cells were connected to a thermostat model D1-G Haake. During the measurements, pure N2 was bubbled to avoid CO2 and O2 in solution. The system is interfaced to a PC through the Metrohm TIAMO 2.0 software, which automatically acquires the mL/mV pairs. It can control several parameters, such as e.m.f. stability, titrant delivery, and data acquisition. Estimated accuracy of this apparatus is ±0.15 mV and ±0.002 mL for e.m.f. and for readings of titrant volume. The acid-base titrations were carried out first on 25 mL solutions containing L, HCl, and NaCl as supporting electrolytes at different temperatures and ionic strength conditions. Various potentiometric titrations are performed on 25 mL containing Ca2+-L in different ratios, in NaCl at t = 15, 25, and 37 °C and I = 0.15, 0.5 and 1 mmol L−1. The experimental conditions of potentiometric titrations were reported in Table 5. The solutions were titrated using standard NaOH solution. A calibration was associated with each measurement by titration with NaOH of a solution containing HCl, NaCl, and H2O, in order to calculate the standard electrode potential (E0) and the pKw values.

Table 5.
Experimental conditions for potentiometric, 1H NMR and UV-Vis titrations.
3.3. NMR Apparatus and Procedure
NMR measurements were performed by Varian 500 NMR spectrometer. The 1H NMR spectra were recorded using 90% H2O and 10% D2O as solvent and the chemical shifts were referred to the 1,4-dioxane signal (δCHdioxane = 3.7 ppm). Titrations were carried out using standard NaOH on 25 mL of solution containing L, NaCl, HCl, 1,4-dioxane and D2O. Spectroscopic analyses were performed at selected pH values using 0.6 mL of L solution. Ca2+-L spectra were recorded at the same conditions of ionic strength, temperature, and pH range of the free ligand. The experimental conditions of 1H NMR titrations were reported in Table 5.
3.4. UV-Vis Apparatus and Procedure
The spectrophotometric titrations were performed with a Varian Cary 50 UV-Vis spectrophotometer characterized by an optical fiber with a fixed 1 cm path length. The system was interfaced to a PC by the Varian Cary WinUV software. For all titrations, a Thermo-Fisher glass electrode was also used to record simultaneously the couple of data absorbance (A) and e.m.f. (mV) vs. volume of titrant (mL), for each titration point. The analyses were carried out in a thermostated cell, in which N2 was bubbled in solution to avoid CO2 and O2. The experimental conditions of the titrations are reported in Table 5.
3.5. Calculations
The protonation constant of MNZ (L), formation constant values of Ca2+(M)-MNZ (L), and titration parameters (analytical concentration of the reagents, standard potential E0, junction potential) were determined by using BSTAC and STACO programs. LIANA program has provided the parameters characterizing the dependence of the protonation and formation constant values on the temperature and ionic strength. More details on software are present in ref. [59]. 1H NMR data were processed by HypNMR software, which allows for calculating protonation and formation constant values and the individual chemical shift of species through the observed signals and assuming fast mutual exchange in the NMR time scale [60]. UV-Vis data are processed by the HypSpec program, which allows refining of the protonation and formation constant as well as the molar absorption coefficient values (ε) of the species. The speciation diagrams and the formation percentage of the species are determined by the Hyss program [61].
4. Conclusions
The main objective of this research was to obtain reliable thermodynamic data capable of describing the environmental behavior of MNZ (L), an emerging contaminant present in natural waters, and its interaction with Ca2+. Through potentiometric titrations, it was possible to first determine the values of the protonation constants of L, useful for studying the acid-base properties of the ligand, and then exploited to study the complex species formed with Ca2+. As expected, the values of the formation constants obtained showed a weak metal-ligand interaction, with a speciation model, characterized by only MLH species, confirmed by UV-Vis and 1H NMR analyses. To obtain a complete thermodynamic picture, the dependence on the protonation and formation constants values on the ionic strength and temperature was also determined. The sequestering ability of L towards Ca2+ was evaluated as a function of the parameters pL0.5 at different pH, ionic strength, and temperature values, with particular attention to those that simulate sea water conditions. The assessment of the thermodynamic data of L and Ca2+-L species is fundamental for carrying out simulations and predicting the environmental behavior of these species in real conditions and therefore useful for setting up effective removal processes.
Supplementary Materials
The following supporting information can be downloaded at: https://www.mdpi.com/article/10.3390/molecules27175394/s1, Table S1: Hydrolysis Constants of Ca2+ at different temperatures and ionic strength values; Table S2: Calculated chemical shift (in ppm) of each nucleus of MNZ (L) species at t = 25 °C and I = 0.15 mol L−1 in NaCl; Table S3: Formation constants of Cu2+- and Zn2+-MNZ (L) species at t = 25 °C and I = 0.7 mol L−1. Figure S1: Comparison between experimental (□) and calculated (o) chemical shift values (in ppm) vs. pH of CH3 and CH nuclei; Figure S2: UV spectra at t = 25 °C and I = 0.15 mol L−1 of Ca2+-MNZ (L) solutions at CL = 0.075 mmol L−1, CCa = 0.0375 mmol L−1; Figure S3: 1H NMR spectra on solutions containing Ca2+-MNZ (L) at CL = 5 mmol L−1, CCa = 6 mmol L−1, t = 25 °C, I = 0.15 mol L−1 in NaCl, 1.90 ≤ pH ≤ 10.98.
Author Contributions
Conceptualization, O.G.; investigation, F.C. and M.C.; resources, O.G.; writing—original draft preparation, O.G. and F.C.; writing—review and editing, O.G., F.C., M.C. and C.F.; supervision, O.G.; funding acquisition, O.G. All authors have read and agreed to the published version of the manuscript.
Funding
This research was funded by FFABR Unime 2020.
Data Availability Statement
The data presented in this study are available on request from the corresponding author.
Conflicts of Interest
The authors declare no conflict of interest.
Sample Availability
Samples of the compounds are not available from the authors.
References
- Bharti, N.; Shailendra; Coles, S.J.; Hursthouse, M.B.; Mayer, T.A.; Gonzalez Garza, M.T.; Cruz-Vega, D.E.; Mata-Cardenas, B.D.; Naqvi, F.; Maurya, M.R.; et al. Synthesis, Crystal Structure, and Enhancement of the Efficacy of Metronidazole Against Entamoeba histolytica by Complexation with Palladium(II), Platinum(II), or Copper(II). Helv. Chim. Acta 2002, 85, 2704–2712. [Google Scholar] [CrossRef]
- Wang, X.; Lin, Y.; Zheng, Y.; Meng, F. Antibiotics in mariculture systems: A review of occurrence, environmental behavior, and ecological effects. Environ. Pollut. 2022, 293, 118541. [Google Scholar] [CrossRef] [PubMed]
- Kumar, L.; Jain, A.; Lal, N.; Sarswat, A.; Jangir, S.; Kumar, L.; Singh, V.; Shah, P.; Jain, S.K.; Maikhuri, J.P.; et al. Potentiating metronidazole scaffold against resistant trichomonas: Design, synthesis, biology and 3d-QSAR analysis. ACS Med. Chem. Lett. 2012, 3, 83–87. [Google Scholar] [CrossRef]
- Wei, H.; Cai, R.; Yue, H.; Tian, Y.; Zhou, N. Screening and application of a truncated aptamer for high-sensitive fluorescent detection of metronidazole. Anal. Chim. Acta 2020, 1128, 203–210. [Google Scholar] [CrossRef]
- Freeman, C.D.; Klutman, N.E.; Lamp, K.C. Metronidazole. Drugs 1997, 54, 679–708. [Google Scholar] [CrossRef]
- Lapworth, D.J.; Baran, N.; Stuart, M.E.; Ward, R.S. Emerging organic contaminants in groundwater: A review of sources, fate and occurrence. Environ. Pollut. 2012, 163, 287–303. [Google Scholar] [CrossRef]
- Faradkia, M.; Bazrafshan, E.; Esrafili, A.; Yang, J.-K.; Shirzad-Siboni, M. Photocatalytic degradation of Metronidazole with illuminated TiO2 nanoparticles. J. Environ. Health Sci. Eng. 2015, 13, 35. [Google Scholar] [CrossRef]
- Bendesky, A.; Menéndez, D.; Ostrosky-Wegman, P. Is metronidazole carcinogenic? Mutat. Res./Rev. Mutat. Res. 2002, 511, 133–144. [Google Scholar] [CrossRef]
- Yalikun, N.; Mamat, X.; Li, Y.; Hu, X.; Wang, P.; Hu, G. N, S, P-Triple Doped Porous Carbon as an Improved Electrochemical Sensor for Metronidazole Determination. J. Electrochem. Soc. 2019, 166, B1131. [Google Scholar] [CrossRef]
- Yang, M.; Guo, M.; Feng, Y.; Lei, Y.; Cao, Y.; Zhu, D.; Yu, Y.; Ding, L. Sensitive Voltammetric Detection of Metronidazole Based on Three-Dimensional Graphene-Like Carbon Architecture/Polythionine Modified Glassy Carbon Electrode. J. Electrochem. Soc. 2018, 165, B530. [Google Scholar] [CrossRef]
- Guoa, Y.; Wanga, J.; Haoa, L.; Wua, Q.; Wang, C.; Wang, Z. Triazine-triphenylphosphine based porous organic polymer as sorbent for solid phase extraction of nitroimidazoles from honey and water. J. Chrom. A 2021, 1649, 462238. [Google Scholar] [CrossRef] [PubMed]
- El-Naem, O.A.; El-Maraghy, C.M. A validated liquid chromatography-tandem mass spectrometric method for the determination of coadministered ranitidine and metronidazole in plasma of human volunteers. Anal. Methods. 2021, 13, 2586. [Google Scholar] [CrossRef] [PubMed]
- Shishavan, Y.H.; Amjadi, M.A. New enhanced chemiluminescence reaction based on polymer dots for the determination of metronidazole. Spectrochim. Acta A Mol. Biomol. 2021, 260, 119992. [Google Scholar] [CrossRef] [PubMed]
- Zhang, Z.; Liu, Y.; Huang, P.; Wu, F.Y.; Ma, L. Polydopamine molecularly imprinted polymer coated on a biomimetic iron-based metal–organic framework for highly selective fluorescence detection of metronidazole. Talanta 2021, 232, 122411. [Google Scholar] [CrossRef]
- Hatamie, A.; Marahel, F.; Sharifat, A. Green synthesis of graphitic carbon nitride nanosheet (g-C3N4) and using it as a label-free fluorosensor for detection of metronidazole via quenching of the fluorescence. Talanta 2018, 176, 518–525. [Google Scholar] [CrossRef] [PubMed]
- Sakira, A.K.; MeeS, C.; De Braekeleer, K.; Deòporte, C.; Yameogo, J.; Yabre, M.; Some, T.I.; Van Antwerpen, P.; Mertens, D.; Kauffmann, J.M. Determination of the quality of metronidazole formulations by near-infrared spectrophotometric analysis. Talanta Open 2021, 3, 100027. [Google Scholar] [CrossRef]
- Das, J.; Dhua, M. UV-Spectrophotometric Assay Method Development and Validation of Metronidazole in Bulk and Tablet Formulation. J. Pharm. Sci. Technol. 2014, 3, 106–109. [Google Scholar]
- Abdel-Kader, D.A.; Hashem, E.Y. Spectrophotometric determination of Metronidazole antibacterial drug via oxidation with alkaline potassium permanganate. Spectrochim. Acta A Mol. Biomol. 2021, 259, 119858. [Google Scholar] [CrossRef]
- Abd-Alrassol, K.S.; AL-Salman, H.N.K.; Jasim, E.Q.; Hussein, H.H. Determination and evaluation of doses of metronidazole in different quantities and formulations with multiple spectroscopic methods. Syst. Rev. Pharm. 2020, 11, 130–139. [Google Scholar]
- Baikeli, Y.; Mamat, X.; He, F.; Xin, X.; Li, Y.; Aisa, H.A.; Hu, G. Electrochemical determination of chloramphenicol and metronidazole by using a glassy carbon electrode modified with iron, nitrogen co-doped nanoporous carbon derived from a metal-organic framework (type Fe/ZIF-8). Ecotoxicol. Environ. Saf. 2020, 204, 111066. [Google Scholar] [CrossRef]
- Bitew, Z.; Amare, M. Recent reports on electrochemical determination of selected antibiotics in pharmaceutical formulations: A mini review. Electrochem. Commun. 2020, 121, 106863. [Google Scholar] [CrossRef]
- Chinnaraj, S.; Palani, V.; Yadav, S.; Arumugam, M.; Sivakumar, M.; Maluventhen, V.; Singh, M. Green synthesis of silver nanoparticle using goniothalamus wightii on graphene oxide nanocomposite for effective voltammetric determination of metronidazole. Sens. Bio-Sens. Res. 2021, 32, 100425. [Google Scholar] [CrossRef]
- Dawit, M.; Turbale, M.; Moges, A.; Amare, M. Poly(alizarin red S) modified glassy carbon electrode for square wave adsorptive stripping voltammetric determination of metronidazole in tablet formulation. PLoS ONE 2020, 15, e0244115. [Google Scholar] [CrossRef] [PubMed]
- Kesavan, G.; Vinothkumar, V.; Chen, S.-M.; Thangadurai, T.D. Construction of metal-free oxygen-doped graphitic carbon nitride as an electrochemical sensing platform for determination of antimicrobial drug metronidazole. Appl. Surf. Sci. 2021, 556, 149814. [Google Scholar] [CrossRef]
- Muthukutty, B.; Arumugam, B.; Chen, S.-M.; Ramaraj, S.K. Low potential detection of antiprotozoal drug metronidazole with aid of novel dysprosium vanadate incorporated oxidized carbon nanofiber modified disposable screen-printed electrode. J. Hazard. Mater. 2021, 407, 124745. [Google Scholar] [CrossRef]
- Viliana, A.T.E.; Ranjitha, K.S.; Lee, S.J.; Umapathi, R.; Hwang, S.-K.; Oh, C.W.; Huh, Y.S.; Han, Y.-K. Hierarchical dense Ni−Co layered double hydroxide supported carbon nanofibers for the electrochemical determination of metronidazole in biological samples. Electrochim. Acta 2020, 354, 136723. [Google Scholar] [CrossRef]
- Xia, Y.-M.; Ou, X.; Zhao, Y.; Xia, M.; Chen, D.; Gao, W.-W. Facile Synthesis of Reduced Graphene Oxide-octahedral Mn3O4 Nanocomposites as a Platform for the Electrochemical Determination of Metronidazole and Sulfamonomethoxine. Electroanalysis 2021, 33, 1646–1656. [Google Scholar] [CrossRef]
- Baikeli, Y.; Mamat, X.; Wumaer, M.; Muhetaer, M.; Aisa, H.A.; Hu, G. Electrochemical Determination of Metronidazole Using a Glassy Carbon Electrode Modified with Nanoporous Bimetallic Carbon Derived from a ZnCo-Based Metal-Organic Framework. J. Electrochem. Soc. 2020, 167, 116513. [Google Scholar] [CrossRef]
- Meenakshi, S.; Rama, R.; Pandian, K.; Gopinath, S.C.B. Modified electrodes for electrochemical determination of metronidazole in drug formulations and biological samples: An overview. Microchemical Journal 2021, 165, 106151. [Google Scholar] [CrossRef]
- Hena, S.; Gutierrez, L.; Croué, J.-P. Removal of metronidazole from aqueous media by C. vulgaris. J. Hazard. Mater. 2020, 384, 121400. [Google Scholar] [CrossRef]
- Santos, L.H.M.L.M.; Araújo, A.N.; Fachini, A.; Pena, A.; Delerue-Matos, C.; Montenegro, M.C.B.S.M. Ecotoxicological aspects related to the presence of pharmaceuticals in the aquatic environment. J. Hazard. Mater. 2010, 175, 45–95. [Google Scholar] [CrossRef] [PubMed]
- Carrales-Alvarado, D.H.; Rodríguez-Ramos, I.; Leyva-Ramos, R.; Mendoza-Mendoza, E.; Villela-Martínez, D.E. Effect of surface area and physical–chemical properties of graphite and graphene-based materials on their adsorption capacity towards metronidazole and trimethoprim antibiotics in aqueous solution. Chem. Eng. J. 2020, 402, 126155. [Google Scholar] [CrossRef]
- Eniola, J.O.; Kumar, R.; Barakat, M.A. Adsorptive removal of antibiotics from water over natural and modified adsorbents. Environ. Sci. Pollut. Res. 2019, 26, 34775–34788. [Google Scholar] [CrossRef]
- Forouzesh, M.; Ebadi, A.; Abedini, F. Thermocatalytic persulfate activation for metronidazole removal in the continuous operation. Sep. Purif. Technol. 2021, 258, 118055. [Google Scholar] [CrossRef]
- Xu, M.; Wang, J.; Zhang, L.; Wang, Q.; Liu, W.; An, Y.; Hao, L.; Wang, C.; Wang, Z.; Wu, Q. Construction of hydrophilic hypercrosslinked polymer based on natural kaempferol for highly effective extraction of 5-nitroimidazoles in environmental water, honey and fish samples. J. Hazard. Mater. 2022, 429, 128288. [Google Scholar] [CrossRef] [PubMed]
- Bonyadi, Z.; Noghani, F.-A.; Dehghan, A.; van der Hoek, J.P.; Giannakoudakis, D.A.; Ghadiri, S.K.; Anastopoulos, I.; Sarkhosh, M.; Colmenares, J.C.; Shams, M. Biomass-derived porous aminated graphitic nanosheets for removal of the pharmaceutical metronidazole: Optimization of physicochemical features and exploration of process mechanisms. Colloids Surf. A: Physicochem. Eng. Asp. 2021, 611, 125791. [Google Scholar] [CrossRef]
- Sadegh, H.; Ali, G. Potential Applications of Nanomaterials in Wastewater Treatment: Nanoadsorbents Performance. In Advanced Treatment Techniques for Industrial Wastewater; IGI Global: Hershey, PA, USA, 2018. [Google Scholar]
- Tran, M.L.; Fu, C.-C.; Juang, R.-S. Effects of water matrix components on degradation efficiency and pathways of antibiotic metronidazole by UV/TiO2 photocatalysis. J. Mol. Liq. 2019, 276, 32–38. [Google Scholar] [CrossRef]
- Merian, E.; Anke, M.; Ihnat, M.; Stoeppler, M. Elements and Their Compounds in the Environment; Wiley-VCH Verlag GmbH & Co.: Weinheim, Germany, 2004. [Google Scholar]
- Rivera-Utrilla, J.; Prados-Joya, J.; Sánchez-Polo, M.; Ferro-García, M.A.; López-Peñalver, J.J.; Bautista-Toledo, M.I. Removal of nitroimidazole antibiotics from water by adsorption/bioadsortion on activated carbon and advanced oxidation processes. Trends Chem. Eng. 2009, 12, 51–69. [Google Scholar]
- Filella, M.; May, P.M. Reflections on the calculation and publication of potentiometrically-determined formation constants. Talanta 2005, 65, 1221–1225. [Google Scholar] [CrossRef]
- Dantas, R.F.; Rossiter, O.; Kardec, A.; Teixeira, R.; Simões, A.S.M.; Lins da Silva, V. Direct UV photolysis of propranolol and metronidazole in aqueous solution. Chem. Eng. J. 2010, 158, 143–147. [Google Scholar] [CrossRef]
- Völgyi, G.; Ruiz, R.; Box, K.; Comer, J.; Bosch, E.; Takacs-Novak, K. Potentiometric and spectrophotometric pKa determination of water-insoluble compounds: Validation study in a new cosolvent system. Anal. Chim. Acta 2007, 583, 418–428. [Google Scholar] [CrossRef] [PubMed]
- Cardiano, P.; De Stefano, C.; Giuffrè, O.; Sammartano, S. Thermodynamic and spectroscopic study for the interaction of dimethyltin(IV) with L-cysteine in aqueous solution. Biophys. Chem. 2008, 133, 19–27. [Google Scholar] [CrossRef][Green Version]
- Falcone, G.; Giuffrè, O.; Sammartano, S. Acid-base and UV properties of some aminophenol ligands and their complexing ability towards Zn2+ in aqueous solution. J. Mol. Liquids. 2011, 159, 146–151. [Google Scholar] [CrossRef]
- Bouchoucha, A.; Terbouche, A.; Zaouani, M.; Derridj, F.; Djebbar, S. Iron and nickel complexes with heterocyclic ligands: Stability, synthesis, spectral characterization, antimicrobial activity, acute and subacute toxicity. J. Trace Elem. Med. Biol. 2013, 27, 191–202. [Google Scholar] [CrossRef] [PubMed]
- Aiello, D.; Cordaro, M.; Napoli, A.; Foti, C.; Giuffrè, O. Speciation study on O-phosphoryethanolamine and O-phosphorylcholine: Acid-base behavior and Mg2+ interaction. Front. Chem. 2022, 10, 864648. [Google Scholar] [CrossRef]
- Cardiano, P.; Foti, C.; Giacobello, F.; Giuffrè, O.; Sammartano, S. Study of Al3+ interaction with AMP, ADP and ATP in aqueous solution. Biophys Chem. 2018, 234, 42–50. [Google Scholar] [CrossRef] [PubMed]
- Aiello, D.; Carnamucio, F.; Cordaro, M.; Foti, C.; Napoli, A.; Giuffrè, O. Ca2+ complexation with relevant bioligands in aqueous solution: A speciation study with implications for biological fluids. Front. Chem. 2021, 9, 640219. [Google Scholar] [CrossRef]
- De Stefano, C.; Foti, C.; Giuffrè, O.; Sammartano, S. Acid-base and UV behaviour of 3-(3,4-dihydroxyphenyl)-propenoic acid (caffeic acid) and complexing ability towards different divalent metal cations in aqueous solution. J. Mol. Liquids 2014, 195, 9–16. [Google Scholar] [CrossRef]
- Foti, C.; Giuffrè, O. Interaction of Ampicillin and Amoxicillin with Mn2+: A Speciation Study in Aqueous Solution. Molecules 2020, 25, 3110. [Google Scholar] [CrossRef]
- Giuffrè, O.; Angowska, S.; Foti, C.; Sammartano, S. Thermodynamic Study on the Interaction of Ampicillin and Amoxicillin with Ca2+ in Aqueous Solution at Different Ionic Strengths and Temperatures. J. Chem. Eng. Data 2019, 64, 800–809. [Google Scholar] [CrossRef]
- Cordaro, M.; Foti, C.; Giacobello, F.; Giuffrè, O.; Sammartano, S. Phosphonic Derivatives of Nitrilotriacetic Acid as Sequestering Agents for Ca2+ in Aqueous Solution: A Speciation Study for Application in Natural Waters. ACS Earth Space Chem. 2019, 3, 1942–1954. [Google Scholar] [CrossRef]
- Giuffrè, O.; Aiello, D.; Chillè, D.; Napoli, A.; Foti, C. Binding ability of arsenate towards Cu2+ and Zn2+: Thermodynamic behavior and simulation under natural water conditions. Environ. Sci.: Process. Impacts 2020, 22, 1731–1742. [Google Scholar] [CrossRef]
- Wagil, M.; Maszkowska, J.; Bialk-Bielinska, A.; Caban, M.; Stepnowski, P.; Kumirska, J. Determination of metronidazole residues in water, sediment and fish tissues samples. Chemosphere 2015, 119, S28–S34. [Google Scholar] [CrossRef]
- Martell, A.E.; Smith, R.M.; Motekaitis, R.J. Critically Selected Stability Constants of Metal Complexes; National Institute of Standard and Technology, NIST: Gaithersburg, MD, USA, 2004.
- May, P.M.; Murray, K. Database of chemical reactions designed to achieve thermodynamic consistency automatically. J. Chem. Eng. Data 2001, 46, 1035–1040. [Google Scholar] [CrossRef]
- Pettit, L.D.; Powell, K.J. The IUPAC Stability Constants Database. 2001. Available online: https://www.google.com.hk/url?sa=t&rct=j&q=&esrc=s&source=web&cd=&ved=2ahUKEwju4o_b6eD5AhVAUGwGHQ_FB1QQFnoECBAQAQ&url=http%3A%2F%2Fold.iupac.org%2Fprojects%2Fposters01%2Fpettit01.pdf&usg=AOvVaw2s4jSW1Tof7TVky2_ZtBny (accessed on 1 July 2022).
- De Stefano, C.; Sammartano, S.; Mineo, P.; Rigano, C. Computer Tools for the Speciation of Natural Fluids. In Marine Chemistry—An Environmental Analytical Chemistry Approach; Gianguzza, A., Pelizzetti, E., Sammartano, S., Eds.; Kluwer Academic Publishers: Amsterdam, The Netherlands, 1997; pp. 71–83. [Google Scholar]
- Frassineti, C.; Alderighi, L.; Gans, P.; Sabatini, A.; Vacca, A.; Ghelli, S. Determination of protonation constants of some fluorinated polyamines by means of 13C NMR data processed by the new computer program Hypnmr2000. Protonation sequence in polyamines. Anal. Bioanal. Chem. 2003, 376, 1041–1052. [Google Scholar] [PubMed]
- Alderighi, L.; Gans, P.; Ienco, A.; Peters, D.; Sabatini, A.; Vacca, A. Hyperquad simulation and speciation (HySS): A utility program for the investigation of equilibria involving soluble and partially soluble species. Coord. Chem. Rev. 1999, 184, 311–318. [Google Scholar] [CrossRef]
Publisher’s Note: MDPI stays neutral with regard to jurisdictional claims in published maps and institutional affiliations. |
© 2022 by the authors. Licensee MDPI, Basel, Switzerland. This article is an open access article distributed under the terms and conditions of the Creative Commons Attribution (CC BY) license (https://creativecommons.org/licenses/by/4.0/).