
Molecular Dereplication and In Vitro and In Silico Pharmacological Evaluation of Coriandrum sativum against Neuroblastoma Cells

 ,
,  ,
,  ,
,  , ,
, ,
Abstract
:1. Introduction
2. Results
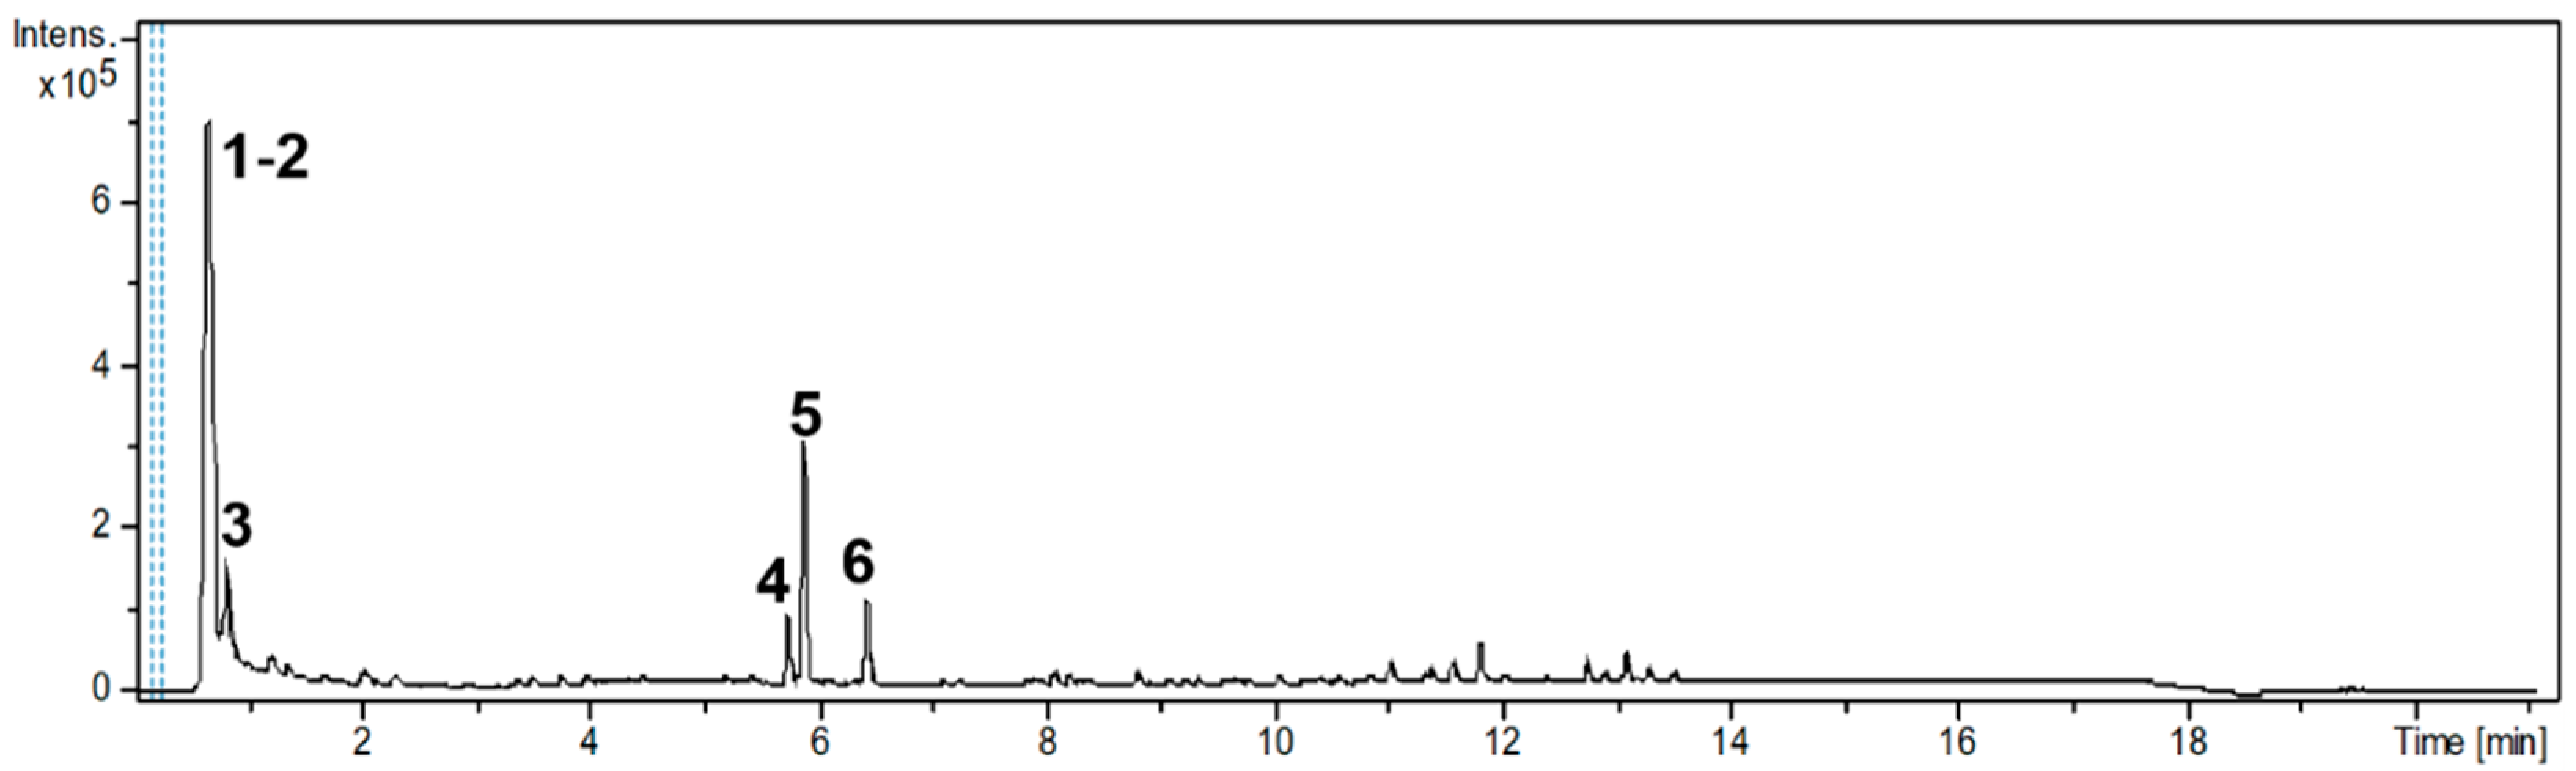
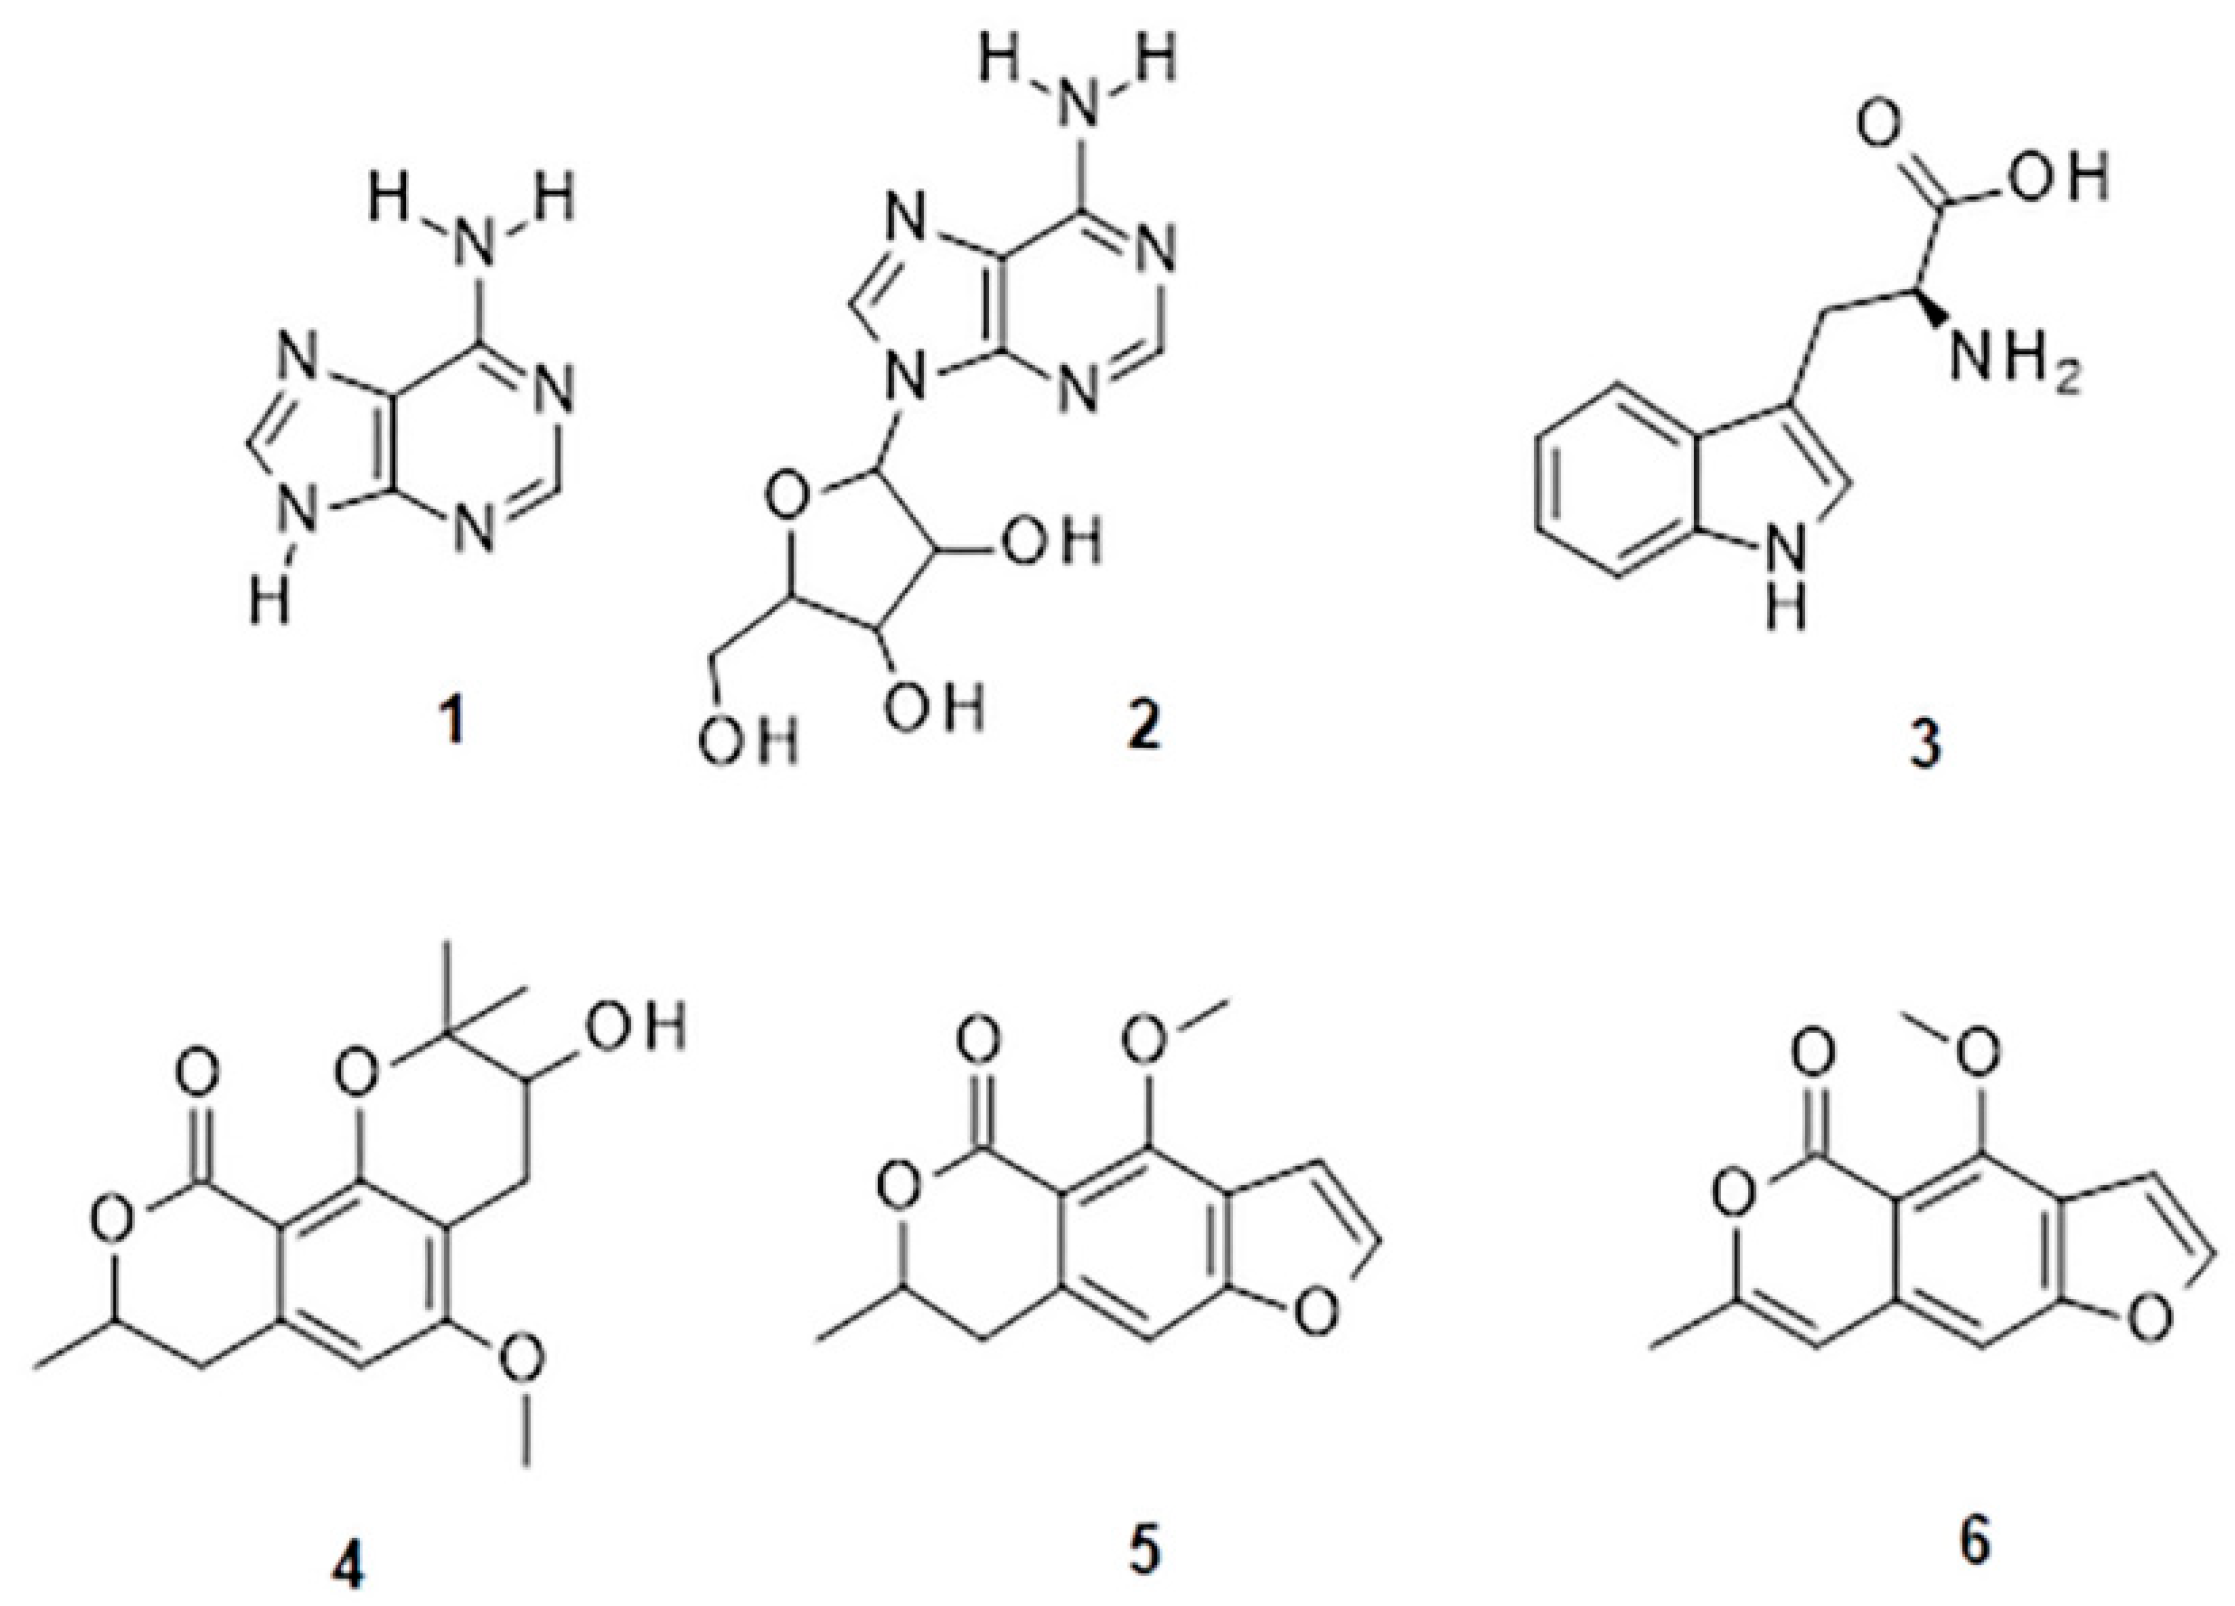
2.1. Phytochemical Analysis of the C. sativum Ethanolic Extract (CSEE)
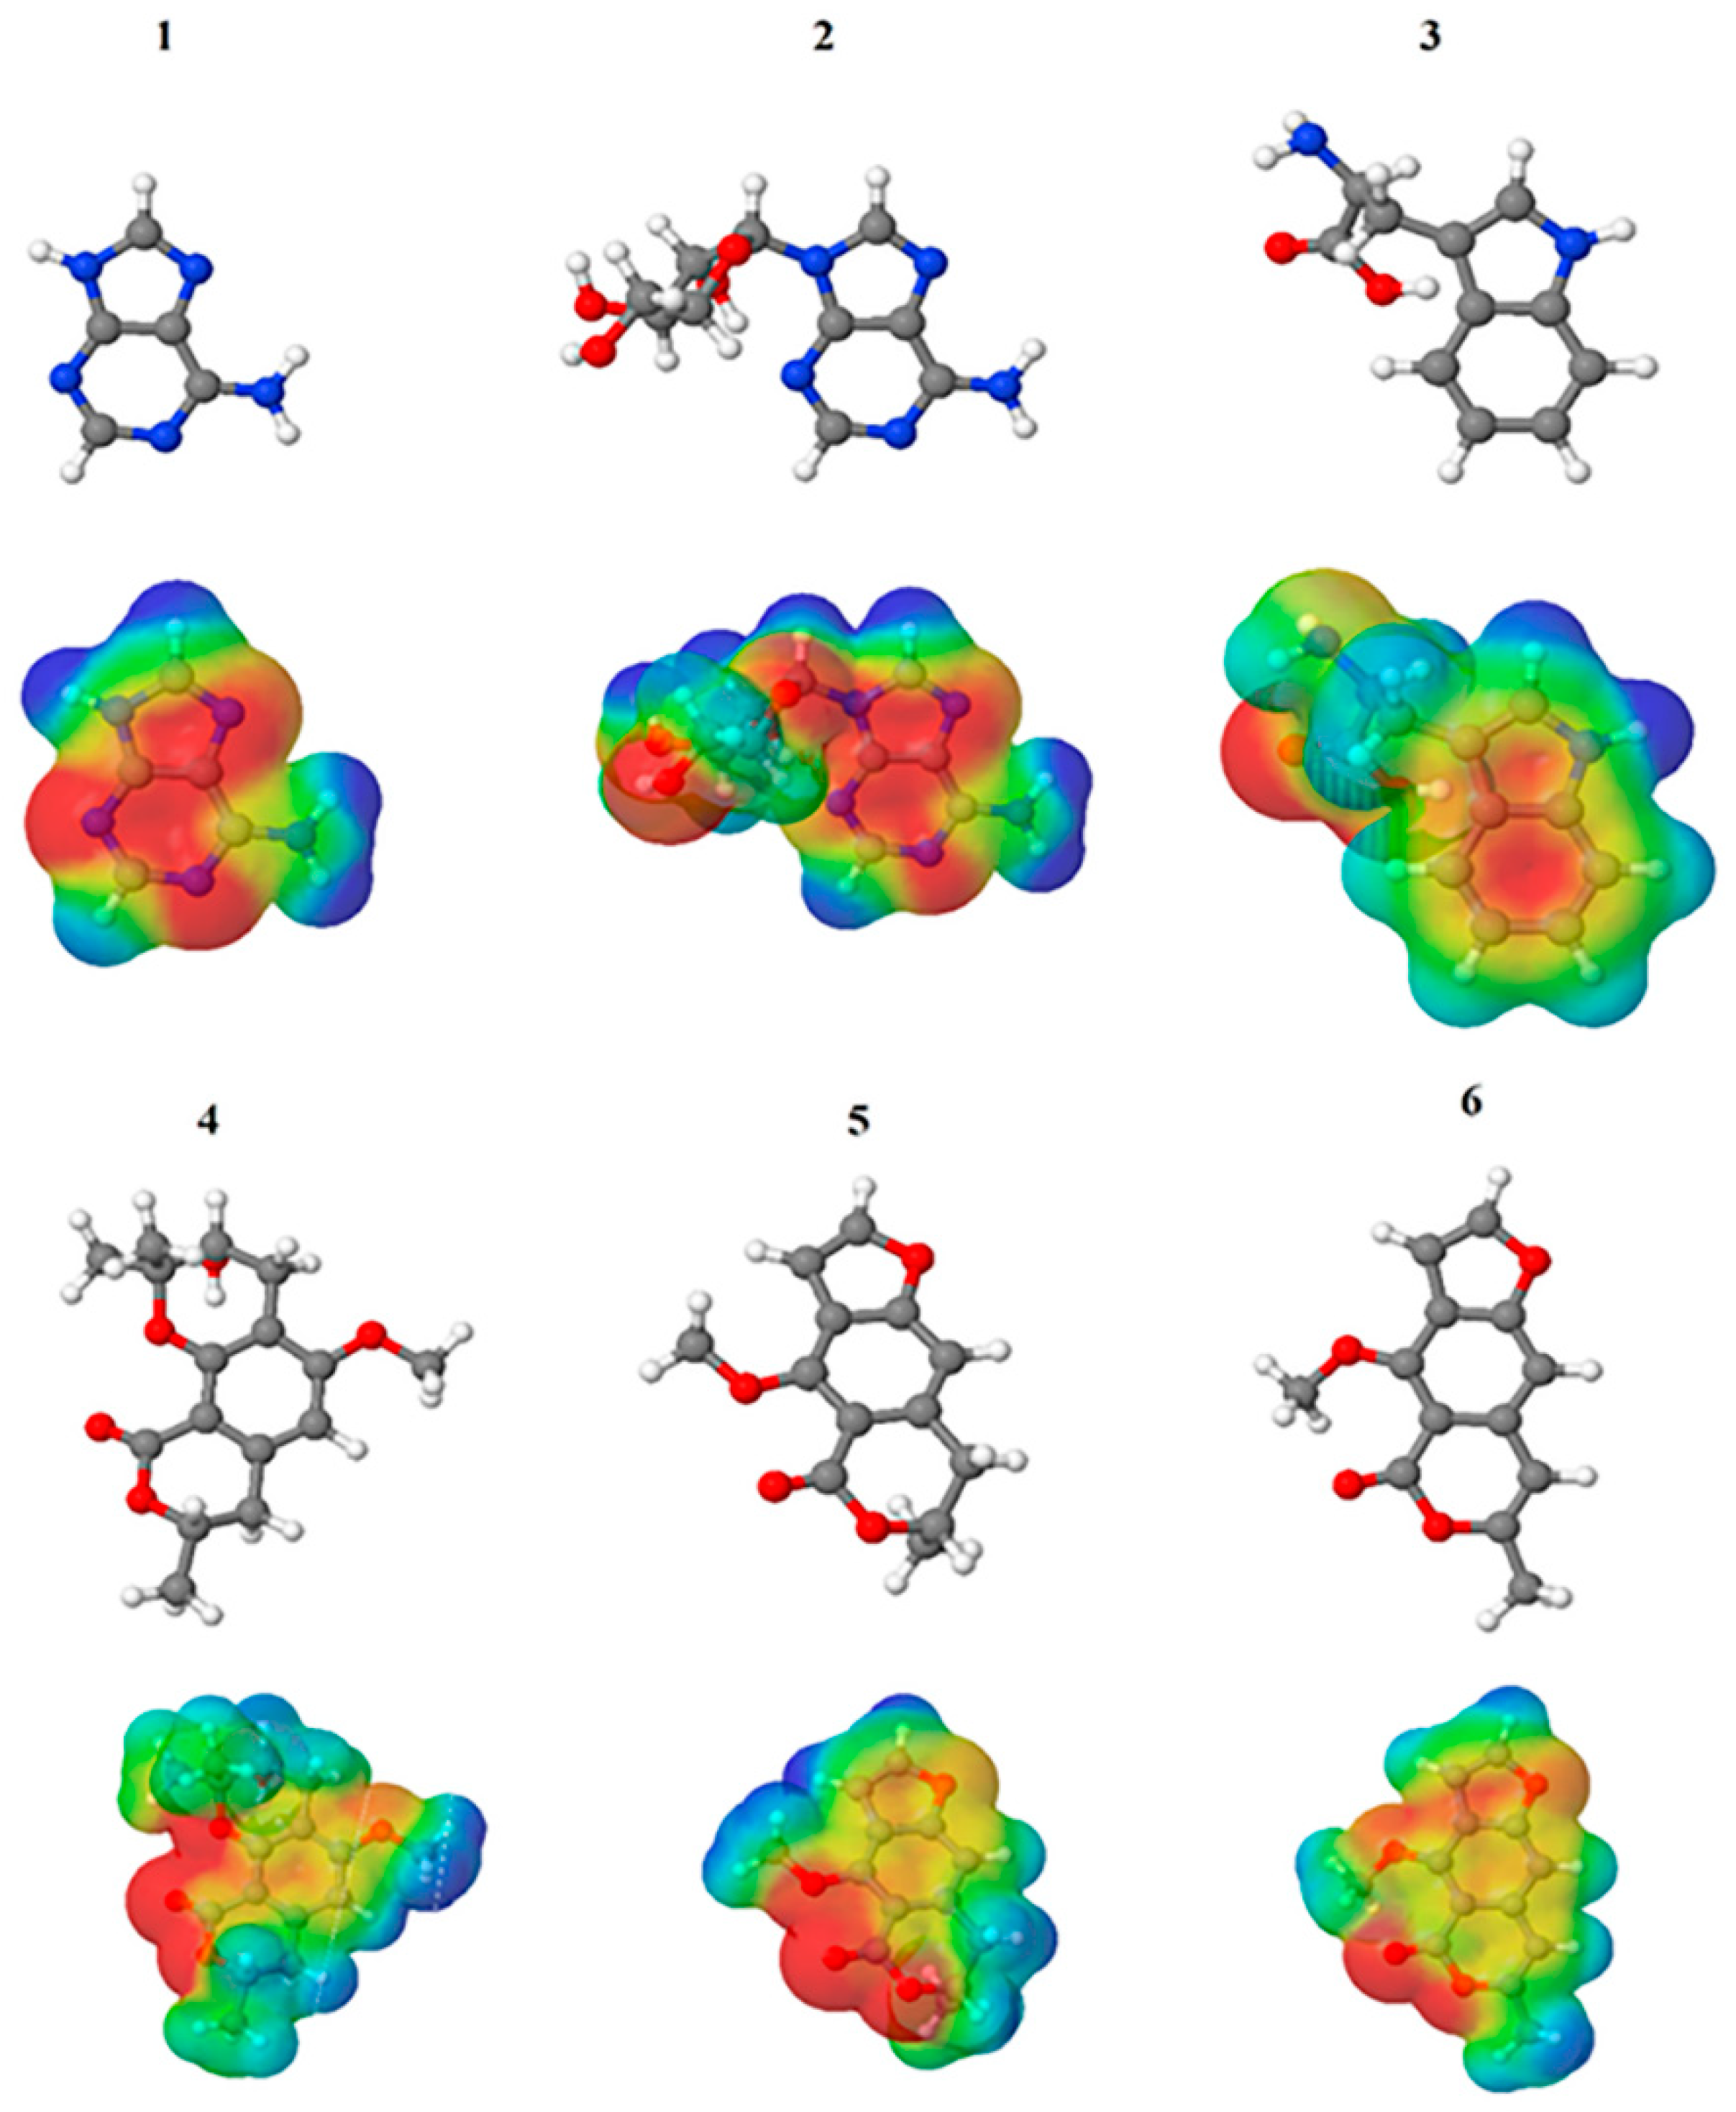
2.2. Molecular Interactions and ADME Properties Predictions
2.3. Antioxidant Activity
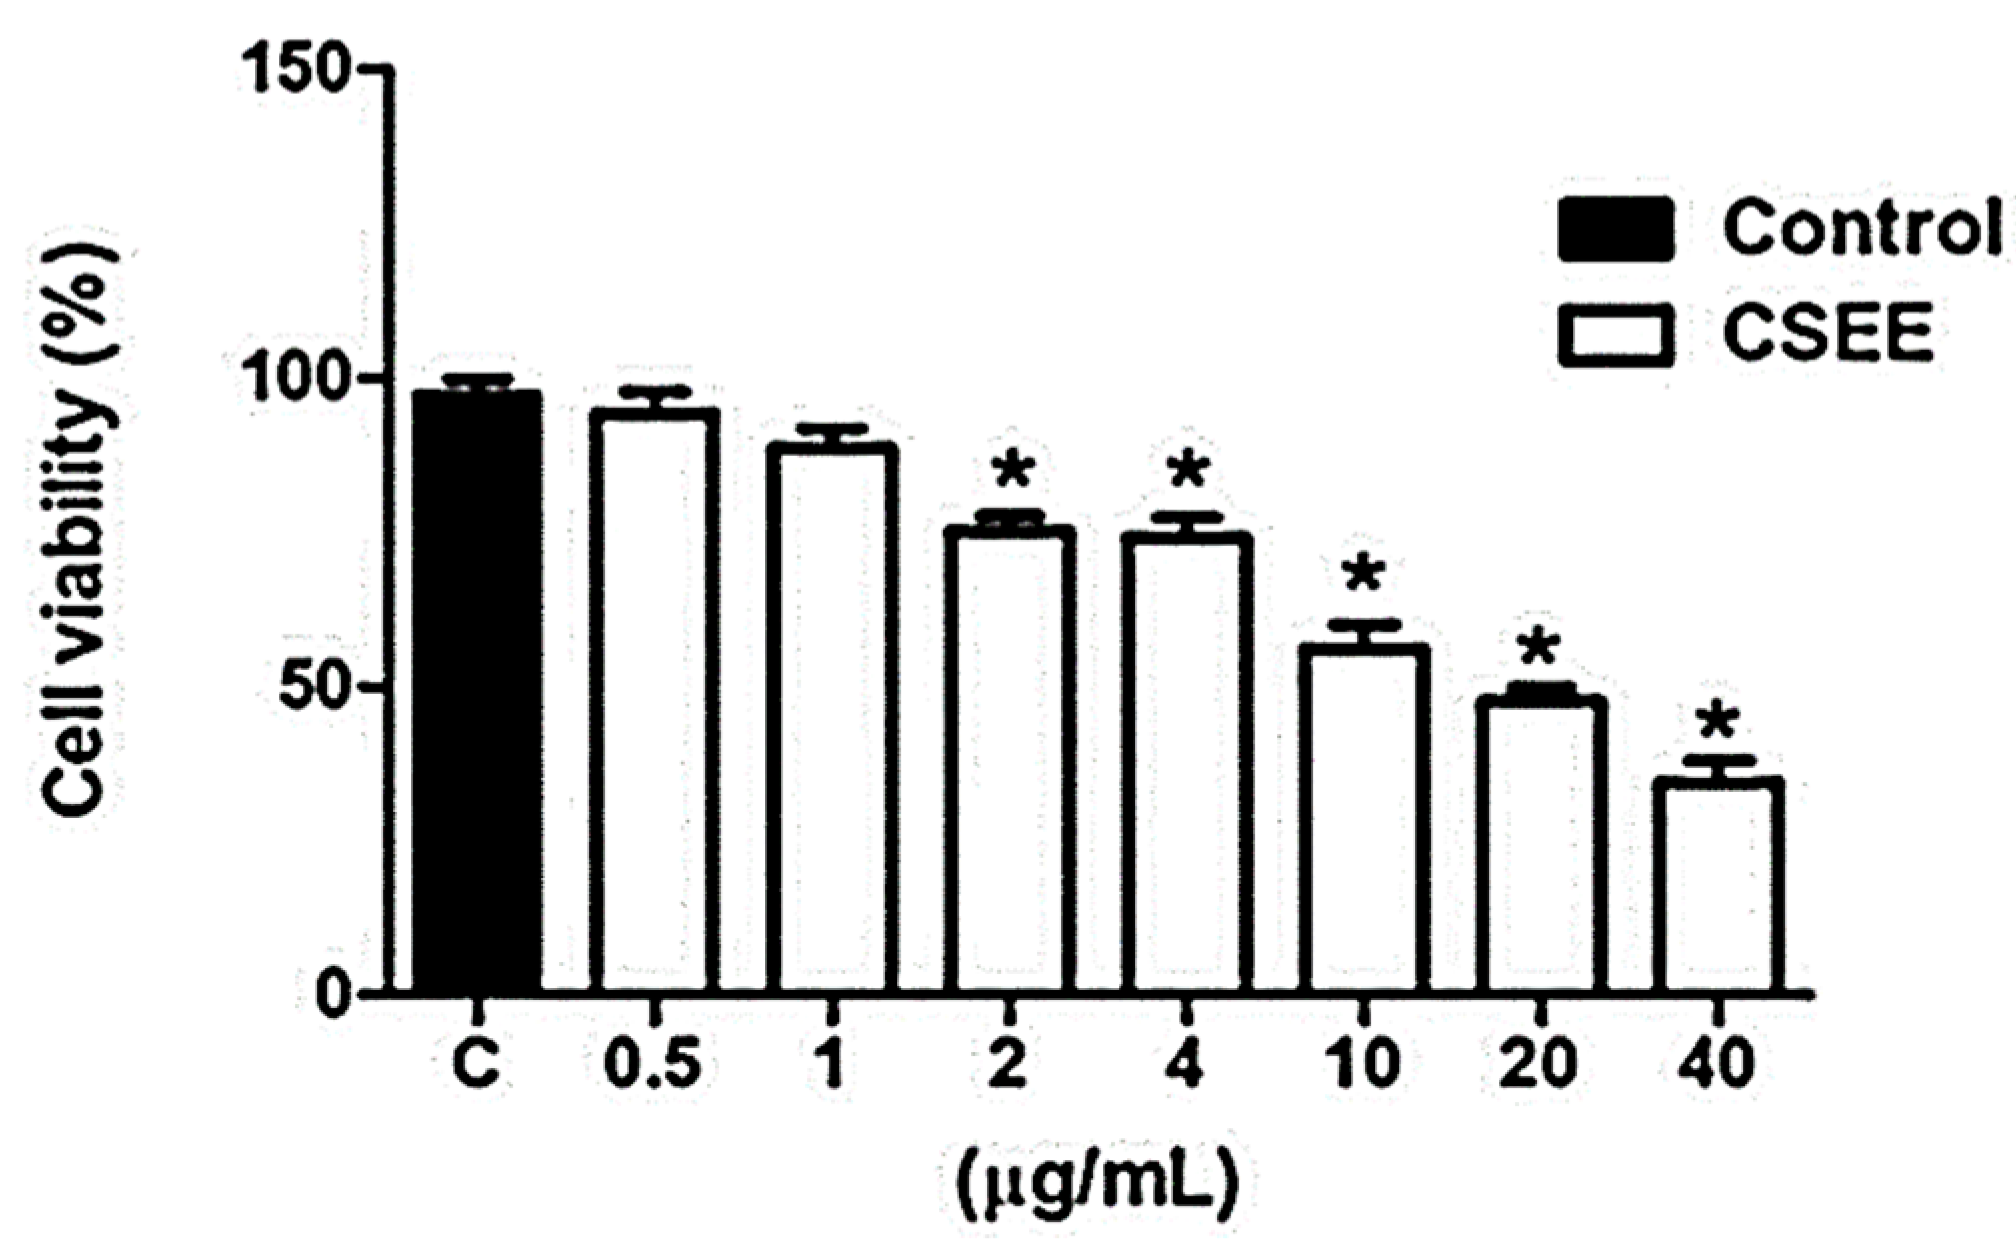
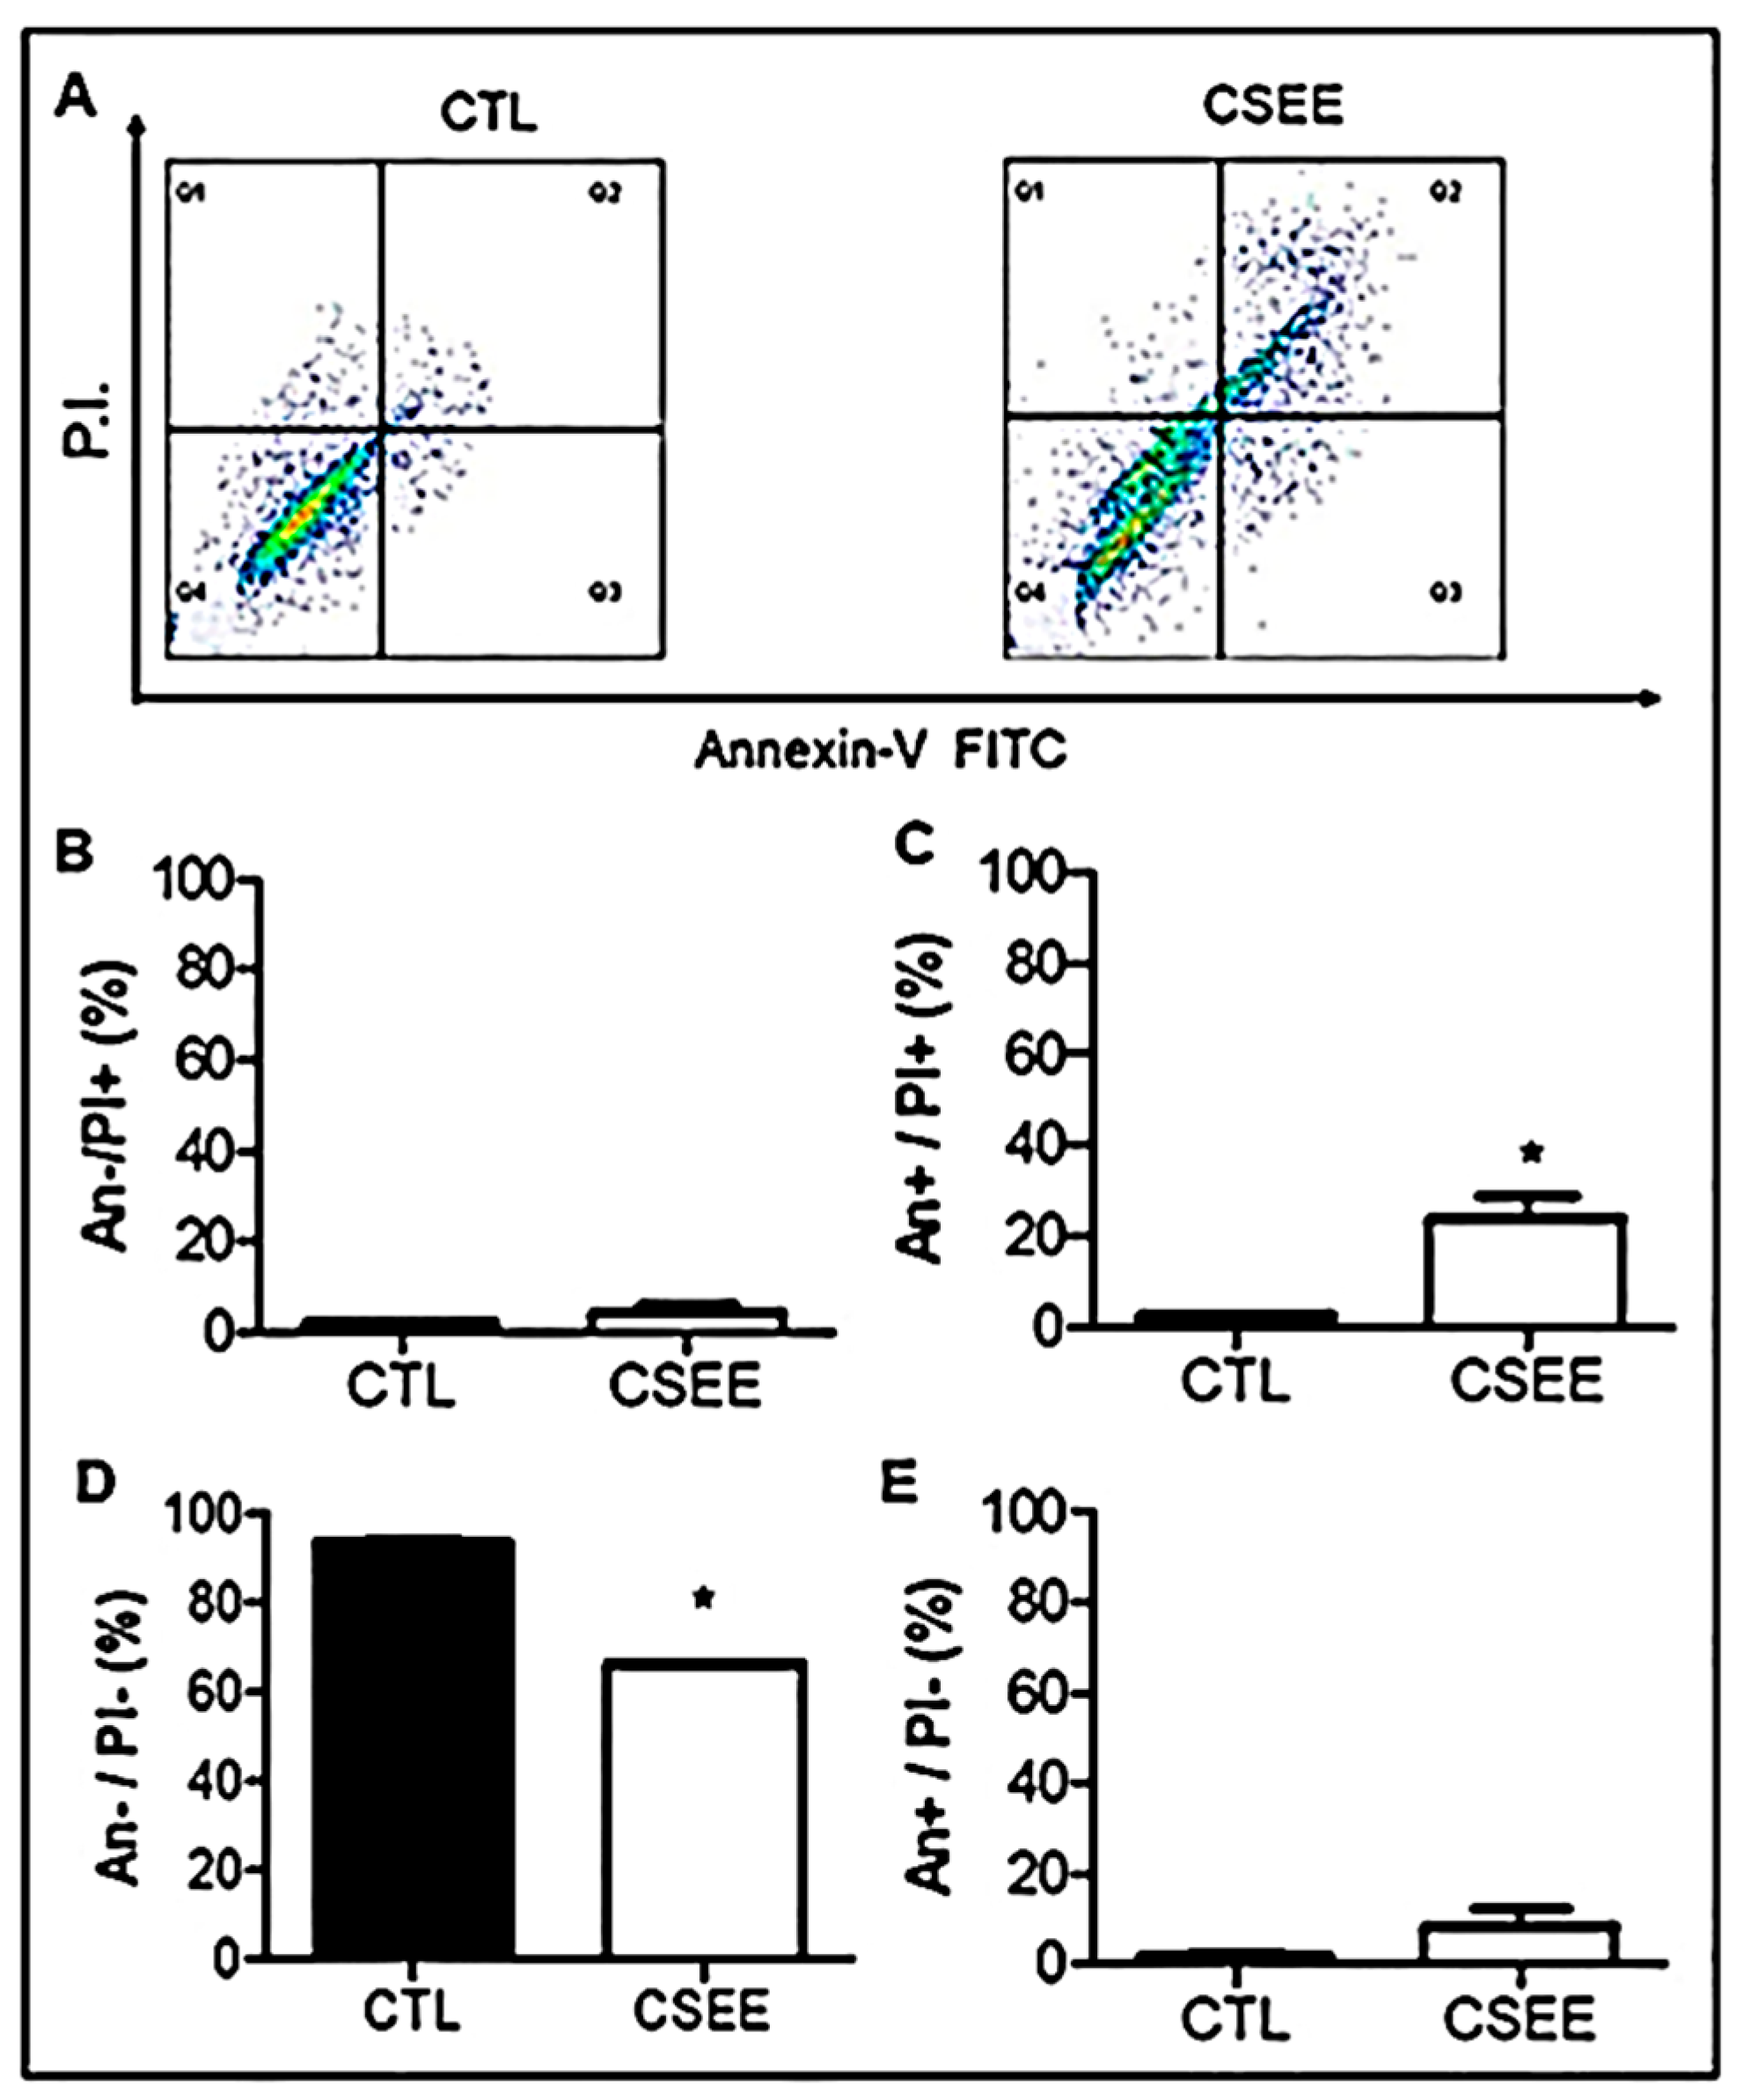
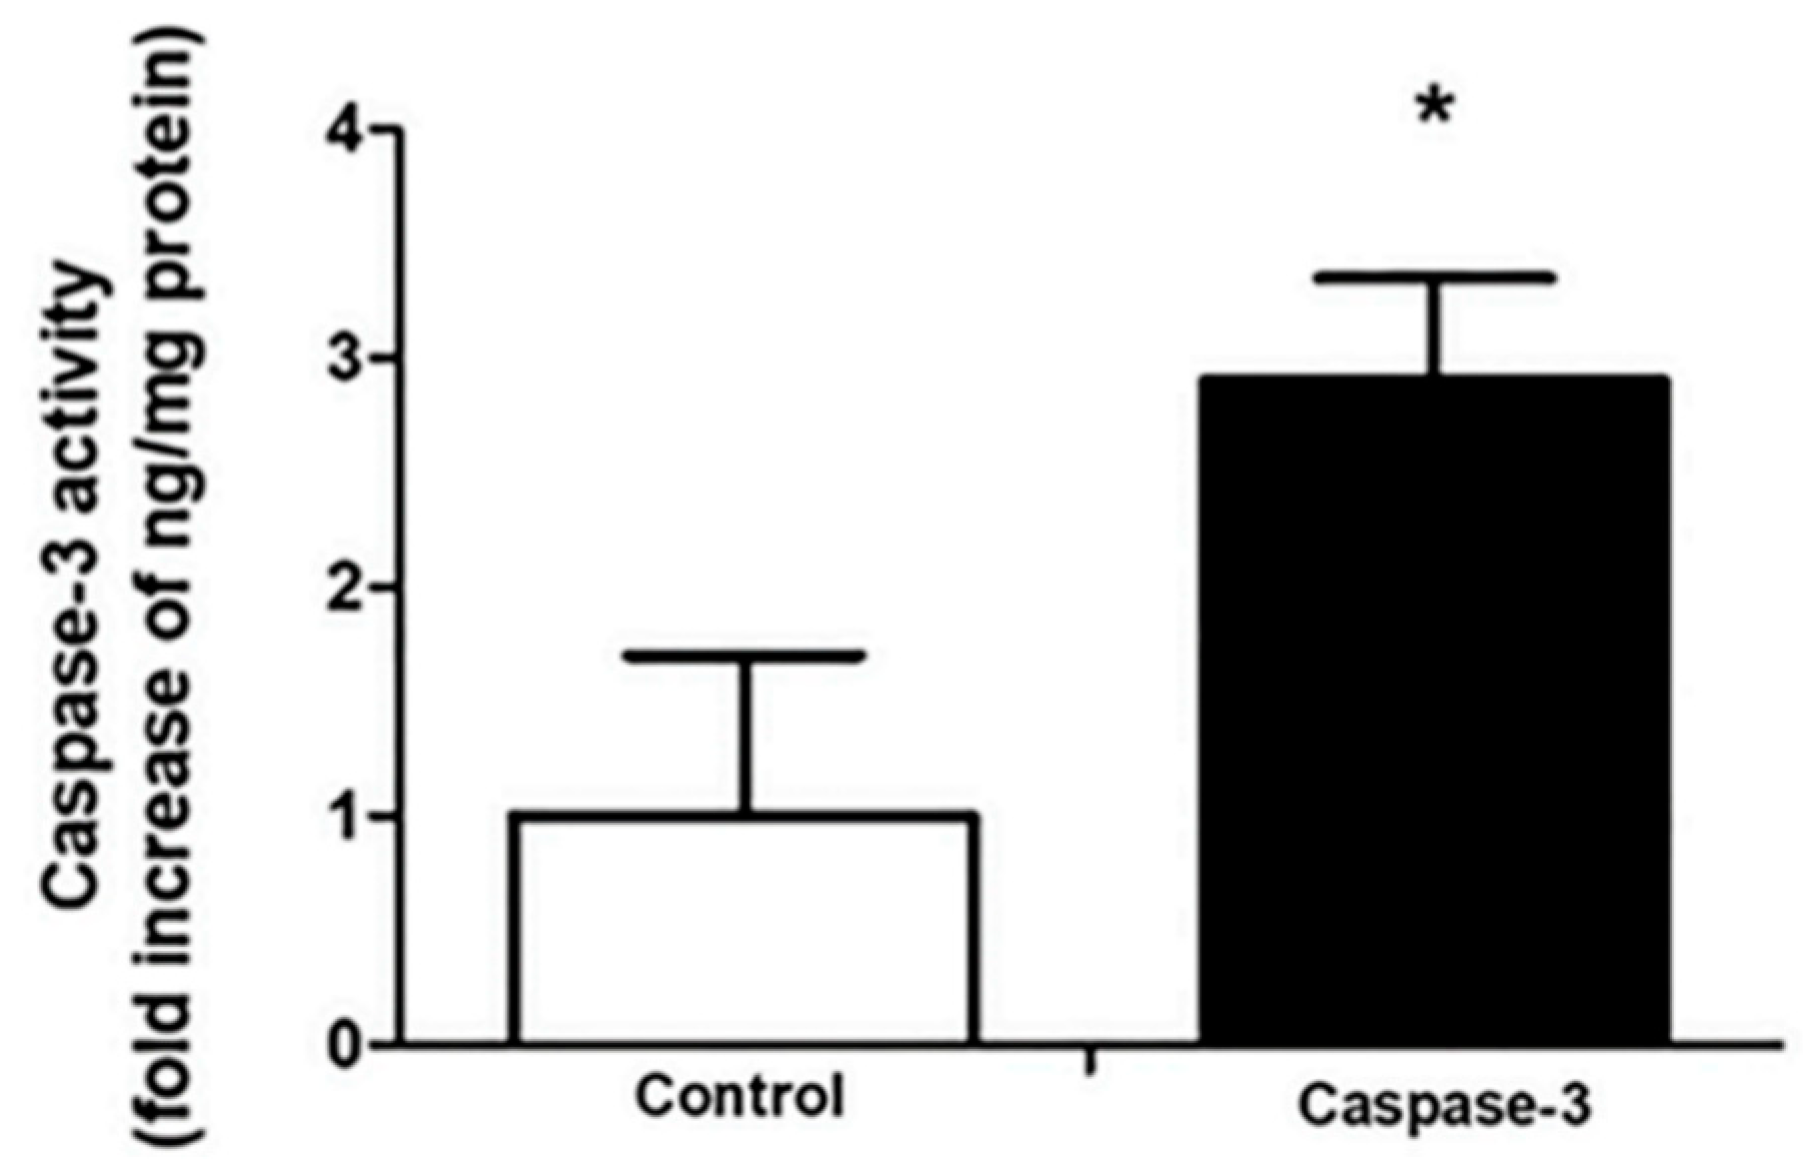
2.4. CSEE Decreased the Viability of SH-SY5Y Cells, and Induces Apoptosis via the Intrinsic Pathway
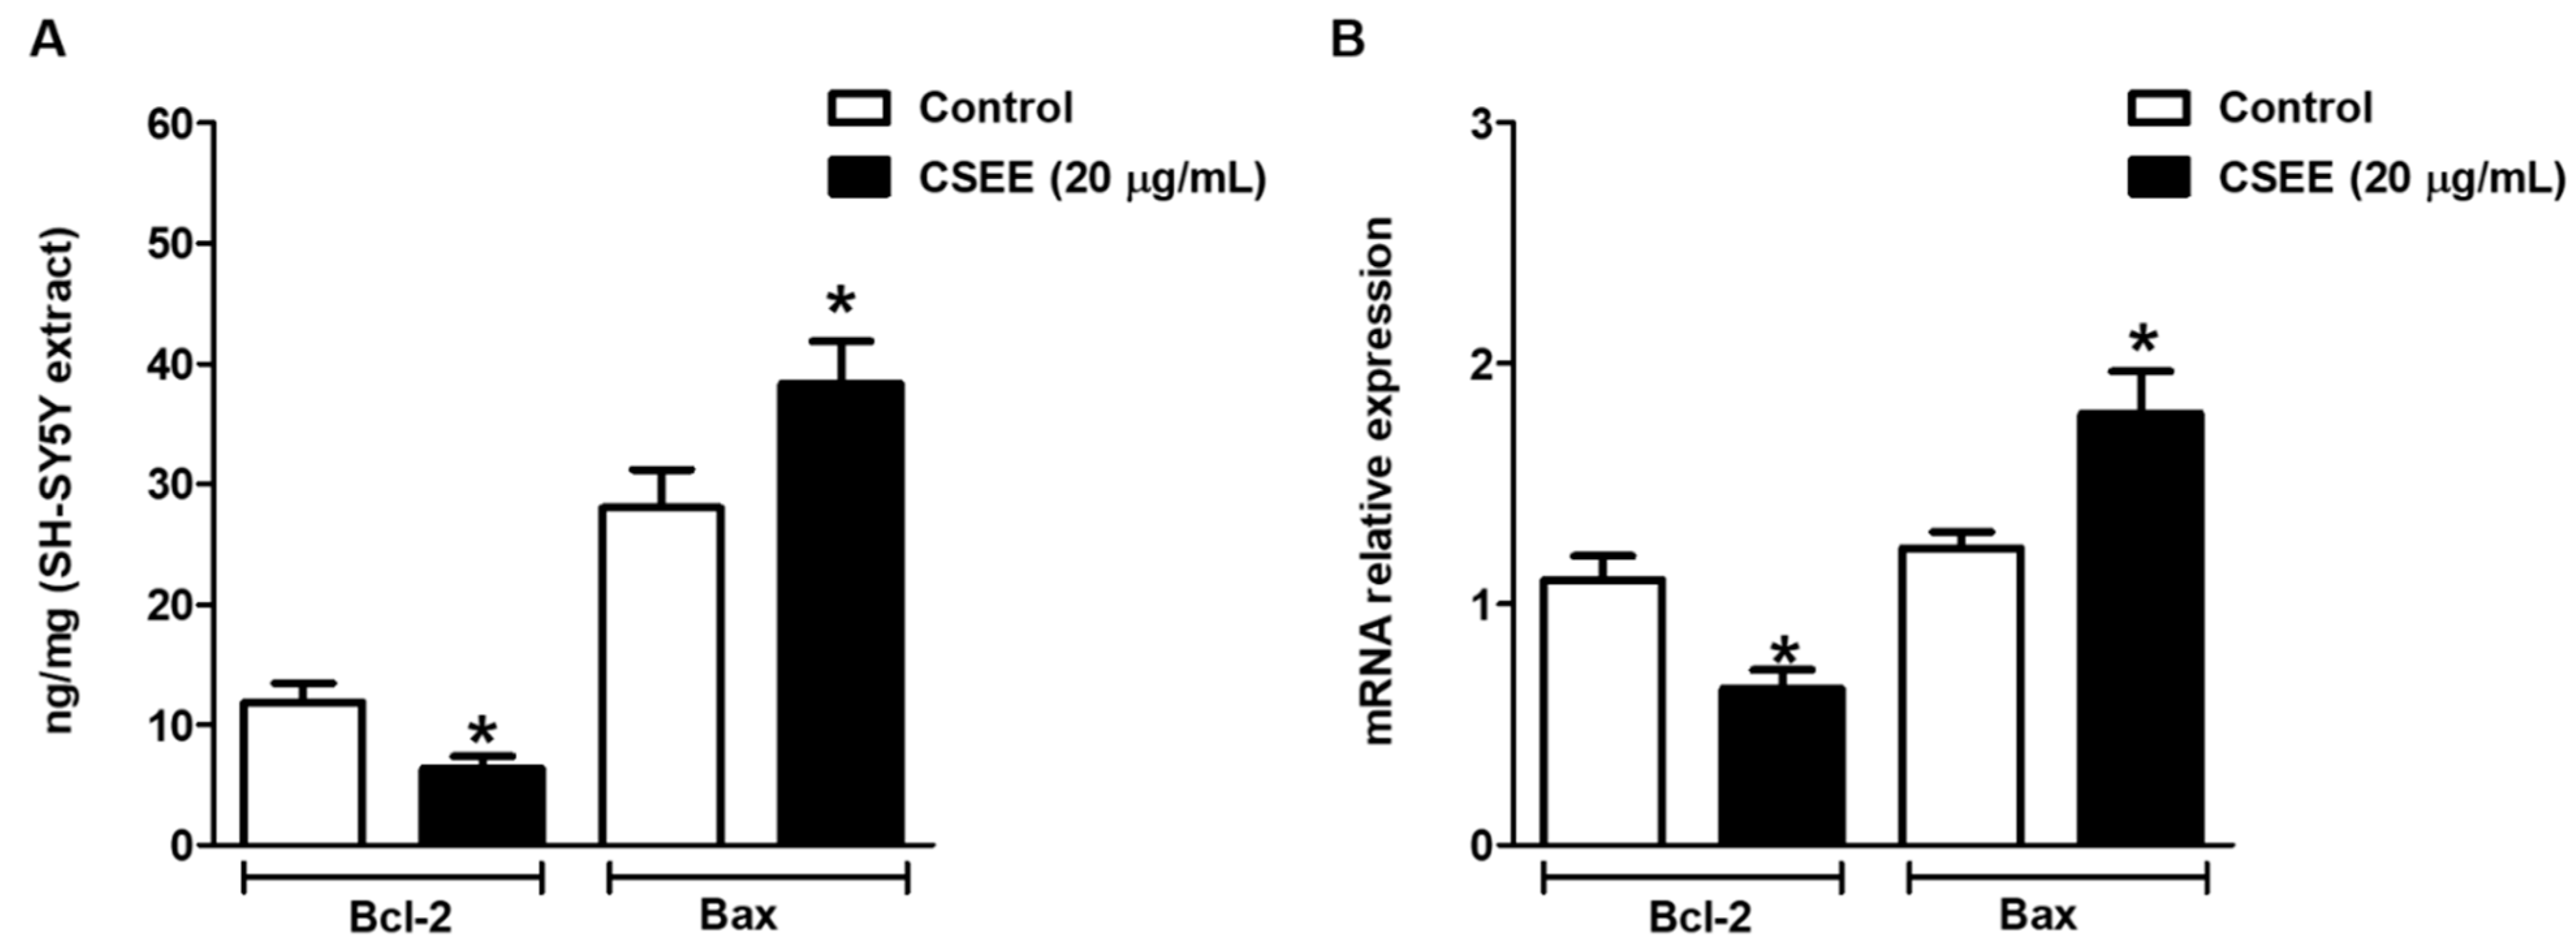
2.5. Bcl-2 and Bax Expression in SH-SY5Y Cells
3. Discussion
4. Material and Methods
4.1. Reagents
4.2. Preparation of Plant Materials and Phytochemical Analysis
4.2.1. Total Soluble Solids
4.2.2. Estimation of Total Phenolic Content
4.2.3. Flavonoids
4.3. Chemical Composition—Molecular Dereplication (UPLC/DAD-ESI/HRMS/MS)
4.4. Molecular Interactions and ADME Properties Prediction
4.5. Antioxidant Activity
4.6. Cell Line and MTT Assay
4.7. Cell Death Evaluation by Annexin V/FITC–PI Staining and Flow Cytometry Analysis
4.8. Caspase-3 Activity Measurement
4.9. ELISA (Enzyme Linked ImmunonoSorbent Assay)
4.10. Reverse Transcription-Quantitative PCR (RT-qPCR)
4.11. Statistical Analysis
5. Conclusions
Author Contributions
Funding
Institutional Review Board Statement
Informed Consent Statement
Data Availability Statement
Acknowledgments
Conflicts of Interest
Sample Availability
References
- Krzyzanowska, J.; Czubacka, A.; Oleszek, W. Dietary phytochemicals and human health. Adv. Exp. Med. Biol. 2010, 698, 74–98. [Google Scholar] [CrossRef] [PubMed]
- Momin, A.H.; Acharya, S.S.; Gajjar, A.V. Coriandrum sativum-review of advances in phytopharmacology. IJPSR 2012, 3, 1233–1239. [Google Scholar]
- Elgndi, M.A.; Filip, S.; Pavlić, B.; Vladić, J.; Stanojković, T.; Žižak, Z.; Zeković, Z. Antioxidative and cytotoxic activity of essential oils and extracts of Satureja montana L., Coriandrum sativum L. and Ocimum basilicum L. obtained by supercritical fluid extraction. J. Supercrit. Fluids 2017, 128, 128–137. [Google Scholar] [CrossRef]
- Higashimoto, M.; Purintrapiban, J.; Kataoka, K.; Kinouchi, T.; Vinitketkumnuen, U.; Akimoto, S.; Matsumoto, H.; Ohnishi, Y. Mutagenicity and antimutagenicity of extracts of three spices and a medicinal plant in Thailand. Mutat. Res. Lett. 1993, 303, 135–142. [Google Scholar] [CrossRef]
- Gray, A.M.; Flatt, P.R. Insulin-releasing and insulin-like activity of the traditional anti-diabetic plant Coriandrum sativum (coriander). Br. J. Nutr. 1999, 81, 203–209. [Google Scholar] [CrossRef] [PubMed] [Green Version]
- Gastón, M.S.; Cid, M.P.; Vázquez, A.M.; Decarlini, M.F.; Demmel, G.I.; Rossi, L.I.; Aimar, M.L.; Salvatierra, N.A. Sedative effect of central administration of Coriandrum sativum essential oil and its major component linalool in neonatal chicks. Pharm. Biol. 2016, 54, 1954–1961. [Google Scholar] [CrossRef] [Green Version]
- Prachayasittikul, V.; Prachayasittikul, S.; Ruchirawat, S.; Prachayasittikul, V. Coriander (Coriandrum sativum): A promising functional food toward the well-being. Food. Res. Int. 2018, 105, 305–323. [Google Scholar] [CrossRef]
- Laribi, B.; Kouki, K.; M’Hamdi, M.; Bettaieb, T. Coriander (Coriandrum sativum L.) and its bioactive constituents. Fitoterapia 2015, 103, 9–26. [Google Scholar] [CrossRef]
- Mahleyuddin, N.N.; Moshawih, S.; Ming, L.C.; Zulkifly, H.H.; Kifli, N.; Loy, M.J.; Sarker, M.M.R.; Al-Worafi, Y.M.; Goh, B.H.; Thuraisingam, S.; et al. Coriandrum sativum L.: A Review on Ethnopharmacology, Phytochemistry, and Cardiovascular Benefits. Molecules 2021, 30, 209. [Google Scholar] [CrossRef]
- Tang, E.L.; Rajarajeswaran, J.; Fung, S.Y.; Kanthimathi, M. Antioxidant activity of Coriandrum sativum and protection against DNA damage and cancer cell migration. BMC Complement. Altern. Med. 2013, 13, 347. [Google Scholar] [CrossRef] [Green Version]
- Dias, M.I.; Barros, L.; Sousa, M.J.; Ferreira, I.C.F.R. Comparative study of lipophilic and hydrophilic antioxidants from In vivo and In vitro grown Coriandrum sativum. Plant. Foods Hum. Nutr. 2011, 66, 181–186. [Google Scholar] [CrossRef] [PubMed]
- Liu, Q.F.; Jeong, H.; Lee, J.H.; Hong, Y.K.; Oh, Y.; Kim, Y.M.; Suh, Y.S.; Bang, S.; Yun, H.S.; Lee, K.; et al. Coriandrum sativum Suppresses Aβ42-Induced ROS Increases, Glial Cell Proliferation, and ERK Activation. Am. J. Chin. Med. 2016, 44, 1325–1347. [Google Scholar] [CrossRef] [PubMed]
- Msaada, K.; Jemia, M.B.; Salem, N.; Bachrouch, O.; Sriti, J.; Tammar, S.; Bettaieb, I.; Jabri, I.; Kefi, S.; Limam, F.; et al. Antioxidant activity of methanolic extracts from three coriander (Coriandrum sativum L.) fruit varieties. Arab. J. Chem. 2017, 10, S3176–S3183. [Google Scholar] [CrossRef]
- de Almeida Melo, E.; Mancini Filho, J.; Barbosa Guerra, N. Characterization of antioxidant compounds in aqueous coriander extract (Coriandrum sativum L.). Food Sci. Technol. 2005, 38, 15–19. [Google Scholar] [CrossRef]
- Nadeem, M.; Anjum, F.M.; Khan, M.I.; Tehseen, S. Nutritional and medicinal aspects of coriander Coriandrum sativum L. Br. Food J. 2013, 115, 743–755. [Google Scholar] [CrossRef]
- Allen, F.; Greiner, R.; Wishart, D. Competitive fragmentation modeling of ESI-MS/MS spectra for putative metabolite identification. Metabolomics 2015, 11, 98–110. [Google Scholar] [CrossRef] [Green Version]
- Zhang, G.; Musgrave, C.B. Comparison of DFT methods for molecular orbital eigenvalue calculations. J. Phys. Chem. 2007, 111, 1554–1561. [Google Scholar] [CrossRef]
- Daina, A.; Michielin, O.; Zoete, V. SwissADME: A free web tool to evaluate pharmacokinetics, drug-likeness and medicinal chemistry friendliness of small molecules. Sci. Rep. 2017, 7, 42717. [Google Scholar] [CrossRef] [Green Version]
- Lipinski, C.A.; Lombardo, F.; Dominy, B.W.; Feeney, P.J. Experimental and computational approaches to estimate solubility and permeability in drug discovery and development settings. Adv. Drug Deliv. Rev. 2001, 46, 3–26. [Google Scholar] [CrossRef]
- Yin, S.Y.; Wei, W.C.; Jian, F.Y.; Yang, N.S. Therapeutic applications of herbal medicines for cancer patients. Evid. Based Complement. Alternat. Med. 2013, 2013, 302426. [Google Scholar] [CrossRef]
- Oliveira, C.R.; Spindola, D.G.; Garcia, D.M.; Erustes, A.; Bechara, A.; Palmeira-dos-Santos, C.; Smaili, S.S.; Pereira, G.J.; Hinsberger, A.; Viriato, E.P.; et al. Medicinal properties of Angelica archangelica root extract: Cytotoxicity in breast cancer cells and its protective effects against in vivo tumor development. J. Integr. Med. 2019, 17, 132–140. [Google Scholar] [CrossRef] [PubMed]
- Pandey, A.; Bigoniya, P.; Raj, V.; Patel, K.K. Pharmacological screening of Coriandrum sativum Linn. for hepatoprotective activity. J. Pharm. Bioallied Sci. 2011, 3, 435–441. [Google Scholar] [CrossRef] [PubMed]
- Al-Snafi, P.D.A.E. A review on chemical constituents and pharmacological activities of Coriandrum sativum. IOSR J. Pharm. 2016, 6, 17–42. [Google Scholar] [CrossRef]
- Wang, W.; Xue, J.; Tian, T.; Jiao, Y.; Li, Y. The first asymmetric total synthesis of (+)-coriandrone A and B. Org. Bioml. Chem. 2013, 11, 6686–6690. [Google Scholar] [CrossRef] [PubMed]
- Chaudhary, S.K.; Warrington, P.; Ashwood-smith, M.J.; Bushnell, G.W.; Poulton, G.A. Coriandrin, a novel highly photoactive compound isolated from Coriandrum sativum. Phytochemistry 1988, 27, 2083–2087. [Google Scholar] [CrossRef]
- Ashwood-Smith, M.J.; Warrington, P.J.; Jenkins, M.; Ceska, O.; Romaniuk, P.J. Photobiological properties of a novel, naturally occurring furoisocoumarin, coriandrin. Photochem. Photobiol. 1989, 50, 745–751. [Google Scholar] [CrossRef]
- Begnami, A.F.; Spindola, H.M.; Ruiz, A.L.T.G.; de Carvalho, J.E.; Groppo, F.C.; Rehder, V.L.G. Antinociceptive and anti-edema properties of the ethyl acetate fraction obtained from extracts of Coriandrum sativum Linn. leaves. Biomed. Pharmacother. 2018, 103, 1617–1622. [Google Scholar] [CrossRef]
- Chithra, V.; Leelamma, S. Coriandrum sativum-effect on lipid metabolism in 1,2-dimethyl hydrazine induced colon cancer. J. Ethnopharmacol. 2000, 71, 457–463. [Google Scholar] [CrossRef]
- Ramadan, M.F.; Kroh, L.W.; Mörsel, J.T. Radical scavenging activity of black cumin (Nigella sativa L.), coriander (Coriandrum sativum L.), and niger (Guizotia abyssinica Cass.) crude seed oils and oil fractions. J. Agric. Food Chem. 2003, 51, 6961–6969. [Google Scholar] [CrossRef]
- Kačániová, M.; Galovičová, L.; Ivanišová, E.; Vukovic, N.L.; Štefániková, J.; Valková, V.; Borotová, P.; Žiarovská, J.; Terentjeva, M.; Felšöciová, S.; et al. Antioxidant, antimicrobial and antibiofilm activity of coriander (Coriandrum sativum L.) essential oil for its application in foods. Foods 2020, 9, 282. [Google Scholar] [CrossRef] [Green Version]
- Demir, S.; Korukluoglu, M.A. Comparative study about antioxidant activity and phenolic composition of cumin (Cuminum cyminum L.) and Coriander (Coriandrum sativum L.). Indian J. Tradit. 2020, 19, 383–393. [Google Scholar]
- Donega, M.A.; Mello, S.C.; Moraes, R.M.; Jain, S.K.; Tekwani, B.L.; Cantrell, C.L. Pharmacological activities of cilantro’s aliphatic aldehydes against Leishmania donovani. Planta Med. 2014, 80, 1706–1711. [Google Scholar] [CrossRef] [PubMed]
- Hajlaoui, H.; Arraouadi, S.; Noumi, E.; Aouadi, K.; Adnan, M.; Khan, M.A.; Kadri, A.; Snoussi, M. Antimicrobial, antioxidant, anti-acetylcholinesterase, antidiabetic, and pharmacokinetic properties of Carum carvi L. and Coriandrum sativum L. essential oils alone and in combination. Molecules 2021, 26, 3625. [Google Scholar] [CrossRef] [PubMed]
- Martinou, J.C.; Youle, R.J. Mitochondria in Apoptosis: Bcl-2 Family Members and Mitochondrial Dynamics. Dev. Cell. 2011, 21, 92–101. [Google Scholar] [CrossRef] [PubMed] [Green Version]
- Caputo, L.; Souza, L.F.; Alloisio, S.; Cornara, L.; De Feo, V. Coriandrum sativum and Lavandula angustifolia Essential Oils: Chemical Composition and Activity on Central Nervous System. Int. J. Mol. Sci. 2016, 17, 1999. [Google Scholar] [CrossRef] [PubMed] [Green Version]
- Mechchate, H.; Es-Safi, I.; Amaghnouje, A.; Boukhira, S.; AAlotaibi, A.; Al-Zharani, M.; ANasr, F.; MNoman, O.; Conte, R.; Amal, E.H.; et al. Antioxidant, anti-inflammatory and antidiabetic proprieties of LC-MS/MS identified polyphenols from coriander seeds. Molecules 2021, 26, 487. [Google Scholar] [CrossRef]
- Sathya, K.; Saravanathamizhan, R.; Baskar, G. Ultrasonic assisted green synthesis of Fe and Fe/Zn bimetallic nanoparticles for in vitro cytotoxicity study against HeLa cancer cell line. Mol. Biol. Rep. 2018, 45, 1397–1404. [Google Scholar] [CrossRef]
- Sacan, A.; Ekins, S.; Kortagere, S. Applications and limitations of in silico models in drug discovery. Methods Mol. Biol. 2012, 910, 87–124. [Google Scholar] [CrossRef]
- Choi, S.M.; Kang, C.Y.; Lee, B.J.; Park, J.B. In Vitro-In Vivo Correlation Using in Silico Modeling of Physiological Properties, Metabolites, and Intestinal Metabolism. Curr Drug Metab. 2017, 18, 973–982. [Google Scholar] [CrossRef]
- National Health Surveillance Agency. Brazilian Pharmacopoeia, 6th ed.; National Health Surveillance Agency: Brasília, Brazil, 2017. [Google Scholar]
- Abubakar, A.R.; Haque, M. Preparation of Medicinal Plants: Basic Extraction and Fractionation Procedures for Experimental Purposes. J. Pharm. Bioallied Sci. 2020, 12, 1–10. [Google Scholar] [CrossRef]
- Archilia, M.D.; Lagareiro Neto, A.A.; Marcucci, M.C.; Alonso, R.C.B.; De Camargo, T.C.; Camargo, R.C.; Sawaya, A.C.H.F. Characterization of Brazilian monofloral and polyfloral honey by UHPLC-MS and classic physical-chemical analyses. J. Apic. Res. 2021. [Google Scholar] [CrossRef]
- Marcucci, M.C.; Oliveira, L.F.A.M.; Gonçalves, C.P.; De Carvalho, C. UV-Vis spectroscopy and DPPH radical reaction for the detection of flavonoids and determination of the antioxidant potential of propolis extracts. Rev. Eletrôn. Ciên. Exatas 2020, 1, 1–9. [Google Scholar]
- Marcucci, M.C.; Salatino, A.; Oliveira, L.F.A.M.; Gonçalves, C.P. Accessible methodologies for quantification of flavonoids and total phenols in propolis. Rev. Virtual Quim. 2021, 13, 61–73. [Google Scholar] [CrossRef]
- Carvalho, A.C.; Rodrigues, L.C.; Ribeiro, A.L.; Silva, M.F.D.G.F.; Medeiros, L.S.; Veiga, T.A.M. Integrated analytical tools for accessing acridones and unrelated phenylacrylamides from Swinglea glutinosa. Molecules 2019, 25, 153. [Google Scholar] [CrossRef] [PubMed] [Green Version]
- Wang, M.; Carver, J.J.; Phelan, V.V.; Sanchez, L.M.; Garg, N.; Peng, Y.; Nguyen, D.D.; Watrous, J.; Kapono, C.A.; Luzzatto-Knaan, T.; et al. Sharing and community curation of mass spectrometry data with Global Natural Products Social Molecular Networking. Nat. Biotechnol. 2016, 34, 828–837. [Google Scholar] [CrossRef] [Green Version]
- Wei, J.N.; Liu, Z.H.; Zhao, Y.P.; Zhao, L.L.; Xue, T.K.; Lan, Q.K. Phytochemical and bioactive profile of Coriandrum sativum L. Food Chem. 2019, 15, 260–267. [Google Scholar] [CrossRef]
- Song, X.; Nie, F.; Chen, W.; Ma, X.; Gong, K.; Yang, Q.; Wang, J.; Li, N.; Sun, P.; Pei, Q.; et al. Coriander Genomics Database: A genomic, transcriptomic, and metabolic database for coriander. Hortic. Res. 2020, 7, 55. [Google Scholar] [CrossRef] [Green Version]
- Veiga, R.S.; De Mendonça, S.; Mendes, P.B.; Paulino, N.; Mimica, M.J.; Lagareiro Netto, A.A.; Lira, I.S.; Lopez, B.G.-C.; Negrão, V.; Marcucci, M.C. Artepillin-C and phenolic compounds responsible for antimicrobial and antioxidant activity of green propolis and Baccharis dracunculifolia DC. J. Appl. Microbiol. 2017, 122, 911–920. [Google Scholar] [CrossRef]
- Mosmann, T. Rapid colorimetric assay for cellular growth and survival: Application to proliferation and cytotoxicity assays. J. Immunol. Methods 1983, 65, 55–63. [Google Scholar] [CrossRef]
- Martínez, M.A.; Rodríguez, J.L.; Lopez-Torres, B.; Martínez, M.; Martínez-Larrañaga, M.R.; Maximiliano, J.E.; Anadón, A.; Ares, I. Use of human neuroblastoma SH-SY5Y cells to evaluate glyphosate-induced effects on oxidative stress, neuronal development. Environ. Int. 2020, 135, 105414. [Google Scholar] [CrossRef]
- Lima, C.S.; Spindola, D.G.; Bechara, A.; Garcia, D.M.; Palmeira-Dos-Santos, C.; Peixoto-da-Silva, J.; Erustes, A.G.; Michelin, L.F.G.; Pereira, G.J.S.; Smaili, S.S.; et al. Cafestol, a diterpene molecule found in coffee, induces leukemia cell death. Biomed. Pharmacother. 2017, 92, 1045–1054. [Google Scholar] [CrossRef] [PubMed]
- Spindola, D.G.; Hinsberger, A.; Antunes, V.M.; Michelin, L.F.; Bincoletto, C.; Oliveira, C.R. In vitro cytotoxicity of chemical preservatives on human fibroblast cells. Braz. J. Pharm. Sci. 2018, 54, 1. [Google Scholar] [CrossRef]


| Test | g/100 mL | CV (%) |
|---|---|---|
| Soluble solids | 0.487 ± 0.007 | 7.40 |
| Total phenolic content | 2.057 ± 0.017 | 0.82 |
| Total flavonoid content | 1.079 ± 0.013 | 1.21 |
| RT [min] | UV-Vis [nm] | Compound Name (N) * | NMF * | m/z-Experimental [M + H]+ | m/z-Calculated [M + H]+ | Δ; Err [ppm] | mSigma | MS2 (%) |
|---|---|---|---|---|---|---|---|---|
| 0.7 | 201; 229; 262 | adenine (1) | C5H5N5 | 136.0614 | 136.0618 | 2.4 | 8.3 | - |
| adenosine (2) | C10H13N5O4 | 268.1044 | 268.1040 | −1.5 | 23.1 | 136.0622 (100); 137.0607 (9.2); 119.0414 (5.3) | ||
| 0.9 | 190 | tryptophan (3) | C11H12N2O2 | 205.0966 | 205.0972 | 2.6 | 11.7 | 91.0550 (100) |
| 2.3 | 190; 256; 303; 349 | quercetin | C15H10O7 | 303.0508 | 303.0499 | −2.7 | 10.2 | - |
| hyperoside | C21H20O12 | 465.1020 | 465.1028 | 1.6 | 35.3 | 86.0956 (100) | ||
| Rutin | C27H30O16 | 611.1596 | 611.1607 | 1.8 | 31.1 | 303.0486 (100); 85.0283 (14.5) | ||
| 3.8 | 190; 232 | apigenin | C15H10O5 | 271.0606 | 271.0601 | −1.9 | 32.8 | 243.9555 (100) |
| 5.4 | 217.5 | coriandrone A | C16H20O5 | 293.1391 | 293.1384 | −2.4 | 5.2 | 203.0710 (100); 221.0808 (80.1); 173.0602 (51.4); 191.0693 (25.1) |
| 5.8 | 225; 266; 307 | coriandrone B (4) | C16H20O5 | 293.1400 | 239.1384 | −5.8 | 4.1 | 203.0716 (100); 215.0698 (77.8); 187.0758 (58.7); 173.0598 (56.3) |
| 5.9 | 229 | dihydrocoriandrin (5) | C13H12O4 | 233.0820 | 233.0808 | −4.9 | 18.1 | 129.0700 (100); 187.0742 (98.4); 172.0525 (76.7); 200.0466 (71.2); 159.0808 (40.1); 144.0581 (36.7) |
| 6.5 | 190; 248; 286; 298; 343 | coriandrin (6) | C13H10O4 | 253.0474 ** | 253.0471 ** | −1.0 | 16.5 | 93.0721 (100); 81.0750 (71.2); 107.0799 (70.5) |
| 8.4 | 190 | monolinolenin | C21H36O4 | 353.2686 | 353.2686 | 0 | 2.3 | 93.0714 (100); 81.0689 (87.8); 107.0855 (68.1) |
| 9.3 | 219 | lyso-PC (16:0) | C24H50NO7P | 496.3390 | 496.3398 | 1.5 | 5.4 | 184.0727 (100); 104.1080 (37.7); 86.0953 (36.6); 124.9994 (28.2); |
| 10.3 | 219 | PAF C16 | C26H54NO7P | 524.3679 | 524.3711 | 6.0 | 9.2 | 184.0731 (100); 104.1068 (39.2); 125.0011 (38.2); 86.0962 (29.1) |
| Compound | HOMO (eV) | LUMO (eV) | GAP (eV) * | |
|---|---|---|---|---|
| 1 |  |  | 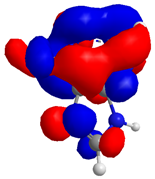 | 4.182218 |
| −8.246172 | −4.063954 | |||
| 2 |  | 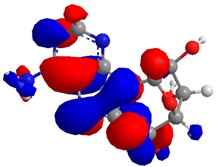 | 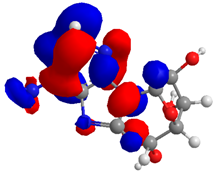 | 3.497648 |
| −6.777479 | −3.279831 | |||
| 3 | 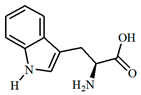 | 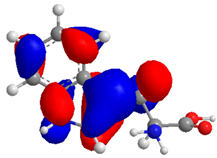 | 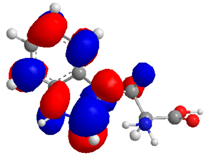 | 6.628958 |
| −10.133024 | −3.504282 | |||
| 4 | 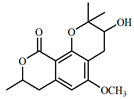 | 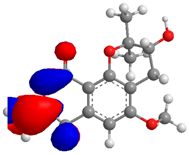 | 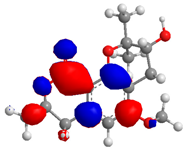 | 5.205865 |
| −8.710147 | −3.504282 | |||
| 5 | 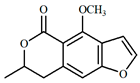 | 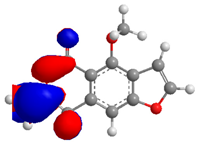 |  | 6.119369 |
| −8.725406 | −2.606037 | |||
| 6 | 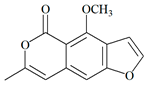 |  |  | 8.691302 |
| −11.434933 | −2.743631 | |||
| Compound | Lipinski Parameter | TPSA (Ų) | LogS | Class | %ABS (%) | Drug Score | ||||
|---|---|---|---|---|---|---|---|---|---|---|
| MW (g/mol) | HBDs | HBAs | iLOGP | nV | ||||||
| 1 | 135.13 | 2 | 3 | 0.42 | 0 | 80.48 | −1.43 | Soluble | 81.23 | 0.55 |
| 2 | 267.24 | 4 | 7 | 0.41 | 0 | 139.54 | −1.05 | Soluble | 60.85 | 0.55 |
| 3 | 204.23 | 3 | 3 | 0.99 | 0 | 79.11 | −0.68 | Soluble | 81.70 | 0.55 |
| 4 | 292.33 | 1 | 5 | 2.71 | 0 | 64.99 | −3.20 | Soluble | 86.57 | 0.55 |
| 5 | 232.23 | 0 | 4 | 2.33 | 0 | 48.67 | −3.26 | Moderate | 92.20 | 0.55 |
| 6 | 230.22 | 0 | 4 | 2.43 | 0 | 52.58 | −3.44 | Moderate | 90.85 | 0.55 |
Publisher’s Note: MDPI stays neutral with regard to jurisdictional claims in published maps and institutional affiliations. |
© 2022 by the authors. Licensee MDPI, Basel, Switzerland. This article is an open access article distributed under the terms and conditions of the Creative Commons Attribution (CC BY) license (https://creativecommons.org/licenses/by/4.0/).
Share and Cite
Marcucci, M.C.; Oliveira, C.R.; Spindola, D.; Antunes, A.A.; Santana, L.Y.K.; Cavalaro, V.; Costa, I.B.; de Carvalho, A.C.; Veiga, T.A.M.; Medeiros, L.S.; et al. Molecular Dereplication and In Vitro and In Silico Pharmacological Evaluation of Coriandrum sativum against Neuroblastoma Cells. Molecules 2022, 27, 5389. https://doi.org/10.3390/molecules27175389
Marcucci MC, Oliveira CR, Spindola D, Antunes AA, Santana LYK, Cavalaro V, Costa IB, de Carvalho AC, Veiga TAM, Medeiros LS, et al. Molecular Dereplication and In Vitro and In Silico Pharmacological Evaluation of Coriandrum sativum against Neuroblastoma Cells. Molecules. 2022; 27(17):5389. https://doi.org/10.3390/molecules27175389
Chicago/Turabian StyleMarcucci, Maria Cristina, Carlos Rocha Oliveira, Daniel Spindola, Alyne A. Antunes, Leila Y. K. Santana, Victor Cavalaro, Isabelle B. Costa, Ana C. de Carvalho, Thiago A. M. Veiga, Livia S. Medeiros, and et al. 2022. "Molecular Dereplication and In Vitro and In Silico Pharmacological Evaluation of Coriandrum sativum against Neuroblastoma Cells" Molecules 27, no. 17: 5389. https://doi.org/10.3390/molecules27175389
APA StyleMarcucci, M. C., Oliveira, C. R., Spindola, D., Antunes, A. A., Santana, L. Y. K., Cavalaro, V., Costa, I. B., de Carvalho, A. C., Veiga, T. A. M., Medeiros, L. S., dos Santos Zamarioli, L., Gonçalves, C. P., Santos, M. F., Grecco, S. S., Suzuki, V. Y., Ferreira, L. M., & Garcia, D. M. (2022). Molecular Dereplication and In Vitro and In Silico Pharmacological Evaluation of Coriandrum sativum against Neuroblastoma Cells. Molecules, 27(17), 5389. https://doi.org/10.3390/molecules27175389