
Walnut Prevents Cognitive Impairment by Regulating the Synaptic and Mitochondrial Dysfunction via JNK Signaling and Apoptosis Pathway in High-Fat Diet-Induced C57BL/6 Mice

 ,
,
Abstract
:
1. Introduction
2. Materials and Methods
2.1. Chemicals
2.2. Sample Preparation
2.3. UPLC Q-TOF/MS
2.4. In Vitro Cells Study
2.4.1. Cell Culture
2.4.2. Neuronal Cell Viability and Intracellular ROS
2.5. Animal Experimental Design
2.6. Glucose Tolerance Test
2.7. Behavioral Tests
2.7.1. Y-Maze Test
2.7.2. Passive Avoidance Test
2.7.3. Morris Water Maze (MWM) Test
2.8. Blood Serum Biochemical
2.9. Preparation of Tissue
2.10. Antioxidant Activity
2.10.1. Malondialdehyde (MDA) Level
2.10.2. Ferric Reducing Antioxidant Power (FRAP) in Serum
2.10.3. AGEs Formation in Serum
2.11. Cerebral Cholinergic System
2.11.1. Acetylcholine (ACh) Level
2.11.2. Acetylcholinesterase (AChE) Activity
2.12. Mitochondrial Activity
2.12.1. Extraction of Mitochondria from Brain Tissues
2.12.2. Mitochondrial ROS Contents
2.12.3. Mitochondrial Membrane Potential
2.13. Western Blot
2.14. Statistical Analysis
3. Results
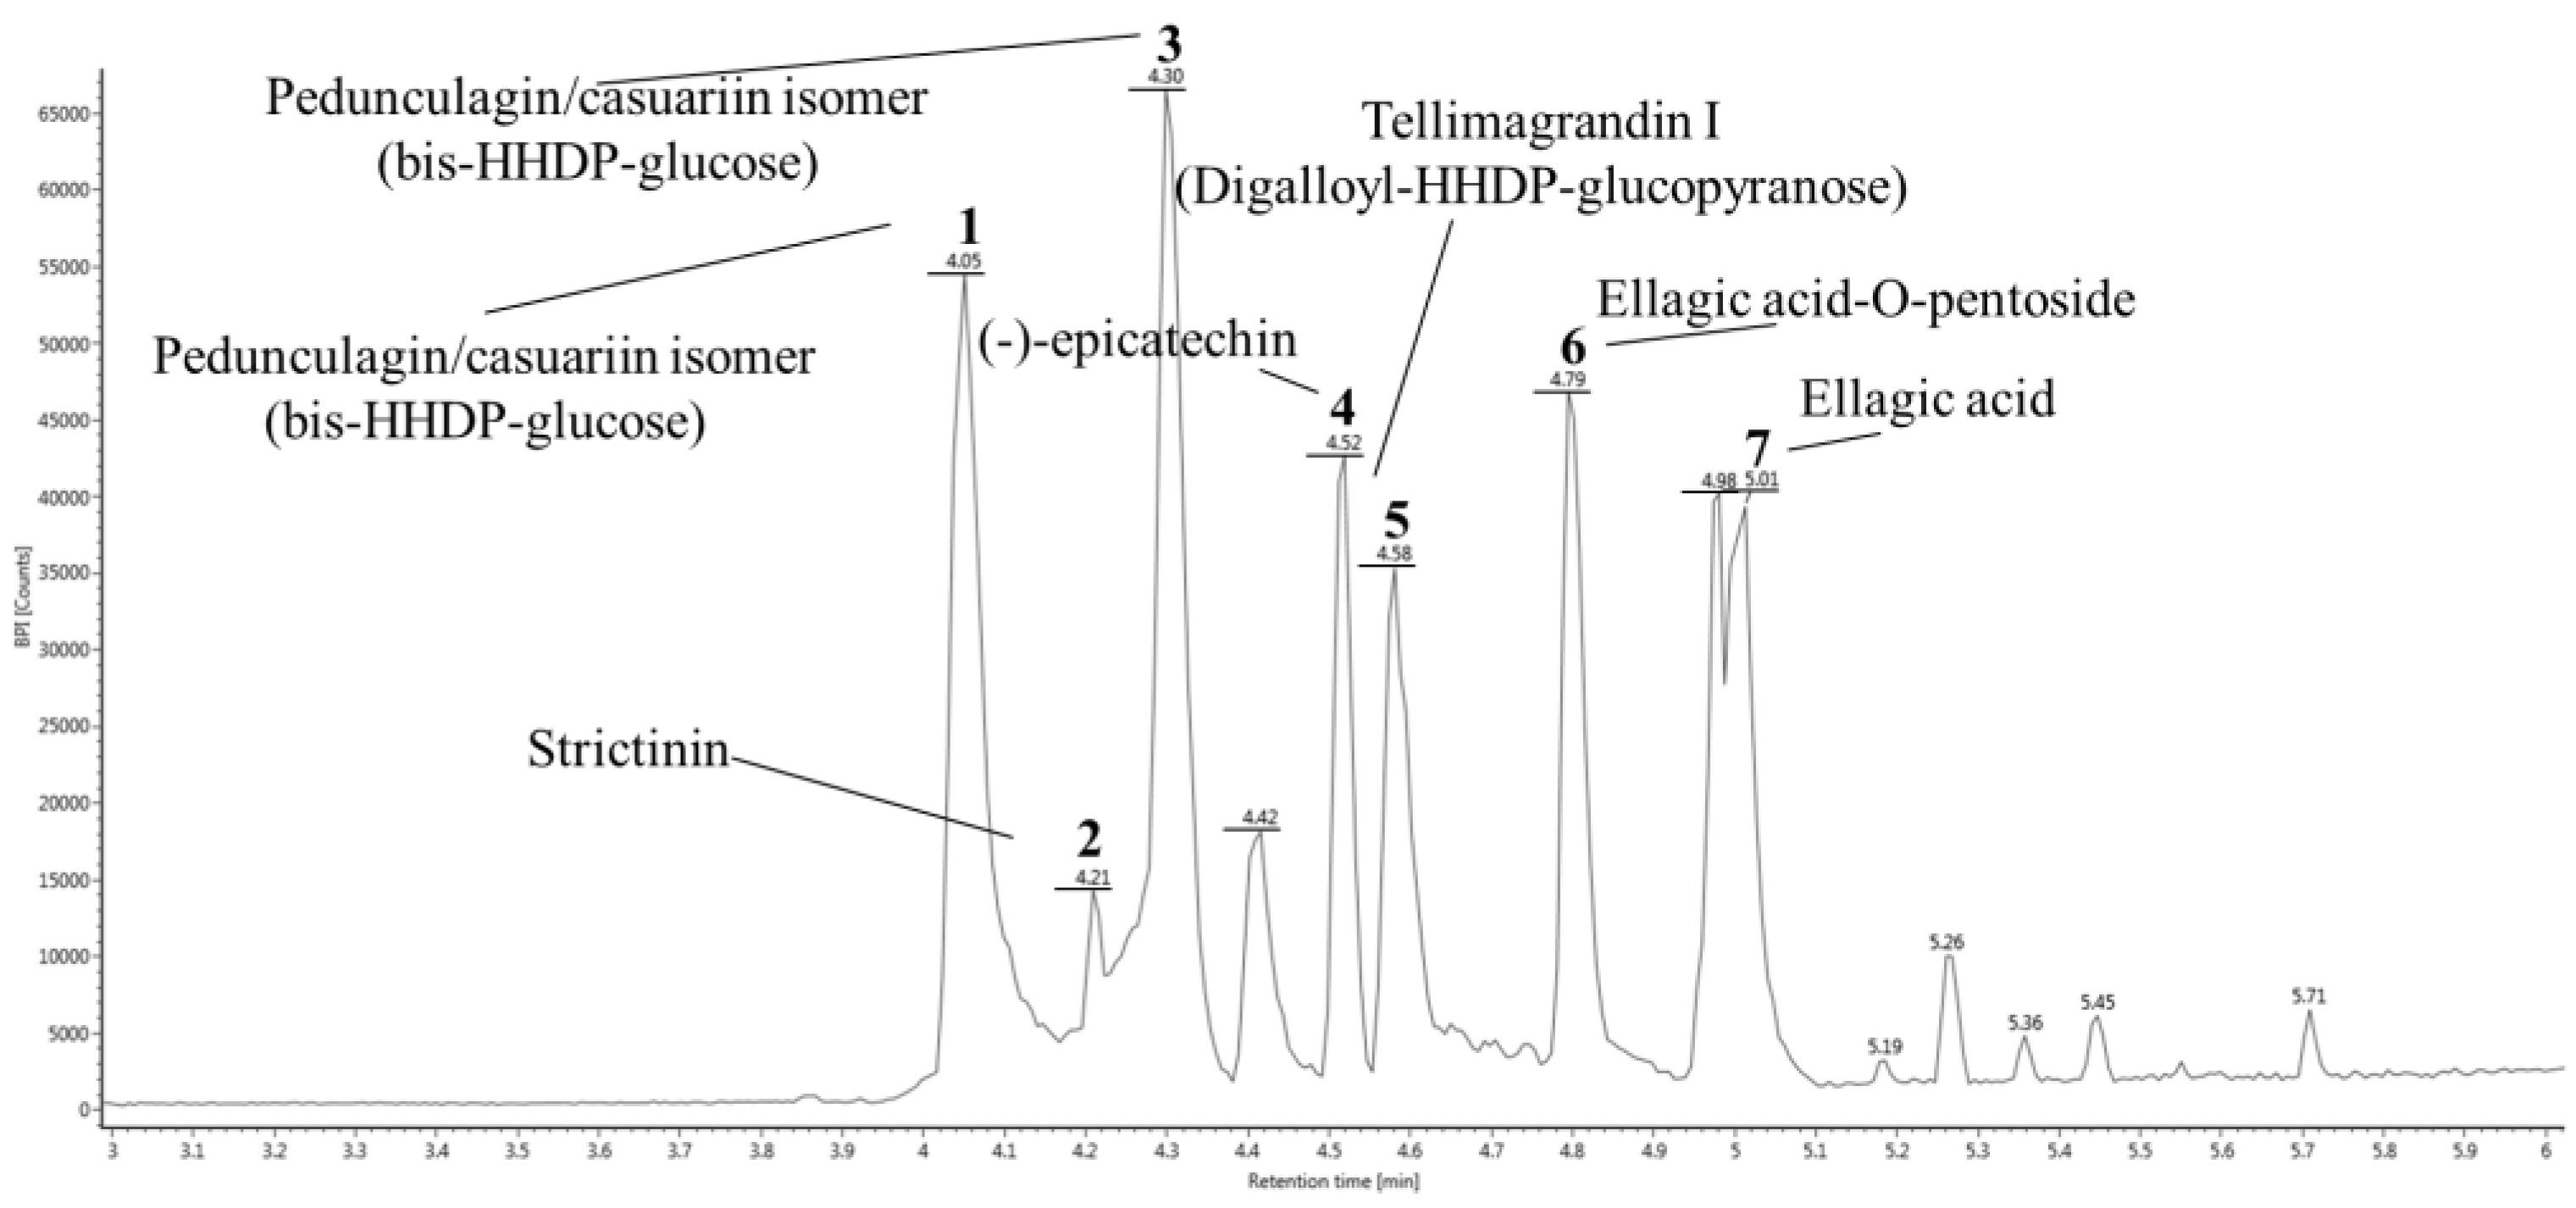
3.1. UPLC Q-TOF/MS
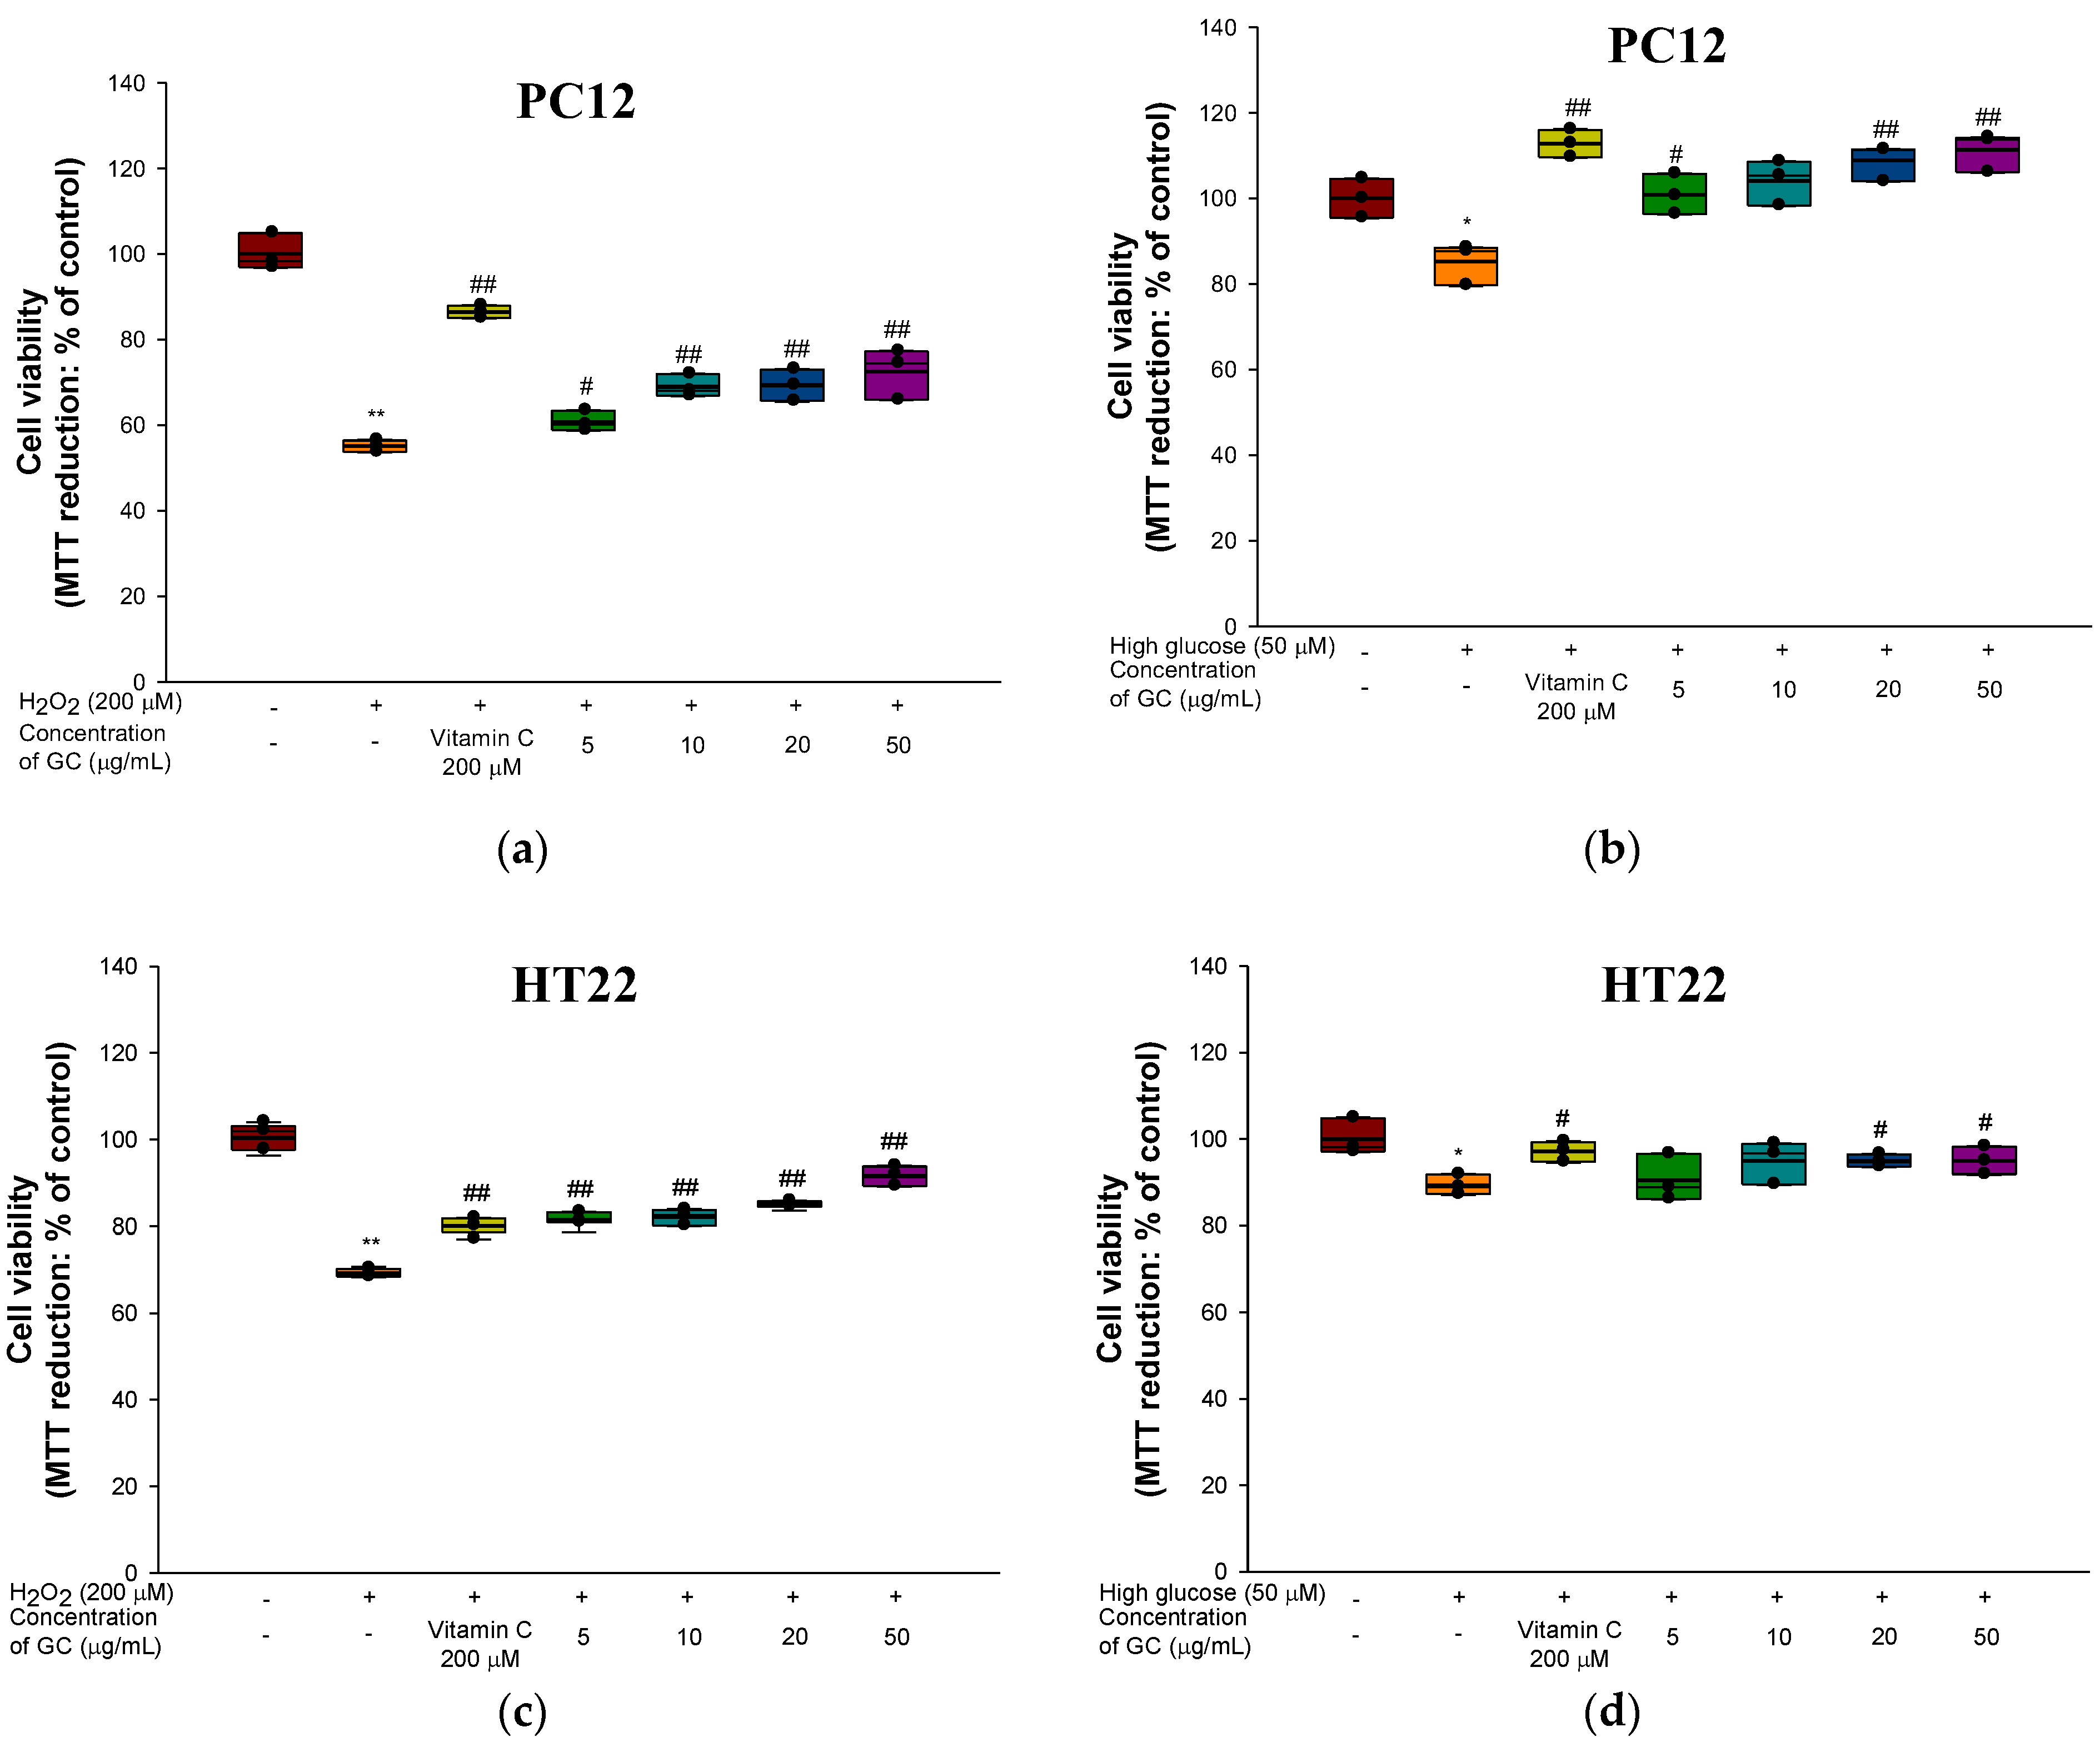
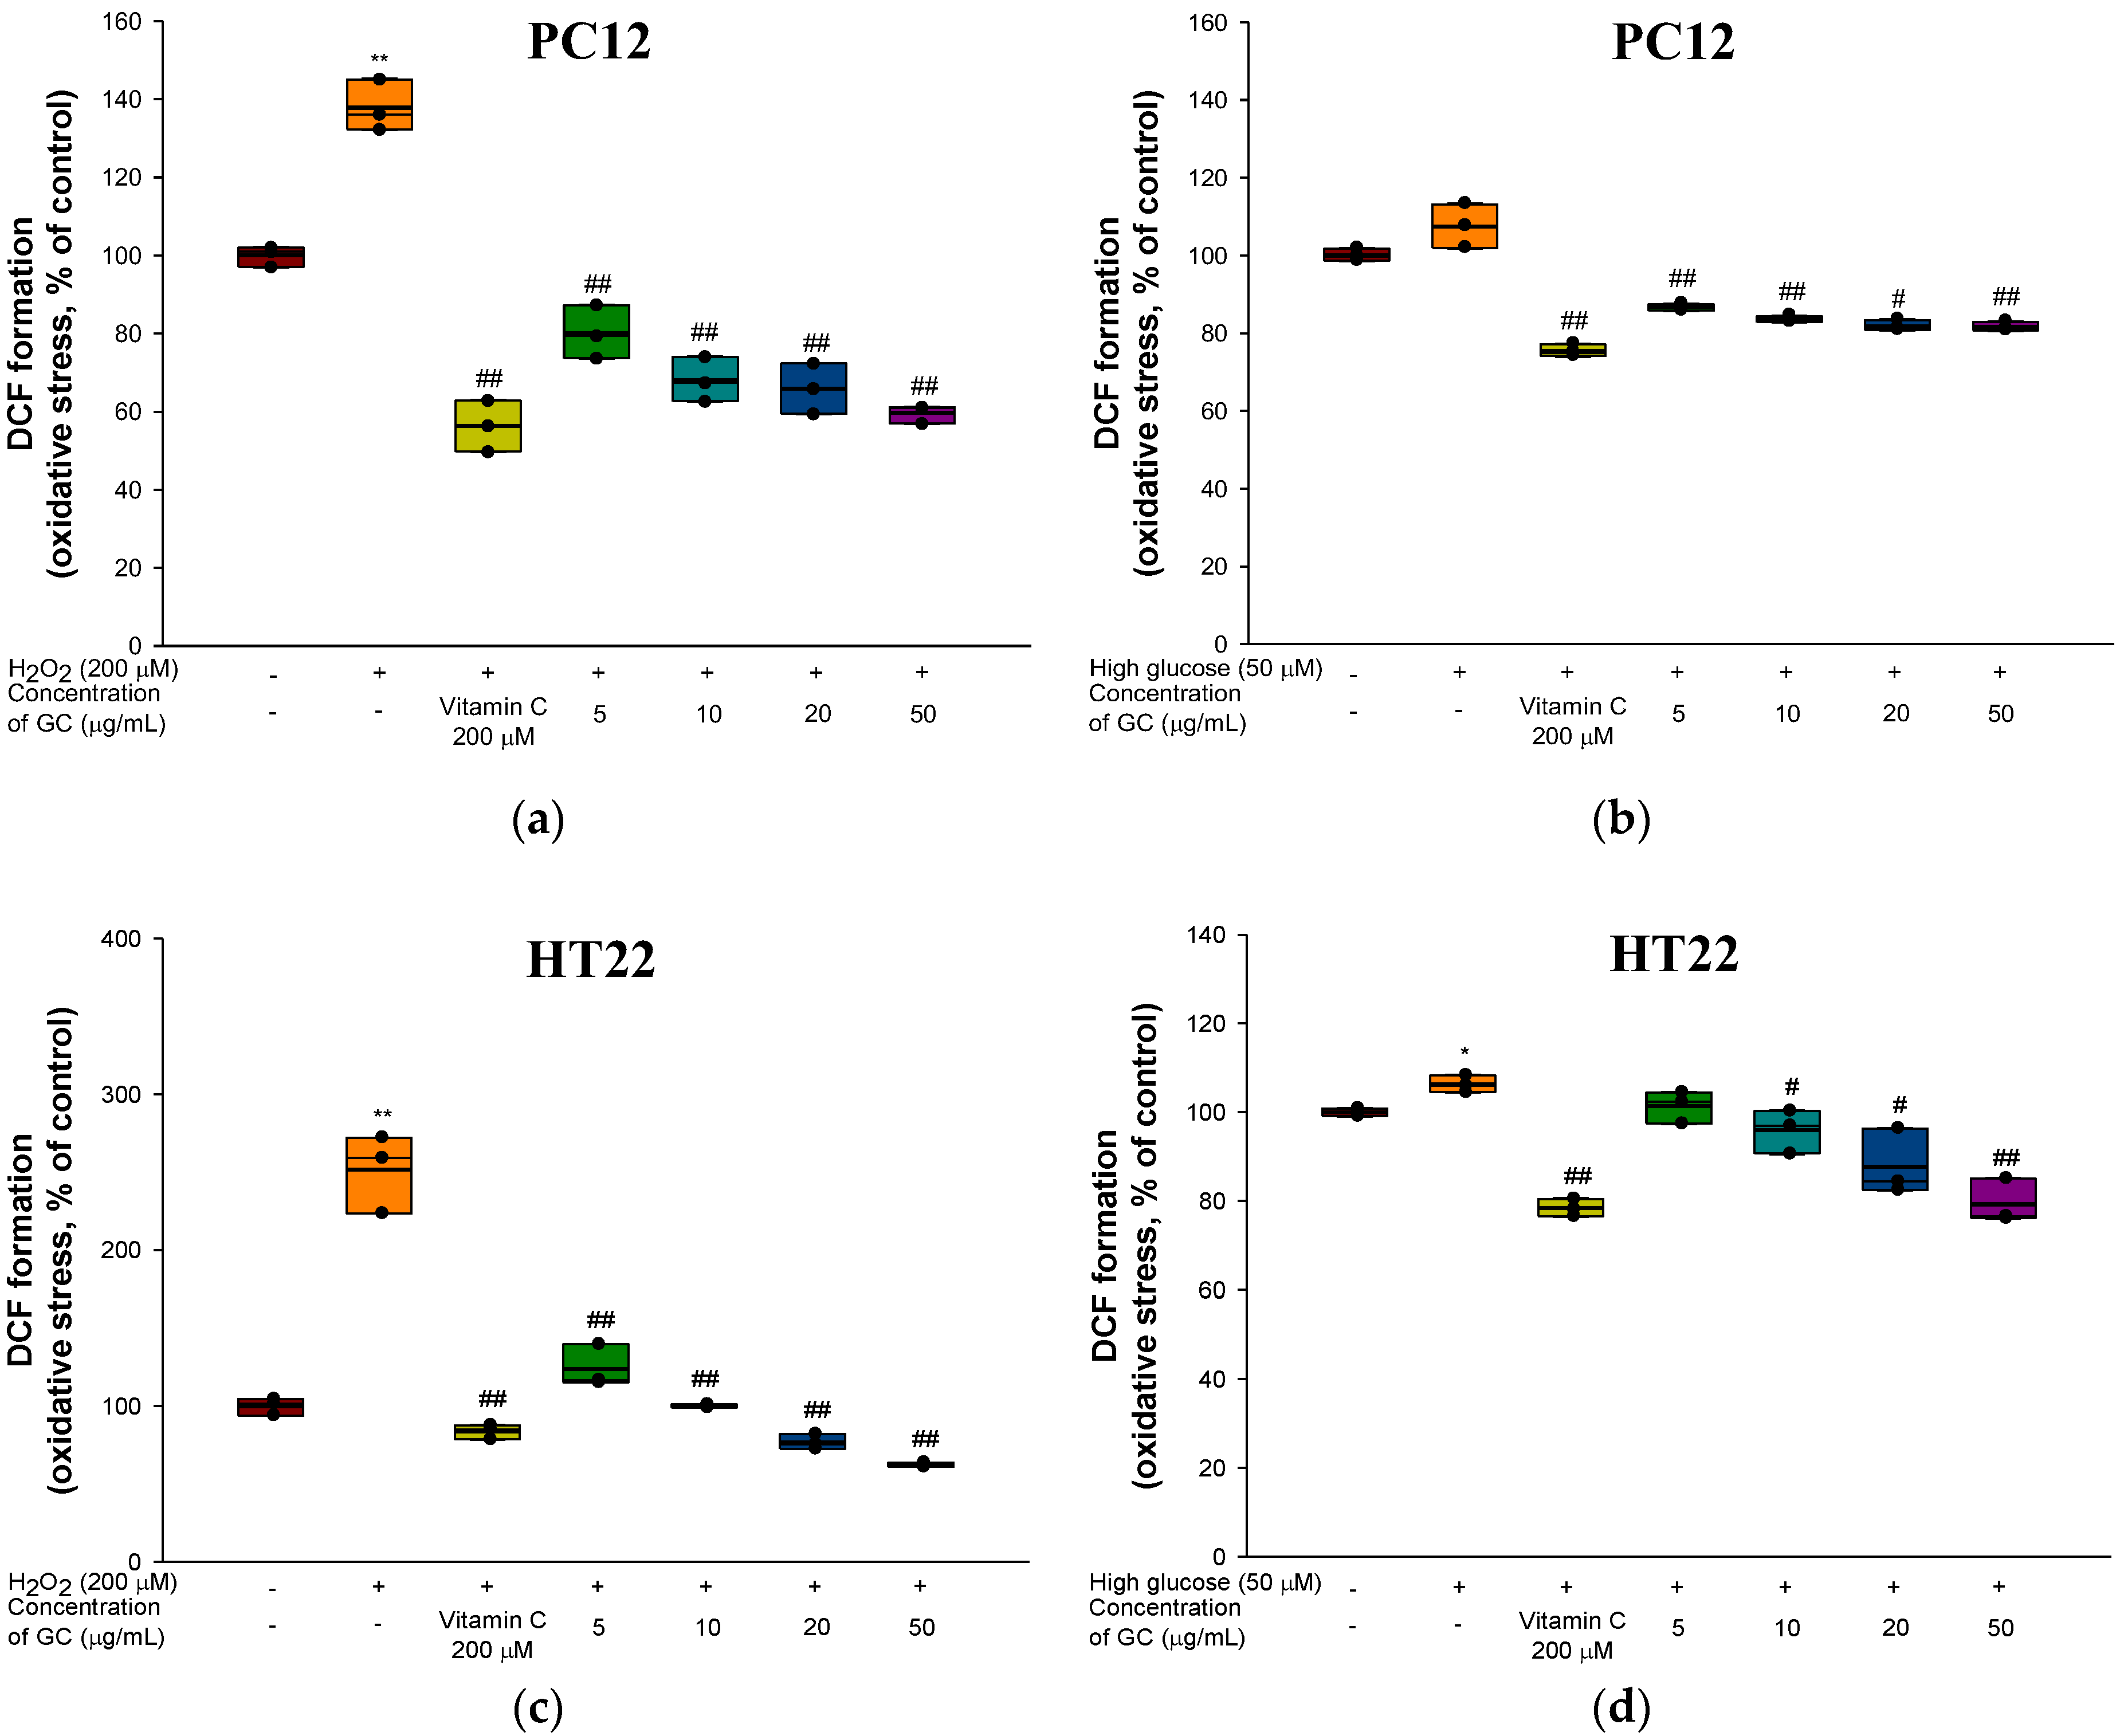
3.2. Protective Effect against H2O2 and High Glucose-induced Neurotoxicity in PC12 and HT22 Cells
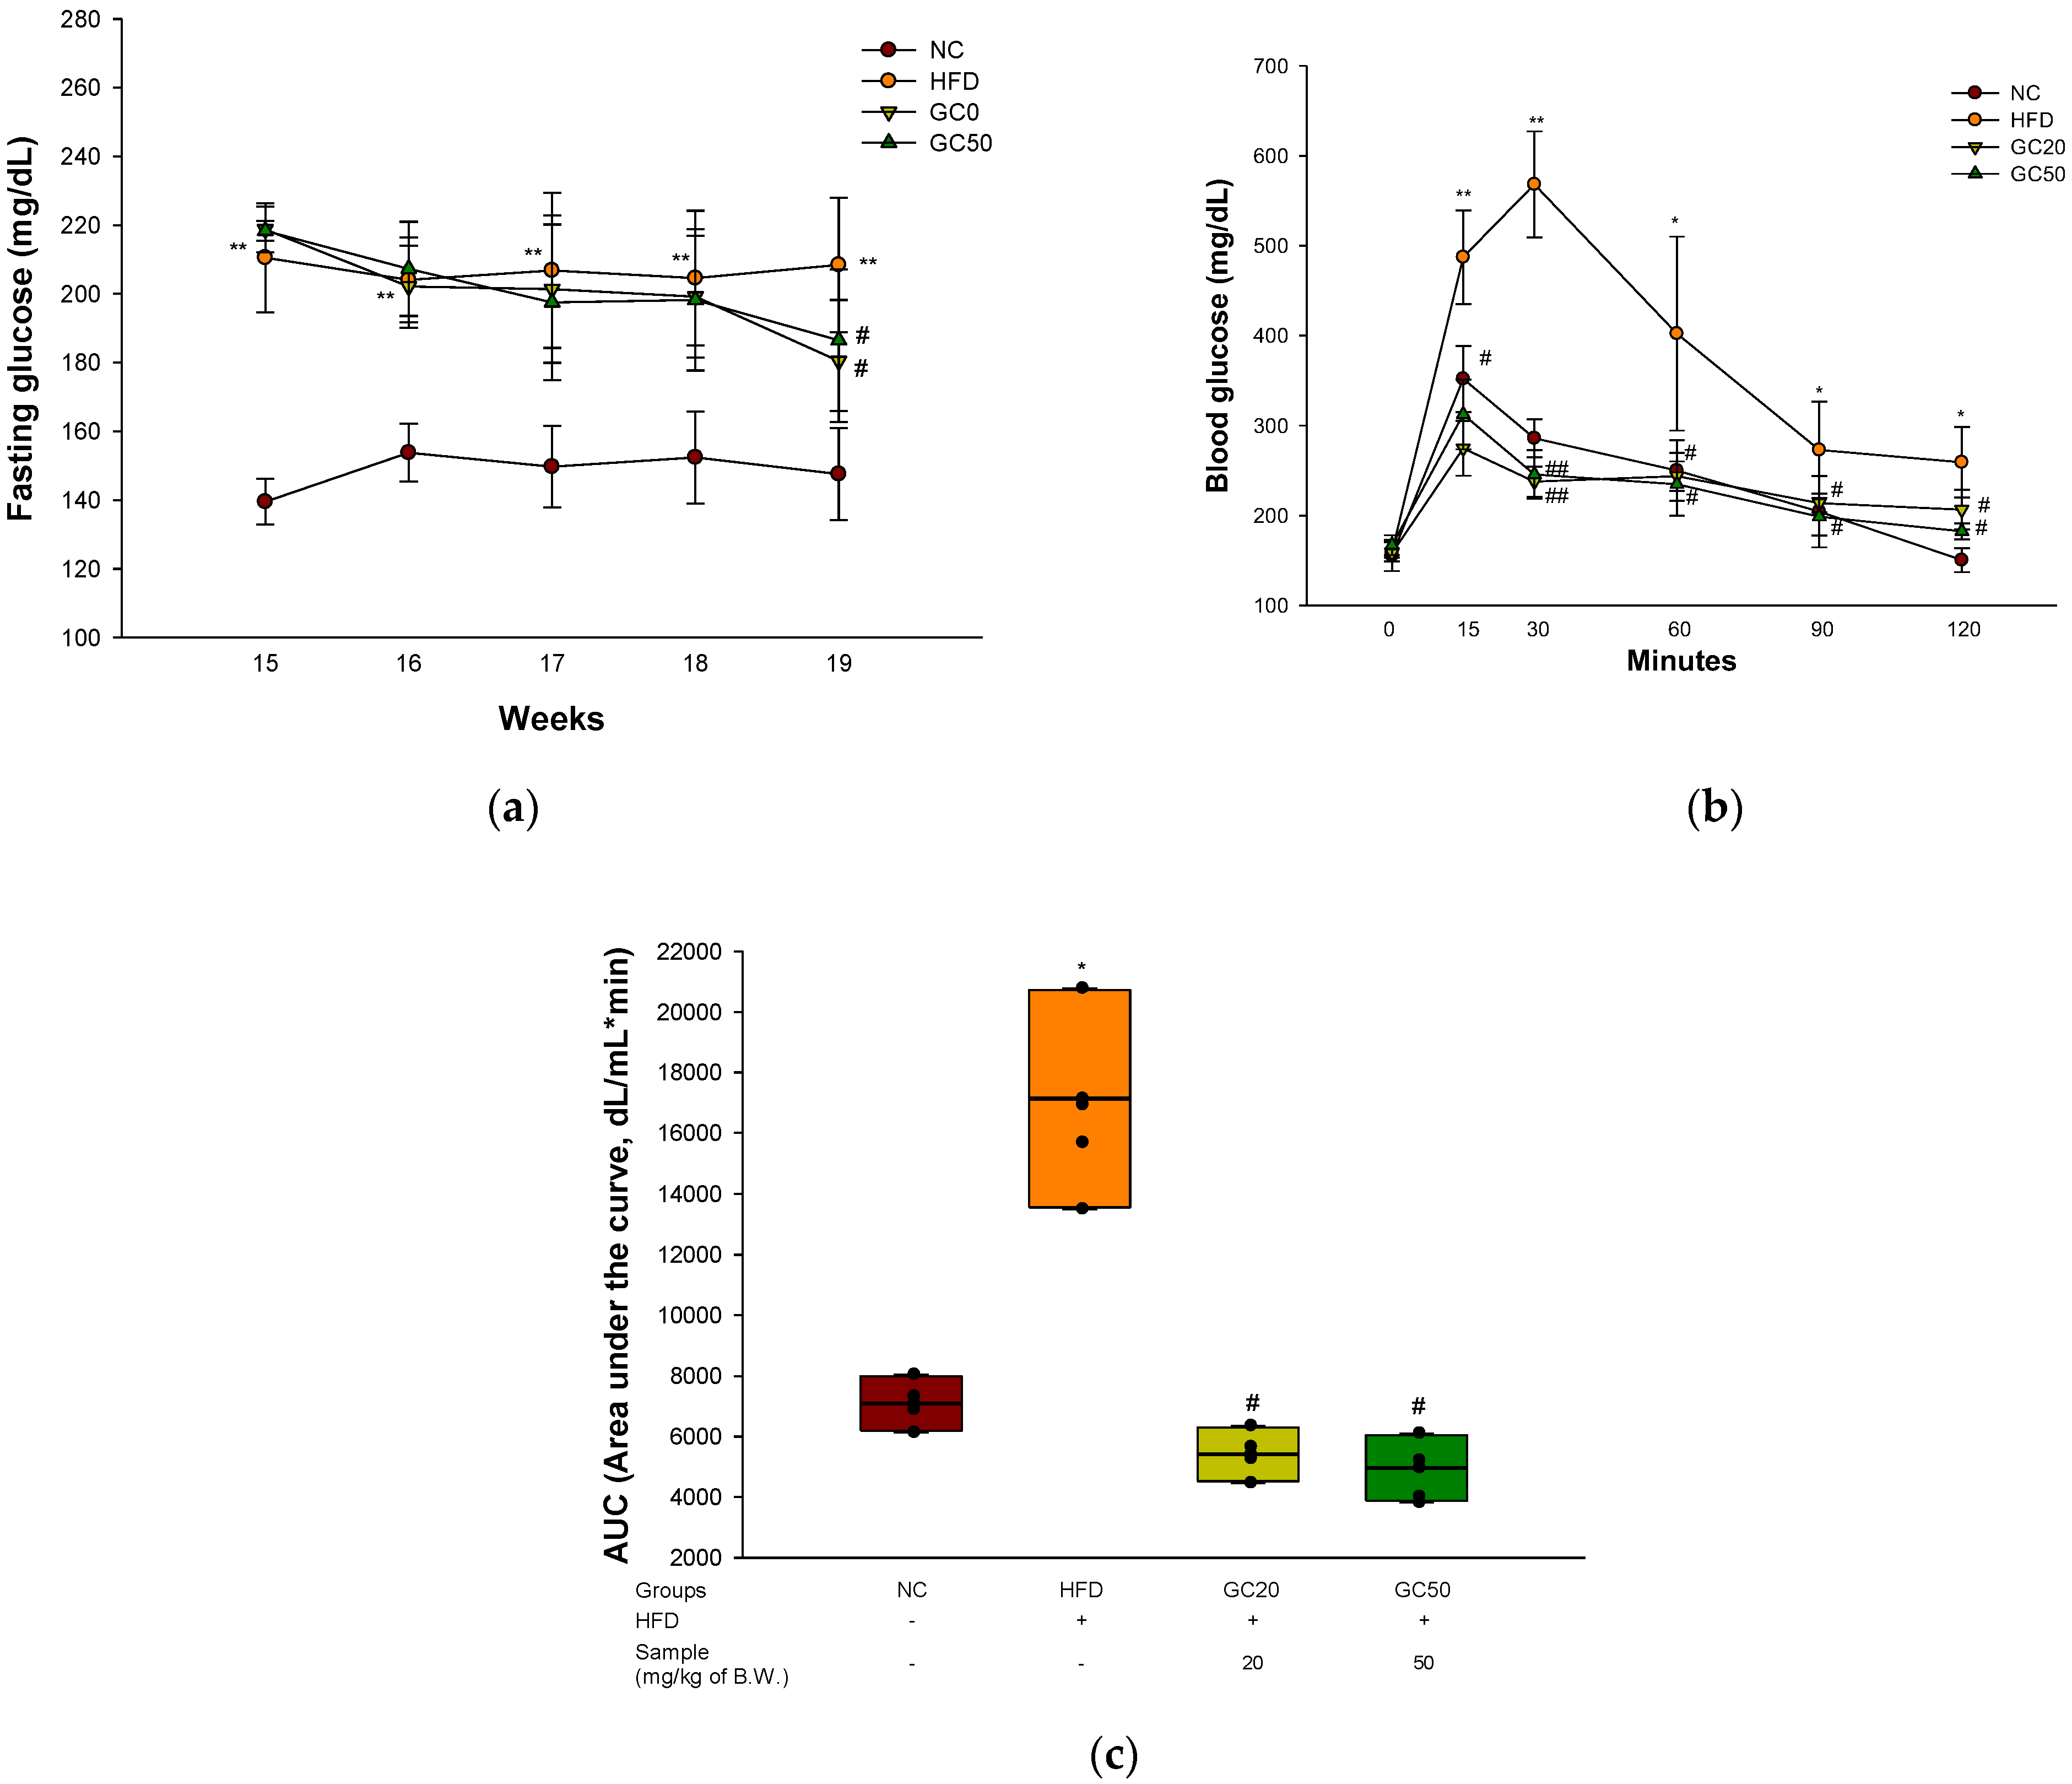
3.3. Glucose Tolerance Test
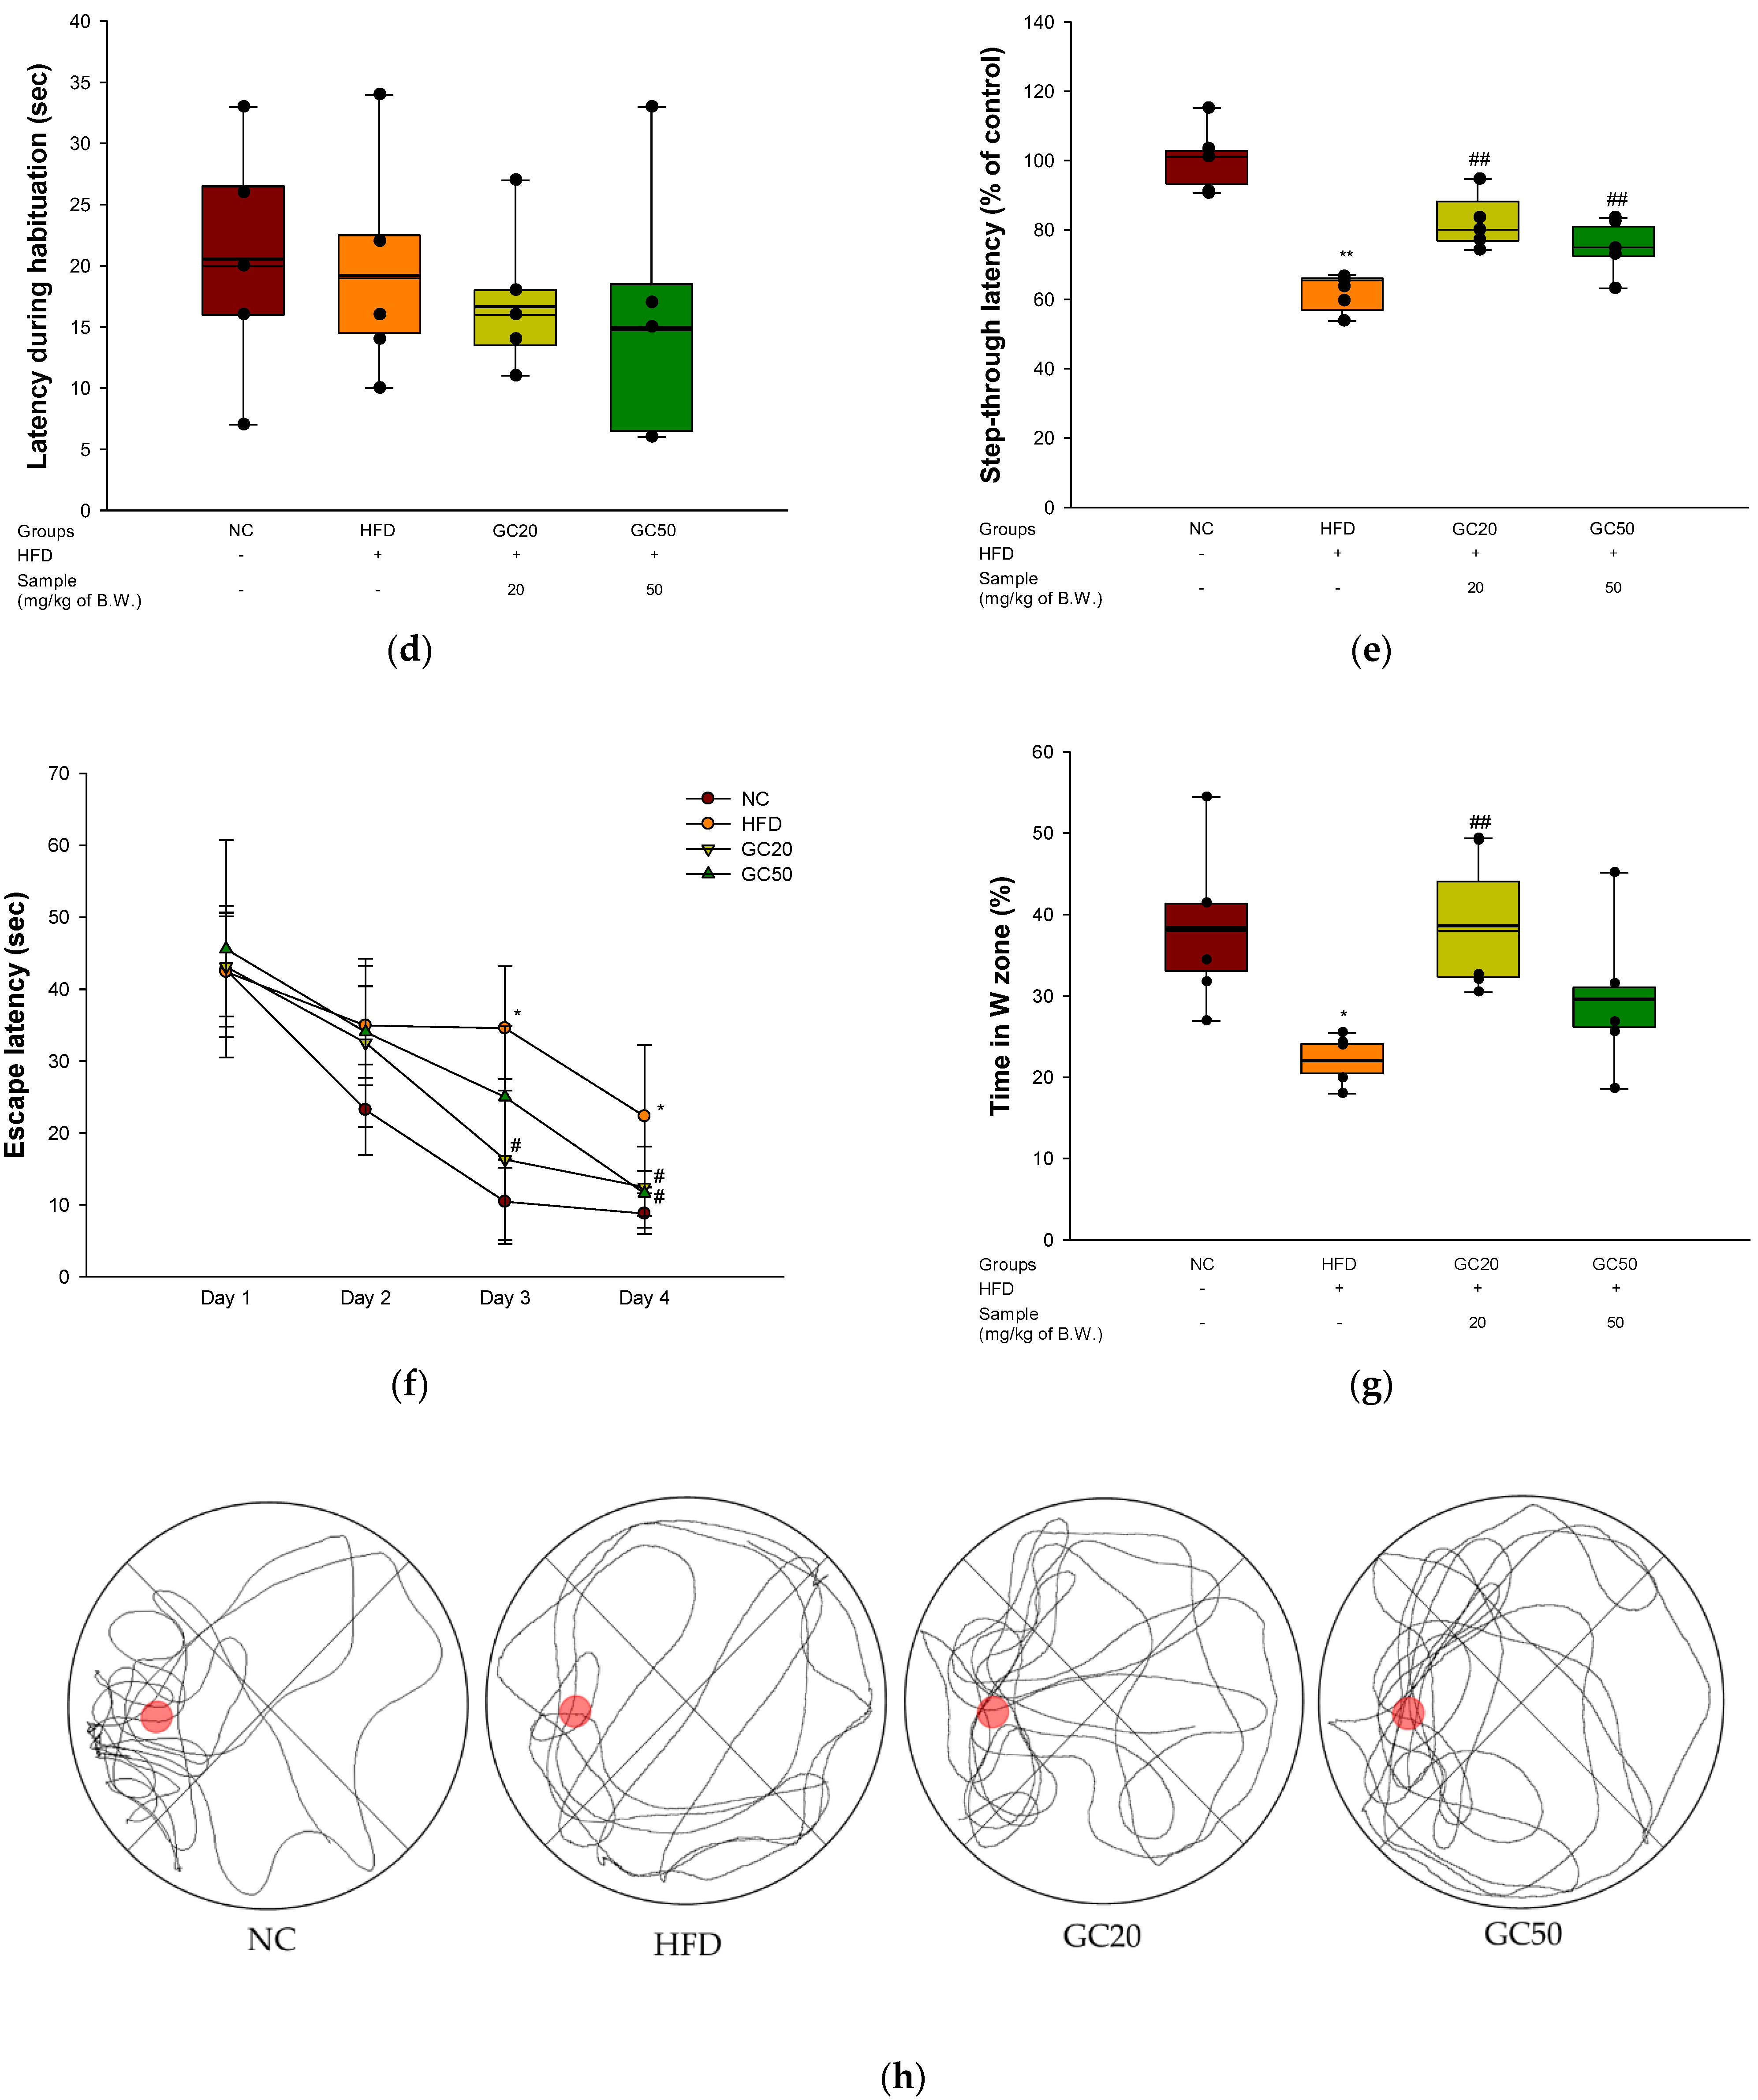
3.4. Behavioral Tests
3.5. Blood Serum Biochemicals and Changes in Weight of Organs
3.5.1. Blood Serum Biochemicals
3.5.2. Changes in Weight of Organs
3.6. Inhibition of Lipid Peroxidation
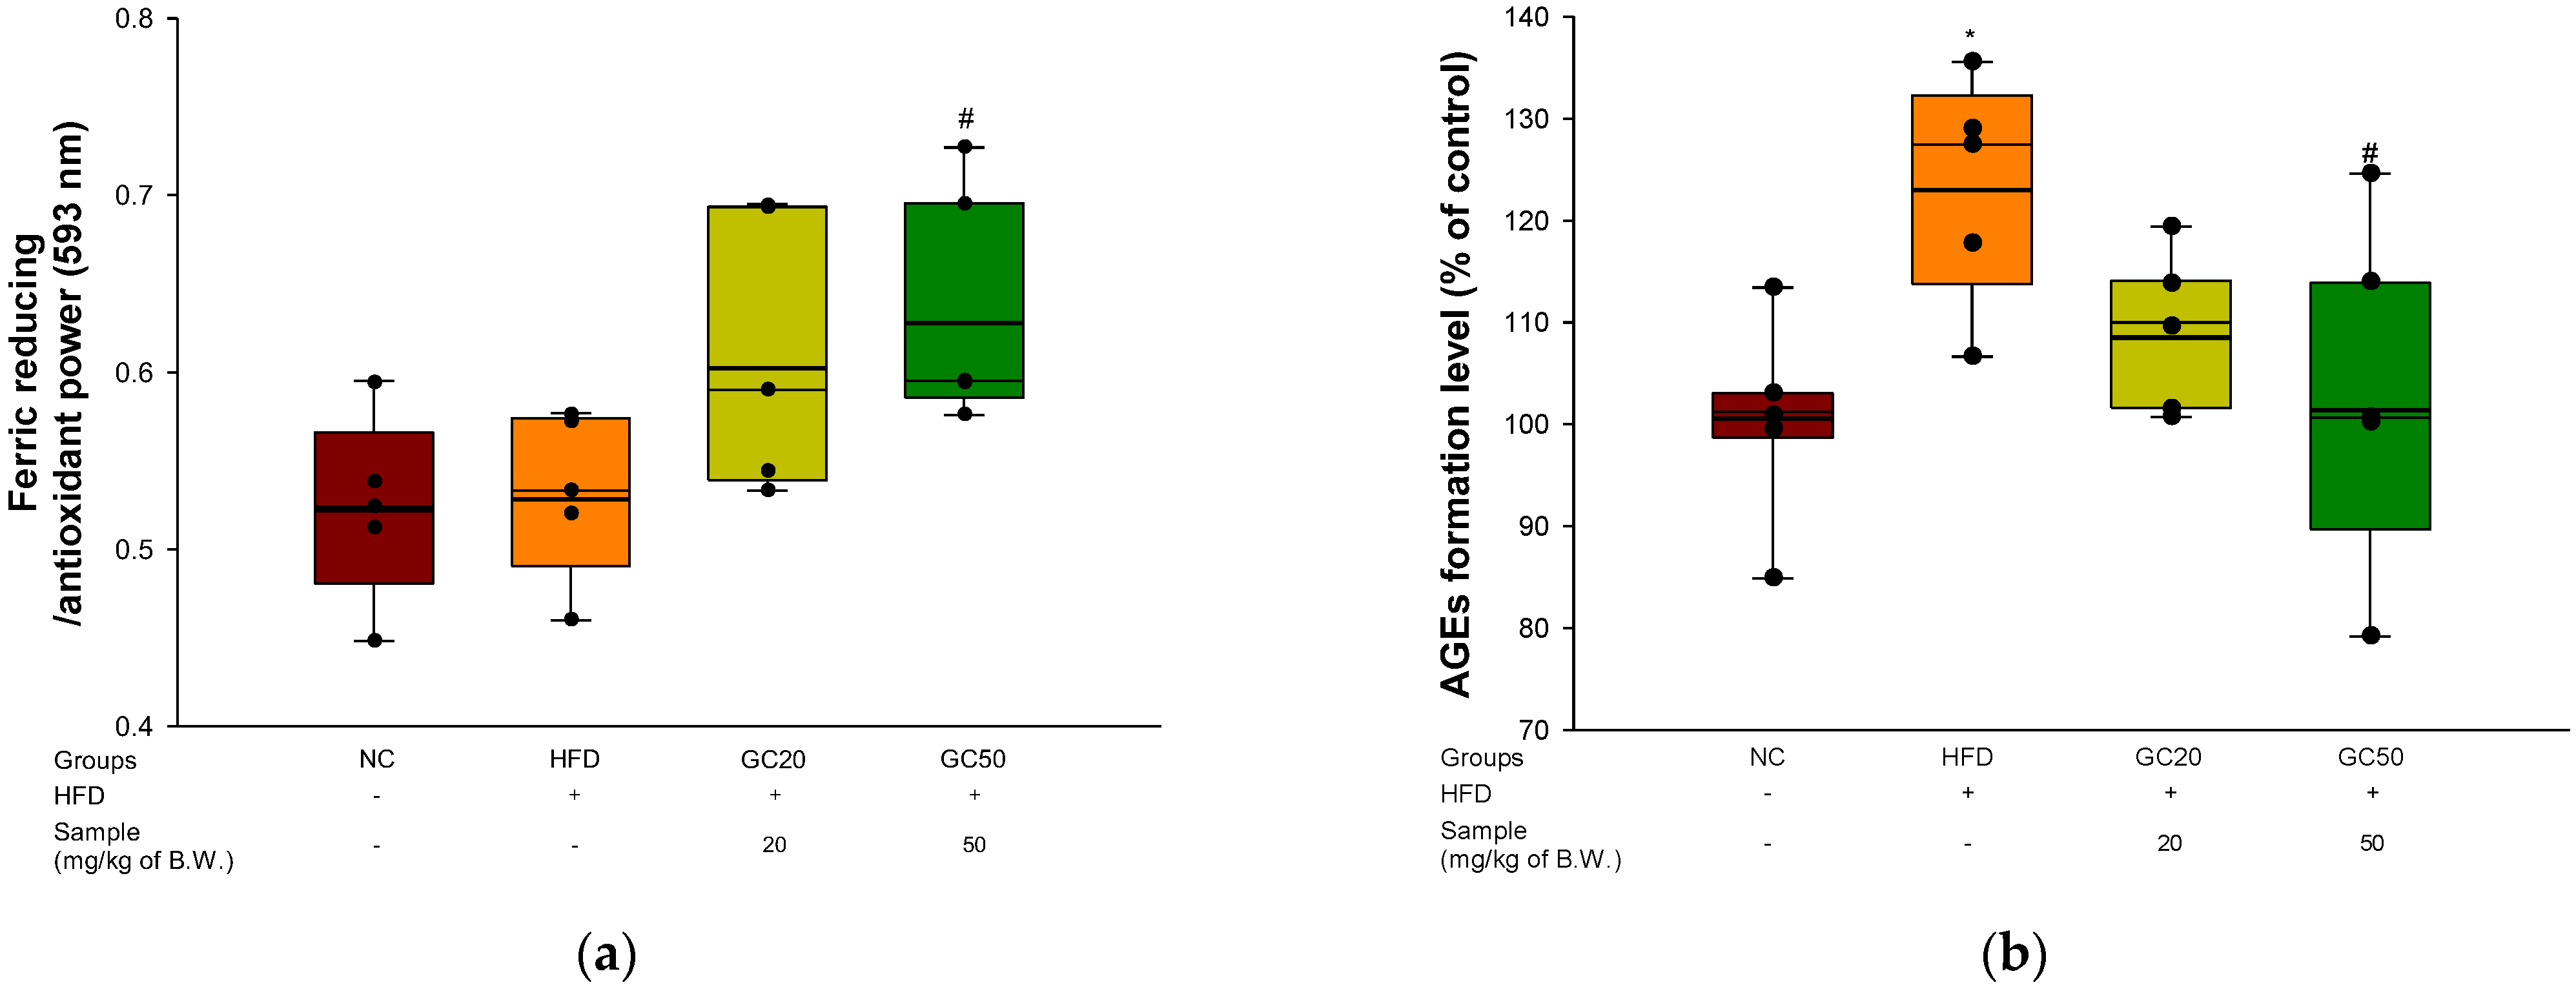
3.7. Serum Level of FRAP and AGEs Formation
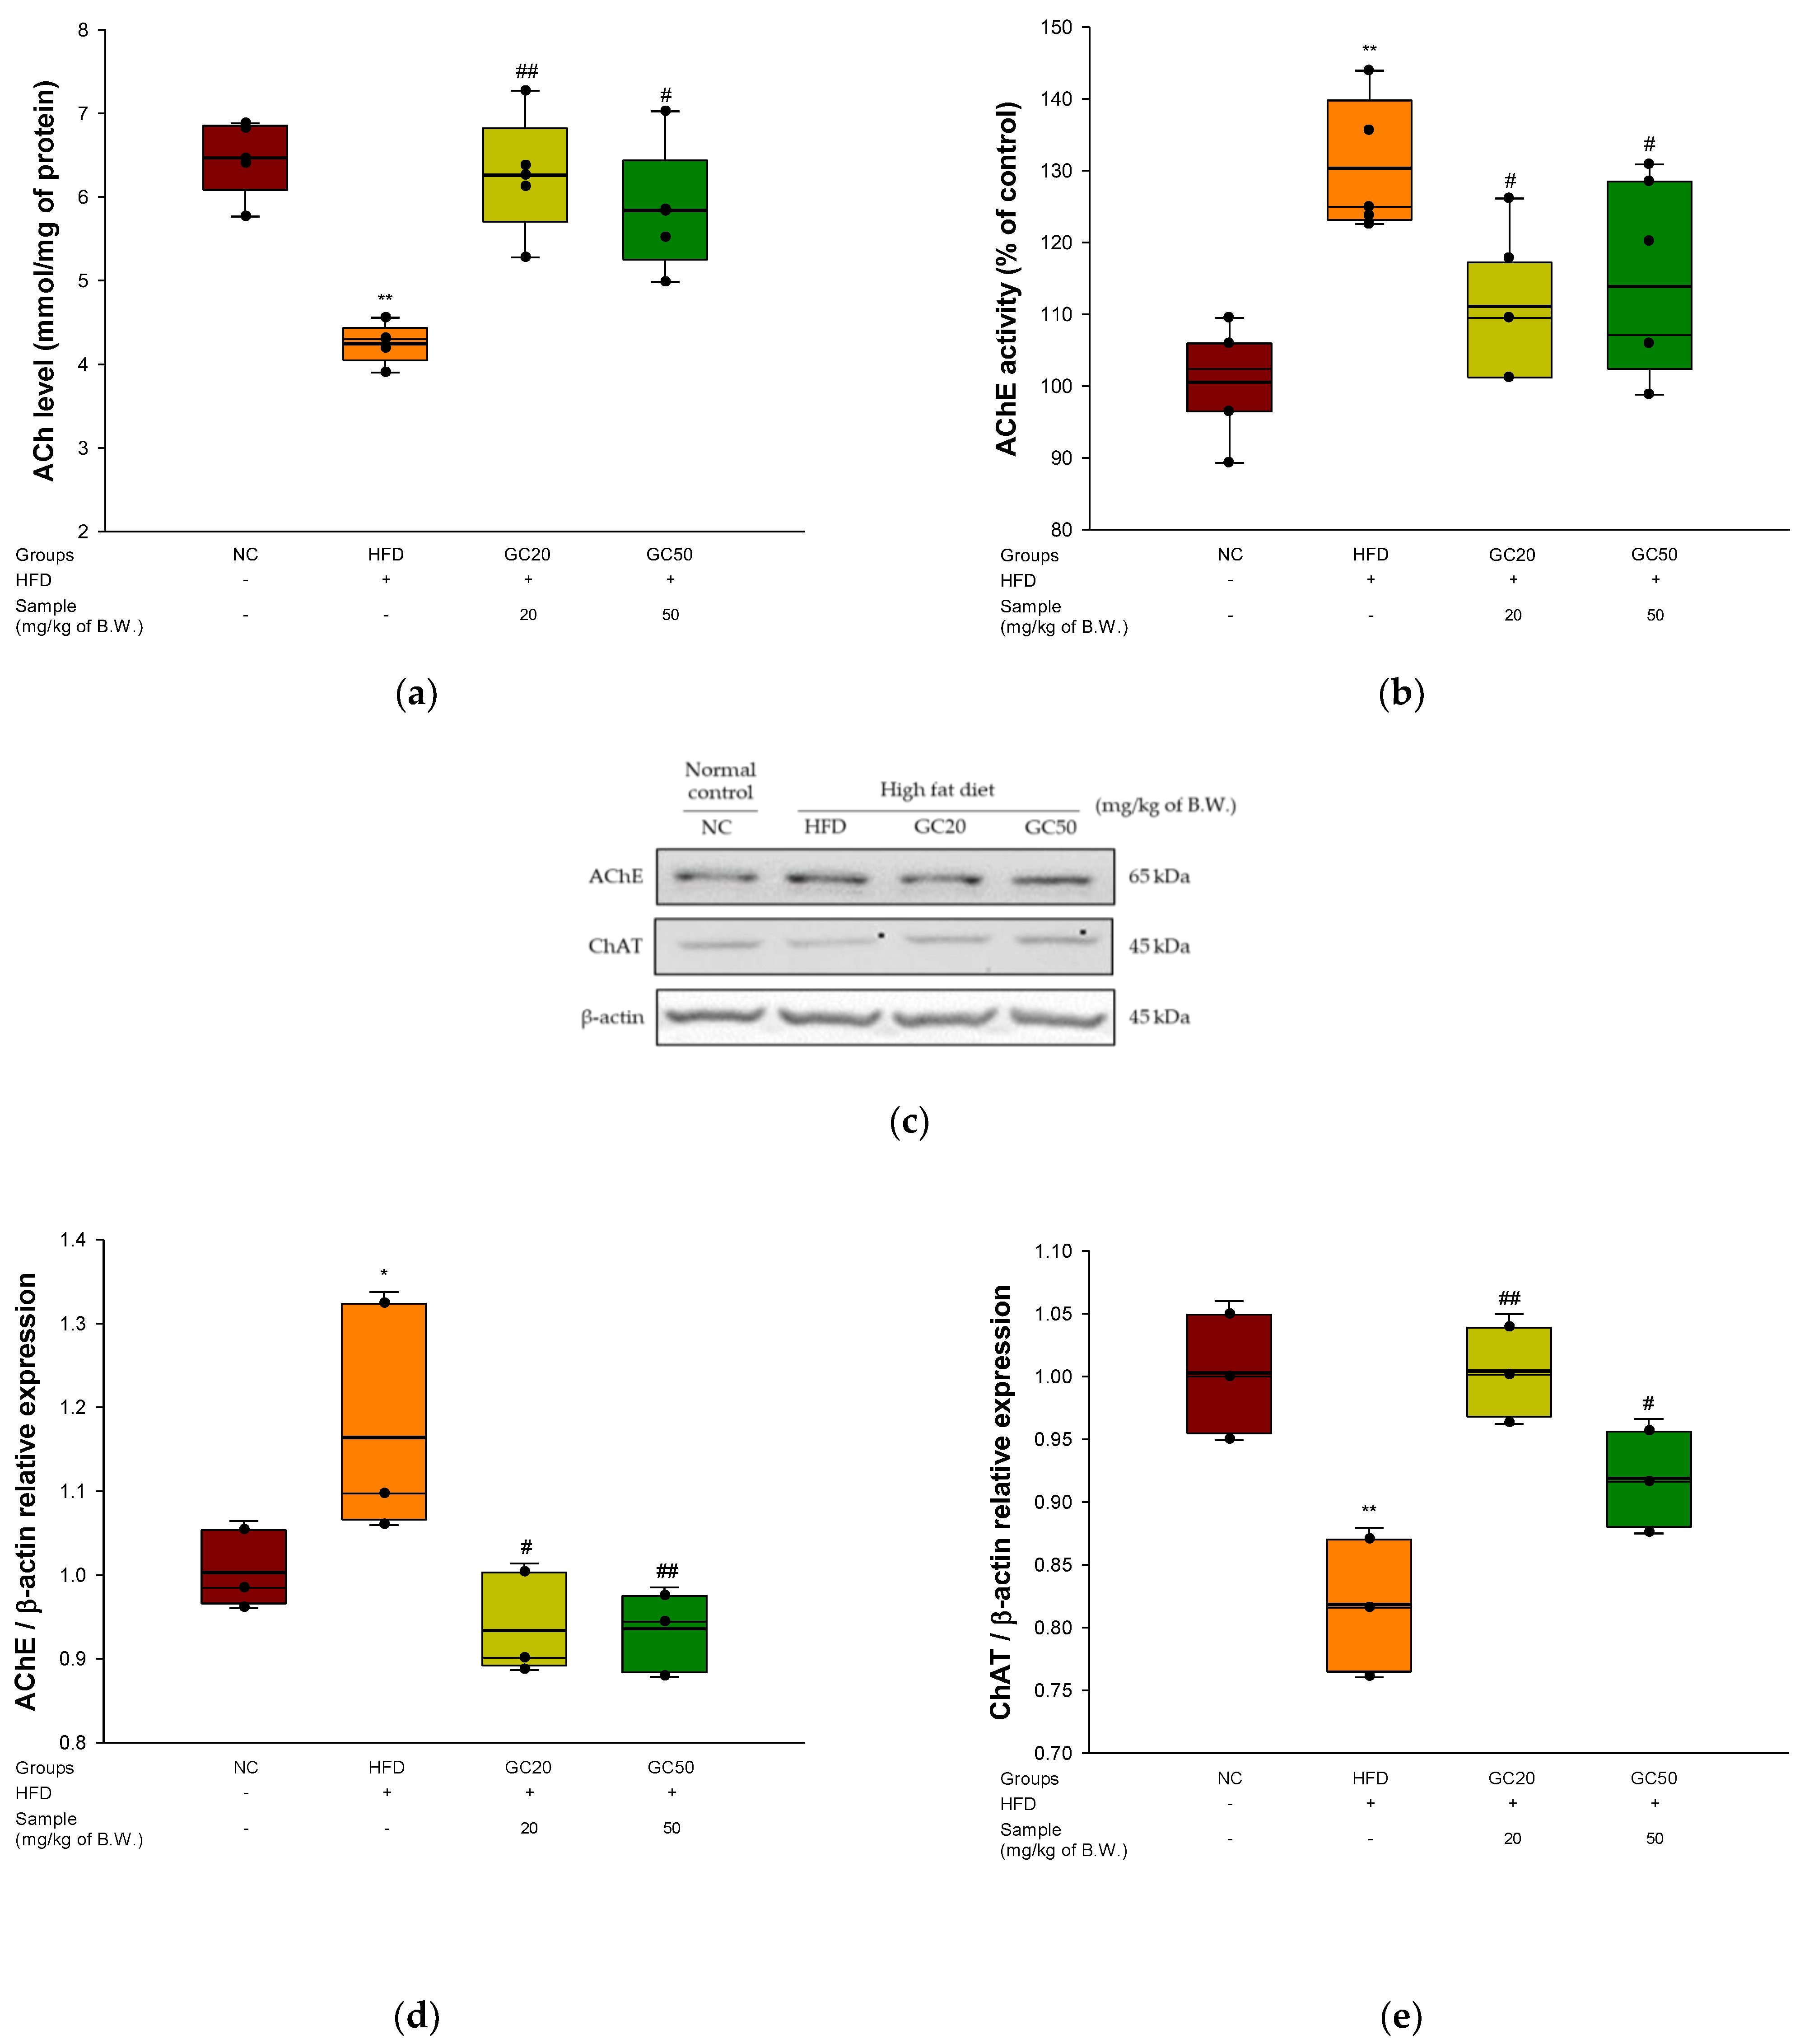
3.8. Cholinergic System
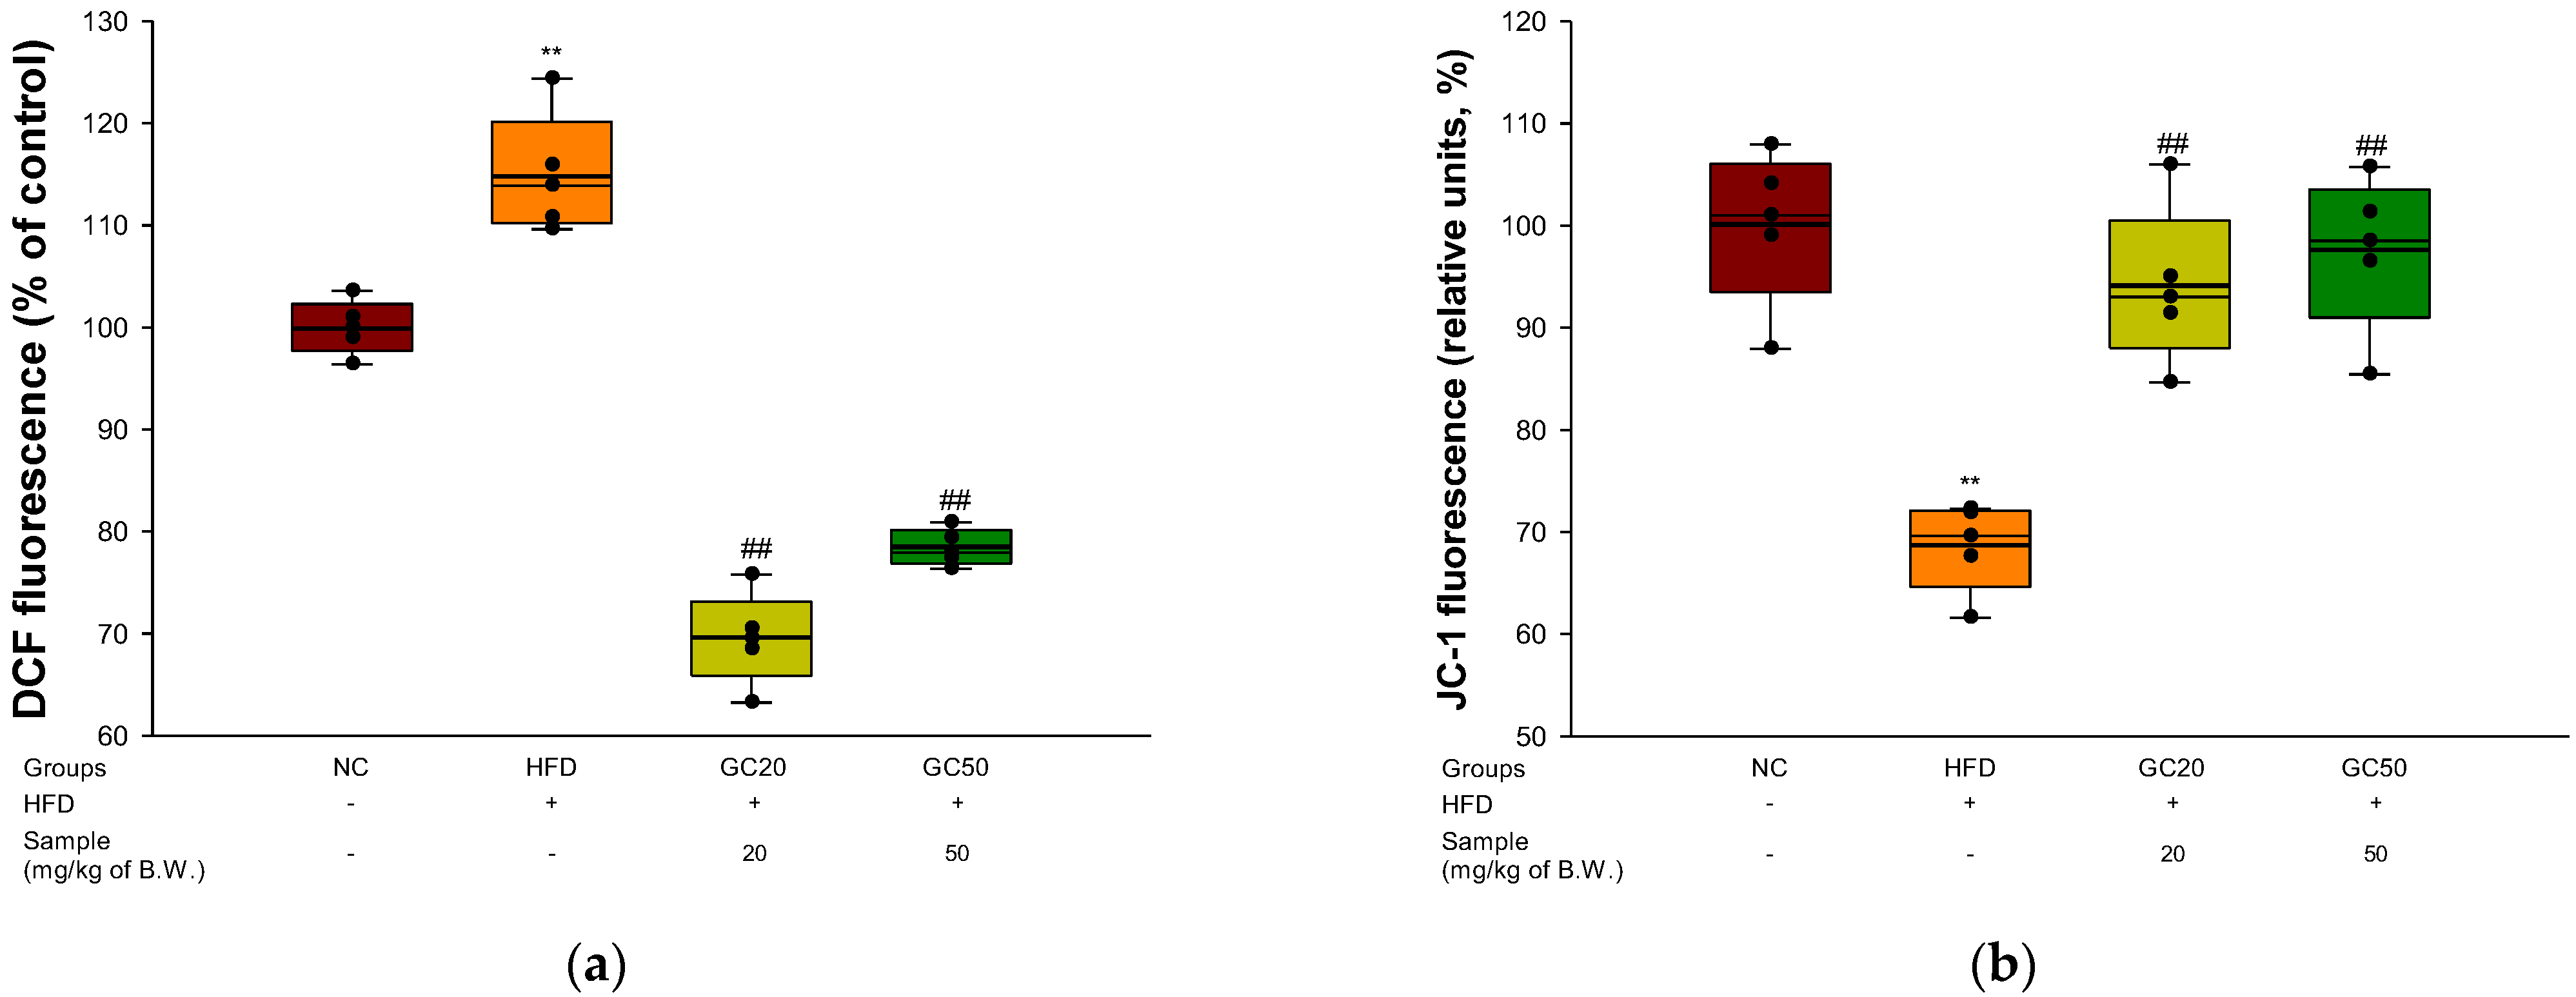
3.9. Mitochondrial Activity
3.10. Protein Expression in Cerebral Tissue
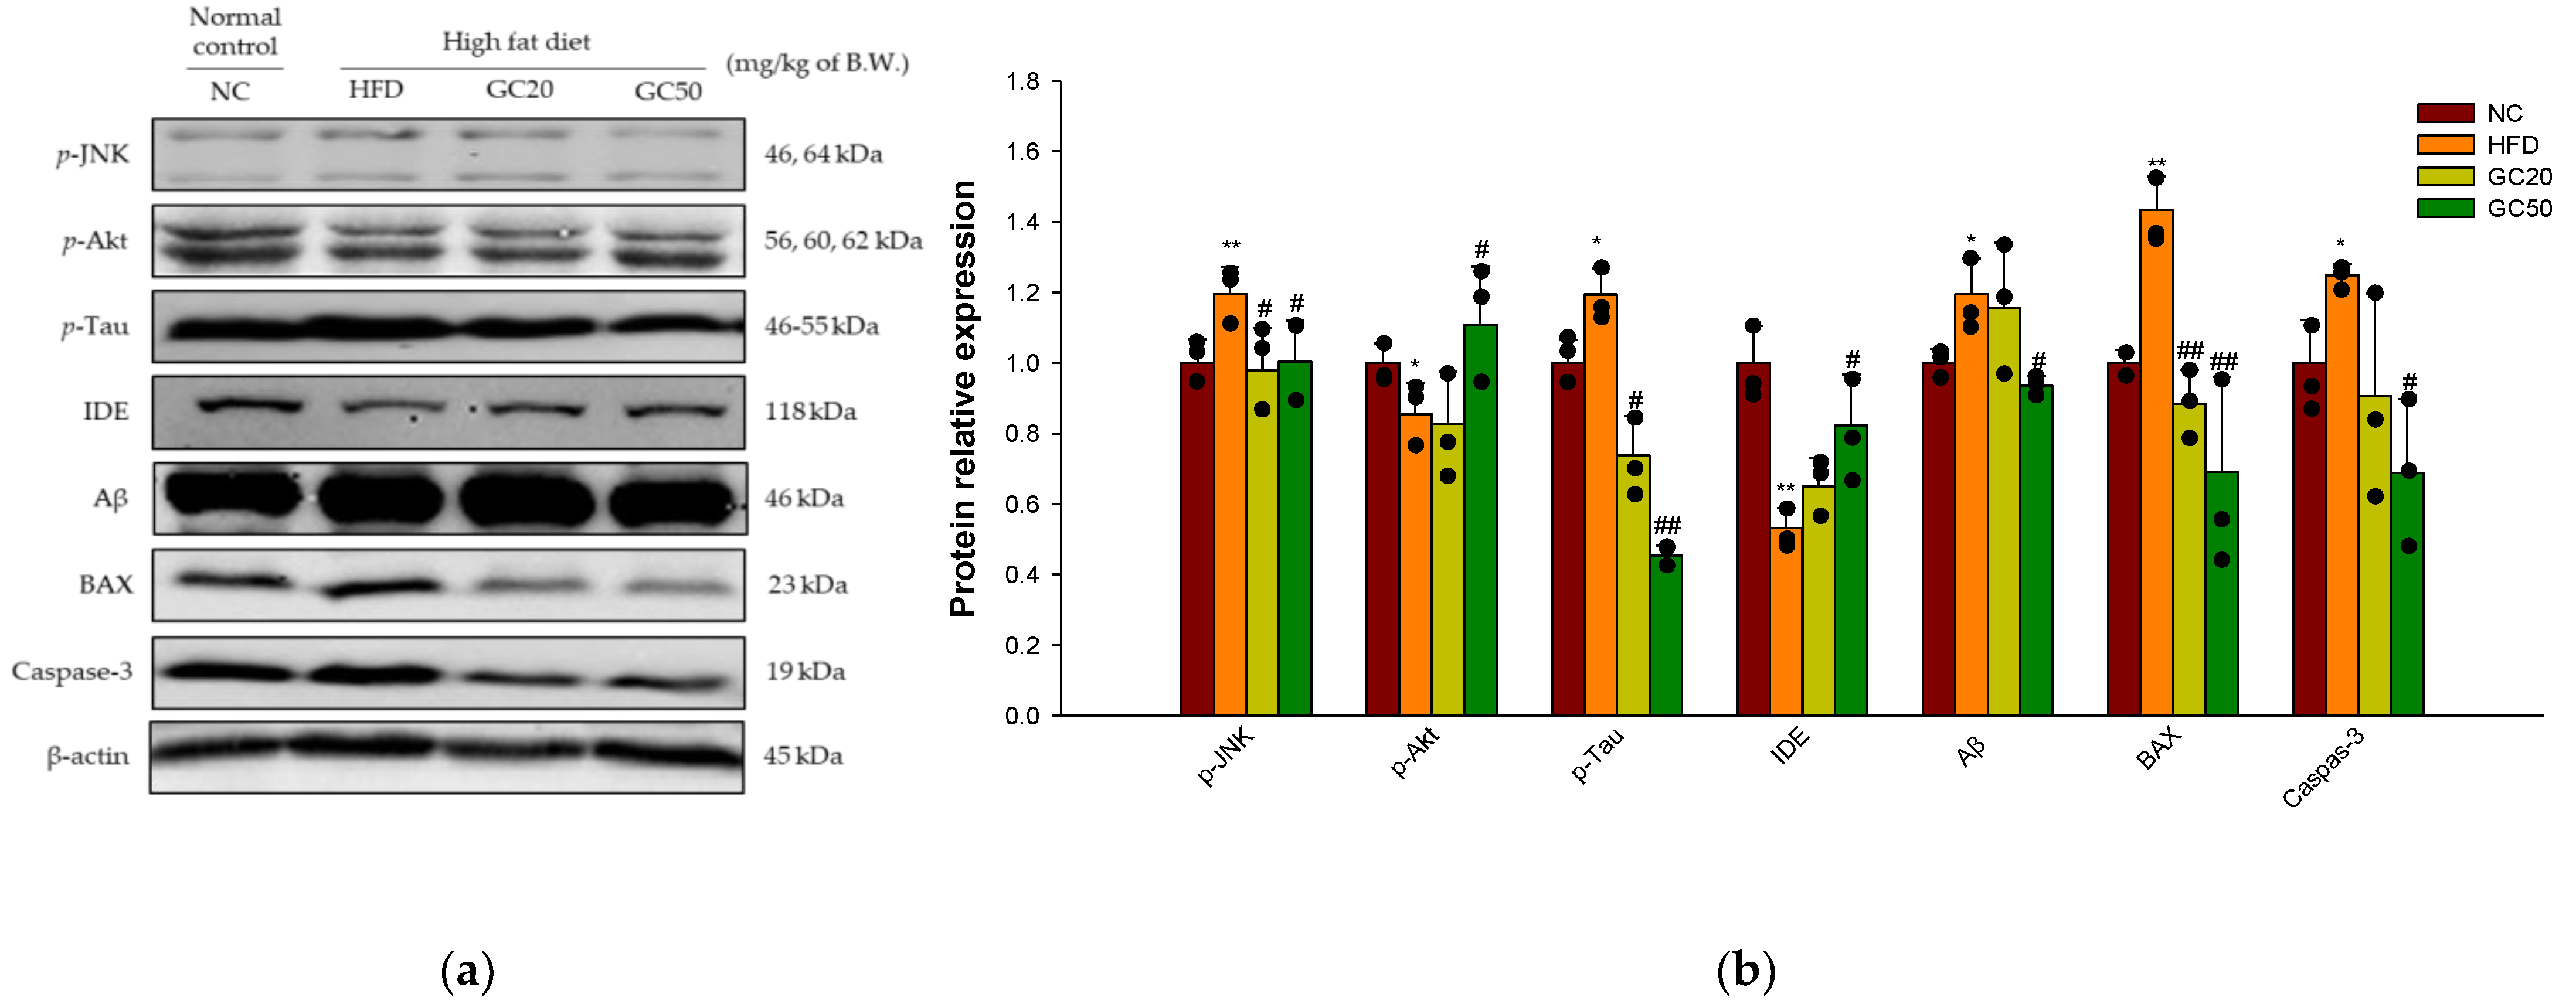
3.10.1. Synaptic Disorders and Neuronal Apoptosis
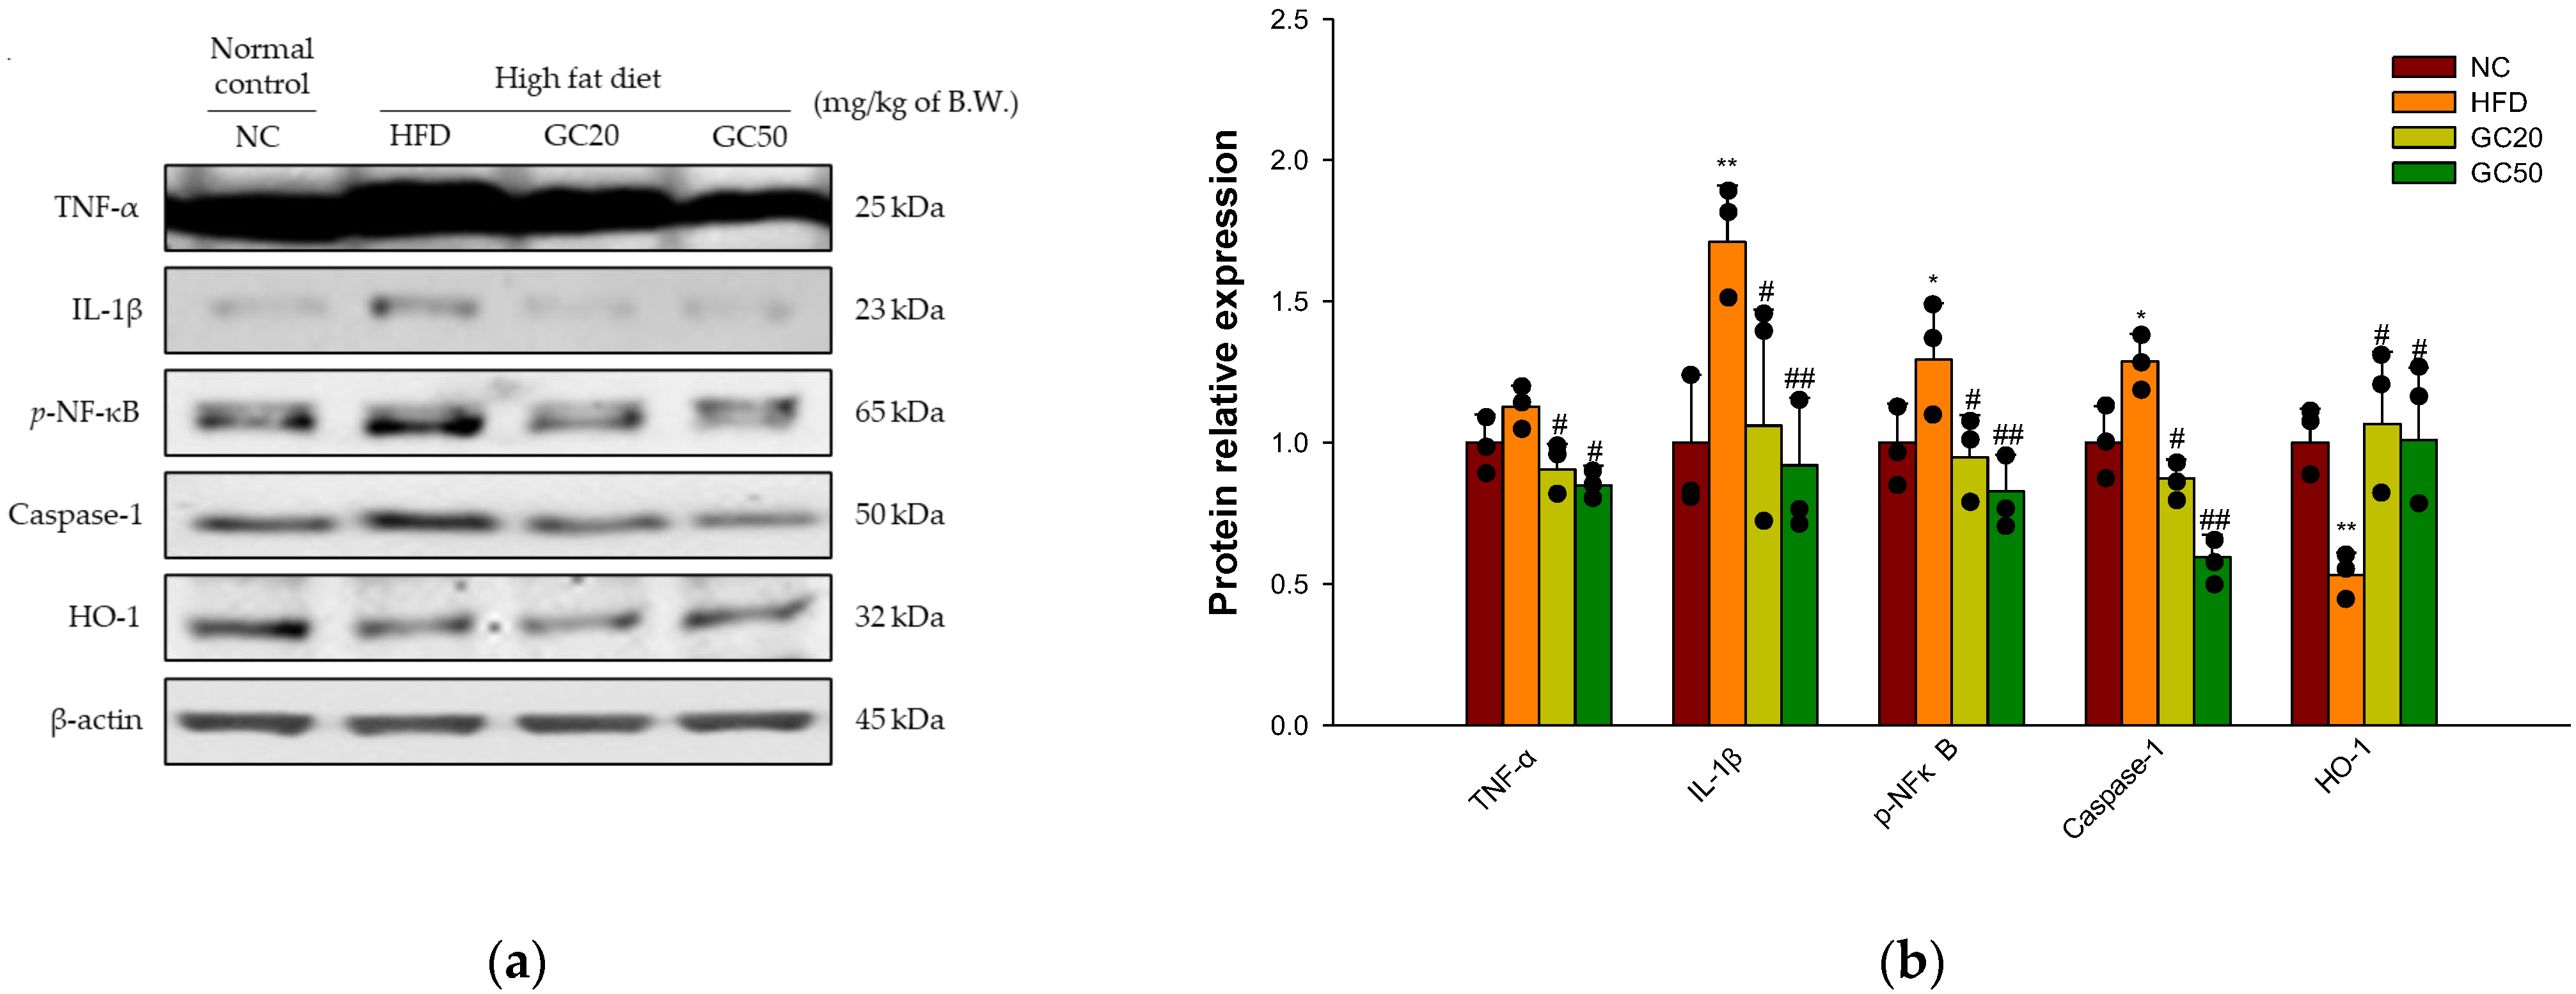
3.10.2. Neuroinflammation
4. Discussion
5. Conclusions
Author Contributions
Funding
Institutional Review Board Statement
Informed Consent Statement
Data Availability Statement
Conflicts of Interest
References
- Shaw, J.E.; Sicree, R.A.; Zimmet, P.Z. Global estimates of the prevalence of diabetes for 2010 and 2030. Diabetes Rec. Clin. Pract. 2010, 87, 4–14. [Google Scholar] [CrossRef] [PubMed]
- Asmat, U.; Abad, K.; Ismail, K. Diabetes mellitus and oxidative stress—A concise review. Saudi Pharm. J. 2016, 24, 547–553. [Google Scholar] [CrossRef] [PubMed] [Green Version]
- Lizarbe, B.; Cherix, A.; Duarçte, J.M.N.; Cardinaux, J.; Gruetter, R. High-fat diet consumption alters energy metabolism in the mouse hypothalamus. Int. J. Obes. 2019, 43, 1295–1304. [Google Scholar] [CrossRef] [PubMed]
- Kopelman, P.G. Obesity as a medical problem. Nature 2000, 404, 635–643. [Google Scholar] [CrossRef] [PubMed]
- Monnier, L.; Mas, E.; Ginet, C.; Michel, F.; Villon, L.; Cristol, J.; Colette, C. Activation of oxidative stress by acute glucose fluctuations compared with sustained chronic hyperglycemia in patients with type 2 diabetes. JAMA 2006, 295, 1681–1687. [Google Scholar] [CrossRef] [Green Version]
- Kaneto, H.; Matsuoka, T.A.; Nakatani, Y.; Kawamori, D.; Matsuhisa, M.; Yamasaki, Y. Oxidative stress and the JNK pathway in diabetes. Curr. Diabetes Rev. 2005, 1, 65–72. [Google Scholar] [CrossRef] [PubMed]
- Malhi, H.; Gores, G.J. Molecular mechanisms of lipotoxicity in non-alcoholic fatty liver disease. Semin. Liver Dis. 2008, 28, 360–369. [Google Scholar] [CrossRef] [Green Version]
- Vivanco, I.; Sawyers, C.L. The phosphatidylinositol 3-kinase–AKT pathway in human cancer. Nat. Rev. Cancer 2002, 2, 489–501. [Google Scholar] [CrossRef] [PubMed]
- Ho, L.; Qin, W.; Pompl, P.N.; Xiang, Z.; Wang, J.; Zhao, Z.; Peng, Y.; Cambareri, G.; Rocher, A.; Mobbs, C.V.; et al. Diet-induced insulin resistance promotes amyloidosis in a transgenic mouse model of Alzheimer’s disease. FASEB 2004, 18, 902–904. [Google Scholar] [CrossRef] [PubMed] [Green Version]
- Sripetchwandee, J.; Chattipakorn, N.; Chattipakorn, S.C. Links between obesity-induced brain insulin resistance, brain mitochondrial dysfunction, and dementia. Front. Endocrinol. 2018, 9, 496. [Google Scholar] [CrossRef]
- Wieser, V.; Moschen, A.R.; Tilg, H. Inflammation, cytokines and insulin resistance: A clinical perspective. Arch. Immunol. Ther. Exp. (Warsz.) 2013, 61, 119–125. [Google Scholar] [CrossRef] [PubMed]
- Tu, Y.F.; Tsai, Y.S.; Wang, L.W.; Wu, H.C.; Huang, C.C.; Ho, C.J. Overweight worsens apoptosis, neuroinflammation and blood-brain barrier damage after hypoxic ischemia in neonatal brain through JNK hyperactivation. J. Neuroinflamm. 2011, 8, 40. [Google Scholar] [CrossRef] [PubMed] [Green Version]
- Alkan, I.; Altunkaynak, B.Z.; Gültekin, G.İ.; Bayçu, C. Hippocampal neural cell loss in high-fat diet-induced obese rats–exploring the protein networks, ultrastructure, biochemical and bioinformatical markers. J. Chem. Neuroanat. 2021, 114, 101947. [Google Scholar] [CrossRef] [PubMed]
- Maciejczyk, M.; Żebrowska, E.; Chabowski, A. Insulin resistance and oxidative stress in the brain: What’s new? Int. J. Mol. Sci. 2019, 20, 874. [Google Scholar] [CrossRef] [PubMed] [Green Version]
- Fraulob, J.C.; Ogg-Diamantino, R.; Fernandes-Santos, C.; Aguila, M.B.; Mandarim-de-Lacerda, C.A. A mouse model of metabolic syndrome: Insulin resistance, fatty liver and non-alcoholic fatty pancreas disease (NAFPD) in C57BL/6 mice fed a high fat diet. J. Clin. Biochem. Nutr. 2010, 46, 212–223. [Google Scholar] [CrossRef] [Green Version]
- Verspohl, E.J. Recommended testing in diabetes research. Planta Med. 2002, 68, 581–590. [Google Scholar] [CrossRef] [PubMed] [Green Version]
- Srinivasan, K.; Ramarao, P. Animal model in type 2 diabetes research: An overview. Indian J. Med. Res. 2007, 125, 451–472. [Google Scholar] [PubMed]
- Li, L.; Tsao, R.; Yang, R.; Liu, C.; Zhu, H.; Young, J.C. Polyphenolic profiles and antioxidant activities of heartnut (Juglans ailanthifolia Var. cordiformis) and persian walnut (Juglans regia L.). J. Agric. Food Chem. 2006, 54, 8033–8040. [Google Scholar] [CrossRef] [PubMed]
- Li, L.; Tsao, R.; Yang, R.; Kramer, J.K.; Hernandez, M. Fatty acid profiles, tocopherol contents, and antioxidant activities of heartnut (Juglans ailanthifolia Var. cordiformis) and persian walnut (Juglans regia L.). J. Agric. Food Chem. 2007, 55, 1164–1169. [Google Scholar] [CrossRef] [PubMed]
- Samaranayaka, A.G.; John, J.A.; Shahidi, F. Antioxidant activity of english walnut (Juglans Regia L.). J. Food Lipids 2008, 15, 384–397. [Google Scholar] [CrossRef]
- Okuda, T.; Yoshida, T.; Hatano, T. Ellagitannins as active constituents of medicinal plants. Planta Med. 1989, 55, 117–122. [Google Scholar] [CrossRef] [PubMed] [Green Version]
- Abdel-Moneim, A.; Yousef, A.I.; El-Twab, A.; Sanaa, M.; Abdel Reheim, E.S.; Ashour, M.B. Gallic acid and p-coumaric acid attenuate type 2 diabetes-induced neurodegeneration in rats. Metab. Brain Dis. 2017, 32, 1279–1286. [Google Scholar] [CrossRef] [PubMed]
- Yoshimura, Y.; Nishii, S.; Zaima, N.; Moriyama, T.; Kawamura, Y. Ellagic acid improves hepatic steatosis and serum lipid composition through reduction of serum resistin levels and transcriptional activation of hepatic ppara in obese, diabetic KK-Ay mice. Biochem. Biophys. Res. Commun. 2013, 434, 486–491. [Google Scholar] [CrossRef] [PubMed]
- Yu, M.; Chen, X.; Liu, J.; Ma, Q.; Zhuo, Z.; Chen, H.; Zhou, L.; Yang, S.; Zheng, L.; Ning, C.; et al. Gallic acid disruption of Aβ1–42 aggregation rescues cognitive decline of APP/PS1 double transgenic mouse. Neurobiol. Dis. 2019, 124, 67–80. [Google Scholar] [CrossRef] [PubMed]
- He, X.M.; Zhou, Y.Z.; Sheng, S.; Li, J.J.; Wang, G.Q.; Zhang, F. Ellagic acid protects dopamine neurons via inhibition of NLRP3 inflammasome activation in microglia. Oxid. Med. Cell Longev. 2020, 2020, 2963540. [Google Scholar] [CrossRef]
- Shi, D.; Chen, C.; Zhao, S.; Ge, F.; Liu, D.; Song, H. Walnut polyphenols inhibit pancreatic lipase activity in vitro and have hypolipidemic effect on high-fat diet-induced obese mice. Food Nutr. Res. 2014, 2, 757–763. [Google Scholar] [CrossRef] [Green Version]
- Wang, J.; Wu, T.; Fang, L.; Liu, C.; Liu, X.; Li, H.; Shi, J.; Li, M.; Min, W. Peptides from walnut (Juglans mandshurica Maxim.) protect hepatic HepG2 cells from high glucose-induced insulin resistance and oxidative stress. Food Funct. 2020, 11, 8112–8121. [Google Scholar] [CrossRef] [PubMed]
- Sun, B.; Yan, H.; Li, C.; Yin, L.; Li, F.; Zhou, L.; Han, X. Beneficial effects of walnut (Juglans regia L.) oil-derived polyunsaturated fatty acid prevents a prooxidant status and hyperlipidemia in pregnant rats with diabetes. Nutr. Metab. 2020, 17, 1–11. [Google Scholar] [CrossRef]
- Kim, J.M.; Lee, U.; Kang, J.Y.; Park, S.K.; Shin, E.J.; Kim, H.; Kim, C.; Kim, M.; Heo, H.J. Anti-amnesic effect of walnut via the regulation of BBB function and neuro-inflammation in Aβ1-42-induced mice. Antioxidants 2020, 9, 976. [Google Scholar] [CrossRef]
- Kim, G.H.; Kim, J.M.; Park, S.K.; Kang, J.Y.; Han, H.J.; Shin, E.J.; Moon, J.H.; Kim, C.W.; Lee, U.; Shin, E.C.; et al. Nutritional composition of domestic and imported walnuts (Juglans regia L.). J. Korean Soc. Food Sci. Nutr. 2020, 49, 608–616. [Google Scholar] [CrossRef]
- Kim, J.M.; Park, S.K.; Kang, J.Y.; Park, S.B.; Yoo, S.K.; Han, H.J.; Cho, K.H.; Kim, J.C.; Heo, H.J. Green tea seed oil suppressed Aβ1-42-induced behavioral and cognitive deficit via the Aβ-related Akt pathway. Int. J. Mol. Sci. 2019, 20, 1865. [Google Scholar] [CrossRef] [PubMed] [Green Version]
- Van der Borght, K.; Havekes, R.; Bos, T.; Eggen, B.J.; Van der Zee, E.A. Exercise improves memory acquisition and retrieval in the Y-maze task: Relationship with hippocampal neurogenesis. Behav. Neurosci. 2007, 121, 324–334. [Google Scholar] [CrossRef] [PubMed] [Green Version]
- Newman, J.P.; Kosson, D.S. Passive avoidance learning in psychopathic and nonpsychopathic offenders. J. Abnorm. Psychol. 1986, 95, 252–256. [Google Scholar] [CrossRef] [PubMed]
- Morris, R. Developments of a water-maze procedure for studying spatial learning in the rat. J. Neurosci. Methods 1984, 11, 47–60. [Google Scholar] [CrossRef]
- Friedewald, W.T.; Levy, R.I.; Fredrickson, D.S. Estimation of the concentration of low-density lipoprotein cholesterol in plasma, without use of the preparative ultracentrifuge. Clin. Chem. 1972, 18, 499–502. [Google Scholar] [CrossRef] [PubMed]
- Bradford, M.M. A rapid and sensitive method for the quantitation of microgram quantities of protein utilizing the principle of protein-dye binding. Anal. Biochem. 1976, 72, 248–254. [Google Scholar] [CrossRef]
- Ayala, A.; Muñoz, M.F.; Argüelles, S. Lipid peroxidation: Production, metabolism, and signaling mechanisms of malondialdehyde and 4-hydroxy-2-nonenal. Oxid. Med. Cell. Longev. 2014, 2014, 360438. [Google Scholar] [CrossRef] [PubMed]
- Benzie, I.F.; Strain, J.J. The ferric reducing ability of plasma (FRAP) as a measure of “antioxidant power”: The FRAP assay. Anal. Biochem. 1996, 239, 70–76. [Google Scholar] [CrossRef] [Green Version]
- Sampath, C.; Rashid, M.R.; Sang, S.; Ahmedna, M. Green tea epigallocatechin 3-gallate alleviates hyperglycemia and reduces advanced glycation end products via nrf2 pathway in mice with high fat diet-induced obesity. Biomed. Pharmacother. 2017, 87, 73–81. [Google Scholar] [CrossRef]
- Vincent, D.; Segonzac, G.; Vincent, M.C. Colorimetric determination of acetylcholine by the Hestrin hydroxylamine reaction and its application in pharmacy. Ann. Pharm. Fr. 1958, 16, 179–185. [Google Scholar]
- Ellman, G.L.; Courtney, K.D.; Andres jr, V.; Featherstone, R.M. A new and rapid colorimetric determination of acetylcholinesterase activity. Biochem. Pharmacol. 1961, 7, 88–95. [Google Scholar] [CrossRef]
- Brown, M.R.; Geddes, J.W.; Sullivan, P.G. Brain region-specific, age-related, alterations in mitochondrial responses to elevated calcium. J. Bioenerg. Biomembr. 2004, 36, 401–406. [Google Scholar] [CrossRef] [PubMed]
- Shimoda, H.; Tanaka, J.; Kikuchi, M.; Fukuda, T.; Ito, H.; Hatano, T.; Yoshida, T. Effect of polyphenol-rich extract from walnut on diet-induced hypertriglyceridemia in mice via enhancement of fatty acid oxidation in the liver. J. Agric. Food Chem. 2009, 57, 1786–1792. [Google Scholar] [CrossRef] [PubMed]
- Berbudi, A.; Rahmadika, N.; Tjahjadi, A.I.; Ruslami, R. Type 2 diabetes and its impact on the immune system. Curr. Diabetes Rev. 2020, 16, 442–449. [Google Scholar] [CrossRef] [PubMed]
- Kesh, S.; Sarkar, D.; Manna, K. High-fat diet-induced oxidative stress and its impact on metabolic syndrome: A review. Asian J. Pharm. Clin. Res. 2016, 9, 47–52. [Google Scholar]
- World Health Organization. Classification of Diabetes Mellitus; World Health Organization: Geneva, Switzerland, 2019. [Google Scholar]
- Brownlee, M. Biochemistry and molecular cell biology of diabetic complications. Nature 2001, 414, 813–820. [Google Scholar] [CrossRef]
- Allen, D.A.; Yaqoob, M.M.; Harwood, S.M. Mechanisms of high glucose-induced apoptosis and its relationship to diabetic complications. J. Nutr. Biochem. 2005, 16, 705–713. [Google Scholar] [CrossRef] [PubMed]
- Hamed, S.A. Brain injury with diabetes mellitus: Evidence, mechanisms and treatment implications. Expert Rev. Clin. Pharmacol. 2017, 10, 409–428. [Google Scholar] [CrossRef] [PubMed]
- Poulose, S.M.; Miller, M.G.; Shukitt-Hale, B. Role of walnuts in maintaining brain health with age. J. Nutr. 2014, 144, 561S–566S. [Google Scholar] [CrossRef] [PubMed] [Green Version]
- Muthaiyah, B.; Essa, M.; Chauhan, V.; Chauhan, A. Protective effects of walnut extract against amyloid beta peptide-induced cell death and oxidative stress in PC12 cells. Neurochem. Res. 2011, 36, 2096–2103. [Google Scholar] [CrossRef] [Green Version]
- Boden, G. 45Obesity, insulin resistance and free fatty acids. Curr. Opin. Endocrinol. Diabetes Obes. 2011, 18, 139–143. [Google Scholar] [CrossRef] [PubMed] [Green Version]
- Noeman, S.A.; Hamooda, H.E.; Baalash, A.A. Biochemical study of oxidative stress markers in the liver, kidney and heart of high fat diet induced obesity in rats. Diabetol. Metab. Syndr. 2011, 3, 1–8. [Google Scholar] [CrossRef] [PubMed] [Green Version]
- Leopold, J.A.; Loscalzo, J. Oxidative mechanisms and atherothrombotic cardiovascular disease. Drug Discov. Today Ther. Strateg. 2008, 5, 5–13. [Google Scholar] [CrossRef] [PubMed] [Green Version]
- Tangvarasittichai, S. Oxidative stress, insulin resistance, dyslipidemia and type 2 diabetes mellitus. World J. Diabetes 2015, 6, 456–480. [Google Scholar] [CrossRef] [PubMed]
- Li, Y.; Chen, D.; Zhang, F.; Lin, Y.; Ma, Y.; Zhao, S.; Chen, C.; Wang, X.; Liu, J. Preventive effect of pressed degreased walnut meal extracts on T2DM rats by regulating glucolipid metabolism and modulating gut bacteria flora. J. Funct. Foods 2020, 64, 103694. [Google Scholar] [CrossRef]
- Ebrahim Abbasi, O.; Arash Noori, S.; Ali, R. Effects of walnut on lipid profile as well as the expression of sterol-regulatory element binding protein-1c (SREBP-1c) and peroxisome proliferator activated receptors α (PPARα) in diabetic rat. Food Nutr. Sci. 2012, 3, 2. [Google Scholar] [CrossRef] [Green Version]
- Mushtaq, R.; Mushtaq, R.; Khan, Z.T. Effect of walnut on lipid profile in obese female in different ethnic groups of Quetta, Pakistan. J. Nutr. 2009, 8, 1617–1622. [Google Scholar] [CrossRef]
- Voziyan, P.A.; Khalifah, R.G.; Thibaudeau, C.; Yildiz, A.; Jacob, J.; Serianni, A.S.; Hudson, B.G. Modification of proteins in vitro by physiological levels of glucose: Pyridoxamine inhibits conversion of Amadori intermediate to advanced glycation end-products through binding of redox metal ions. J. Biol. Chem. 2003, 278, 46616–46624. [Google Scholar] [CrossRef] [PubMed] [Green Version]
- Unoki, H.; Yamagishi, S. I Advanced glycation end products and insulin resistance. Curr. Pharm. Des. 2008, 14, 987–989. [Google Scholar] [CrossRef] [PubMed]
- Salim, S. Oxidative stress and the central nervous system. J. Pharmacol. Exp. Ther. 2017, 360, 201–205. [Google Scholar] [CrossRef] [PubMed] [Green Version]
- Ma, Z.F.; Ahmad, J.; Khan, I.; Wang, C.W.; Jiang, P.; Zhang, Y. Interaction of phytochemicals from walnut on health: An updated comprehensive review of reported bioactivities and medicinal properties of walnut. J. Biol. Act. Prod. Nat. 2019, 9, 410–425. [Google Scholar] [CrossRef]
- Bati, B.; Celik, I.; Dogan, A. Determination of hepatoprotective and antioxidant role of walnuts against ethanol-induced oxidative stress in rats. Cell Biochem. Biophys. 2015, 71, 1191–1198. [Google Scholar] [CrossRef] [PubMed]
- Fukuda, T.; Ito, H.; Yoshida, T. Antioxidative polyphenols from walnuts (Juglans regia L.). Phytochemistry. 2003, 63, 795–801. [Google Scholar] [CrossRef]
- de Mello, A.H.; Costa, A.B.; Engel, J.D.G.; Rezin, G.T. Mitochondrial dysfunction in obesity. Life Sci. 2018, 192, 26–32. [Google Scholar] [CrossRef] [PubMed]
- Gusdon, A.M.; Song, K.; Qu, S. Nonalcoholic fatty liver disease: Pathogenesis and therapeutics from a mitochondria-centric perspective. Oxid. Med. Cell. Longev. 2014, 2014, e637027. [Google Scholar] [CrossRef] [Green Version]
- Brownlee, M. The pathobiology of diabetic complications: A unifying mechanism. Diabetes 2005, 54, 1615–1625. [Google Scholar] [CrossRef] [PubMed] [Green Version]
- Bagkos, G.; Koufopoulos, K.; Piperi, C. A new model for mitochondrial membrane potential production and storage. Med. Hypotheses 2014, 83, 175–181. [Google Scholar] [CrossRef]
- Park, H.R.; Park, M.; Choi, J.; Park, K.; Chung, H.Y.; Lee, J. A high-fat diet impairs neurogenesis: Involvement of lipid peroxidation and brain-derived neurotrophic factor. Neurosci. Lett. 2010, 482, 235–239. [Google Scholar] [CrossRef]
- Wahl, D.; Coogan, S.C.; Solon-Biet, S.M.; de Cabo, R.; Haran, J.B.; Raubenheimer, D.; Cogger, V.C.; Mattson, M.P.; Simpson, S.J.; Le Couteur, D.G. Cognitive and behavioral evaluation of nutritional interventions in rodent models of brain aging and dementia. Clin. Interv. Aging 2017, 12, 1419–1428. [Google Scholar] [CrossRef] [Green Version]
- Liu, J.; Chen, D.; Wang, Z.; Chen, C.; Ning, D.; Zhao, S. Protective effect of walnut on d-galactose-induced aging mouse model. Food Sci. Nutr. 2019, 7, 969–976. [Google Scholar] [CrossRef] [PubMed] [Green Version]
- Heydemann, A. An overview of murine high fat diet as a model for type 2 diabetes mellitus. J. Diabetes Res. 2016, 2016, e2902351. [Google Scholar] [CrossRef] [PubMed] [Green Version]
- Newman, E.L.; Gupta, K.; Climer, J.R.; Monaghan, C.K.; Hasselmo, M.E. Cholinergic modulation of cognitive processing: Insights drawn from computational models. Front. Behav. Neurosci. 2012, 6, 24. [Google Scholar] [CrossRef] [PubMed] [Green Version]
- Oda, Y. Choline acetyltransferase: The structure, distribution and pathologic changes in the central nervous system. Pathol. Int. 1999, 49, 921–937. [Google Scholar] [CrossRef] [PubMed]
- Chang, E.H.; Chavan, S.S.; Pavlov, V.A. Cholinergic control of inflammation, metabolic dysfunction, and cognitive impairment in obesity-associated disorders: Mechanisms and novel therapeutic opportunities. Front. Neurosci. 2019, 13, 263. [Google Scholar] [CrossRef] [Green Version]
- Chen, L.; Lin, S.; Lee, Y.; Wang, C.; Hou, W. Hydrolysable tannins exhibit acetylcholinesterase inhibitory and anti-glycation activities in vitro and learning and memory function improvements in scopolamine-induced amnesiac mice. Biomedicines 2021, 9, 1066. [Google Scholar] [CrossRef] [PubMed]
- Malito, E.; Hulse, R.E.; Tang, W. Amyloid β-degrading cryptidases: Insulin degrading enzyme, neprilysin, and presequence peptidase. Cell. Mol. Life Sci. 2008, 65, 2574–2585. [Google Scholar] [CrossRef] [PubMed] [Green Version]
- Qiu, W.Q.; Folstein, M.F. Insulin, insulin-degrading enzyme and amyloid-β peptide in Alzheimer’s disease: Review and hypothesis. Neurobiol. Aging 2006, 27, 190–198. [Google Scholar] [CrossRef] [PubMed]
- Paradis, E.; Douillard, H.; Koutroumanis, M.; Goodyer, C.; LeBlanc, A. Amyloid β peptide of Alzheimer’s disease downregulates Bcl-2 and upregulates Bax expression in human neurons. J. Neurosci. 1996, 16, 7533–7539. [Google Scholar] [CrossRef] [Green Version]
- Singh, R.; Letai, A.; Sarosiek, K. Regulation of apoptosis in health and disease: The balancing act of BCL-2 family proteins. Nat. Rev. Mol. Cell Biol. 2019, 20, 175–193. [Google Scholar] [CrossRef] [PubMed]
- Wang, L.; Wei, Y.; Ning, C.; Zhang, M.; Fan, P.; Lei, D.; Du, J.; Gale, M.; Ma, Y.; Yang, Y. Ellagic acid promotes browning of white adipose tissues in high-fat diet-induced obesity in rats through suppressing white adipocyte maintaining genes. Endocr. J. 2019, 66, 923–936. [Google Scholar] [CrossRef] [PubMed] [Green Version]
- Garrido, C.; Galluzzi, L.; Brunet, M.; Puig, P.E.; Didelot, C.; Kroemer, G. Mechanisms of cytochrome c release from mitochondria. Cell Death Differ. 2006, 13, 1423–1433. [Google Scholar] [CrossRef] [PubMed] [Green Version]
- Park, G.; Kim, H.G.; Hong, S.-P.; Kim, S.Y.; Oh, M.S. Walnuts (Seeds of Juglandis sinensis L.) protect human epidermal keratinocytes against UVB-induced mitochondria-mediated apoptosis through upregulation of ROS elimination pathways. Skin Pharmacol. Physiol. 2014, 27, 132–140. [Google Scholar] [CrossRef] [PubMed]
- Liu, C.; Guo, Y.; Zhao, F.; Qin, H.; Lu, H.; Fang, L.; Wang, J.; Min, W. Potential mechanisms mediating the protective effects of a peptide from walnut (Juglans mandshurica Maxim.) against hydrogen peroxide induced neurotoxicity in PC12 cells. Food Funct. 2019, 10, 3491–3501. [Google Scholar] [CrossRef] [PubMed]
- Liu, T.; Zhang, L.; Joo, D.; Sun, S.C. NFκB signaling in inflammation. Signal. Transduct. Target. Ther. 2017, 2, 17023. [Google Scholar] [CrossRef] [PubMed] [Green Version]
- Shimada, K.; Crother, T.; Karlin, J.; Dagvadorj, J.; Chiba, N.; Chen, S.; Ramanujan, V.K.; Wolf, A.; Vergnes, L.; Ojcius, D.; et al. Oxidized mitochondrial DNA activates the NLRP3 inflammasome during apoptosis. Immunity 2012, 36, 401–414. [Google Scholar] [CrossRef] [PubMed] [Green Version]
- Liang, J.; Li, L.; Sun, Y.; He, W.; Wang, X.; Su, Q. The protective effect of activating Nrf2/HO-1 signaling pathway on cardiomyocyte apoptosis after coronary microembolization in rats. BMC Cardiovasc. Disord. 2017, 17, 272. [Google Scholar] [CrossRef] [PubMed] [Green Version]
- Sah, S.K.; Lee, C.; Jang, J.; Park, G.H. Effect of high-fat diet on cognitive impairment in triple-transgenic mice model of Alzheimer’s disease. Biochem. Biophys. Res. Commun. 2017, 493, 731–736. [Google Scholar] [CrossRef]
- Wang, S.; Zheng, L.; Zhao, T.; Zhang, Q.; Liu, Y.; Sun, B.; Su, G.; Zhao, M. Inhibitory effects of walnut (Juglans regia) peptides on neuroinflammation and oxidative stress in lipopolysaccharide-induced cognitive impairment mice. J. Agric. Food Chem. 2020, 68, 2381–2392. [Google Scholar] [CrossRef]
- Sánchez-González, C.; Ciudad, C.J.; Noé, V.; Izquierdo-Pulido, M. Health benefits of walnut polyphenols: An exploration beyond their lipid profile. Crit. Rev. Food Sci. Nutr. 2017, 57, 3373–3383. [Google Scholar] [CrossRef] [Green Version]


| Antibody | Catalog | Conc. | Manufacturer |
|---|---|---|---|
| β-actin | sc-69879 | 1:1000 | Santa Cruz Biotech (Dallas, TX, USA) |
| AChE | sc-373901 | 1:1000 | Santa Cruz Biotech (Dallas, TX, USA) |
| p-JNK | sc-6254 | 1:1000 | Santa Cruz Biotech (Dallas, TX, USA) |
| p-Akt | sc-514032 | 1:1000 | Santa Cruz Biotech (Dallas, TX, USA) |
| p-tau | sc-12952 | 1:1000 | Santa Cruz Biotech (Dallas, TX, USA) |
| IDE | sc-393887 | 1:1000 | Santa Cruz Biotech (Dallas, TX, USA) |
| Aβ | sc-28365 | 1:1000 | Santa Cruz Biotech (Dallas, TX, USA) |
| BAX | sc-7480 | 1:1000 | Santa Cruz Biotech (Dallas, TX, USA) |
| Caspase-1 | sc-392736 | 1:1000 | Santa Cruz Biotech (Dallas, TX, USA) |
| TNF-α | sc-393887 | 1:1000 | Santa Cruz Biotech (Dallas, TX, USA) |
| IL-1β | sc-4592 | 1:1000 | Santa Cruz Biotech (Dallas, TX, USA) |
| HO-1 | sc-136960 | 1:1000 | Santa Cruz Biotech (Dallas, TX, USA) |
| ChAT | 20747-1AP | 1:1000 | Bioneer (Daejeon, Korea) |
| p-NF-κB | #3033 | 1:1000 | Cell Signaling Tech (Danvers, MA, USA) |
| Caspase-3 | CSB-PA05689A0Rb | 1:1000 | Cusabio (Hubei, China) |
| Peak No. | RT a (min) | Negative Ion Mode (m/z) | MSE Fragments (m/z) | Proposed Compound | Compounds Formula |
|---|---|---|---|---|---|
| 1 | 4.05 | 783.06 | 481.06, 300.99, 275.02 | Pedunculagin/casuariin isomer (bis-HHDP-glucose) I | C34H24O22 |
| 2 | 4.21 | 633.07 | 481.06, 300.99 | Strictinin | C27H22O18 |
| 3 | 4.30 | 783.06 | 481.06, 300.99, 275.02 | Pedunculagin/casuariin isomer (bis-HHDP-glucose) II | C34H24O22 |
| 4 | 4.52 | 289.07 | 245.08 | (−)-Epicatechin | C15H14O6 |
| 5 | 4.58 | 785.07 | 483.07, 300.99, 275.02, 169.01 | Tellimagrandin I (Digalloyl-HHDP-glucopyranose) | C34H26O22 |
| 6 | 4.79 | 433.03 | 300.99, 299.98 | Ellagic acid-O-pentoside | C19H14O12 |
| 7 | 5.01 | 300.99 | 302.00 | Ellagic acid | C14H6O8 |
| Groups | NC | HFD | GC20 | GC50 |
|---|---|---|---|---|
| LDH (U/L) | 280.29 ± 79.82 | 782.14 ± 231.88 ** | 660.43 ± 244.87 | 537.57 ± 127.19 # |
| TG (mg/dL) | 95.00 ± 19.17 | 122.00 ± 11.49 * | 118.14 ± 12.93 | 109.29 ± 12.72 # |
| TCHO (mg/dL) | 124.14 ± 14.3 | 215.57 ± 21.16 ** | 215.00 ± 35.72 | 201.29 ± 37.75 |
| LDLC (mg/dL) | 22.00 ± 4.26 | 59.74 ± 5.24 ** | 39.53 ± 10.24 ## | 33.33 ± 20.71 ## |
| HDLC (mg/dL) | 83.86 ± 9.19 | 131.43 ± 18.18 ** | 157.43 ± 25.83 | 150.86 ± 25.39 |
| HTR (%) | 67.63 ± 2.14 | 60.77 ± 3.35 ** | 70.80 ± 9.67 | 69.61 ± 8.23 |
| Group | NC | HFD | GC20 | GC50 |
|---|---|---|---|---|
| Brain (g) | 0.36 ± 0.04 | 0.36 ± 0.03 | 0.36 ± 0.04 | 0.35 ± 0.02 |
| Liver (g) | 1.28 ± 0.27 | 2.67 ± 0.31 ** | 1.70 ± 0.16 ## | 1.54 ± 0.34 ## |
| Hepatic lipid (mg/g) | 6.83 ± 0.13 | 19.58 ± 2.93 ** | 15.28 ± 0.86 # | 10.28 ± 2.75 ## |
| Perirenal WAT fat (g) | 0.12 ± 0.10 | 0.35 ± 0.11 ** | 0.40 ± 0.06 | 0.40 ± 0.07 |
| Retroperitoneal WAT fat (g) | 0.29 ± 0.19 | 1.23 ± 0.33 ** | 0.71 ± 0.28 ## | 0.75 ± 0.17 ## |
| Epididymal WAT fat (g) | 1.25 ± 0.39 | 2.22 ± 0.54 ** | 1.65 ± 0.49 # | 0.94 ± 0.73 ## |
| Mesenteric WAT fat (g) | 0.25 ± 0.13 | 0.90 ± 0.22 ** | 0.91 ± 0.27 | 0.95 ± 0.09 |
| Total WAT fat (g) | 2.00 ± 0.45 | 4.39 ± 0.29 ** | 3.50 ± 0.05 # | 3.26 ± 0.40 ## |
Publisher’s Note: MDPI stays neutral with regard to jurisdictional claims in published maps and institutional affiliations. |
© 2022 by the authors. Licensee MDPI, Basel, Switzerland. This article is an open access article distributed under the terms and conditions of the Creative Commons Attribution (CC BY) license (https://creativecommons.org/licenses/by/4.0/).
Share and Cite
Moon, J.H.; Kim, J.M.; Lee, U.; Kang, J.Y.; Kim, M.J.; Lee, H.L.; Jeong, H.R.; Go, M.J.; Kim, H.-J.; Park, H.W.; et al. Walnut Prevents Cognitive Impairment by Regulating the Synaptic and Mitochondrial Dysfunction via JNK Signaling and Apoptosis Pathway in High-Fat Diet-Induced C57BL/6 Mice. Molecules 2022, 27, 5316. https://doi.org/10.3390/molecules27165316
Moon JH, Kim JM, Lee U, Kang JY, Kim MJ, Lee HL, Jeong HR, Go MJ, Kim H-J, Park HW, et al. Walnut Prevents Cognitive Impairment by Regulating the Synaptic and Mitochondrial Dysfunction via JNK Signaling and Apoptosis Pathway in High-Fat Diet-Induced C57BL/6 Mice. Molecules. 2022; 27(16):5316. https://doi.org/10.3390/molecules27165316
Chicago/Turabian StyleMoon, Jong Hyun, Jong Min Kim, Uk Lee, Jin Yong Kang, Min Ji Kim, Hyo Lim Lee, Hye Rin Jeong, Min Ji Go, Hyun-Jin Kim, Hye Won Park, and et al. 2022. "Walnut Prevents Cognitive Impairment by Regulating the Synaptic and Mitochondrial Dysfunction via JNK Signaling and Apoptosis Pathway in High-Fat Diet-Induced C57BL/6 Mice" Molecules 27, no. 16: 5316. https://doi.org/10.3390/molecules27165316
APA StyleMoon, J. H., Kim, J. M., Lee, U., Kang, J. Y., Kim, M. J., Lee, H. L., Jeong, H. R., Go, M. J., Kim, H.-J., Park, H. W., Kim, C.-W., Park, S. J., & Heo, H. J. (2022). Walnut Prevents Cognitive Impairment by Regulating the Synaptic and Mitochondrial Dysfunction via JNK Signaling and Apoptosis Pathway in High-Fat Diet-Induced C57BL/6 Mice. Molecules, 27(16), 5316. https://doi.org/10.3390/molecules27165316