Article

Anaerobic Digested Wastewater CO2 Sequestration Using a Biophotocatalytic System with a Magnetized Photocatalyst (Fe-TiO2)

by
Emmanuel Kweinor Tetteh
*,
Gloria Amo-Duodu
and
Sudesh Rathilal
Green Engineering Research Group, Faculty of Engineering and the Built Environment, Department of Chemical Engineering, Durban University of Technology, Steve Biko Campus (S4 Level 1) Box 1334, Durban 4000, South Africa
*
Author to whom correspondence should be addressed.
Molecules 2022, 27(16), 5213; https://doi.org/10.3390/molecules27165213
Submission received: 16 July 2022 / Revised: 10 August 2022 / Accepted: 10 August 2022 / Published: 16 August 2022

Abstract

:
This study presents a biophotocatalytic system as a sustainable technology for the recovery of clean water and renewable energy from wastewater, thereby providing a unique opportunity to drive industrialization and global sustainable development throughputs. Herein, inhouse magnetized photocatalyst (Fe-TiO2) with surface area 62.73 m2/g synthesized via co-precipitation, was hypothesized to hasten an up-flow anaerobic sludge blanket (UASB) reactor for the treatment of local South Africa municipality wastewater with the benefit of high-quality biogas production. A lab scale UASB process with a working volume of 5 L coupled with two UV-lights (T8 blacklight-blue tube, 365 nm, 18 W) was operated batchwise under mesophilic conditions for the period of 30 days with a constant organic load charge of 2.76 kg COD/m3. d. This biophotocatalytic system performance was investigated and compared with and without the Fe-TiO2 charge (2–6 g) with respect to effluent quality, biogas production and CO2 methanation. Using chemical oxygen demand (COD) measured as the degree of degradation of the pollutants, the best efficiency of 93% COD removal was achieved by a 4 g Fe-TiO2 charge at 14 days and pH of 7.13, as compared to zero charge where only 49.6% degradation was achieved. Under the same charge, cumulative biogas and methane content of 1500 mL/g COD.d and 85% were respectively attained as compared with the control with 400 mL/g COD.d and 65% methane content. Also, the energy produced can be used to offset the energy utilized by the UV-light for the wastewater abatement and other limitations of photocatalysis. The BP system was found to be an eco-friendly and cost-effective technology to be explored in water treatment settings.

1. Introduction

In recent years, the industrial revolution has been exploiting resources for manufacturing and consumption with no provisions for waste reuse or economic regeneration [1]. Herein, the world’s linear economy is shown to be at a critical point of fossil fuel depletion with environmental challenges [2,3]. Against this background, it is time to consider waste resource utilization towards a sustainable circular economy [4,5,6]. In essence, biogas production from wastewater could help to address the global economy, as well as ecological and CO2 anthropogenic emission concerns [7,8]. As a result, implementing a CO2-based circular economy could help alleviate CO2 emissions and pave the way for future resource independence [4,6]. Therefore, developing biological CO2 sequestration technology with environmental benefits becomes very critical.
Consequentially, industrial wastewater containing refractory chemicals (e.g., synthetic dyes, phenolics, emerging contaminants) has had a detrimental effect on the ecosystem and human health and has hastened the global debate on clean water and sanitation [3,9,10,11]. However, the conventional wastewater technologies (coagulation, chlorination, biodegradation) are not cost-effective nor efficient in removing recalcitrant pollutants from the wastewater [10,12,13,14,15]. This warrants new technological solutions for effective, economical, and environmentally friendly wastewater treatment for reuse and sustainability. Standalone treatments are classically limited; for instance, anaerobic digestion (AD) has been a biological tool for producing biogas from wastewater treatment [4,16,17]. However, due to self-inhibition at high pollutant concentrations, accumulation of intermediate metabolites and slow kinetics, conventional AD is generally ineffective in treating refractory pollutants [16,18,19,20]. In addressing this setback, a combination of biocatalysis with photocatalysis is receiving significant interest due to their single treatment inefficiency or high cost. Rodríguez-Couto [21] reported on biophotodegradation of emerging pollutants from the wastewater as a promising technology. Molla, et al. [22] also reviewed recent trends in nanomaterials and nanocomposites for environmental applications. In addition, engineered magnetized photocatalysts could easily be separated from a solution by an external magnet after the biophotocatalytic activity [23,24,25]. Herein, in a biophotocatalytic sequential system, a number of limitations can still be observed, including high electricity consumption, high building costs, and high operating expenses [21]. The aforementioned drawbacks can be overcome by combining photochemical and biological techniques, resulting in photocatalysis and biodegradation occurring simultaneously [26]. This method will enable the treatment of wastewater containing recalcitrant organic contaminants to have synergy.
Therefore, in this study, an up-flow anaerobic sludge blanket (UASB) reactor was coupled with UV lights as a biophotocatalytic (BP) system was investigated for a local South Africa wastewater treatment. To evaluate its efficacy for rapid degradation of the contaminants, along with biogas production, the application of a previously engineered magnetized photocatalyst (Fe-TiO2) was introduced into the BP system. In addition, suitable kinetic models and the price of the energy that the bioenergy produced were assessed.

2. Results

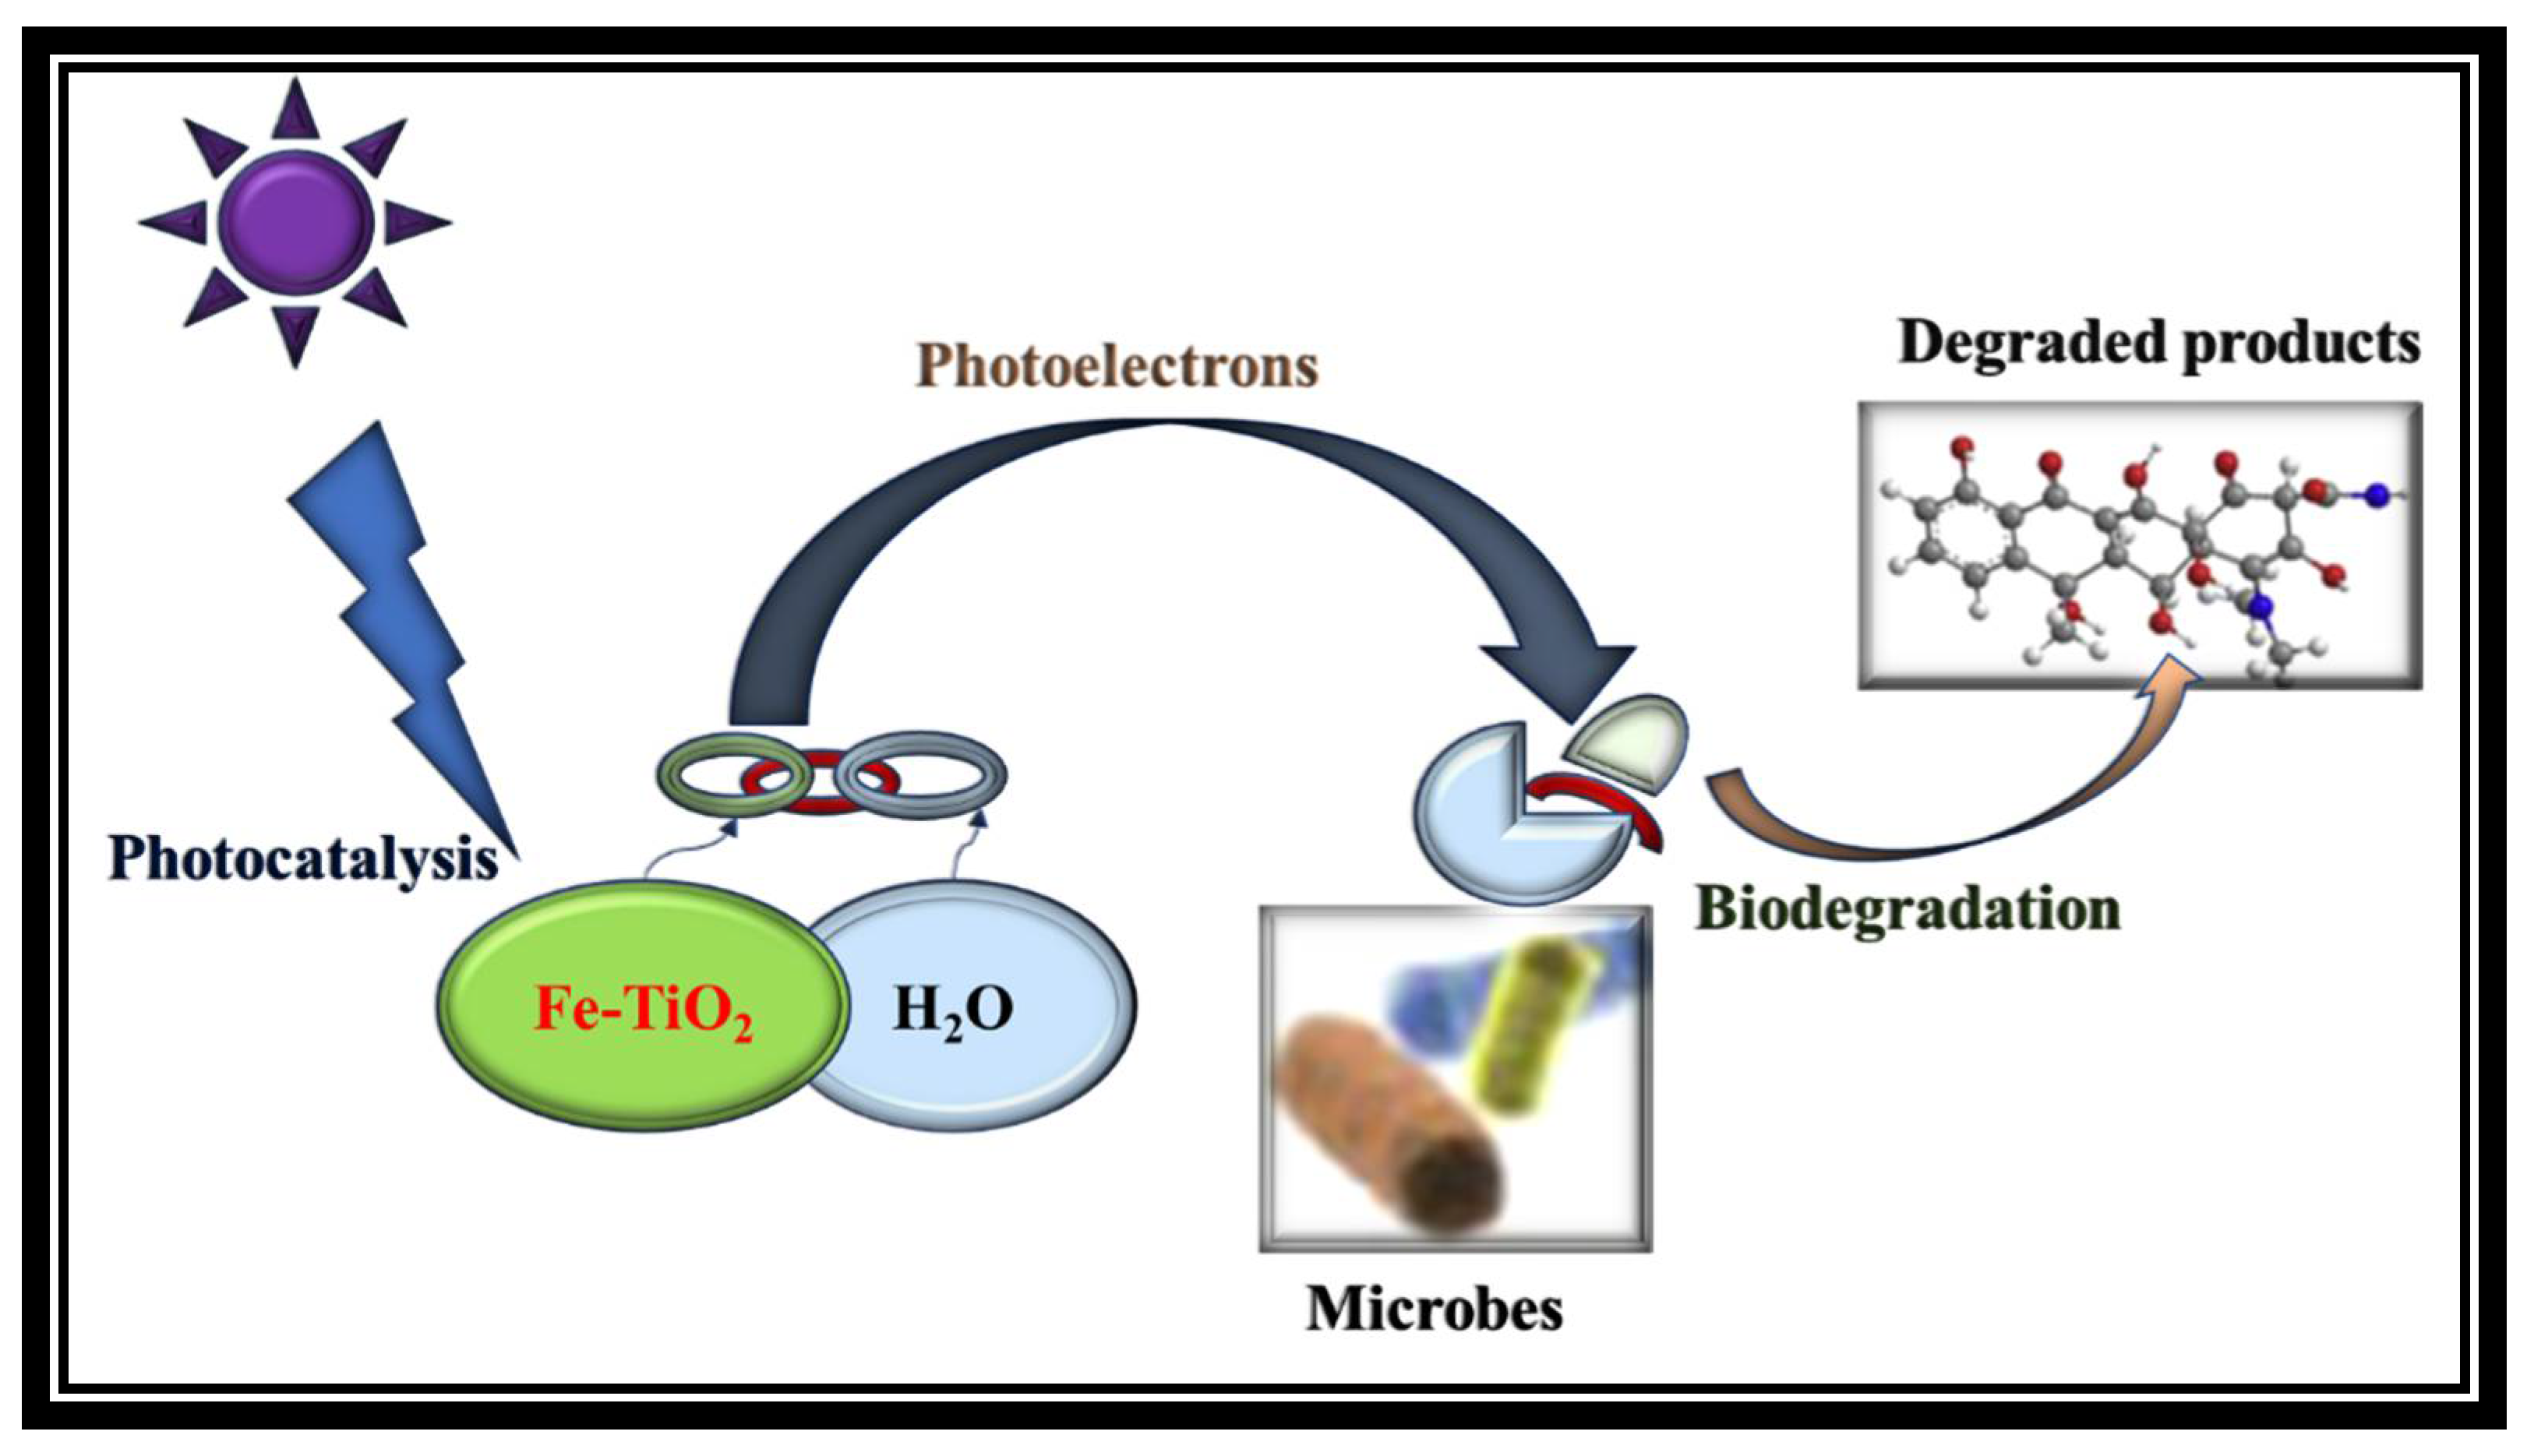
In this study, biocatalysts (microorganisms or enzymes) and a photochemical catalyst (Fe-TiO2) were explored to convert wastewater from eco-destructive to bioenergy resource-saving with ecological benefits. Brunauer–Emmett–Teller (BET) Micrometric analyser (TriStar II Plus, Norcross, GA, USA) revealed the inhouse Fe-TiO2 had high surface area (62.73 m2/g) as compared to the conventional TiO2 (25.7 m2/g). This transformation and surface area modification were due to the incorporation of the Fe3O4 (27.6 m2/g). The phase identification results by X-ray diffraction (XRD) (Bruker AXS, D8 Advance, Germany), coupled with PANalytical software (Empyrean, PRO MPD, Netherlands), also revealed the crystalline structure of maghemite (γ-Fe2O3), magnetite (Fe3O4), and anatase with respective files of JCPDS 00-070-2091, JCPDS00-019-0629 and JCPDS 00-021-0428. The combination of photons (UV-light) and engineered magnetized photocatalyst (Fe-TiO2) with the ability to use UV-light energy was introduced into a BP system. This concept, as shown in Figure 1, originates from photosynthesis and the water-molecule splitting technique as an option for renewable-energy production [26]. The Fe-TiO2 electrons (h+ and e), once illuminated by the UV-light, becomes excited as charged carriers, which are then transported via diffusion mass transfer. In the bio-photo sequence, the biodegradable pollutants were treated biologically, whereas the nonbiodegradable pollutants were photodegraded [21,26]. Also, the kinetic study, as well as the biogas output and composition, were monitored. In addition, to elucidate the business model of the BP system, the power generated to compensate for the UV-light energy was estimated.

2.1. Treatability Efficiency of the BP System

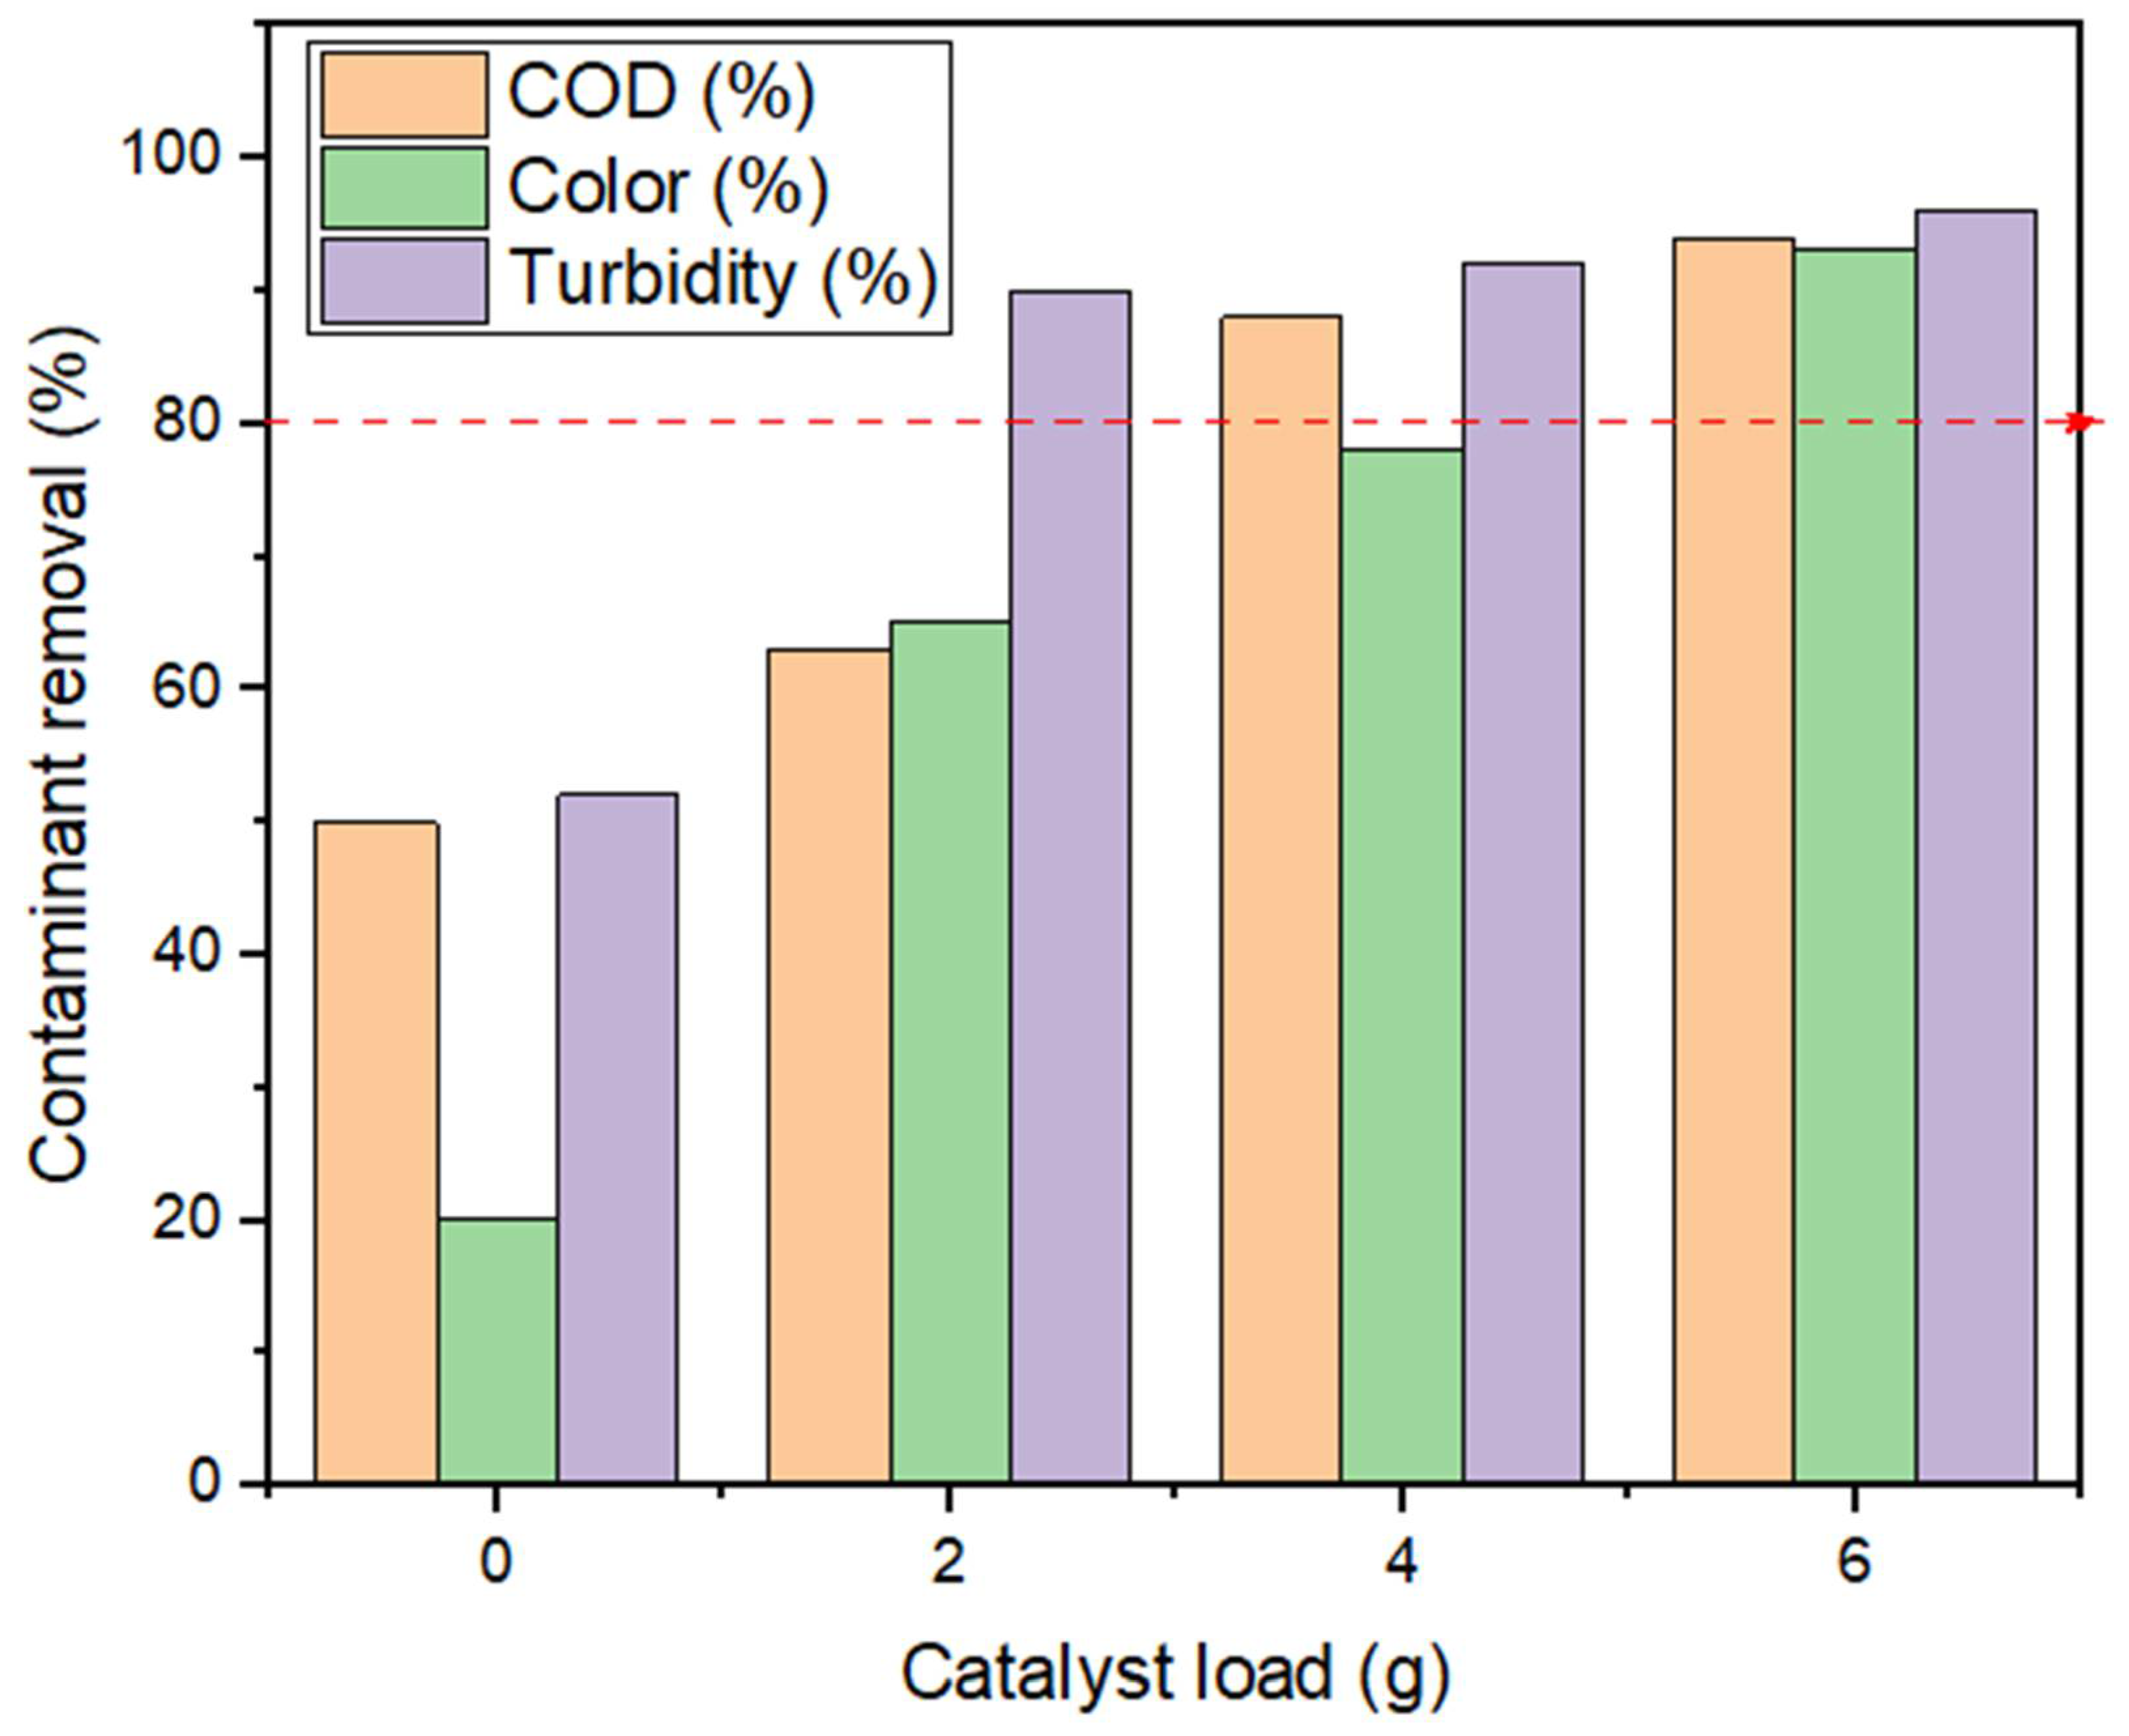
The wastewater sample was biophotocatalytically treated with the BP system operated at different sludge retention times (SRTs) of 14, 21 and 29 days, representing a weekly dose of 2 g Fe-TiO2 for week 2–4. As shown in Figure 2, increasing the catalyst load from 2 g to 6 g Fe-TiO2 for the 2–4 weeks increased the contaminant removal in terms of COD, color and turbidity to above 80%. Table 1 presents a summary of the final effluent concentration of other water parameters per the catalyst load charged for a week.

2.2. The BP System Biogas Production

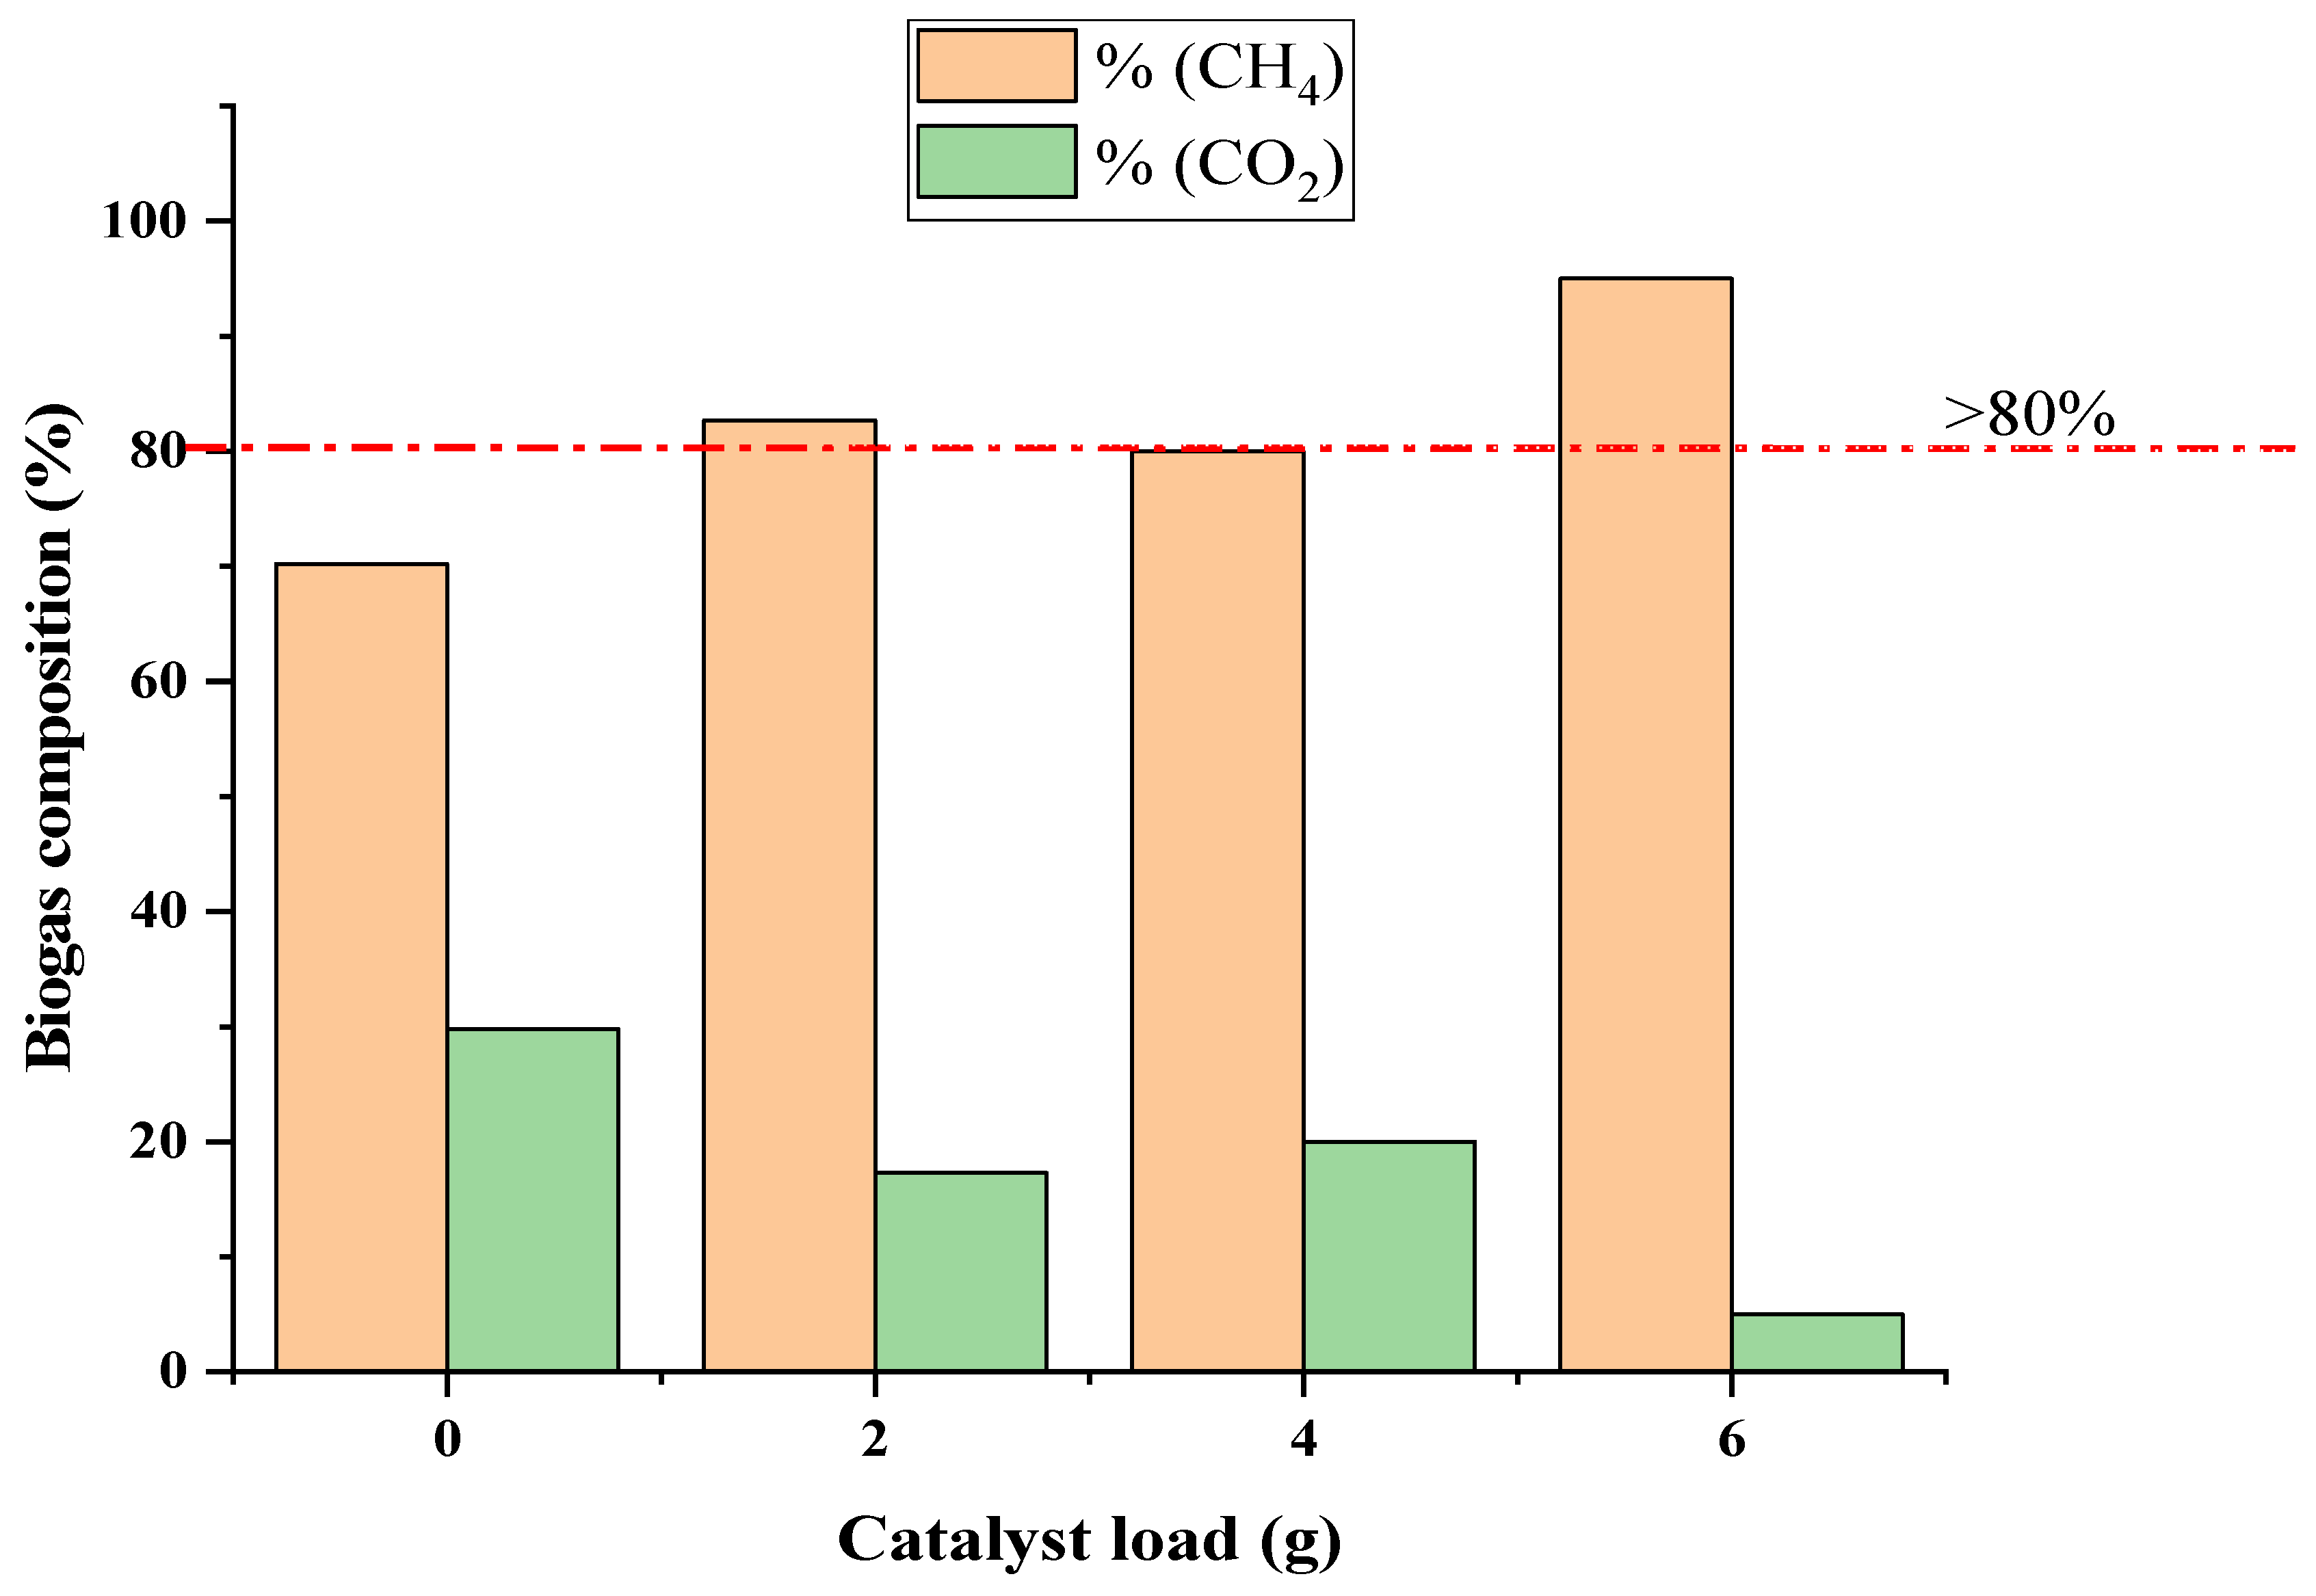
Ideally, AD produces biogas by breaking down high organic molecules of the wastewater, whereas mineralization of the organic molecules via UV photodegradation requires energy. This necessitated the weekly biogas production monitoring and characterization of the BP system. The results obtained are presented in Figure 3, depicting the effect of the catalyst load (Fe-TiO2) on biogas production for the 30 days. The cumulative biogas data obtained was fitted on the first order and modified Gompertz kinetic models with information presented in Table 2. The weekly biogas characterized composition with over 80% CH4 improvement, as compared to the week with no dosage of the Fe-TiO2, is presented in Figure 4. Also, the energy cost from the BP system biogas produced is presented in Table 3. Figure 5 also shows the biophotocatalytic pathway of degrading organic contents of using the Fe-TiO2.

3. Discussion

3.1. Effect of Catalyst Load on Contaminant Reduction

The effect of the catalyst load was conducted ranging from 2 g to 6 g, while keeping other parameters constant with an initial effluent concentration of 2380 mg COD/L of municipality wastewater. Prior to this, a zero charge of the catalyst load was initially conducted as a control to observe the impact of the catalyst load. This was carried out to understand the mechanism of how the catalyst helps with photodegradation of the organic contaminants. As shown in Figure 2, the color removal efficiency was greater than the COD by 5% at a catalyst load of 2 g, implying that there was mineralization of color-causing bonds (chromophores) in the wastewater [27,28]. The best efficiency of COD, color, turbidity and reduction of other organic contaminants (Table 1) was achieved when the reactor had adapted/stabilized in the fourth week (4). Also, the presence of the UV light caused illumination and excitation on the surface of the Fe-TiO2, whereby the excited radicals/electrons moved from the catalyst valance band to the conduction band, creating a hole on the surface for easing adsorption of the pollutants [27,29,30]. This elucidates that the Fe-TiO2 had potential of electron transfer (Figure 1), whose charge induced separation species (Fe, e, h+) by the absorption of the photons. This influenced the degradability of the high organic pollutants (>80% COD removal) at a high catalyst load of 6 g Fe-TiO2, as shown in Figure 2.
Furthermore, the Fe-TiO2 composite had the tendency to have nutrient rich elements (Fe) with strong photocatalytically induced catalyst (TiO2), which influenced the microbial activity (biodegradation). In fact, this mechanism produced active radicals which photocatalytically induced the degradation of the wastewater, while suppressing the oxidation-reduction potential of antibacterial activity [31]. The reaction mechanism, as presented (1–4), shows what the hole and electron species created, reacting with the oxygen or water molecules to produce peroxide or hydroxyl species which in turn act as reactive oxidation reduction agents of the pollutants [31,32].
Exposure   to   UV light   ( excitation )   TiO 2 + hv e + h +
Recombination   e + h + hv
Superoxide   ion   radical   O 2 +   e O 2 *
Hydroxyl   radicals   OH + h + OH *
The iron (III) ions of the Fe-TiO2 also behave as electrons (5 and 6) and hole traps (7 and 8), which influence the photocatalytic activity via the mass electron transfer.
Electron   transfer   Fe 3 + +   e Fe 2 +
Electron   transfer   Fe 2 + + O 2   Fe 3 + + O 2 *
Hole   trap   Fe 3 + + h + Fe 4 +
Hole   trap   Fe 4 + + OH Fe 3 + +   OH *
From Table 1, the balanced pH within 7.13 to 7.69, COD (12–115 mg COD/L) and VS/TS ratio < 0.5 proves that there was a degradation of organics. Also, the production of nitrates (TN) and ammonium (NH4+) during the degradation pathway suggests that there was mineralization of the recalcitrant nitrogen-containing organic compounds, such as TKN, NO3-N, and NH4+ in different proportions [27,30]. Thus, during the reductive pathway, the amount of TN present in the wastewater, at a high oxidation state, produced more unstable intermediates such as TKN and NH4+ [21]. Likewise, in the lower oxidation state, most of the elemental nitrogen molecules detached resulting in nitrites (NO3). Also, the more NH4+ produced than NO3 in this investigation, the more nitrogen atoms elucidated in the wastewater stream had a higher oxidation state and were eliminated via the photocatalysis pathway compared to the biological route [21,27].

3.2. Biophotocatalytic CO2 Sequestration

As mentioned, anthropogenic CO2 emissions are of global concern, whereby wastewater treatment cannot be exempted. Conventionally, the production of biogas from wastewater via AD systems is kinetically slow with the poor quality of both water and biogas warranting a more robust technology. For this purpose, the BP system was employed to investigate the effect of the catalyst load (Fe-TiO2) on the CO2 sequestration from anaerobically digested biogas for its methane enhancement.
Figure 3 shows the BP system cumulative biogas (5150 mL) obtained for the duration of 30 days with respect to the weekly catalyst load (2–6 g Fe-TiO2). The average amount of biogas weekly recorded was 110 mL (zero charge), 270 mL (2 g charge), 285 mL (4 g charge), and 55 mL (6 g charge). It was found that the biogas production increased from the zero-charged catalyst up to the 6 g charged, where there was retardation of the biogas production from the 21st day to the 30th day. This reduction in production might be due to the optimum load of the catalyst (4 g), where the excess catalyst and other intermediate compounds generated inhibited the biogas production. Thus, the microorganism activity was hampered by the high catalyst load from the 21st to the 30th day, which will require a longer period for the microorganisms to adjust and adapt to that condition. Conversely, the highest amount of the catalyst load (6 g) charged increased the methane yield (70% CH4) of the zero charge to 95% CH4 as depicted in Figure 4.
The modified Gompertz model was selected as best fit (R2 = 0.9917), based on the statistical analysis of the cumulative biogas (p < 0.05). The weekly addition of the Fe-TiO2 at 4 g delivered the highest biogas yields in comparison with others (Figure 3), whereas the addition of Fe-TiO2 at 6 g significantly increased the methane yield (Figure 4). This performance could be a result of the presence of Fe and TiO2, which served as a direct electron transfer species [33,34], and which facilitated the CO2 photoreduction mechanism to generate more methane (>80% CH4). Also, the UV-light, together with the catalyst load charged, stimulated the methanogen activity, which resulted in more of the methane being produced. Additionally, the photocatalysis phenomenon generates radical species (OH and H+) which served as a reducing agent [27,33,35], hence converted the CO2 to CH4.
Generally, degradation of organic content into biogas involves hydrolysis, acidogenesis, acetogenesis and methanogenesis. Notwithstanding, at the hydrolysis and acidogenesis stages, more complex radical ions forming on the surface of the Fe-TiO2 prompted the photocatalytic reactions (9–10) by the reactive oxygen species (ROSs) of hole and electron produced (h+, e). These radicals then react with dissolved oxygen forming HO2* and CO2. The reaction then enhances the formation of carbon dioxide and iron (II) oxalate complex (11), which are easy to be decomposed via the methanogenesis phase (methane formation).
Fe TiO hv e ( CB ) + h + ( VB )
h + + HC 2 O 4 CO 2 + COOH
2 [ Fe ( C 2 O 4 ) 2 ] 3   hv   2 [ Fe ( C 2 O 4 ) 2 ] 2 + C 2 O 4 2 + 2 CO 2
Furthermore, the ROSs further react with dissolved oxygen that provides compounds with an ozonide-like structure, favoring the formation of ring-opening products such as methane [24,27,30]. Methane, which is one of the key components of biogas, involves the conversion of acetate or the decomposition of CO2 via hydrogeneration (12–14) by either acetotrophic or hydrogenotrophic microorganisms.
CO 2 + 4 H 2 CH 4 + 2 H 2 O   Δ G 0 = 130.7   kJ mol
2 CO 2 + 4 H 2 CH 3 COOH + 2 H 2 O   Δ G 0 = 104.5   kJ mol
CH 3 COOH CH 4 + 2 H 2 O   Δ G 0 = 31   kJ mol
Figure 5 shows that there are biochemical pathways for the decomposing CO2 in biogas to methane via the biophotodegradation of organic content of wastewater. Herein, the BP system being coupled with UV light ignited the Fe-TiO2 (photocatalyst) and indirectly produced the H2 source from the hydrolysis of the water molecules splitting [26]. This H2 is extremely important to the overall process of biophotocatalytic degradation because it ensures that the biochemical reaction is carried out in a state of equilibrium [27,28]. Through the activity of methanogenic microorganisms, this in situ source of H2 in the BP system reacts with CO2, which results in the production of CH4. The hydrogenotrophic methanogenesis and the Wood–Liungdahl pathways are the two possible operational paths that can take place in an ideal situation [28]. In accordance with Equation (12), the direct conversion of CO2 to CH4 is carried out by hydrogenotrophic methanogenesis, which also involves the contribution of H2 as a source of electrons, whereas the Wood–Ljungdahl pathway includes two reactions in Equations (13) and (14) that indirectly convert CO2 to CH4 [28].

3.3. The BP System Bioenergy Estimation

The BP system was explored to recover bioenergy from its anaerobically digested wastewater as a beneficial option to offset the energy required by the UV-light. Generally, biogas constitute about 60–65% methane and 35–40% carbon dioxide [27], hence estimating 60% of 1 m3 biogas produced as energy is equivalent to 6 kWh. Herein, biogas as a renewable and sustainable energy source can be used to produce heat or electricity in place of fossil fuel [26,36,37]. In this study, the energy estimation is carried out to evaluate the amount of electricity that can be produced from the biogas generated and how much of it can be used to offset the UV-light power required. At 6 g Fe-TiO2 charged (Figure 3), a cumulative biogas of 0.00515 m3 yielded 90% methane (Figure 4) with energy content of 0.0464 kWh. From Table 3, assuming 75% of this energy can be converted into electricity resulted in 0.0348 kW/h. Subsequently, the total energy consumption for the UV-light to degrade the unit mass of pollutant above 80% (Figure 2) was estimated as 0.0180 kWh with net-energy of 0.0168 kWh. Also, the projected cost was estimated by adopting the basis and energy reports on biogas production from wastewater settings [26]. Herein, the energy cost per hour was found to be ZAR 0.054. From these estimations, it is determined that the BP system is energy-saving and cost-effective with a profit margin of $2.78 (ZAR 38.86) for 30 days.

3.4. Future Prospect of the BP System

Rapidly increasing water pollution due to the overwhelming discharge of an ever-increasing amount of different recalcitrant pollutants, combined with stricter environmental regulations, has resulted in a pressing need for the development of more efficient, commercially sustainable, and environmentally friendly water treatment technologies [2,3]. Thus, AD has been acknowledged as a successful process for converting vast amounts of organic waste from wastewater into biomethane [4,16]. However, AD produces large volumes of complex sludge, and the discharge of this sludge into the environment is a major source of environmental concern. Even though photocatalysis has the advantage of mineralizing resistant contaminants, it is also energy-intensive, making it a less desirable option. Development of the biophotocatalysis (BP) system, which involves the use of a biocatalyst (such as enzymes or microorganisms) in conjunction with photocatalysis, is a promising bioenergy technology that is currently in the early phases of exploration. Table 4 shows exemplary studies on biophotocatalysis for the removal of recalcitrant compounds. Notwithstanding, the use of the BP system demonstrated great potential to increase degradation efficacy of the wastewater above 80% COD removal. This resulted in an increase in the biogas yield and CH4 content. Because of this, the findings from this study will aid in compensating for the energy required when deploying the BP system in a real-world wastewater treatment setting. This will therefore assist in the paradigm shift of wastewater treatment towards water-energy benefits.

4. Materials and Methods

4.1. Wastewater Sample

The activated sludge and effluent sample were collected from a local South Africa municipality wastewater treatment plant based in the eThekwini municipality of the KwaZulu-Natal province. As shown in Figure 6, the effluent was collected at the downstream of the biofiltration system and was characterized by observing all standard procedures [43]. Table 5 shows the effluent characterized water parameters with their respective analytical instruments.

4.2. Magnetised Photocatalyst (Fe-TiO2)

The magnetized photocatalysts (Fe-TiO2) with a surface area of 62.73 m2/g used was inhouse engineered and characterized at the DUT, Chemical Engineering Research Lab, Steve Biko campus, S3L3, Durban, South Africa. The protocols used were in accordance with our previous work [26] and other studies [41,42]. All chemicals used, unless modified, were of analytical grade and obtained from Sigma Aldrich, South Africa. These included sodium hydroxide pellets (NaOH), ferrous sulphate heptahydrate (FeS04·7H2O), ferrous chloride hexahydrates (FeCl3·6H2O) and titanium dioxide Degussa P-25 (anatase 70% and surface area of 25.7 m2/g).
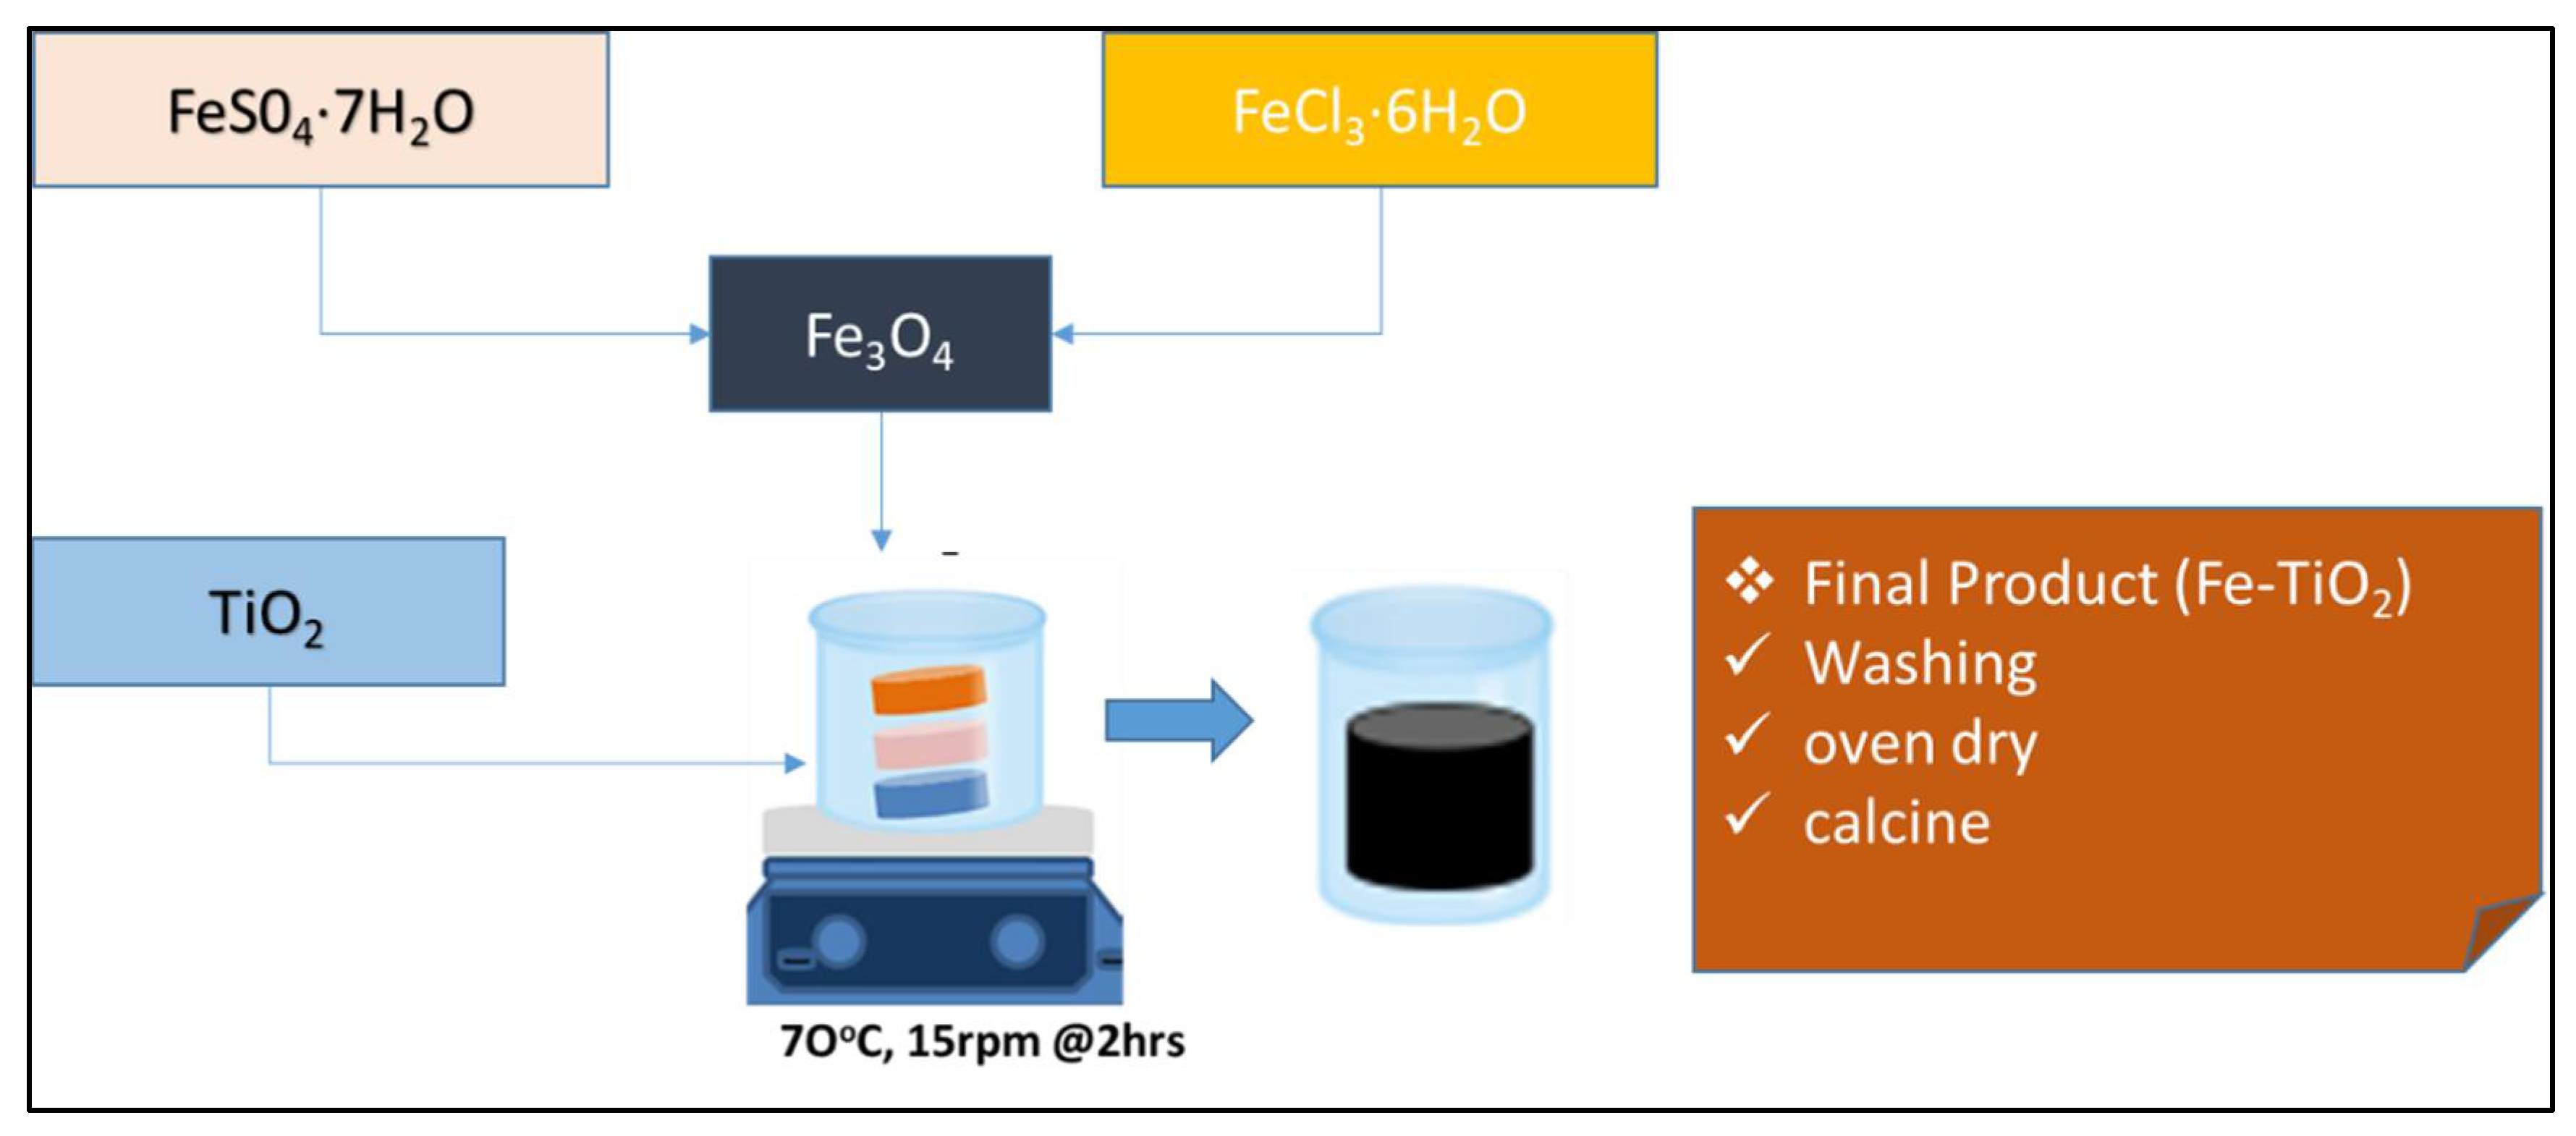
Figure 7 illustrates that the iron oxide nanoparticles ( Fe 3 O 4 ) were firstly formed from the aqueous Fe2+ and Fe3+ salt solutions by the addition of the NaOH (aid balance the pH) with the reaction expressed in Equation (15). Herein, the Degussa P25 TiO2 was then introduced into the solution and allowed for continuous stirring for 2 h until black precipitate was formed. The inclusion of Fe in the Fe-TiO2 expedited their paramagnetic phase transformation and charge reaction (16).
FeSO 4 · 7 H 2 O + 2 FeCl 3 · 6 H 2 O + 8 NaOH Fe 3 O 4 + 6 NaCl + 23 H 2 O + Na 2 SO 4  
Fe 3 + + Ti 4 + + 2 O 2 ( Fe 2 + + O 2 + Δ a ) + Ti 3 + + 1 2   O 2

4.3. Biophotocatalytic (BP) System Description

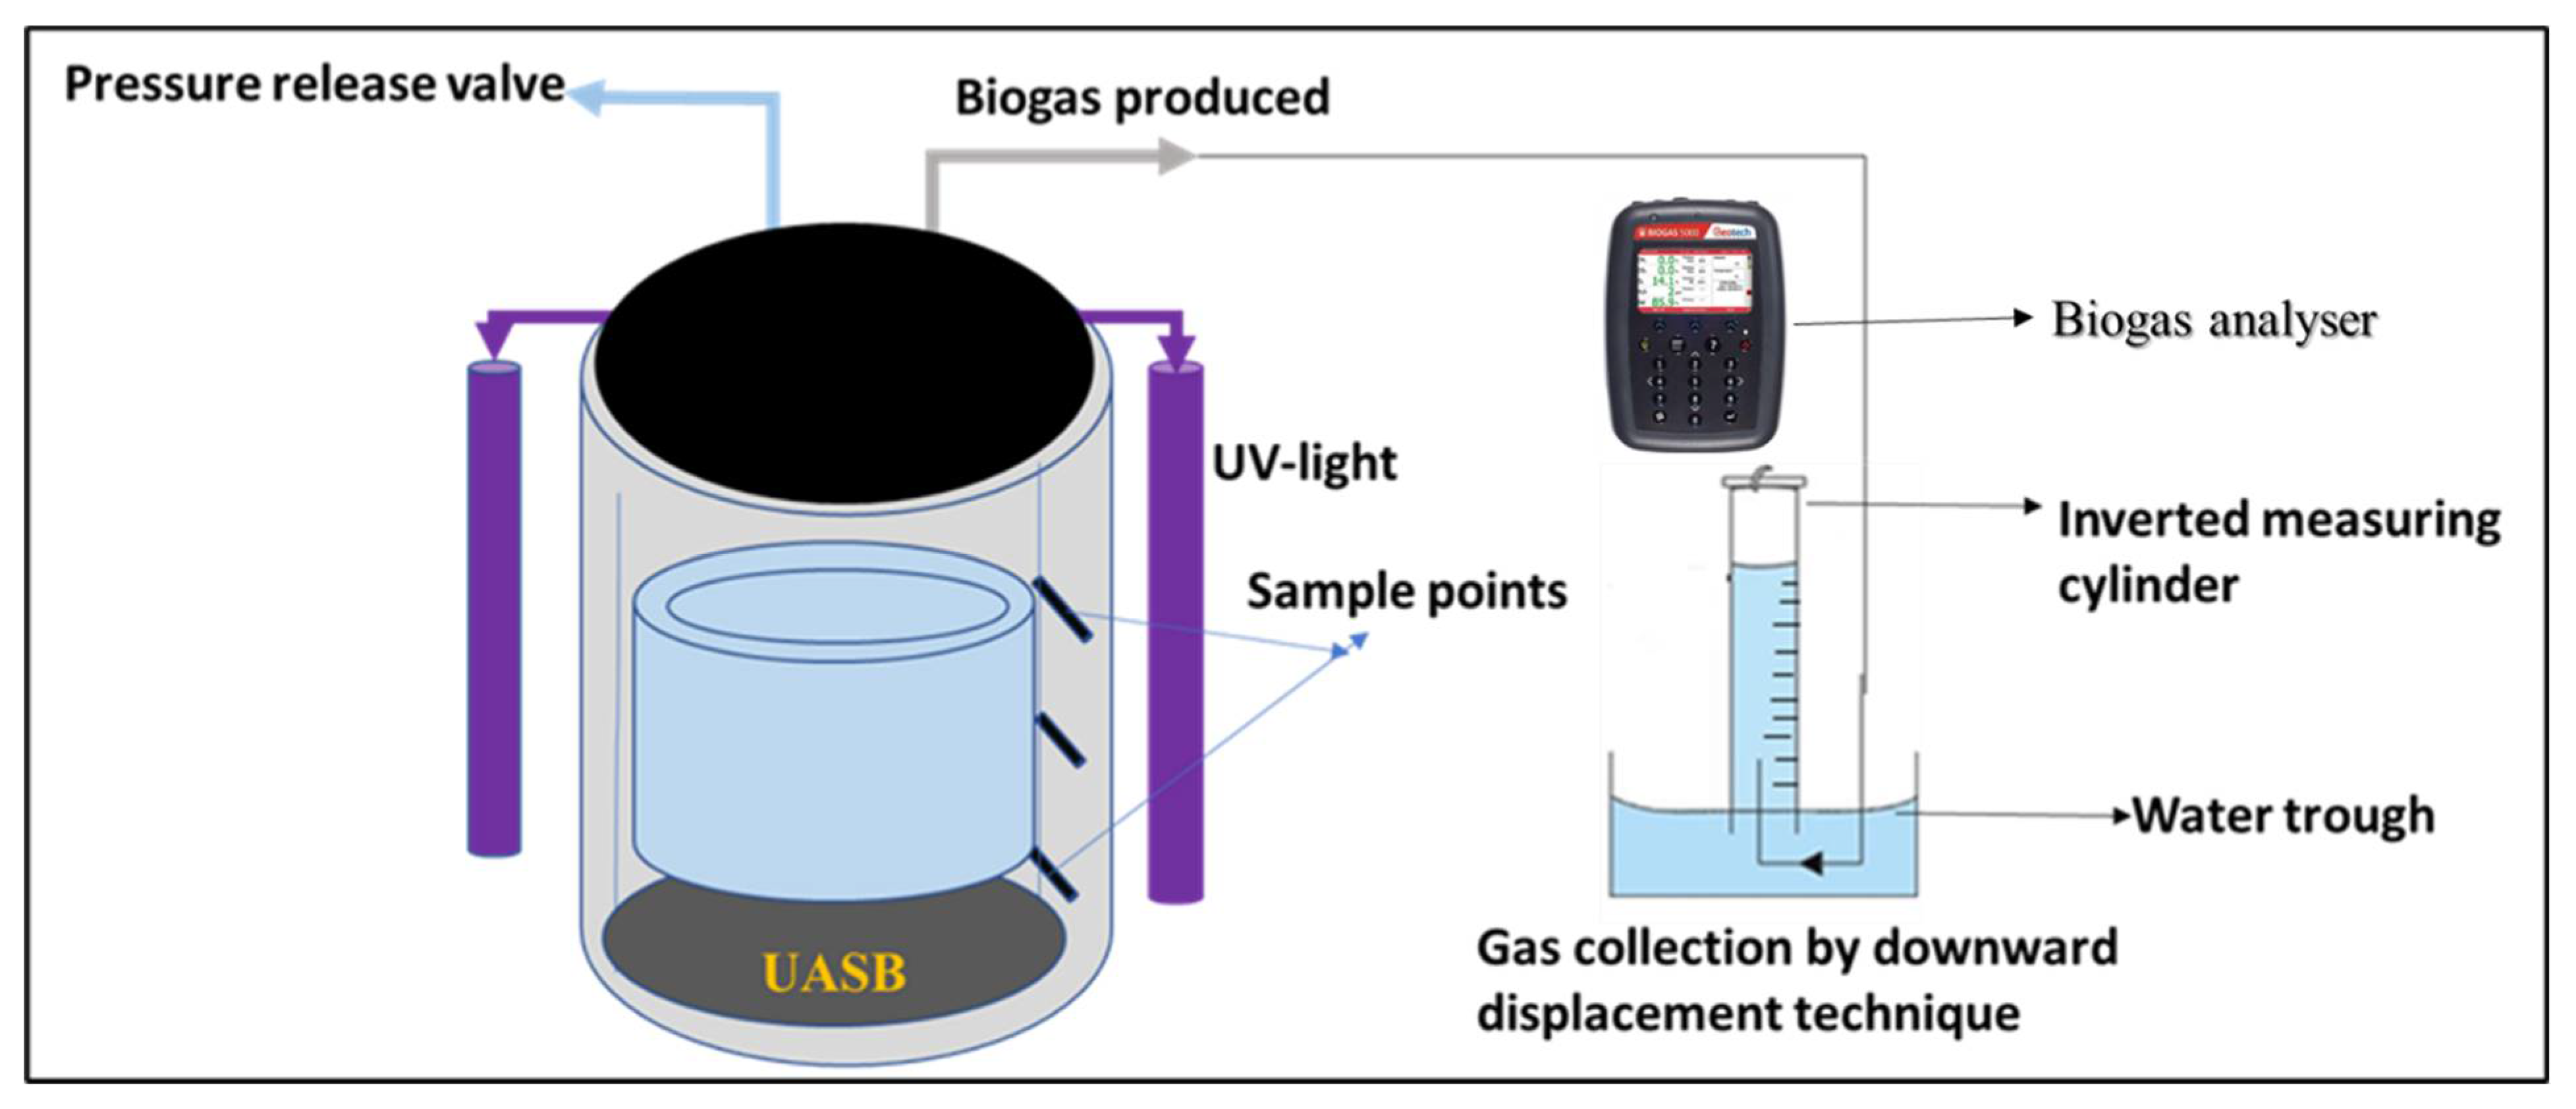
An upflow anaerobic sludge blanket (UASB) reactor constructed with Plexiglass coupled with UV-light bulbs (T8 blacklight-blue tube, 365 nm, 18 W, Philips, Amsterdam, Netherlands) was used as the BP system (Figure 8). The BP system was 60 cm in height and 20.7 cm in diameter with a total volume of 10 L and a working volume of 8 L with a headspace of 2 L. To reduce variations in temperature, continuous recycling of cooling water through the water jacket of the reactor was carried out using a water bath at constant temperature of 37.5 °C. Aside from the gas collection and purging port, there are sampling points which were used for the monitoring of the reactor performance with regards to effluent quality and sludge production, as well as desludging of the reactor. The BP system was run for four (4) weeks, and a weekly analysis of the water quality and biogas composition was done. The first week had no Fe-TiO2 addition, followed by the system being dosed with 2 g Fe-TiO2 every week until the fifth week when the system was shut down. However, a daily monitoring of the biogas produced was done via the downward displacement technique and the biogas composition was characterized with a Geotech Biogas 5000 Portable Biogas Analyzer (ISO17025). The contaminant removal percentage (%R) was evaluated using Equation (17).
R e a c t o r   e f f i c i e n c y   ( % R ) = ( C i C f C i ) × 100
where, C i = Initial sample concentration and C f = final sample concentration.
To establish the rate of degradation, the cumulative biogas obtained was modelled and compared with the pseudo first order (18) and modified Gompertz (19) kinetic models [44,45].
Y ( t ) = Ym   [ 1 exp ( kt ) ]
Y ( t ) = Ym . exp ( exp [ 2.7183 R max . Ym [ λ t ] ] + 1 )
where, Y(t) is cumulative of specific biogas yield (mL/g COD), Ym is maximum biogas production (mL/g COD), λ is lag phase period or minimum time to produce biogas (days), t is cumulative time for biogas production (days), Rmax is the maximum specific substrate uptake rate (mL/g COD.day), and k is a first-order rate constant (1/d).

5. Conclusions

The rise of water pollution and stringent regulations necessitate cost-effective and environmentally friendly solutions. As a result, the advancing of biological technologies is to make full usage of biogas produced and its by-products, as well as mitigating any disposal to the landfills in the water sector. Herein, the cost of implementing a standalone system to improve water and biogas quality has been a major barrier for its industrial application. Therefore, this study explored the biophotocatalysis (BP) system involving biocatalytic and photocatalytic mechanisms for degradation of a local South Africa wastewater into biogas. The resulting experimental data showed incorporating magnetized photocatalysts (Fe-TiO2) with a surface area of 62.73 m2/g improved the water quality (>80% COD, color, and turbidity removal), biogas production (5150 mL) and CO2 sequestration into methane (90% CH4). The cost-energy benefits were estimated based on the amount of electricity produced by the BP system from the biogas to subsidize the UV-light power required. At 6 g Fe-TiO2 charged, cumulative biogas of 0.00515 m3 yielded 90% CH4 with an energy content of 0.0464 kWh. By assuming 75% of this energy, electricity of 0.0348 kW/h was estimated. The BP system was found to be energy saving with a subsidized energy cost-profit margin of $2.78 (ZAR 38.86) for 30 days. The BP system then proved to be a cost-effective technology, as the bioenergy produced was able to compensate for the energy required by the UV-light. This shows that the development of BP systems, which is a combination of a photocatalyst and a biocatalyst, can overcome the constraints associated with only using a photocatalytic or biocatalytic system. Therefore, prospects of the BP system applicability and viability in a large-scale wastewater treatment setting should be given attention with regard to wastewater treatment and its bioeconomy.

Author Contributions

Conceptualization, E.K.T.; methodology, E.K.T. and G.A.-D.; investigation, G.A.-D.; writing of the original draft preparation, E.K.T. and G.A.-D.; administration, E.K.T.; writing—review and editing, S.R.; funding acquisition, E.K.T. and S.R.; supervision, S.R. All authors have read and agreed to the published version of the manuscript.

Funding

This research was funded by the Water Research Commission of South Africa under project identification WRC Project: C2019/2020-00212.

Institutional Review Board Statement

Not applicable.

Informed Consent Statement

Not applicable.

Data Availability Statement

Not applicable.

Acknowledgments

The authors wish to thank the Durban University of Technology, Green Engineering Research Group, and the Water Research Commission of South Africa. The corresponding author also wish to thank the National Research Foundation for the scholarship grant number 138046 and DUT PhD Training support program.

Conflicts of Interest

The authors declare no conflict of interest and the funders had no role in the design of the study; in the collection, analyses, or interpretation of data; in the writing of the manuscript or in the decision to publish the results.

Sample Availability

Samples of the compounds are not available from the authors.

References

  1. Tetteh, E.K.; Asante-Sackey, D.; Armah, E.K.; Rathilal, S. Tapping wastewater resource: Why and how? In Handbook of Biofuels; Elsevier: Amsterdam, The Netherlands, 2022; pp. 125–146. [Google Scholar]
  2. Sahani, S.; Sharma, Y.C.; Kim, T.Y. Emerging Contaminants in Wastewater and Surface Water. In New Trends in Emerging Environmental Contaminants; Springer: Berlin/Heidelberg, Germany, 2022; pp. 9–30. [Google Scholar]
  3. Ramakrishna, S.; Jose, R. Addressing sustainability gaps. Sci. Total Environ. 2022, 806, 151208. [Google Scholar] [CrossRef] [PubMed]
  4. Rojo, E.; Carmona, A.; Soto, C.; Díaz, I.; Fernández-Polanco, M.; Palacio, L.; Bolado, S. Environment and Material Science Technology for Anaerobic Digestion-Based Circular Bioeconomy. In Biomass, Biofuels, Biochemicals; Elsevier: Amsterdam, The Netherlands, 2021; pp. 25–55. [Google Scholar]
  5. Meys, R.; Kätelhön, A.; Bachmann, M.; Winter, B.; Zibunas, C.; Suh, S.; Bardow, A. Achieving net-zero greenhouse gas emission plastics by a circular carbon economy. Science 2021, 74, 71–76. [Google Scholar] [CrossRef] [PubMed]
  6. Ahmed, I.; Zia, M.A.; Afzal, H.; Ahmed, S.; Ahmad, M.; Akram, Z.; Iqbal, H.M. Socio-Economic and Environmental Impacts of Biomass Valorisation: A Strategic Drive for Sustainable Bioeconomy. Sustainability 2021, 13, 4200. [Google Scholar] [CrossRef]
  7. Nguyen, T.K.L.; Ngo, H.H.; Guo, W.; Nguyen, T.L.H.; Chang, S.W.; Nguyen, D.D.; Deng, L. Environmental impacts and greenhouse gas emissions assessment for energy recovery and material recycle of the wastewater treatment plant. Sci. Total Environ. 2021, 784, 147135. [Google Scholar] [CrossRef]
  8. Lin, B.; Sai, R. A multi factor Malmquist CO2emission performance indices: Evidence from Sub Saharan African public thermal power plants. Energy 2021, 223, 120081. [Google Scholar] [CrossRef]
  9. Salamé, L.; McKinney, D.C.; Delli Priscoli, J.; Koike, T.; Moss, J.; Tignino, M.; Münger, F. Water Discourses. In Handbook of Water Resources Management: Discourses, Concepts and Examples; Springer: Berlin/Heidelberg, Germany, 2021; pp. 145–214. [Google Scholar]
  10. Rout, P.R.; Zhang, T.C.; Bhunia, P.; Surampalli, R.Y. Treatment technologies for emerging contaminants in wastewater treatment plants: A review. Sci. Total Environ. 2021, 753, 141990. [Google Scholar] [CrossRef] [PubMed]
  11. Ratna, S.; Rastogi, S.; Kumar, R. Current trends for distillery wastewater management and its emerging applications for sustainable environment. J. Environ. Manag. 2021, 290, 112544. [Google Scholar] [CrossRef]
  12. Zhao, C.; Zhou, J.; Yan, Y.; Yang, L.; Xing, G.; Li, H.; Zheng, H. Application of coagulation/flocculation in oily wastewater treatment: A review. Sci. Total Environ. 2021, 765, 142795. [Google Scholar] [CrossRef]
  13. Adetunji, A.I.; Olaniran, A.O. Treatment of industrial oily wastewater by advanced technologies: A review. Appl. Water Sci. 2021, 11, 98. [Google Scholar] [CrossRef]
  14. Tetteh, E.K.; Amankwa, M.O.; Armah, E.K.; Rathilal, S. Fate of COVID-19 Occurrences in Wastewater Systems: Emerging Detection and Treatment Technologies—A. Review. Water 2020, 12, 2680. [Google Scholar] [CrossRef]
  15. Tetteh, E.K.; Rathilal, S. Application of organic coagulants in water and wastewater treatment. In Organic Polymers; intechOpen: London, UK, 2019. [Google Scholar] [CrossRef]
  16. Zhao, J.; Li, Y.; Dong, R. Recent progress towards in-situ biogas upgrading technologies. Sci. Total Environ. 2021, 800, 149667. [Google Scholar] [CrossRef] [PubMed]
  17. Ajay, C.; Mohan, S.; Dinesha, P.; Rosen, M.A. Review of impact of nanoparticle additives on anaerobic digestion and methane generation. Fuel 2020, 277, 118234. [Google Scholar] [CrossRef]
  18. Madondo, N.I.; Tetteh, E.K.; Rathilal, S.; Bakare, B.F. Synergistic Effect of Magnetite and Bioelectrochemical Systems on Anaerobic Digestion. Bioengineering 2021, 8, 198. [Google Scholar] [CrossRef]
  19. Chollom, M.N.; Rathilal, S.; Swalaha, F.M.; Bakare, B.F.; Tetteh, E.K. Removal of antibiotics during the anaerobic digestion of slaughterhouse wastewater. Planning 2020, 15, 335–343. [Google Scholar] [CrossRef]
  20. Fermoso, F.G.; van Hullebusch, E.; Collins, G.; Roussel, J.; Mucha, A.P.; Esposito, G. Trace Elements in Anaerobic Biotechnologies; IWA Publishing: London, UK, 2019. [Google Scholar]
  21. Rodríguez-Couto, S. Biophotodegradation of pollutants from wastewater. In Bioremediation for Environmental Sustainability; Elsevier: Amsterdam, The Netherlands, 2021; pp. 269–281. [Google Scholar]
  22. Molla, A.; Kim, A.Y.; Woo, J.C.; Cho, H.S.; Youk, J.H. Study on Preparation Methodology of Zero-Valent Iron Decorated on Graphene Oxide for Highly Efficient Sonocatalytic Dye Degradation. J. Environ. Chem. Eng. 2022, 10, 107214. [Google Scholar] [CrossRef]
  23. El-Gendy, N.S.; Nassar, H.N. Biosynthesized magnetite nanoparticles as an environmental opulence and sustainable wastewater treatment. Sci. Total Environ. 2021, 774, 145610. [Google Scholar] [CrossRef]
  24. de Oliveira Guidolin, T.; Possolli, N.M.; Polla, M.B.; Wermuth, T.B.; de Oliveira, T.F.; Eller, S.; Cechinel, M.A.P. Photocatalytic pathway on the degradation of methylene blue from aqueous solutions using magnetite nanoparticles. J. Clean. Prod. 2021, 318, 128556. [Google Scholar] [CrossRef]
  25. el Ghandoor, H.; Zidan, H.; Khalil, M.M.; Ismail, M. Synthesis and some physical properties of magnetite (Fe3O4) nanoparticles. Int. J. Electrochem. Sci. 2012, 7, 5734–5745. [Google Scholar]
  26. Tetteh, E.K.; Rathilal, S. Biophotocatalytic Reduction of CO2 in Anaerobic Biogas Produced from Wastewater Treatment Using an Integrated System. Catalysts 2022, 12, 76. [Google Scholar] [CrossRef]
  27. Apollo, S.; Onyango, M.S.; Ochieng, A. Modelling energy efficiency of an integrated anaerobic digestion and photodegradation of distillery effluent using response surface methodology. Environ. Technol. 2016, 37, 2435–2446. [Google Scholar] [CrossRef]
  28. Sudarjanto, G.; Keller-Lehmann, B.; Keller, J. Optimization of integrated chemical–biological degradation of a reactive azo dye using response surface methodology. J. Hazard. Mater. 2006, 138, 160–168. [Google Scholar] [CrossRef] [PubMed]
  29. Wang, X.-C.; Jiang, P.; Yang, L.; Fan, Y.V.; Klemeš, J.J.; Wang, Y. Extended water-energy nexus contribution to environmentally-related sustainable development goals. Renew. Sustain. Energy Rev. 2021, 150, 111485. [Google Scholar] [CrossRef]
  30. Popp, J.; Lakner, Z.; Harangi-Rákos, M.; Fári, M. The effect of bioenergy expansion: Food, energy, and environment. Renew. Sustain. Energy Rev. 2014, 32, 559–578. [Google Scholar] [CrossRef]
  31. Zulfiqar, M.; Samsudin, M.F.R.; Sufian, S. Modelling and optimization of photocatalytic degradation of phenol via TiO2 nanoparticles: An insight into response surface methodology and artificial neural network. J. Photochem. Photobiol. A Chem. 2019, 384, 112039. [Google Scholar] [CrossRef]
  32. Watson, S.; Beydoun, D.; Amal, R. Synthesis of a novel magnetic photocatalyst by direct deposition of nanosized TiO2 crystals onto a magnetic core. J. Photochem. Photobiol. A Chem. 2002, 148, 303–313. [Google Scholar] [CrossRef]
  33. Guo, Q.; Zhou, C.; Ma, Z.; Yang, X. Fundamentals of TiO2 photocatalysis: Concepts, mechanisms, and challenges. Adv. Mater. 2019, 31, 1901997. [Google Scholar] [CrossRef]
  34. Kobwittaya, K.; Sirivithayapakorn, S. Photocatalytic reduction of nitrate over Fe-modified TiO2. APCBEE Procedia 2014, 10, 321–325. [Google Scholar] [CrossRef]
  35. Pastor-Pérez, L.; Baibars, F.; le Sache, E.; Arellano-García, H.; Gu, S.; Reina, T.R. CO2 valorisation via reverse water-gas shift reaction using advanced Cs doped Fe-Cu/Al2O3 catalysts. J. CO2 Util. 2017, 21, 423–428. [Google Scholar] [CrossRef]
  36. Hijazi, O.; Munro, S.; Zerhusen, B.; Effenberger, M. Review of life cycle assessment for biogas production in Europe. Renew. Sustain. Energy Rev. 2016, 54, 1291–1300. [Google Scholar] [CrossRef]
  37. Bauer, F.; Persson, T.; Hulteberg, C.; Tamm, D. Biogas upgrading–technology overview, comparison and perspectives for the future. Biofuels Bioprod. Biorefin. 2013, 7, 499–511. [Google Scholar] [CrossRef]
  38. Zhang, L.; Xing, Z.; Zhang, H.; Li, Z.; Wu, X.; Zhang, X.; Zhou, W. High thermostable ordered mesoporous SiO2–TiO2 coated circulating-bed biofilm reactor for unpredictable photocatalytic and biocatalytic performance. Appl. Catal. B Environ. 2016, 180, 521–529. [Google Scholar] [CrossRef]
  39. Shoabargh, S.; Karimi, A.; Dehghan, G.; Khataee, A. A hybrid photocatalytic and enzymatic process using glucose oxidase immobilized on TiO2/polyurethane for removal of a dye. J. Ind. Eng. Chem. 2014, 20, 3150–3156. [Google Scholar] [CrossRef]
  40. Ma, Y.; Xiong, H.; Zhao, Z.; Yu, Y.; Zhou, D.; Dong, S. Model-based evaluation of tetracycline hydrochloride removal and mineralization in an intimately coupled photocatalysis and biodegradation reactor. Chem. Eng. J. 2018, 351, 967–975. [Google Scholar] [CrossRef]
  41. Wang, L.; Zhang, C.; Cheng, R.; Ali, J.; Wang, Z.; Mailhot, G.; Pan, G. Microcystis aeruginosa synergistically facilitate the photocatalytic degradation of tetracycline hydrochloride and Cr (VI) on PAN/TiO2/Ag nanofiber mats. Catalysts 2018, 8, 628. [Google Scholar] [CrossRef]
  42. Atacan, K.; Güy, N.; Cakar, S.; Özacar, M. Efficiency of glucose oxidase immobilized on tannin modified NiFe2O4 nanoparticles on decolorization of dye in the Fenton and photo-biocatalytic processes. J. Photochem. Photobiol. A Chem. 2019, 382, 111935. [Google Scholar] [CrossRef]
  43. Chambers, P. Standard methods for the examination of water and wastewater. Sci. e-Resour. 2019, 10, 332. [Google Scholar]
  44. Fuentes, I.; Bernales, N.; Ulloa, C.; García, X. Kinetics of CO2 methanation using a Fe-bearing blast furnace sludge as catalytic precursor. Catal. Today 2022, 394, 198–207. [Google Scholar] [CrossRef]
  45. Tetteh, E.K.; Rathilal, S. Kinetics and nanoparticle catalytic enhancement of biogas production from wastewater using a magnetized biochemical methane potential (Mbmp) system. Catalysts 2020, 10, 1200. [Google Scholar] [CrossRef]
Figure 1. A schematic diagram of biophotocatalysis.
Molecules 27 05213 g001
Figure 2. The effect of a weekly catalyst load of Fe-TiO2 on contaminant removal by using the biophotocatalytic system.
Molecules 27 05213 g002
Figure 3. The effect of a weekly catalyst load of Fe-TiO2 on biogas production using the biophotocatalytic system for 30 days.
Molecules 27 05213 g003
Figure 4. The effect of weekly catalyst load of Fe-TiO2 on methane yield using the biophotocatalytic system.
Molecules 27 05213 g004
Figure 5. A schematic diagram of the biophotocatalytic system degradation mechanism.
Molecules 27 05213 g005
Figure 6. The block diagram of a local South Africa wastewater treatment plant with effluent sampled from the downstream of a biofiltration system.
Molecules 27 05213 g006
Figure 7. A schematic diagram of co-precipitation of magnetized photocatalyst (Fe-TiO2).
Molecules 27 05213 g007
Figure 8. A schematic representation of the biophotocatalytic (BP) system consisting of the upflow anaerobic sludge blanket (UASB) reactor coupled with UV-light.
Molecules 27 05213 g008
Table 1. A summary of results obtained for the weekly catalyst load of Fe-TiO2 on organic contaminants by using the biophotocatalytic system for four weeks.
ParametersWeek 1Week 2Week 3Week 4
Catalytic loading (g)0246
pH5.59 ± 1.27.13 ± 1.47.13 ± 1.37.69 ± 1.2
COD (mg COD/L)115 ± 3.487 ± 2.330 ± 2.112 ± 1.3
Total N (mg/L)24.61 ± 1.47.26 ± 2.20.98 ± 0.152.65 ± 0.32
TKN (mg/L)24.3 ± 1.36.01 ± 1.20.80 ± 0.12.53 ± 0.3
NO3-N (mg/L)0.31 ± 0.11.25 ± 0.70.18 ± 0.050.12 ± 0.02
NH4+ (mg/L)0.89 ± 0.130.78 ± 0.20.76 ± 0.120.74 ± 0.14
VS/TS0.350.190.320.48
Chemical oxygen demand (COD), Total Nitrate, Total Kjeldahl nitrogen (TKN), Nitrate-Nitrogen (NO3-N), Ammonia (NH4+), Total solids (TS) and Volatile solids (VS).
Table 2. A summary of the modified Gompertz and first order kinetic models for the BP system.
TermsModified Gompertz ModelFirst Order Model
Ct (mL/g COD)47804780
Cm (mL/g COD)48303,141,923
k (1/day)0.206230.00006
ʎ (day)10.7N/A
Sum of square errors (SSR)1,152,3857,258,214
Correlation Coefficient (R2)0.99170.9351
Predicted yield (mL/g COD)47415659
Table 3. The estimated energy cost of the BP system biogas produced from wastewater.
Item NoItemValues
Biogas produced (m3)0.00515
1Energy content of Methane (m3/h)0.0464
2Methane for electricity (kW/h)0.0348
3Energy applied (UV) (kW/h)0.0180
4Net energy (2–3) (kW/h)0.0168
Cost estimation
5Energy cost (3.22 ZAR/kWh)0.054
Energy cost (0.23 USD/kWh)0.0039
6Net energy cost for 30 days
Energy cost (3.22 ZAR/kWh)38.86
Energy cost (0.23 USD/kWh)2.78
Table 4. Studies on recalcitrant compound degradation by the BP system.
BiocatalystPhotocatalystDegradation
Efficiency
Reference
BiofilmSiO2-TiO2100% phenol [38]
Glucose oxidaseTiO2>99% acid orange 7[39]
BiofilmAg/TiO294% Tetracycline [40]
Microcystis aerugionsaAg/TiO296% Tetracycline
75% Cr (VI)
[41]
GOxNiFe2O498.6% Indigo carmine [42]
Activated sludge Fe-TiO2>80% CODThis study
Table 5. The characterization of wastewater and activated sludge samples.
Water Quality ValueAnalytical Instrument
pH7.4 ± 1.6Hanna pH/EC/TDS Tester (H198130)
Temperature (°C)26.4 ± 2.3Hanna pH/EC/TDS Tester (H198130)
Colour (abs 465 nm, Pt.Co)570 ± 7.6HACH Spectrophotometer (DR3900)
Turbidity (NTU)732 ± 12.5Turbidity meter (HACH 2100N)
Chemical oxygen demand (mg COD/L) 2380 ± 32HACH Spectrophotometer (DR3900)
Ammonia (mg NH3/L)0.7 ± 0.2HACH Spectrophotometer (DR3900)
Total Kjeldahl nitrogen (mg TKN/L)30.5 ± 1.4HACH Spectrophotometer (DR3900)
Nitrate (mg NO3/L)0.6 ± 0.15HACH Spectrophotometer (DR3900)
Total nitrogen (mg TN/L)31.9 ± 1.8HACH Spectrophotometer (DR3900)
Total suspended solids (mg TS/L)304.5 ± 23.6Analytical balance (HCB602H 22 ADAM)
Volatile solids (mg VS/L)229.5 ± 2.65Analytical balance (HCB602H 22 ADAM)
Ratio VS/TS0.75
Publisher’s Note: MDPI stays neutral with regard to jurisdictional claims in published maps and institutional affiliations.