Article

Anti-Cancer Effects of Auranofin in Human Lung Cancer Cells by Increasing Intracellular ROS Levels and Depleting GSH Levels

Department of Physiology, Research Institute for Endocrine Sciences, Medical School, Jeonbuk National University, 20 Geonji-ro, Deokjin-gu, Jeonju 54907, Jeollabuk-do, Korea
*
Author to whom correspondence should be addressed.
Molecules 2022, 27(16), 5207; https://doi.org/10.3390/molecules27165207
Submission received: 7 July 2022 / Revised: 8 August 2022 / Accepted: 10 August 2022 / Published: 15 August 2022
(This article belongs to the Special Issue Molecular Targets and Mechanisms of Action of Anti-cancer Agents)

Abstract

:
Auranofin, as a thioredoxin reductase (TrxR) inhibitor, has promising anti-cancer activity in several cancer types. However, little is known about the inhibitory effect of auranofin on lung cancer cell growth. We, therefore, investigated the antigrowth effects of auranofin in various lung cancer cells with respect to cell death, reactive oxygen species (ROS), and glutathione (GSH) levels. Treatment with 0~5 µM auranofin decreased cell proliferation and induced cell death in Calu-6, A549, SK-LU-1, NCI-H460, and NCI-H1299 lung cancer cells at 24 h. In addition, 0~5 µM auranofin increased ROS levels, including O2•−, and depleted GSH levels in these cells. N-acetyl cysteine (NAC) prevented growth inhibition and mitochondrial membrane potential (MMP, ∆Ψm) loss in 3 and 5 µM auranofin-treated Calu-6 and A549 cells at 24 h, respectively, and decreased ROS levels and GSH depletion in these cells. In contrast, L-buthionine sulfoximine (BSO) enhanced cell death, MMP (∆Ψm) loss, ROS levels, and GSH depletion in auranofin-treated Calu-6 and A549 cells. Treatment with 3 and 5 µM auranofin induced caspase-3 activation and poly (ADP ribose) polymerase (PARP) cleavage in Calu-6 and A549 cells, respectively. Both were prevented by NAC, but enhanced by BSO. Moreover, TrxR activity was reduced in auranofin-treated Calu-6 and A549 cells. That activity was decreased by BSO, but increased by NAC. In conclusion, these findings demonstrate that auranofin-induced cell death is closely related to oxidative stress resulted from increased ROS levels and GSH depletion in lung cancer cells.

1. Introduction

Lung cancer is the most frequent malignant tumor and the leading cause of cancer-related mortality and morbidity worldwide [1]. Lung cancer develops from lung epithelial cells and can be histologically divided into two types, viz., small-cell lung cancer (SCLC) and non-small-cell lung cancer (NSCLC), which contribute to 15% and 85% of all lung cancers, respectively. NSCLC is further categorized into three subtypes, namely lung adenocarcinoma (LUAD), lung squamous cell carcinoma (LUSC), and lung large-cell carcinoma (LULC) [2,3]. More than 40% of NSCLC cases are metastatic at diagnosis, and the 5-year overall survival for patients with distant metastatic NSCLC is <5% [4,5]. Various clinical cancer therapies such as surgical removal, chemotherapy, and radiation therapy are used for lung cancer treatment. Of these, the primary therapy for lung cancer is molecular-targeted agents [6,7,8]. However, these agents often have a limited effect and treatment-associated toxicity that reduce their therapeutic efficacy [9,10]. Therefore, there exists a critical need for new alternative therapeutic strategies for patients with lung cancer.
Reactive oxygen species (ROS), including hydrogen peroxide (H2O2), superoxide anions (O2•−), and hydroxyl radicals (OH), are byproducts of normal cellular metabolism. These molecules play significant roles in several cellular events such as gene expression, cell differentiation, proliferation, survival, apoptosis, cognitive function, and immune response [11,12,13,14]. However, excessive production of ROS can cause cell damage by oxidizing DNA, RNA, protein, and lipid that can result in the pathogenesis of a diverse number of diseases, including cancer [15,16]. Higher levels of ROS in cancer cells are associated with tumorigenesis and are an indicative hallmark of cancer. Several studies have demonstrated that oxidative stress-mediated signaling pathways can influence cancer progression, differentiation, and apoptosis [17,18,19]. Hence, ROS regulation may represent a critical target for the development of antitumor agents.
To maintain ROS homeostasis, an antioxidant defense system, including glutathione (GSH) and thioredoxin (Trx), exists to reduce ROS levels in cells [14]. The Trx system is composed of Trx and a nicotinamide adenine dinucleotide phosphate (NADPH)-dependent Trx reductase (TrxR) [20]. Trx is a small (12-kDa) reduction-oxidation (redox) protein with a catalytically active dithiol site in a cysteine residue (Cys-Gly-Pro-Cys), which can reduce disulfides in target proteins. Oxidized Trx can then be reduced by the TrxR enzyme using NADPH to promote its activities [20,21,22]. TrxR is a family of selenium-containing pyridine nucleotide-disulfide oxidoreductases [23]. The following three isoforms of TrxR have been identified in mammals: cytosolic TrxR1, mitochondrial TrxR2, and thioredoxin glutathione reductase TrxR3 [24]. Studies have suggested that TrxR plays pivotal roles in a wide range of biological and pathological processes, including apoptosis, cancer, chronic inflammation, and autoimmune diseases [22,24,25]. However, elevated expression of Trx or TrxR is found in different types of tumors, such as hepatocellular, breast, gastric, oral, and lung cancers [26,27,28,29,30]. In this regard, targeting the Trx system is a promising strategy for cancer therapy.
Auranofin, as a TrxR inhibitor, is an oral gold (I)-containing phosphine compound that is approved by the United States Food and Drug Administration (FDA) for the treatment of rheumatoid arthritis [31,32]. Although it was initially established as an anti-inflammatory drug, recent studies have also revealed that auranofin has potential therapeutic effects for various human diseases, including cancer, neurodegenerative disorders, acquired immunodeficiency syndrome, and parasitic and bacterial infections [33,34]. The pharmacological effect of auranofin is due to its high reactivity with cellular nucleophiles such as selenocysteine and cysteine, making auranofin a potent inhibitor of TrxR [35,36].
In particular, auranofin exhibits anti-carcinogenic activity that is closely related to mitochondrial dysfunction and ROS overproduction in human chronic leukemia and gastric cancer cells [37,38]. In addition, we also reported that auranofin inhibits cell growth through cell cycle arrest and cell death due to necrosis and caspase-dependent apoptosis in lung cancer cells [39]. Thus, auranofin exhibits potent anti-cancer activity in human cancer cells. However, its anti-cancer effect on human lung cancer cells in light of redox state changes has not yet been elucidated. In the present study, we investigated the anti-growth effect of auranofin in various lung cancer cell lines with respect to ROS levels and GSH depletion, and evaluated the cellular effects of N-acetyl cysteine (NAC; a well-known antioxidant) and l-buthionine sulfoximine (BSO, an inhibitor of GSH synthesis) in auranofin-treated Calu-6 and A549 lung cancer cells.

2. Materials and Methods

2.1. Cell Culture

Human pulmonary fibroblast (HPF) cells were obtained from Promo Cell GmbH (Heidelberg, Germany). Human LUAD (A549 and SK-LU-1), large-cell carcinoma (NCI-H460 and NCI-H1299), and Calu-6 cell lines were obtained from the American Type Culture Collection (Manassas, VA, USA). These cells were cultured in RPMI-1640 medium supplemented with 10% fetal bovine serum (FBS) (Sigma-Aldrich, St. Louis, MO, USA) and 1% penicillin-streptomycin (Gibco BRL, Grand Island, NY, USA). All cultures were maintained in an incubator containing 5% CO2 at 37 °C. Cells were grown in 100 mm plastic cell culture dishes (BD Falcon, Franklin Lakes, NJ, USA) and harvested with trypsin-EDTA (Gibco BRL). HPF cells were used between passages 4 and 5 (indicated as #5).

2.2. Reagents

Auranofin was purchased from Sigma-Aldrich and dissolved in dimethyl sulfoxide (DMSO; Sigma-Aldrich) as a 10 mM stock solution. NAC and BSO were also obtained from Sigma-Aldrich. NAC was dissolved in a 20 mM 4-(2-hydroxyethyl)-1-piperazineethanesulfonic acid (HEPES; pH 7.0) buffer, and BSO was dissolved in distilled water. Based on previous studies, cells were pretreated with 2 mM NAC or 10 μM BSO at 37 °C for 1 h, followed by treatment with auranofin at 37 °C for 24 h, before assays were performed. DMSO (0.2%) was used as a control vehicle, and it had no effect on cell growth or death. All stock solutions were wrapped in foil and stored at 4 °C or −20 °C.

2.3. Cell Proliferation Assay

Viable and dead cell numbers were determined using the trypan blue staining method. Briefly, 1 × 10⁶ cells per well were seeded into 60 mm culture dishes (BD Falcon) for cell counting. After exposure to the indicated concentrations of auranofin for 24 h at 37 °C incubation, the cells were subjected to trypan blue staining. For all experimental conditions, three replicates were used, and the experiment was performed at least twice.

2.4. Determination of Intracellular ROS and O2•− Levels

Intracellular ROS, such as H2O2, OH, and ONOO, were measured using 2′,7′-dichlorodihydrofluorescein diacetate dye [H2DCFDA, Excitation/Emission (Ex/Em) = 495/529 nm; Invitrogen Molecular Probes, Eugene, OR, USA]. DCF is poorly sensitive to O2•−. In contrast, dihydroethidium dye (DHE, Ex/Em = 518/605 nm; Invitrogen Molecular Probes) is a fluorogenic probe that is highly selective for O2•− among ROS. Briefly, 1 × 10⁶ cells in 60 mm culture dishes (BD Falcon) were pretreated with 2 mM NAC or 10 µM BSO for 1 h and then treated with auranofin for 24 h. Cells were then washed in phosphate-buffered saline (PBS) and incubated with 20 μM H2DCFDA or 20 μM DHE at 37 °C for 30 min. Mean DCF and DHE fluorescence values were detected using a FACStar flow cytometer (BD Sciences, Franklin Lakes, NJ, USA). Mean DCF and DHE levels are expressed as percentages compared with control cells.

2.5. Detection of Intracellular GSH

Cellular GSH levels were evaluated using 5-chloromethylfluorescein diacetate dye (CMFDA, Ex/Em = 522/595 nm; Invitrogen Molecular Probes). Briefly, 1 × 10⁶ cells in 60 mm culture dishes (BD Falcon) were pretreated with 2 mM NAC or 10 µM BSO for 1 h and then treated with auranofin for 24 h. Cells were washed with PBS and incubated with 5 µM CMFDA at 37 °C for 30 min. CMF fluorescence intensity was determined using a FACStar flow cytometer (BD Sciences). Negative CMF-stained (GSH-depleted) cells are expressed as a percentages of (−) CMF cells.

2.6. Detection of Apoptosis

Apoptosis was detected by staining with annexin V-fluorescein isothiocyanate (FITC, Ex/Em = 488/519 nm; Life Technologies, Carlsbad, CA). Briefly, 1 × 10⁶ cells in 60 mm culture dishes (BD Falcon) were pretreated with 2 mM NAC or 10 µM BSO for 1 h and then treated with auranofin for 24 h. Cells were washed twice with cold PBS and then resuspended in 200 µL of a binding buffer (10 mM HEPES/NaOH, pH 7.4, and 140 mM NaCl; 2.5 mM CaCl2) at a concentration of 5 × 10⁵ cells/mL at 37 °C for 30 min. Annexin V-FITC (2 µL) and propidium iodide (1 μg/mL) were added to the solution, and cells were analyzed using a FACStar flow cytometer (BD Sciences).

2.7. Measurement of Mitochondrial Membrane Potential (MMP; ΔΨm)

MMP (ΔΨm) was evaluated using the fluorescent dye rhodamine 123 (Ex/Em = 485/535 nm; Sigma-Aldrich), which is a cell-permeable cationic dye that preferentially enters into mitochondria because of their typical highly negative MMP (∆Ψm). Depolarization of MMP (∆Ψm) leads to the loss of rhodamine 123 from mitochondria and reduces the dye’s intracellular fluorescence intensity. Briefly, 1 × 10⁶ cells in 60 mm culture dishes (BD Falcon) were incubated with the designated doses of auranofin for 24 h. Cells were washed twice with PBS and incubated with rhodamine 123 (0.1 mg/mL) at a concentration of 5 × 10⁵ cells/mL at 37 °C for 30 min. Rhodamine 123 staining intensities were determined using a FACStar flow cytometer (BD Sciences). The absence of rhodamine 123 from cells indicates a loss of MMP (∆Ψm).

2.8. Western Blotting

Protein expression levels were evaluated by Western blotting. Briefly, 1 × 10⁶ cells in 60 mm culture dishes (BD Falcon) were pretreated with 2 mM NAC or 10 µM BSO for 1 h and then treated with the indicated concentrations of auranofin for 24 h. Cells were washed with PBS, and four volumes of a lysis buffer were added (Intron Biotechnology, Seongnam, Gyeonggi-do, Korea). Lysates were centrifuged at 13,500× g for 20 min at 4 °C, and the protein concentration of supernatants was determined using the Bradford method using an assay kit (Bio-Rad Laboratories, Hercules, CA, USA). Protein samples (30 µg) were resolved using 8–15% sodium dodecyl sulfate-polyacrylamide gel electrophoresis (SDS-PAGE) gels and then transferred to polyvinylidene difluoride (PVDF) membranes (Millipore, Bedford, MA, USA) by electroblotting. The membranes were probed with anti-PARP (no. 9543, 1:1000 dilution), anti-cleaved PARP (no. 9541, 1:1000 dilution), anti-caspase-3 (no. 9662, 1:1000 dilution), anti-cleaved-caspase-3 (no. 9661, 1:1000 dilution) (Cell Signaling Technology, Danvers, MA, USA); anti-TrxR-1 (SC-28321, 1:1000 dilution) and anti-GAPDH (SC-25778, 1:1000 dilution) (Santa Cruz Biotechnology), in 5% nonfat milk overnight at °C, followed by incubation with an appropriate horseradish peroxidase (HRP)-conjugated secondary antibody (Santa Cruz Biotechnology, Santa Cruz, CA, USA) at 1:5000 dilution for 2 h at room temperature. Finally, to evaluate comparable amounts of proteins in each lane, the membranes were stripped to detect GAPDH (Santa Cruz Biotechnology). Protein signals were developed using an EZ-Western Lumi Pico ECL solution kit (DoGen, Seoul, Korea) and imaged on an Amersham™ Imager 600 (GE Healthcare, Chicago, IL, USA).

2.9. TrxR Activity Assay

TrxR activity was determined using a fluorescent thioredoxin reductase colorimetric assay kit (Cayman Chemical, Ann Arbor, MI, USA). Briefly, 1 × 10⁶ cells in 60 mm culture dishes (BD Falcon) were pretreated with 2 mM NAC or 10 µM BSO for 1 h and then treated with the indicated concentrations of auranofin for 24 h. Cells were homogenized in a cold radioimmuno precipitation assay (RIPA) buffer (CureBio, Seoul, Korea) and centrifuged at 13,500× g for 20 min at 4 °C. The supernatant was collected after centrifugation, and protein concentrations were measured using the Bradford method using a Bio-Rad assay kit (Bio-Rad Laboratories, Hercules, CA, USA). Equal amounts of total protein (30 µg) were added to each well in a Nunc 96-well plate (Thermo Fisher Scientific, Waltham, MA, USA) with a master mix containing 5,5′-dithiobis (2-nitrobenzoic acid) (DTNB) and NADPH. The fluorescence intensity of each well was measured at 410 nm using a Synergy™ 2 spectrophotometer (BioTek Instruments Inc., Winooski, VT, USA). TrxR activity was calculated using a formula provided in the protocol.

2.10. Statistical Analysis

Results are reported as the mean of at least two or three independent experiments (mean ± SD). Data were analyzed using Instat (GraphPad, San Diego, CA, USA). Student’s t-test or one-way analysis of variance with a post hoc analysis using Tukey’s multiple comparison test was used for parametric data. Statistical significance was defined as p < 0.05.

3. Results

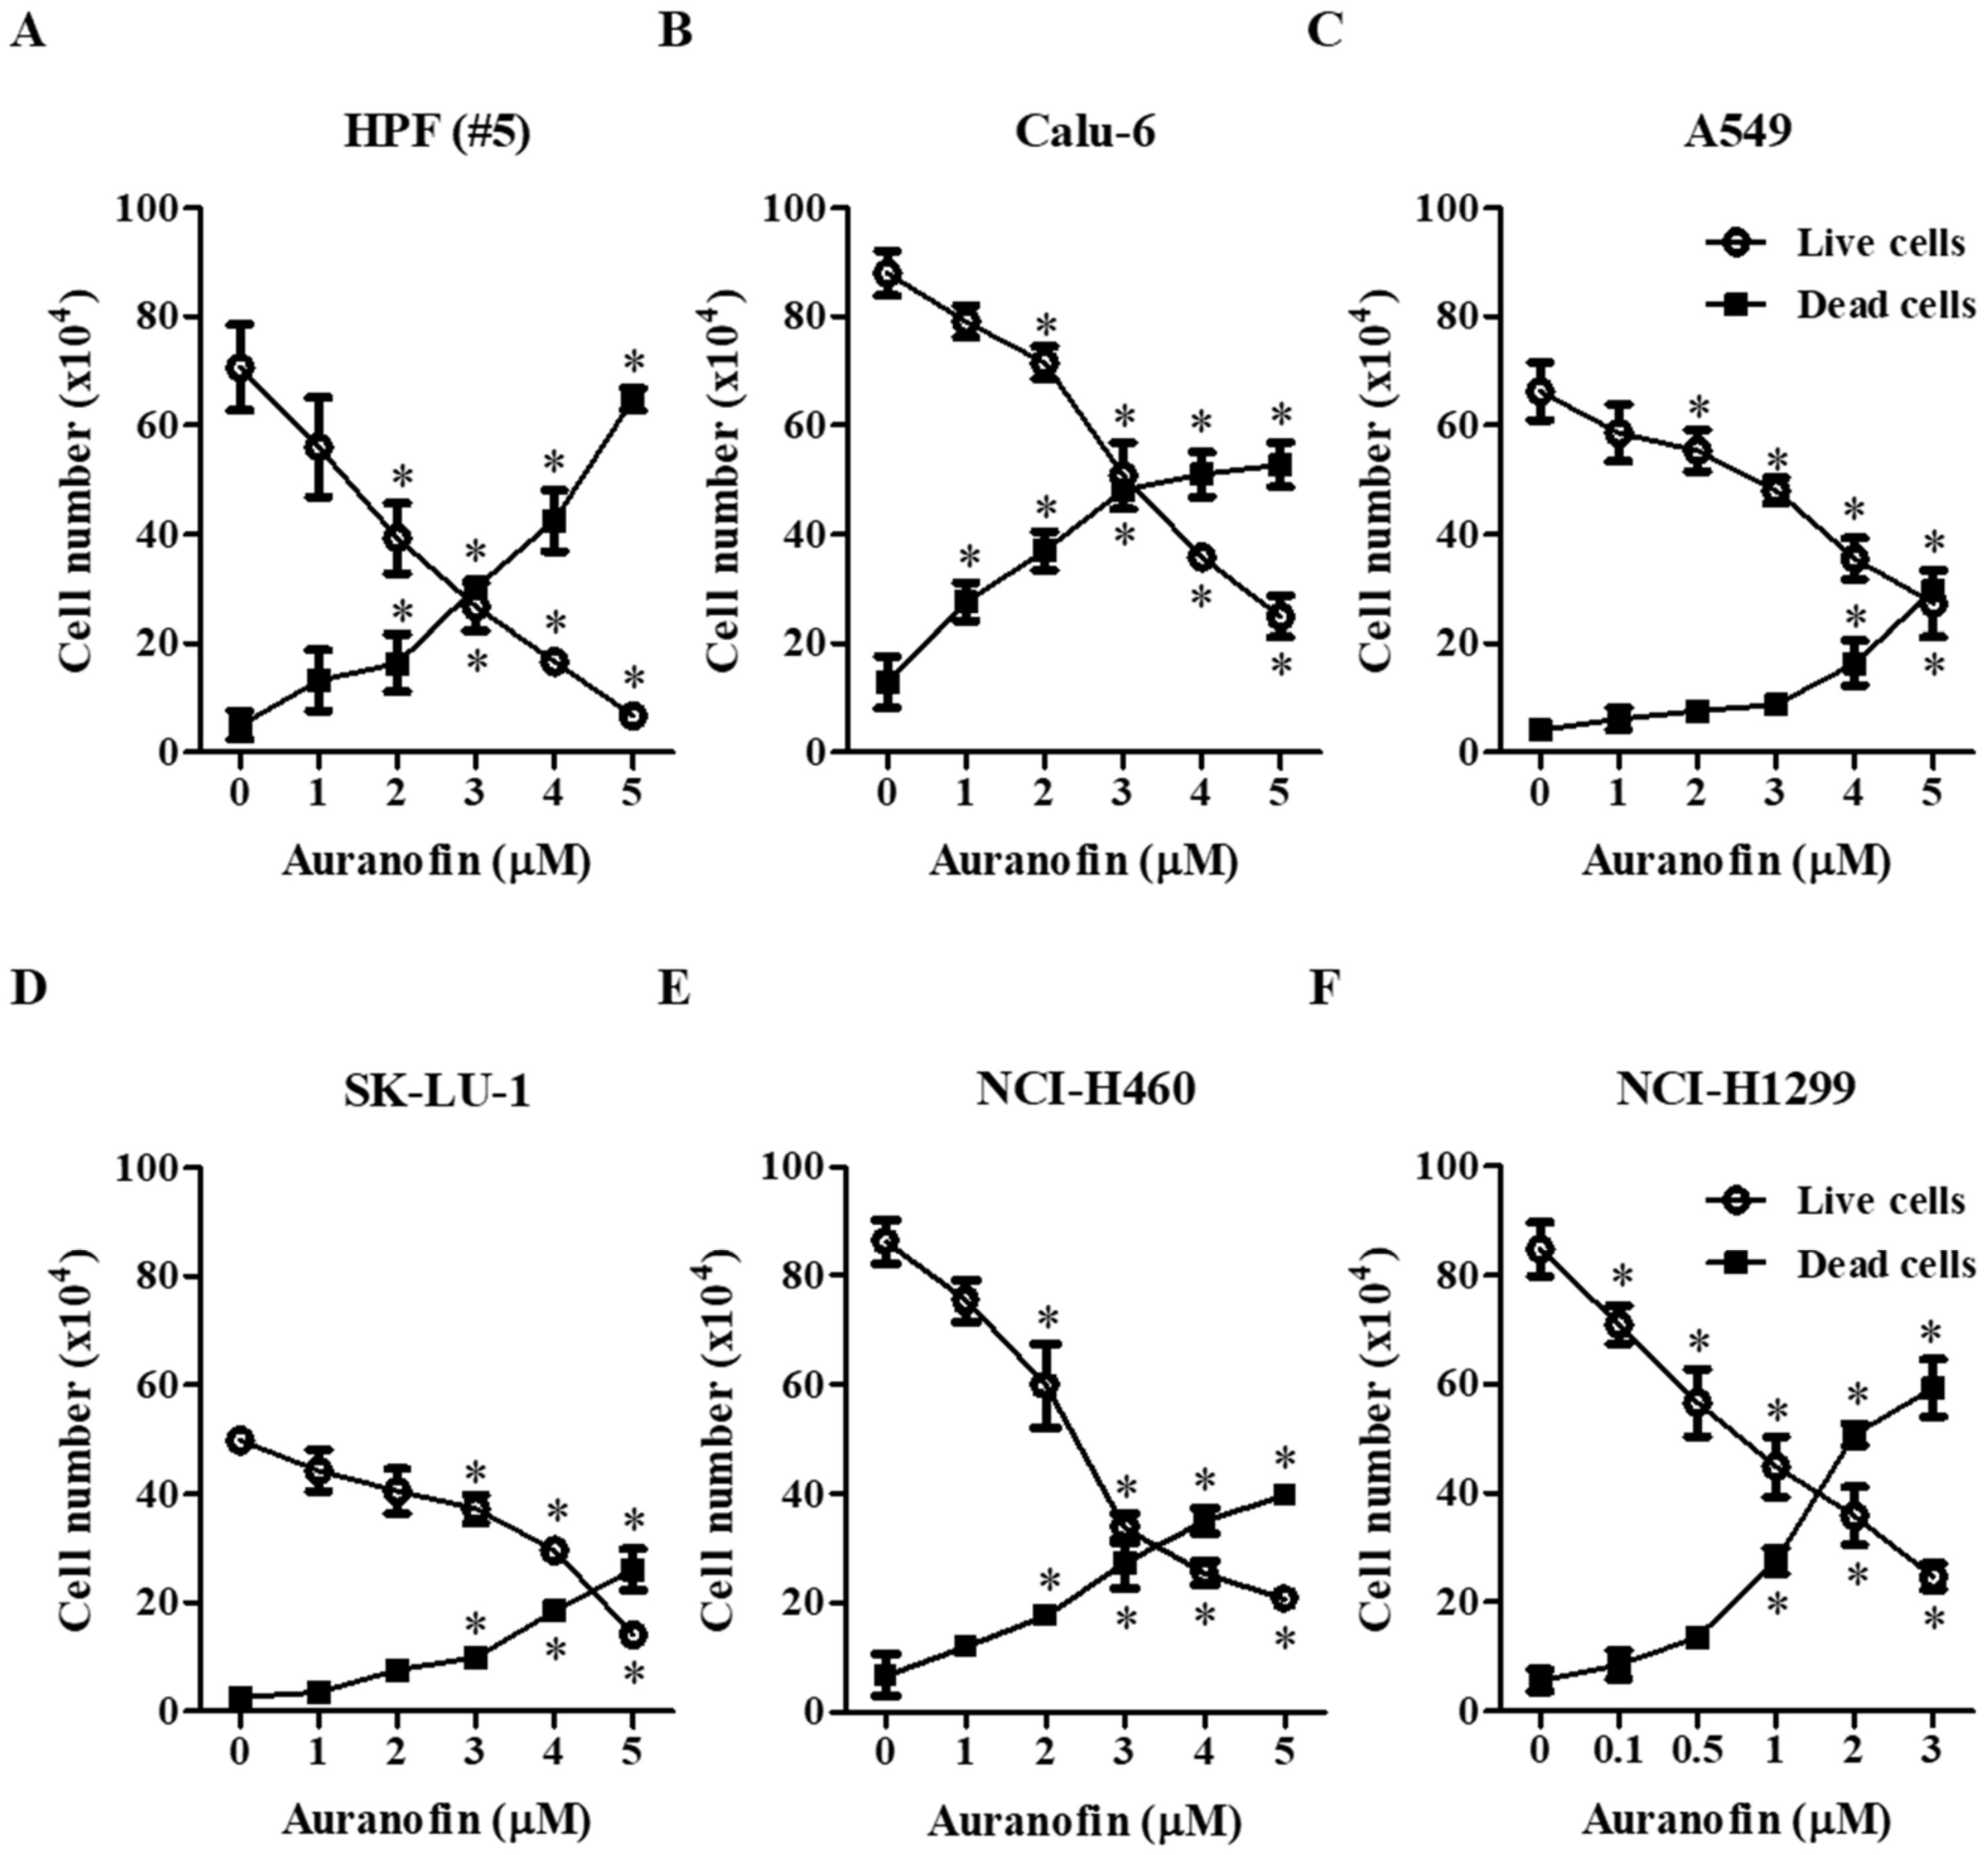
3.1. Effects of Auranofin on Cell Growth and Death in Lung Cancer Cells

The effect of auranofin on the growth of cells from a normal lung cell (HPF) and lung cancer cell lines (Calu-6, A549, SK-LU-1, NCI-H460, and NCI-H1299) was examined by counting the number of trypan blue positive and negative-stained cells. The growth of normal HPF and lung cancer Calu-6 cells showed IC50 of 3 μM at 24 h. The growth of lung cancer A549 and SK-LU-1 cells showed IC50 of 5 μM at 24 h. The growth of lung cancer NCI-H460 cells showed IC50 of 4 μM at 24 h. The growth of lung cancer NCI-H1299 cells showed IC50 of 1 μM at 24 h [40]. Treatment with various concentrations of auranofin for 24 h significantly reduced the population of viable cells and increased the number of dead cells in a dose-dependent manner (Figure 1). The number of live (trypan blue negative-stained) cells was significantly decreased with auranofin treatment at concentrations of 2–5 μM in HPF (#5) and Calu-6 cells (Figure 1A,B), 2–5 μM in A549 and SK-LU-1 cells (Figure 1C,D), 2–5 μM in NCI-H460 cells (Figure 1E), and 0.5–3 μM in NCI-H1299 cells (Figure 1F). Correspondingly, the population of dead (trypan blue positive-stained) cells was statistically increased with auranofin treatment at concentrations of 3–5 μM in both HPF (#5) and NCI-H460 cells (Figure 1A,E), 2–5 μM in Calu-6 cells (Figure 1B), 5 μM only in A549 cells (Figure 1C), 4–5 μM in SK-LU-1 cells (Figure 1D), and 1–3 μM in NCI-H1299 cells (Figure 1F). These results showed that normal lung cell and each lung cancer cell lines had differential sensitivity to auranofin.

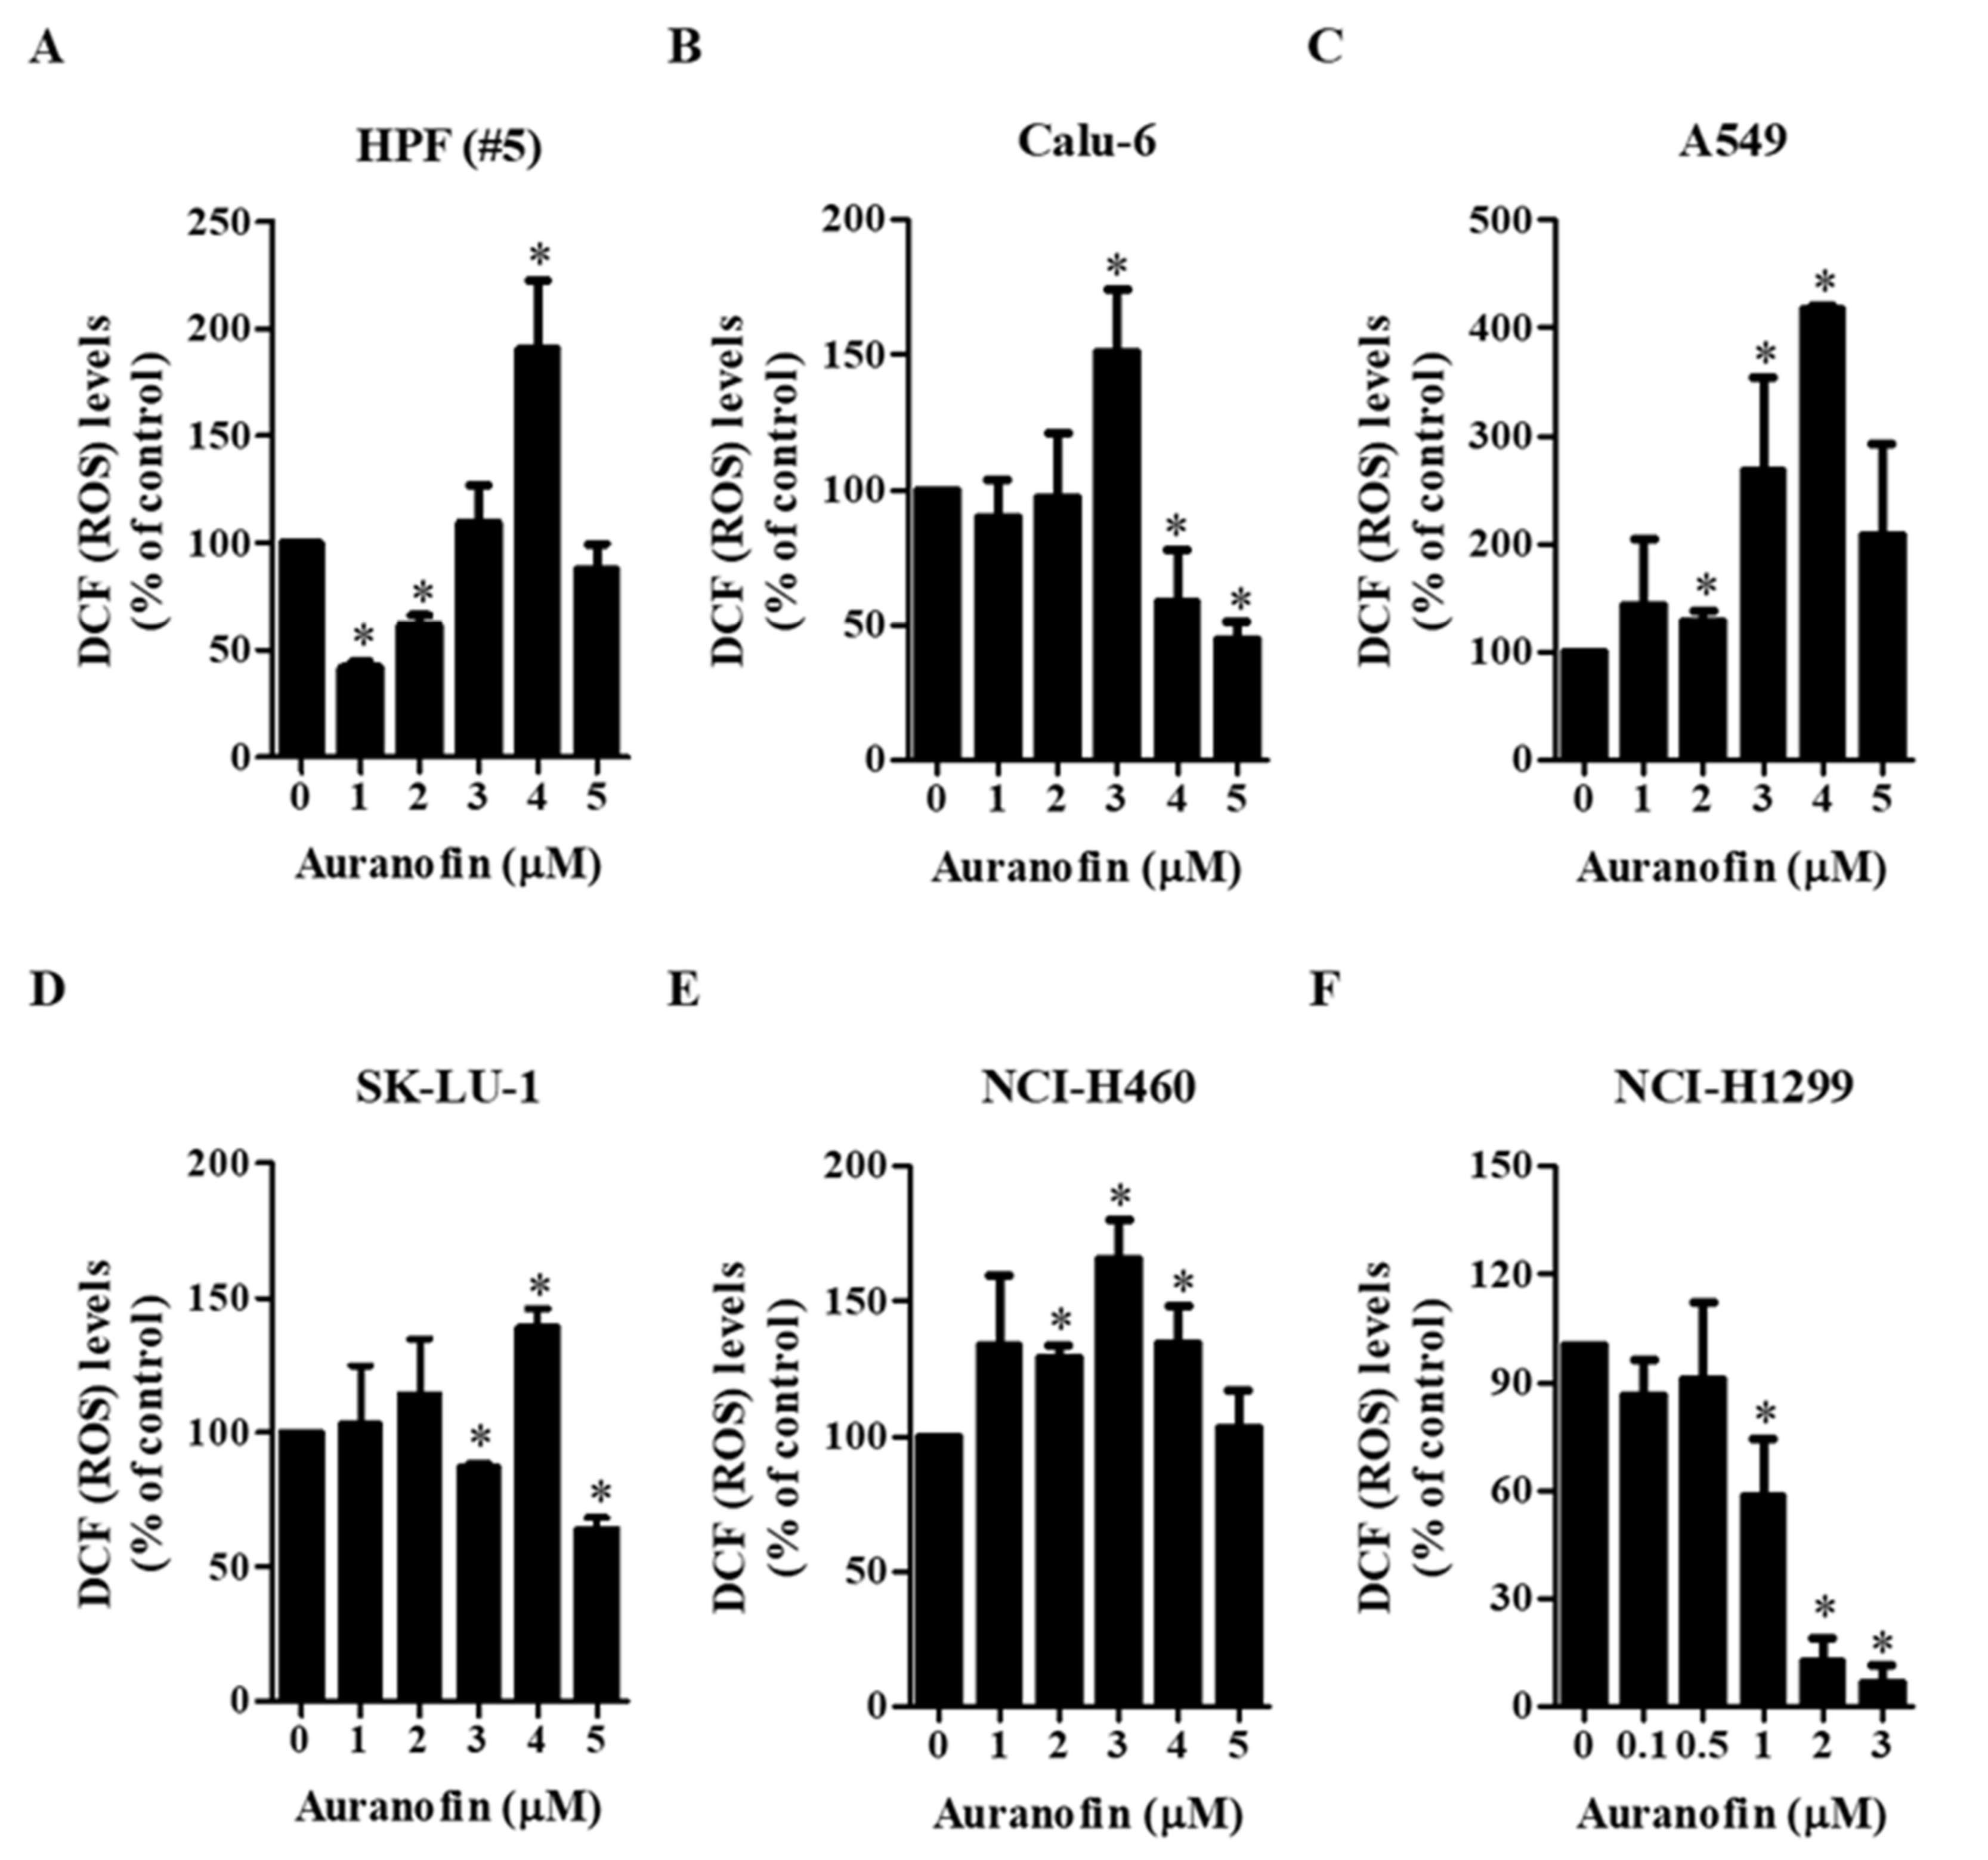
3.2. Effects of Auranofin on Intracellular ROS Levels in Lung Cancer Cells

To evaluate intracellular ROS levels in auranofin-treated normal lung cells and cells from lung cancer cell lines at 24 h, two fluorescent probe dyes (H2DCFDA and DHE) were used to detect nonspecific ROS and O2•− levels, respectively. We observed that auranofin affected ROS (DCF) and O2•− (DHE) levels depending on the treatment dose and cell type (Figure 2 and Figure 3). Among the tested concentrations of auranofin, treatment with 4 μM significantly increased the ROS levels in HPF cells (#5), but treatment with 5 μM auranofin did not (Figure 2A), Furthermore, treatment with 3 μM auranofin resulted in maximum ROS levels in Calu-6 cells, but 4–5 μM auranofin treatment decreased the levels of ROS (Figure 2B). In A549 and NCI-H460 cells, we observed that all the tested concentrations of auranofin led to increased ROS levels, but these levels were not elevated in a dose-dependent manner (Figure 2C,E). The ROS levels in 4 μM auranofin-treated A549 and 3 μM auranofin-treated NCI-H460 cells were the highest (Figure 2C,D). Treatment with 4 μM auranofin resulted in maximum ROS levels in SK-LU-1 cells, whereas treatment with 5 μM auranofin had no effect on ROS levels (Figure 2D). In NCI-H1299 cells, all the tested concentrations of auranofin generally led to decreased ROS levels, and the levels in 2–3 μM auranofin-treated cells were remarkably reduced compared to those in untreated cells (Figure 2F). The level of red fluorescence derived from DHE, which reflects O2•− accumulation, was gradually increased in auranofin-treated HPF (#5), Calu-6, A549, and NCI-H460 cells (Figure 3A–C,E). O2•− levels were significantly increased in 5 μM auranofin-treated HPF cells (#5), 3–5 μM auranofin-treated Calu-6 cells, and 4–5 μM auranofin-treated A549 cells (Figure 3A–C). Among the tested concentrations, we found that 5 μM auranofin resulted in the highest level of O2•− in NCI-H460 cells, but it was not significant (Figure 3E). Treatment with 1 μM auranofin resulted in the highest increase in O2•− levels in SK-LU-1 and NCI-H1299 cells, but treatment with >1 μM auranofin did not affect the O2•− levels in cells from either cell line (Figure 3D,F). In addition, treatment with 3 μM auranofin reduced the O2•− level in NCI-H1299 cells compared to that in control cells (Figure 3F). These results demonstrated that auranofin increased or decreased ROS (DCF) levels in normal and lung cancer cells according to its concentration, and auranofin generally increased O2•− level in these cells.

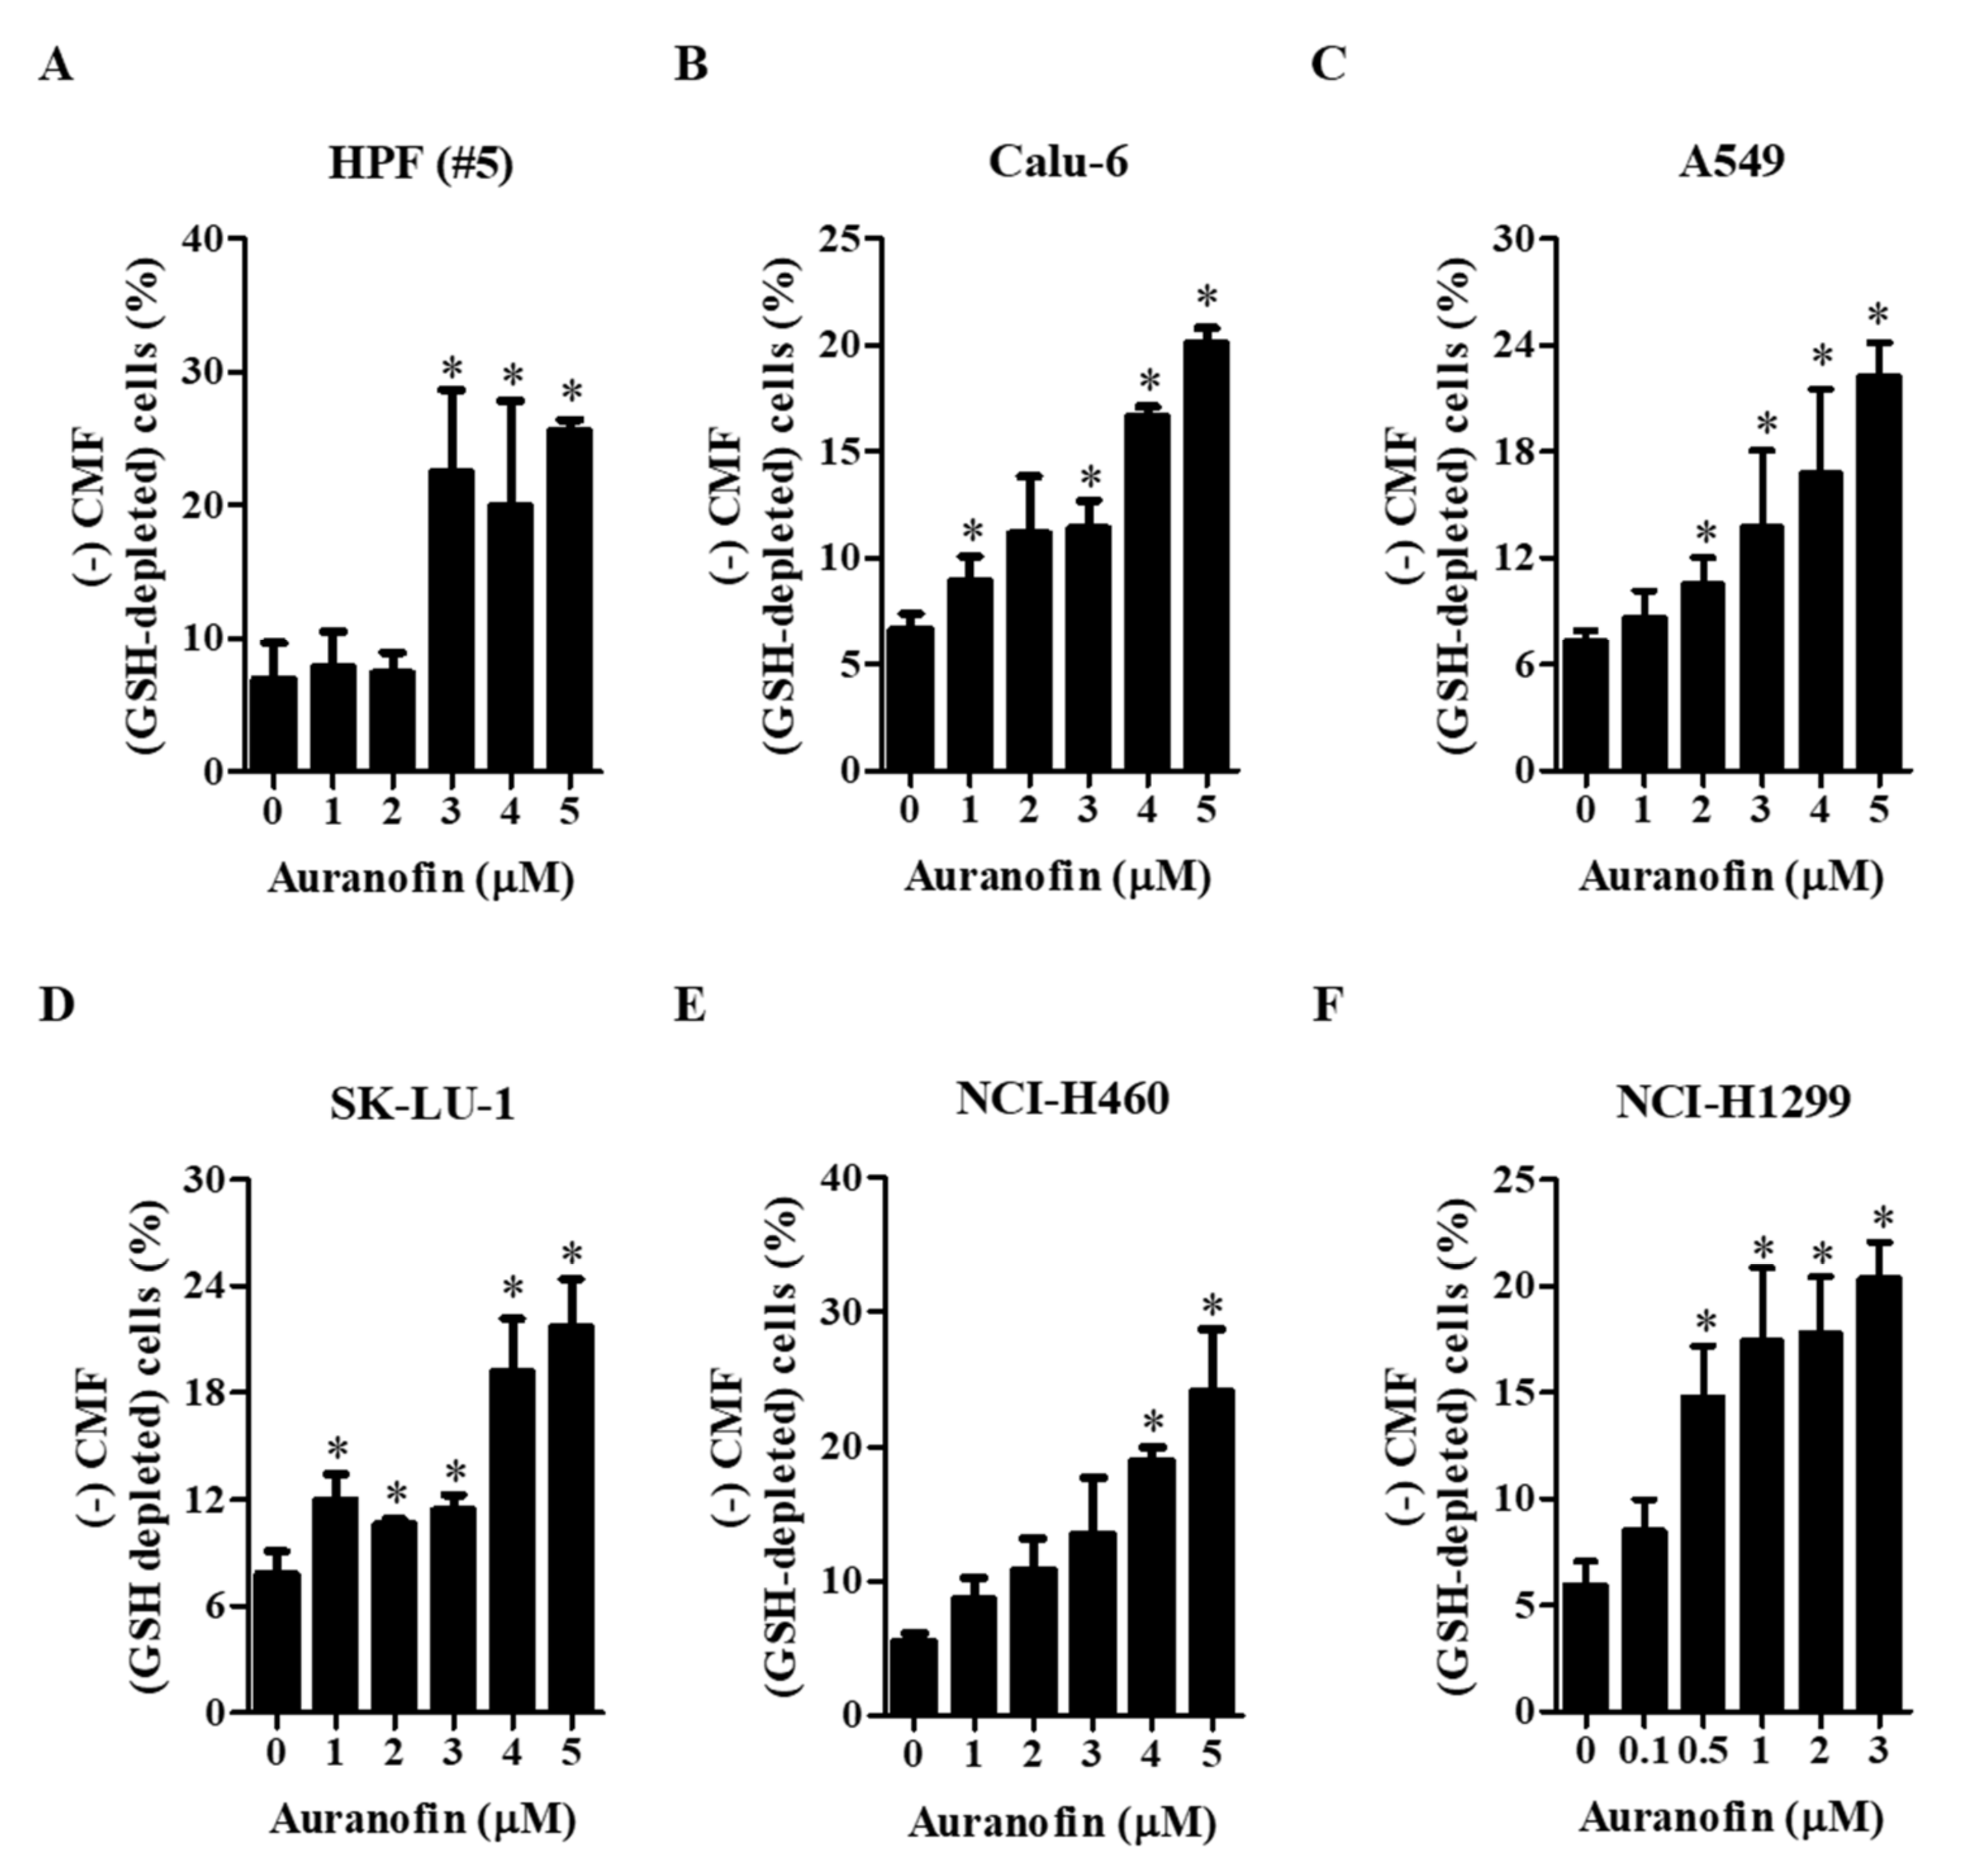
3.3. Effects of Auranofin on Intracellular GSH Depletion in Lung Cancer Cells

We analyzed the changes in intracellular GSH levels using the fluorescent dye CMF. All the tested concentrations of auranofin led to increased number of GSH-depleted cells in normal lung cells and cells from lung cancer cell lines compared with each group of control cells at 24 h. There was a remarkable increase in the number of GSH-depleted cells in HPF (#5) cells treated with >3 μM auranofin (Figure 4A). Furthermore, treatment with 4–5 μM auranofin resulted in a significantly increased percentages of GSH-depleted cells in Calu-6, A549, SK-LU-1, and NCI-H460 cells compared with that in control cells (Figure 4B–E). In NCI-H1299 cells, relatively lower concentrations of 0.5–3 μM auranofin steadily elevated the number of GSH-depleted cells (Figure 4F). These results showed that auranofin increased the percentages of GSH-depleted cells in normal and lung cancer cells.

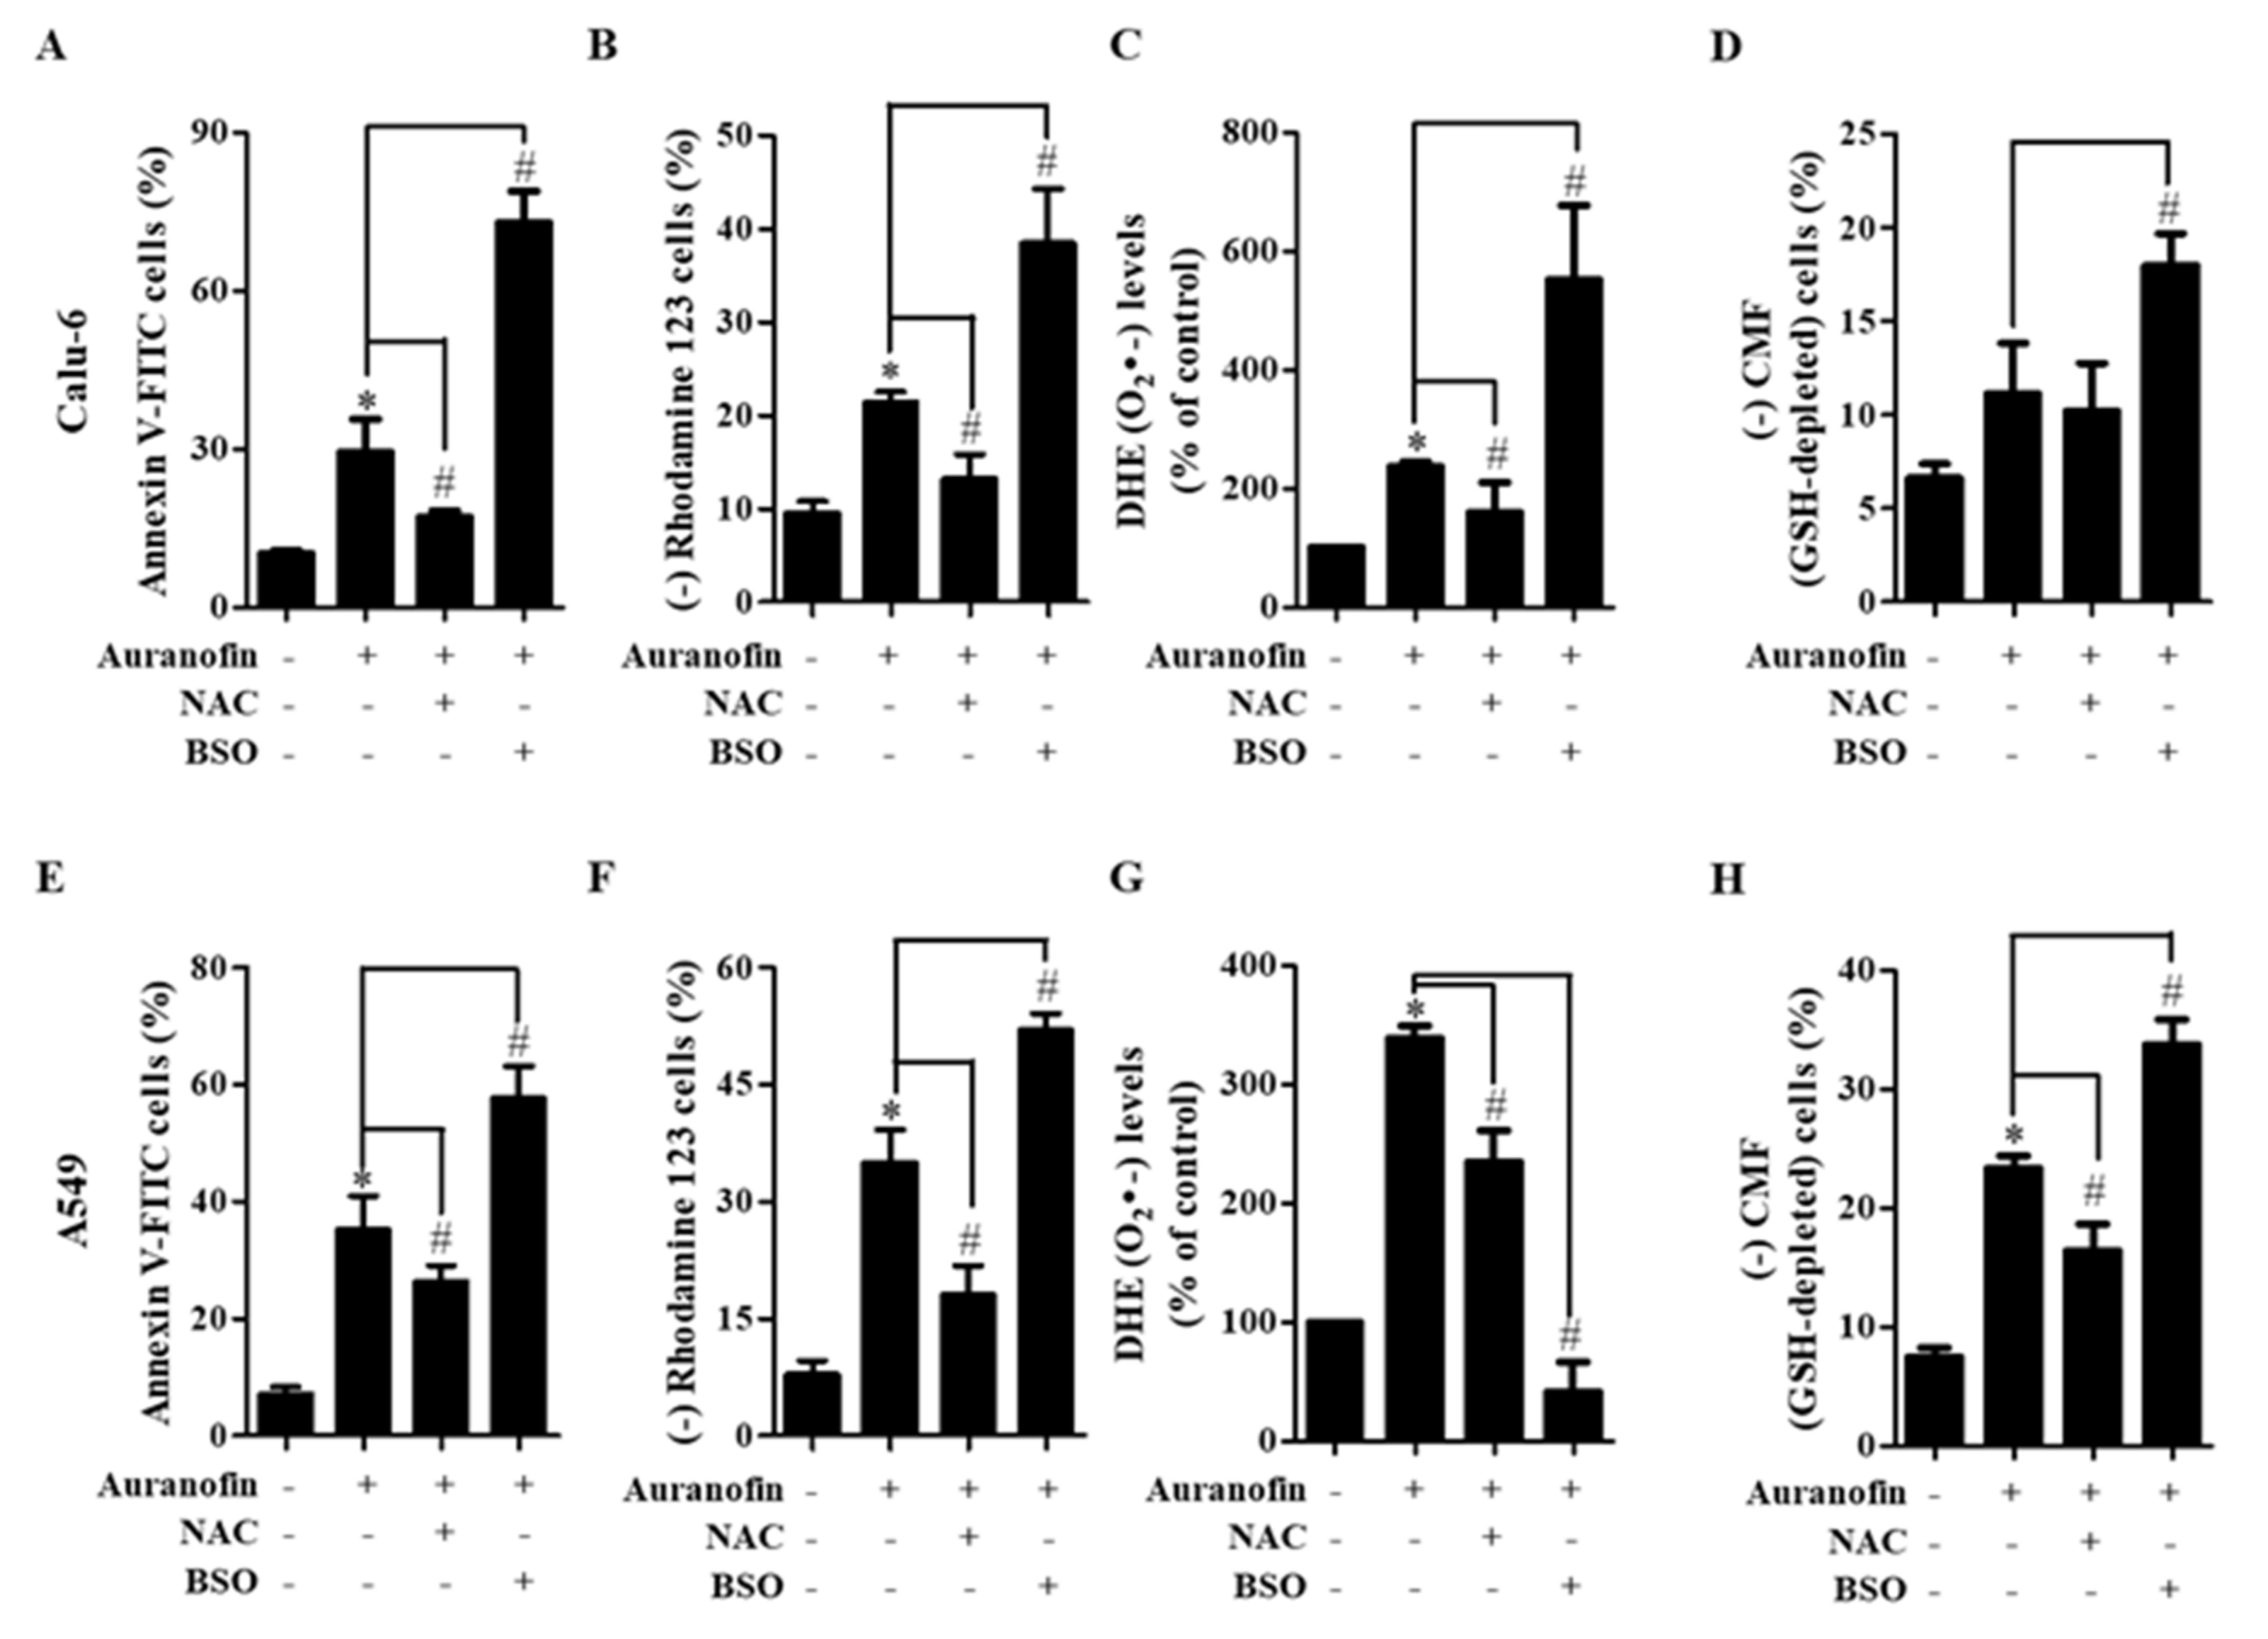
3.4. Effects of NAC and BSO on Cell Death, MMP (ΔΨm), ROS Level, and GSH Depletion in Auranofin-Treated Calu-6 and A549 Cells

Because auranofin is an inhibitor of TrxR that affects the cellular redox status, we investigated the effects of NAC (a well-known antioxidant) or BSO (an inhibitor of GSH synthesis) on the death of auranofin-treated Calu-6 and A549 cells. For this experiment, we used 3 or 5 μM auranofin as a suitable concentration for Calu-6 or A549 cells, respectively. Treatment with auranofin significantly elevated the number of annexin V-FITC-positive cells at 24 h in Calu-6 and A549 cells. Moreover, treatment with NAC slightly prevented cell death, but the treatment with BSO dramatically increased the number of annexin V-FITC-positive cells in these two cell lines (Figure 5A,E). Because cell death is closely related to the collapse of MMP (ΔΨm) interruption, we evaluated MMP (ΔΨm) in cells treated with auranofin, NAC, and BSO at 24 h using rhodamine 123. Treatment with 3 and 5 μM auranofin significantly induced the loss of MMP (ΔΨm) in Calu-6 and A549 cells, respectively. Treatment with NAC prevented the loss of MMP (ΔΨm) caused by auranofin, whereas BSO treatment significantly intensified this loss in these cells (Figure 5B,F). We next examined whether ROS levels in auranofin-treated Calu-6 and A549 cells were altered by NAC or BSO treatment. As anticipated, auranofin treatment significantly increased the levels of O2•− in Calu-6 and A549 cells at 24 h, and NAC treatment decreased these levels (Figure 5C,G). Treatment with BSO dramatically augmented the increased O2•− levels in auranofin-treated Calu-6 cells (Figure 5C), but it failed to enhance the levels of O2•− in auranofin-treated A549 cells (Figure 5G). Concerning GSH depletion, auranofin treatment alone caused an increase in the number of GSH-depleted Calu-6 and A549 cells. Treatment with NAC decreased the number of GSH-depleted cells induced by auranofin in Calu-6 and A549 cells, whereas BSO treatment intensified the GSH depletion induced by auranofin in these cells (Figure 5D,H). These results showed that NAC slightly prevented cell death, but BSO dramatically increased cell death.

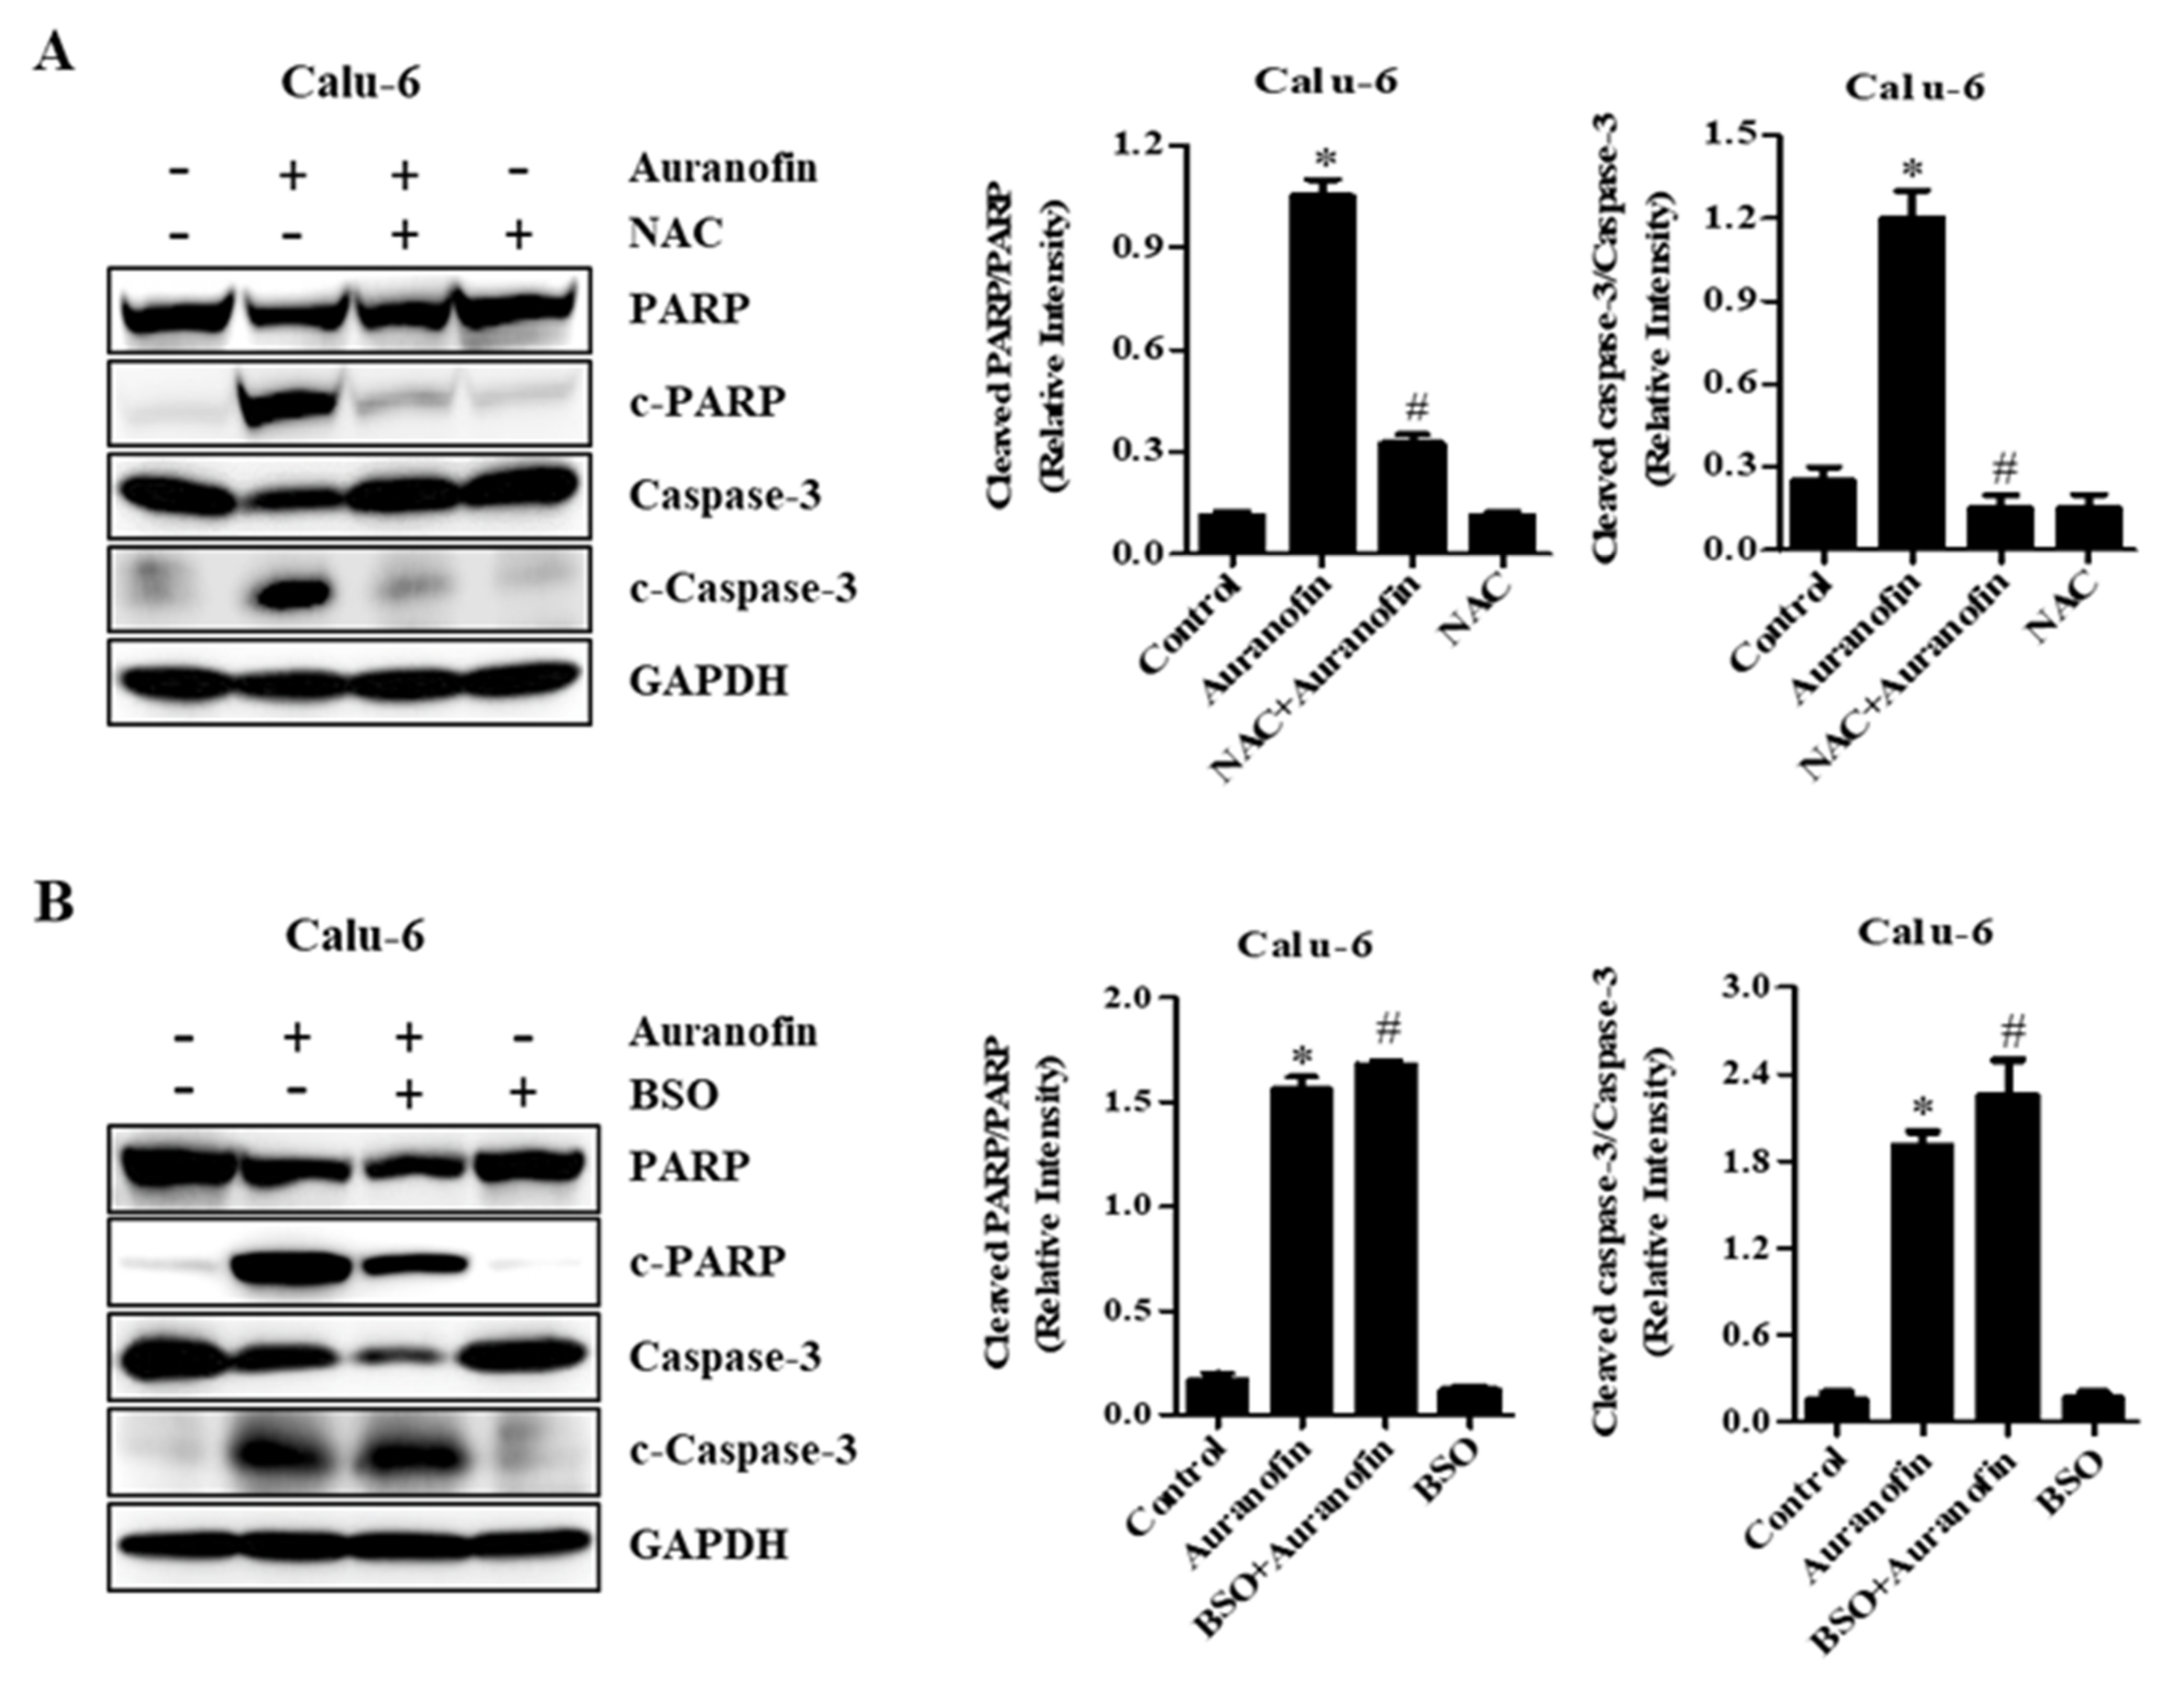
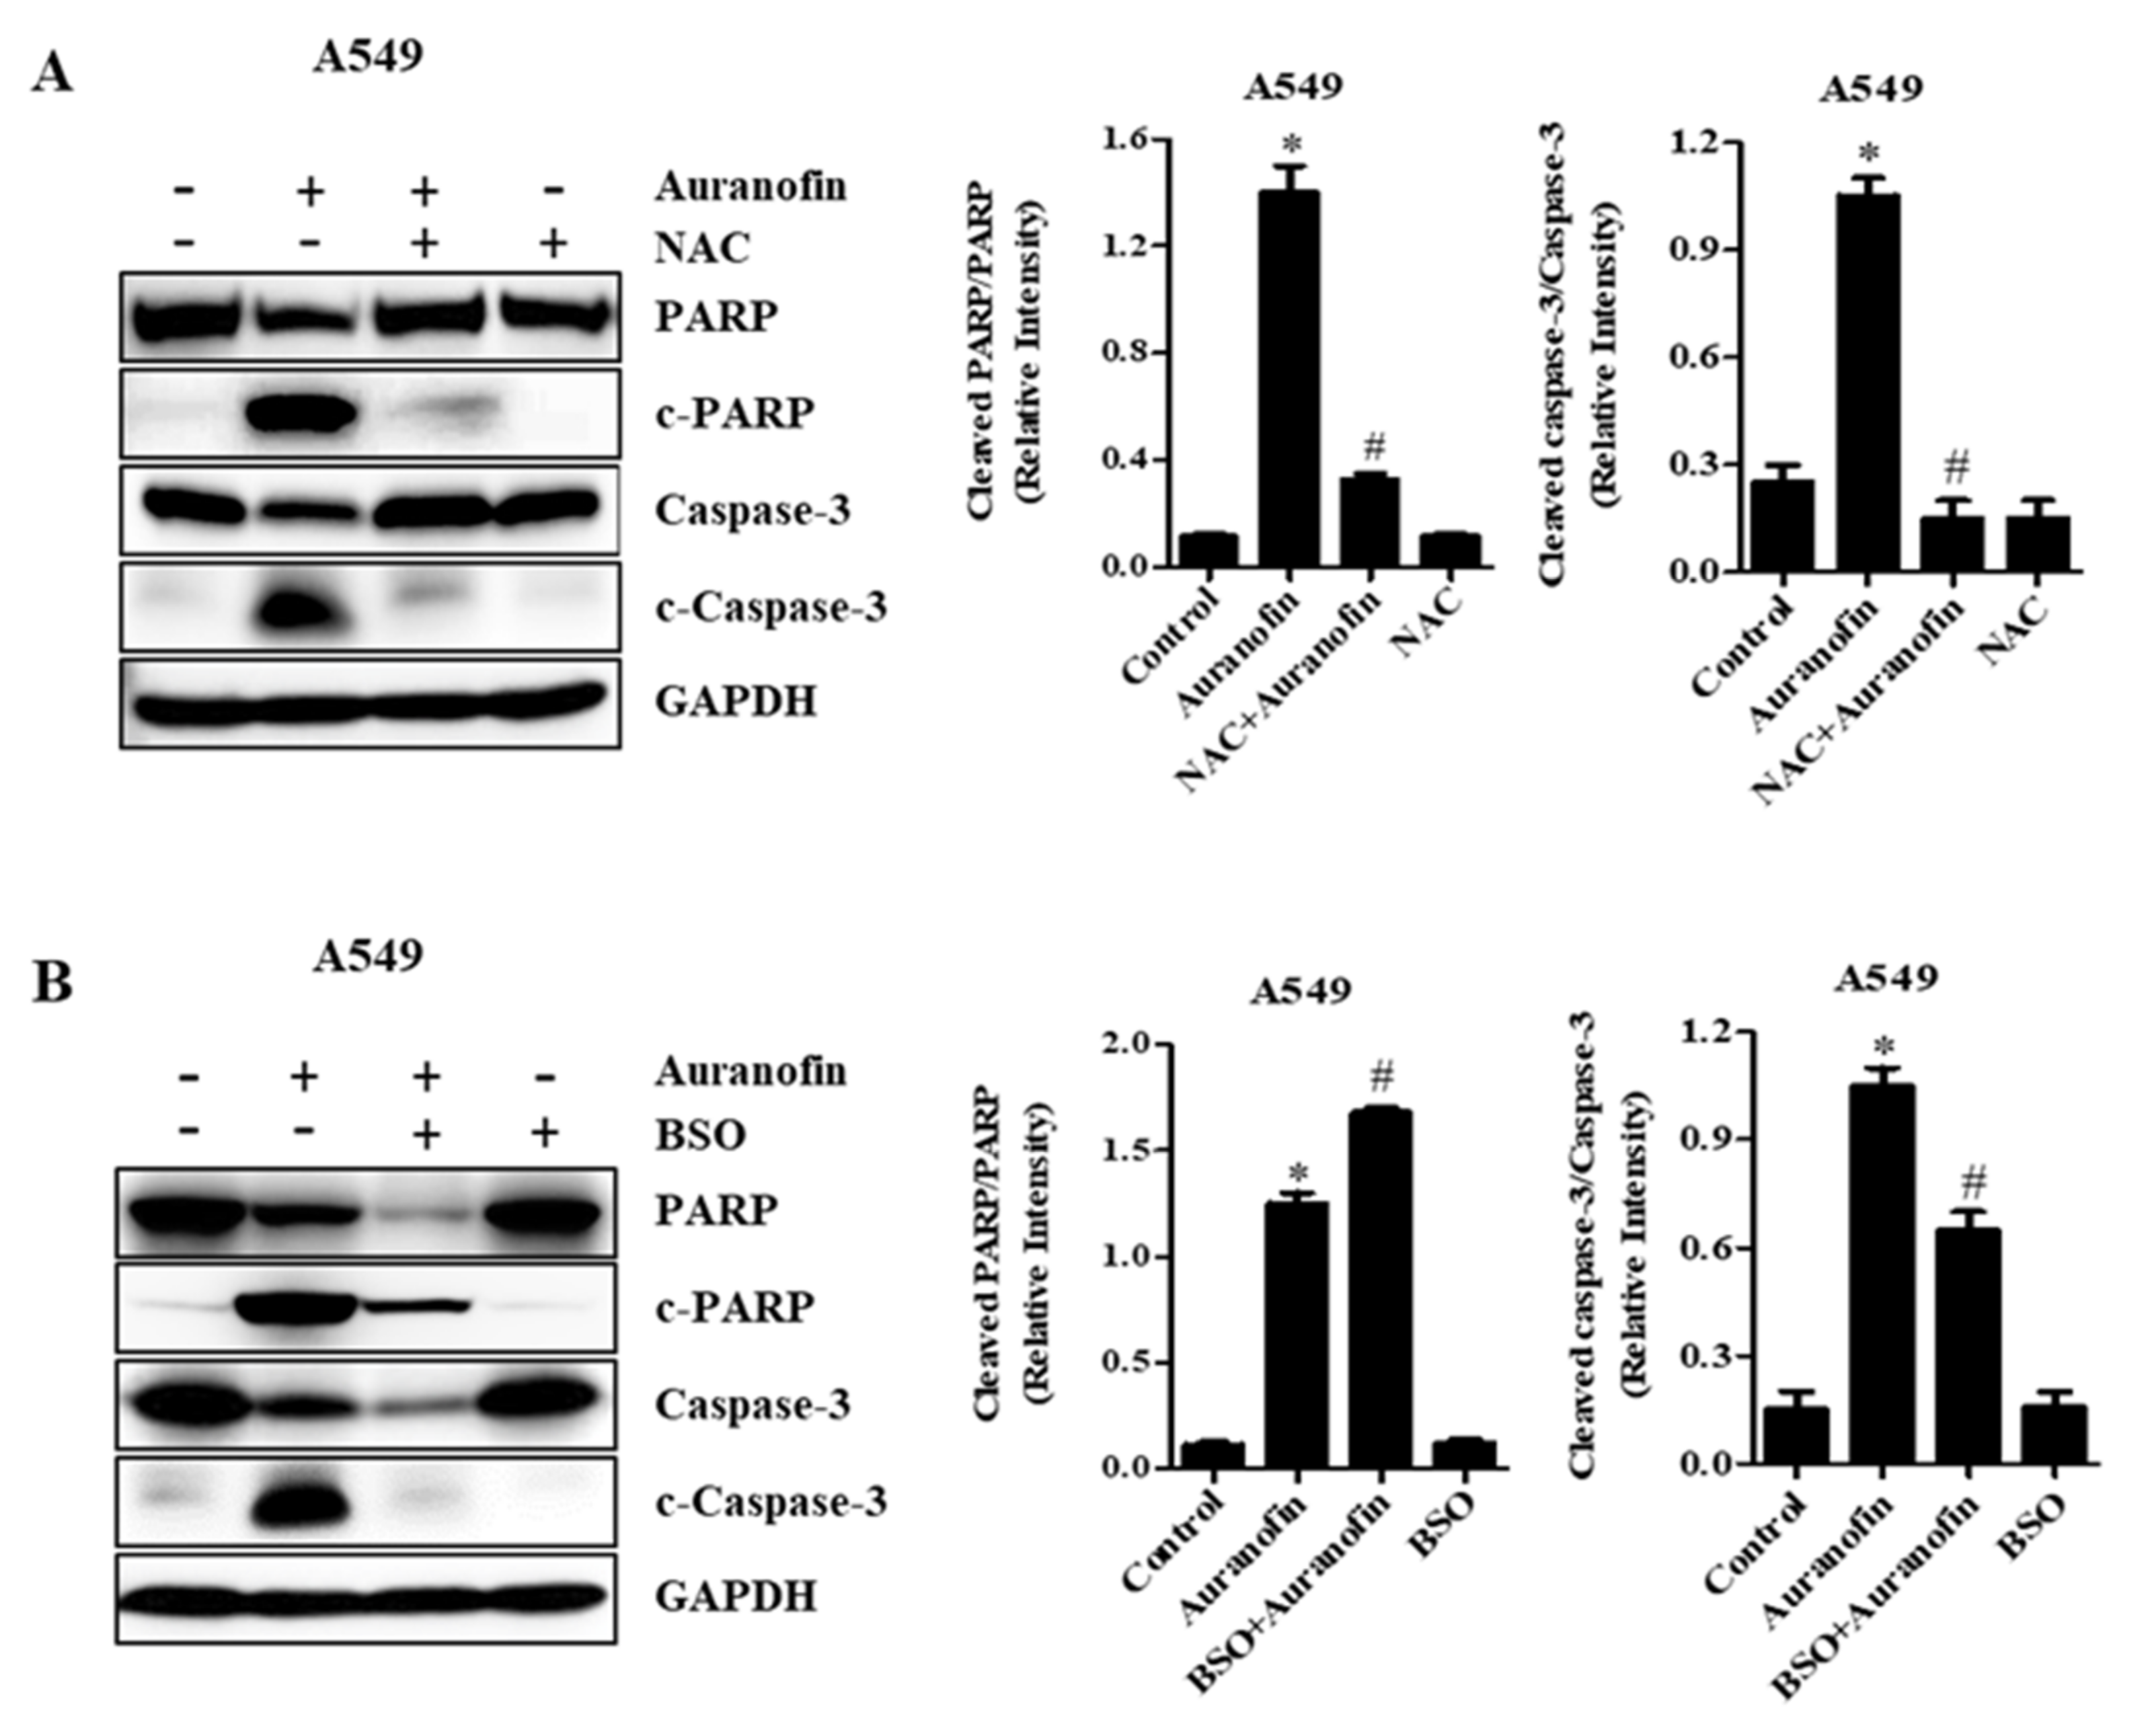
3.5. Effects of NAC and BSO on Apoptosis-Related Protein Levels in Calu-6 and A549 Cells

To examine the relationship between ROS accumulation and cell apoptosis, PARP degradation and caspase-3 cleavage as apoptotic markers were measured by Western blot analysis in auranofin-treated Calu-6 and A549 cells under different redox states using NAC or BSO. As anticipated, compared with the control group, activated caspase-3 and cleaved PARP were strongly expressed upon treatment with auranofin in Calu-6 and A549 cells (Figure 6 and Figure 7). However, the expression levels of caspase-3 and PARP were remarkably reduced in auranofin-treated Calu-6 and A549 cells (Figure 6 and Figure 7). Moreover, pretreatment with NAC and subsequent treatment with auranofin elevated the expression levels of intact caspase-3 and PARP compared to those obtained with auranofin treatment alone in Calu-6 and A549 cells, whereas caspase-3 cleavage and PARP degradation by auranofin were prevented in the presence of NAC in these cells (Figure 6A and Figure 7A). In cells pretreated with BSO and then co-treated with auranofin, the expression levels of procaspase-3 and PARP were further decreased compared with auranofin treatment in the absence of BSO in Calu-6 and A549 cells (Figure 6B and Figure 7B). Activated caspase-3 in cells pretreated with BSO and co-treated with auranofin was detected similarly to the changes observed in auranofin-treated Calu-6 cells (Figure 6B). In A549 cells treated with BSO and auranofin, despite a diminishing level of procaspase-3, cleaved active caspase-3 fragments were not detected (Figure 7B). Furthermore, cleaved PARP was observed in the combined treatment with BSO and auranofin compared with controls in Calu-6 and A549 cells (Figure 6B and Figure 7B). The ratio of cleaved PARP/PARP and cleaved caspase-3/caspase-3 were increased in auranofin-treated Calu-6 and A549 cells. However, these were decreased in auranofin and BSO treated in these cells. These results suggest that apoptosis is a basic mechanism of auranofin-mediated cell death, and that NAC and BSO differently affect auranofin-induced apoptosis in lung cancer cells.

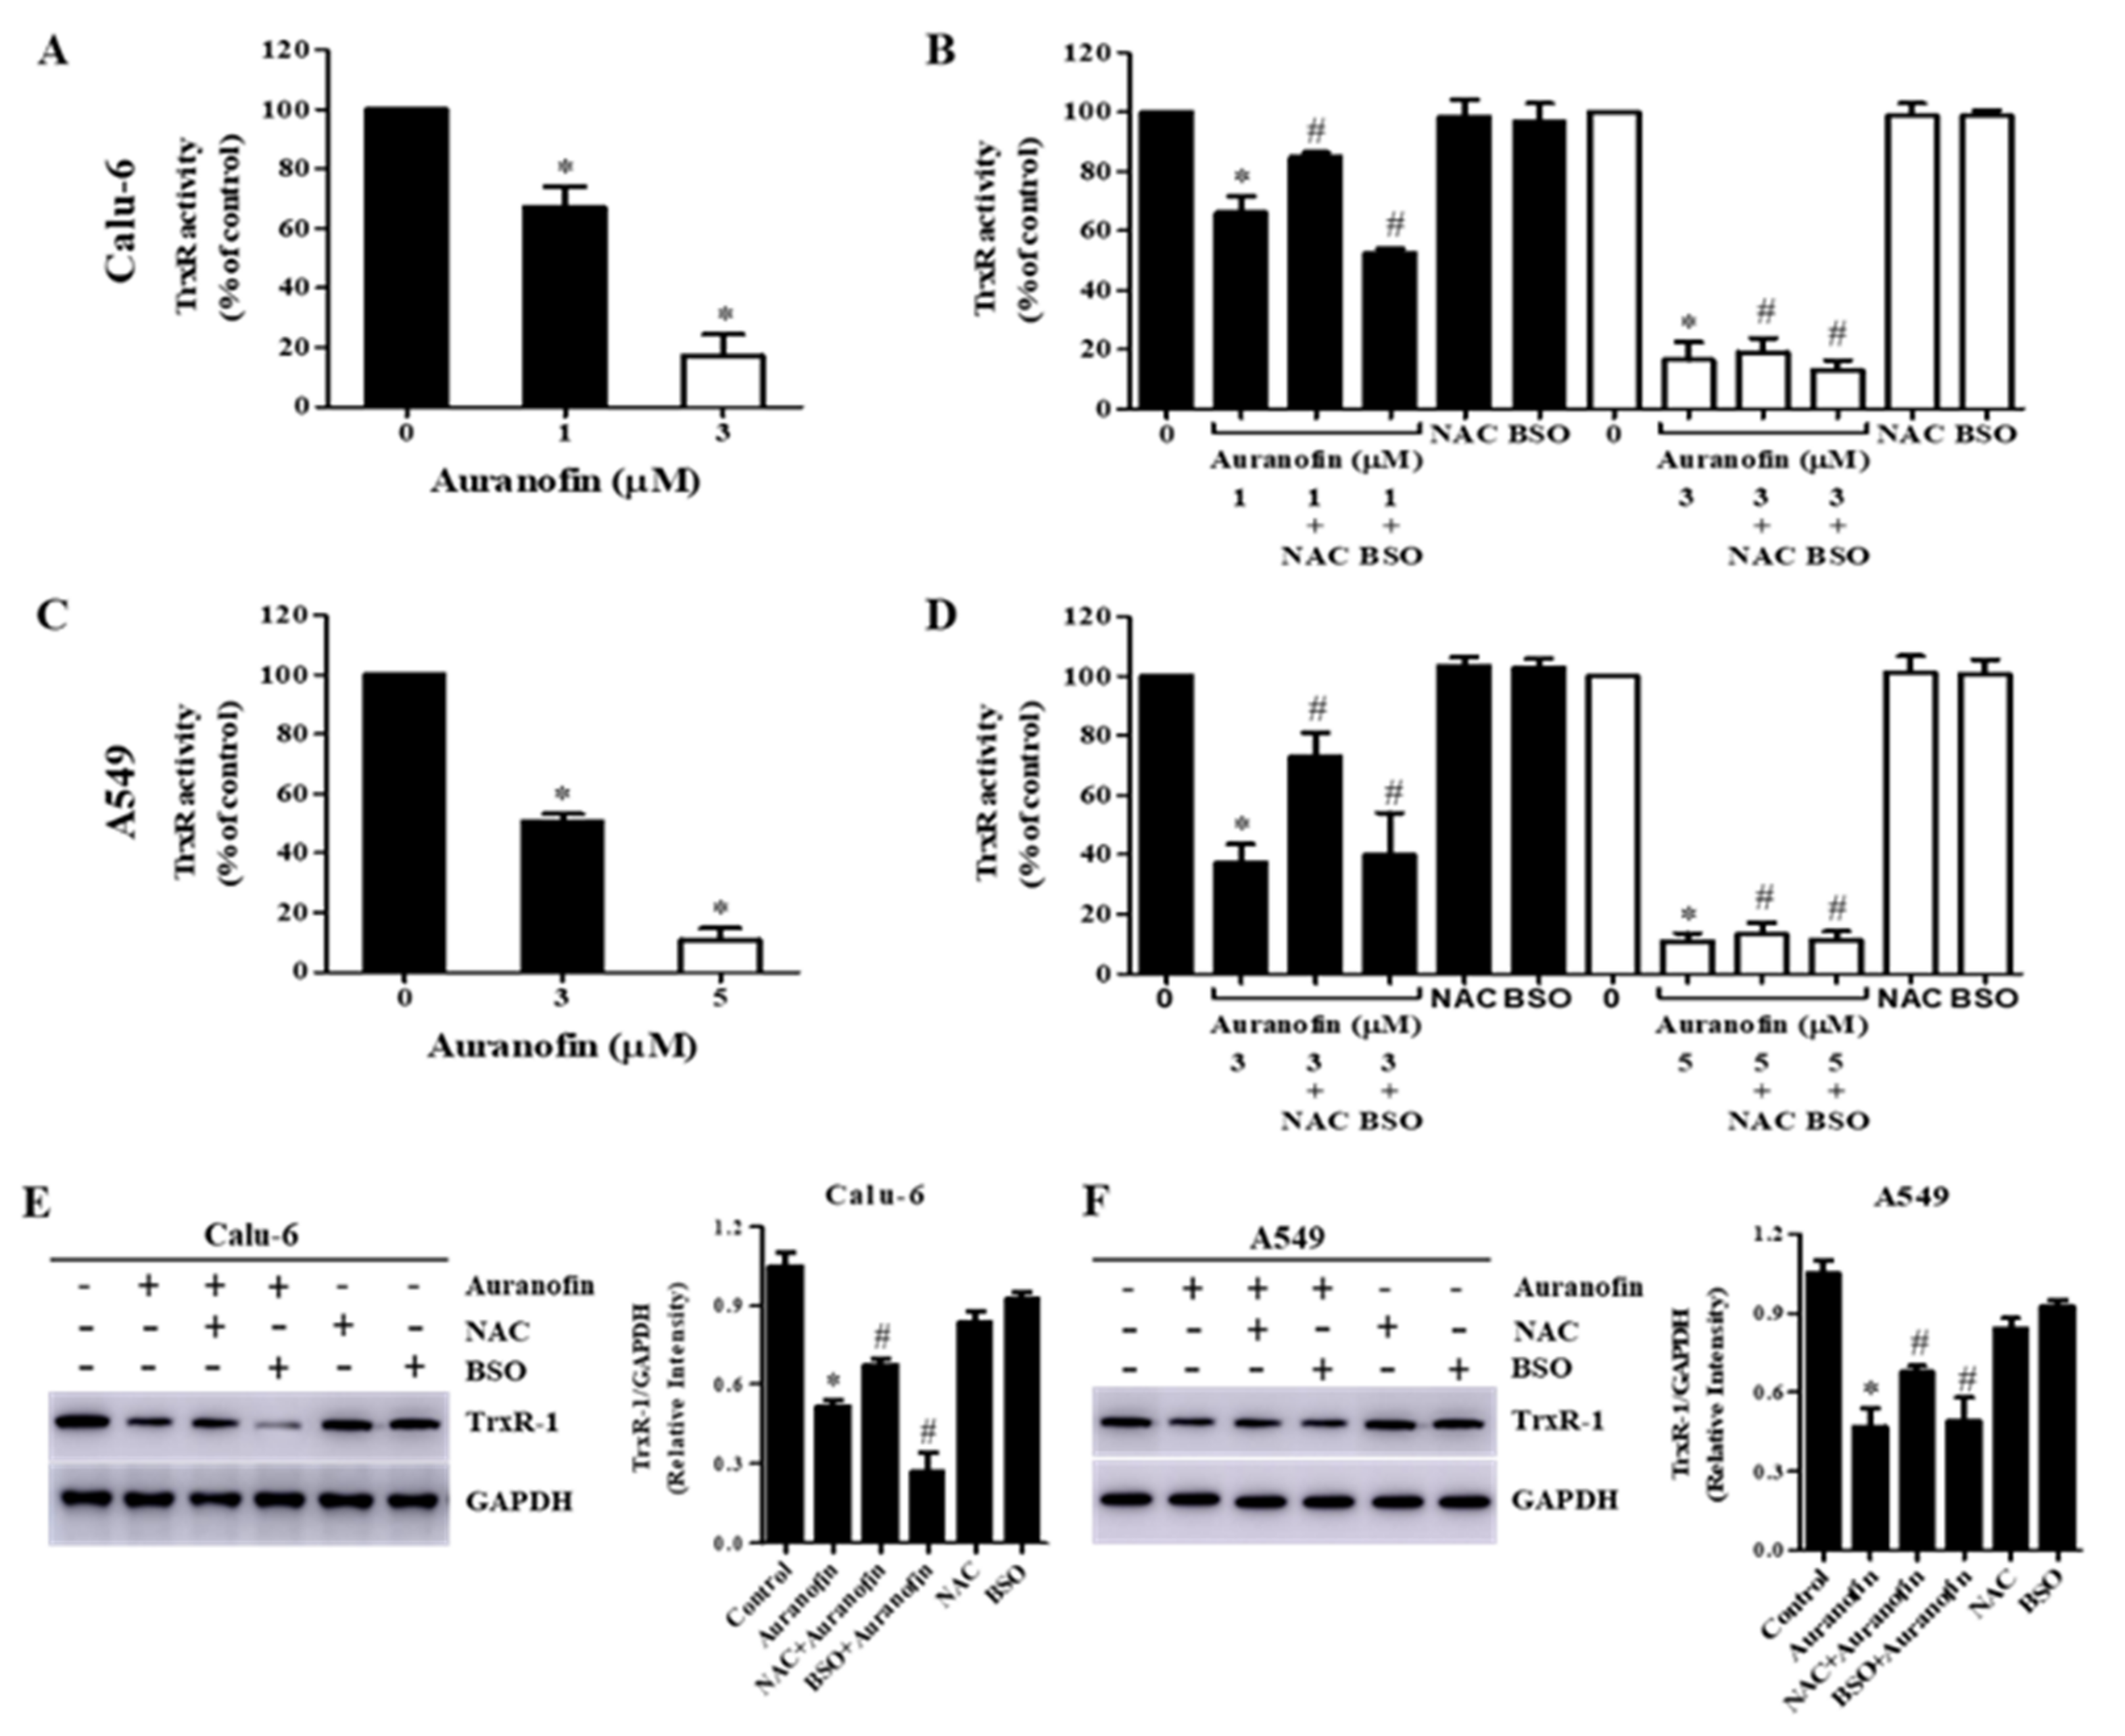
3.6. Effects of NAC and BSO on TrxR Activity in Auranofin-Treated Calu-6 and A549 Cells

Inhibition of TrxR activity by auranofin results in increased intracellular oxidative stress and induces cell death. As anticipated, after exposure to auranofin for 24 h, we observed that TrxR activity was dose-dependently decreased with concentrations of ≥IC50 in Calu-6 and A549 cells (Figure 8A,C). To further investigate the changes in TrxR activity in different redox states, we analyzed TrxR activity in Calu-6 and A549 cells treated with auranofin and NAC or BSO. Relatively low and high concentrations of auranofin were also used to differentiate altered ion levels of TrxR activity in Calu-6 and A549 cells, respectively. We observed that pretreatment with NAC prevented the decrease in TrxR activity induced by auranofin in both Calu-6 and A549 cells, whereas BSO enhanced the reduction in TrxR activity induced by auranofin in only Calu-6 cells (Figure 8B,D). Auranofin and NAC treatments upregulated the expression of TrxR-1 protein levels. However, auranofin and BSO treatments downregulated the expression of TrxR-1 protein levels in both cells (Figure 8E,F). These results showed that TrxR activity was reduced in auranofin-treated Calu-6 and A549 cells and its activity was increased by NAC, but decreased by BSO.

4. Discussion

Gold compounds have been used in medicine since ancient times, and their use can be dated to more than 2000 years ago [40]. Among gold-containing drugs, auranofin is an oral FDA-approved antirheumatic drug introduced in 1985, and it has since been explored for its potential repurposing to treat various other pathologies [31,32,33,34,40,41,42,43]. In particular, studies have demonstrated potent antitumor effects of auranofin in various types of cancer [31,44], and it is currently under clinical trials for the treatment of leukemia [45]. Numerous studies have indicated that auranofin inhibits TrxR activity and increases the intracellular ROS levels [31,46,47,48]. As auranofin has high affinity for protein thiol and selenol groups, it presumably binds to the active sites of TrxR, thereby inhibiting its activity [49]. Consequently, auranofin-induced inhibition of TrxR results in ROS accumulation and induces apoptosis and cell death. Our previous report indicated that auranofin inhibits cell growth and induces apoptosis in lung cancer cells [39]. In the present study, we examined in more detail the antitumor effects of auranofin on lung cancer cells in relation to ROS levels.
Our results indicated that auranofin diminished cell proliferation and induced cell death in HPF normal lung cells and cells from the five NSCLC cell lines Calu-6, A549, SK-LU-1, NCI-H460, and NCI-H1299 in a dose-dependent manner. The susceptibility to auranofin with an IC50 of 4–5 μM at 24 h in A549 (LUAD) and SK-LU-1 (LUAD) cells was lower than that in Calu-6, NCI-H460 (LULC), and NCI-H1299 (LULC) cells. Although both NCI-H460 and NCI-H1299 are large-cell carcinoma cell lines, NCI-H1299 cells were more sensitive to auranofin with an IC50 of 1–2 μM. This agent also inhibited the growth of normal HPF lung cells. However, the auranofin susceptibility of A549 and SK-LU-1 cells was higher than that of normal lung cells. This finding implies that auranofin can be an effective antitumor agent for lung cancer; however, before using it in a clinical trial, we must first consider the differential susceptibility of auranofin depending on the types of the lung cancer cells.
Intracellular ROS overproduction or antioxidant imbalance can cause oxidative stress that finally damages cells [50,51]. The GSH and Trx systems are two important ROS scavenging pathways in cells that regulate redox homeostasis [52,53]. The Trx system is considered as an antitumor target, and TrxR, which is a key component of the Trx system, is an important modulator of tumor development [20,21,22]. Therefore, TrxR inhibition can induce cell death by causing oxidative stress. According to our results, auranofin treatment increased the levels of ROS (DCF), including O2•− (DHE), at 24 h in normal HPF lung cells and in cells from the five lung cancer cell lines. However, the alteration patterns of ROS and O2•− levels varied depending on the incubation concentration of auranofin and the cell type. At relatively high concentrations of auranofin, the levels of ROS (DCF) such as H2O2 were decreased in all the tested cells, and those of O2•− (DHE) were reduced in SK-LU-1 and NCI-H1299 cells. These patterns were also observed in A549 cells pretreated with BSO and co-treated with auranofin. Because a high concentration of auranofin-induced cell death and MMP (ΔΨm) loss in lung cancer cells, it is possible that accumulated H2O2 conspicuously generates O2•− via mitochondrial damage, and H2O2 and O2•− are efficiently converted into toxic OH through the Fenton reaction [54] to kill lung cancer cells. NAC can act as a direct antioxidant for some oxidant species such as NO2 and HOX. The antioxidant activity of NAC could also be due to its effect in breaking thiolated proteins, thereby releasing free thiols as well as reduced proteins, which in some cases, such as for mercaptoalbumin, have important direct antioxidant activity. In addition to being involved in the antioxidant mechanism, the disulfide breaking activity of NAC explains its mucolytic activity, which is due to its effect in reducing heavily cross-linked mucus glycoproteins. The chemical features explaining the efficient disulfide breaking activity of NAC have also been explained [55]. Moreover, NAC, an antioxidant, attenuated the auranofin-induced MMP (ΔΨm) loss and O2•− levels in Calu-6 and A549 cells, whereas BSO, an inhibitor of GSH synthesis, intensified the auranofin-mediated MMP (ΔΨm) loss in these cells but enhanced the levels of O2•− in only auranofin-treated Calu-6 cells.
The GSH system utilizes NADPH as an electron donor like the Trx system. GSH is a nonprotein antioxidant and prevents cells from damage caused by oxidative stress [53,56]. The thiol group of cysteine in GSH supplies an electron to unstable molecules, and GSH itself is then oxidized. When GSH is converted into its oxidized form, it is reduced back by GSH reductase [57,58,59]. GSH is involved in several biological processes, including cell survival, and its depletion augments cellular susceptibility to apoptosis [53,60]. Importantly, we observed that auranofin dose-dependently increased the number of GSH-depleted cells in normal HPF lung cells and cells from the five lung cancer cell lines. Moreover, treatment with NAC ameliorated the auranofin-induced apoptosis and GSH depletion in Calu-6 and A549 cells. Hence, NAC plays a role as a precursor of GSH and an antioxidant in lung cancer cells, whereas BSO significantly accelerates an increase in apoptosis and GSH depletion in auranofin-treated Calu-6 and A549 cells. These results demonstrate that GSH inhibition effectively enhances cell death in auranofin-resistant lung cancer cells.
Apoptosis is controlled by extrinsic and intrinsic pathways, which are also known as the death receptor and mitochondrial pathways, respectively [61]. Caspase activation is a critical process in apoptosis. Caspases are a family of cysteine proteases that are divided into initiator caspases (caspase-2, -8, -9, and -10) and executioner caspases (caspase-3, -6, and -7) [61,62,63] Caspase-3 activation is a crucial event in both pathways of apoptosis that results in the downstream cleavage of various cytoplasmic or nuclear substrates, including PARP, which causes degradation of the cytoskeleton and DNA fragmentation, ultimately leading to apoptosis [64,65,66]. Similarly, in the present study, we found that caspase-3 activation and PARP degradation were induced by auranofin in Calu-6 and A549 cells. Pretreatment with an ROS scavenger restored these changes in Calu-6 and A549 cells, whereas pretreatment with BSO intensified the decreases of procaspase-3 and PARP. These results show that auranofin-mediated apoptosis may be a consequence of ROS-dependent damage.
Trx and TrxR are overexpressed in several cancer cells, including lung cancer, and high levels of these proteins are potentially linked to cancer proliferation and chemotherapeutic resistance [67,68,69]. For instance, studies have reported that the inhibition of Trx and TrxR increases the sensitivity of cancer cells to radiotherapy and anticancer agents in various cancers [48,70,71,72,73]. Therefore, regulation of the Trx system can be a prime target for cancer therapy. Our previous result indicated that auranofin dose-dependently reduced the activity of TrxR in Calu-6 and A549 cells [39], and, moreover, NAC prevented the decrease of TrxR activity induced by auranofin in Calu-6 and A549 cells. However, BSO augmented the decrease of TrxR activity induced by auranofin in Calu-6 cells but had no effect on TrxR activity in auranofin-treated A549 cells.
In conclusion, auranofin induced the growth inhibition and death of lung cancer cells, which were accompanied by increased ROS levels and GSH depletion. In addition, the changes in ROS and GSH levels upon treatment with NAC or BSO affected cell growth inhibition and death in auranofin-treated lung cancer cells. These results suggest that auranofin, a TrxR inhibitor, is an effective anti-cancer drug for patients with lung cancer. Our study findings also provide useful information for better understanding the anti-cancer effects of auranofin in lung cancer cells with respect to ROS and GSH levels.

Author Contributions

Conceptualization, W.H.P.; methodology, X.Y.C. and S.H.P.; software, X.Y.C. and S.H.P.; validation, X.Y.C. and S.H.P.; formal analysis, X.Y.C. and S.H.P.; investigation, W.H.P.; resources, W.H.P.; data curation, X.Y.C. and S.H.P.; writing—original draft preparation, X.Y.C. and S.H.P.; writing—review and editing, W.H.P. and X.Y.C.; visualization, X.Y.C. and S.H.P.; supervision, W.H.P.; project administration, W.H.P.; funding acquisition, W.H.P. All authors have read and agreed to the published version of the manuscript.

Funding

The present study was supported by “Research Base Construction fund Support Program” funded by Jeonbuk National University in 2022 and the Basic Science Research Program through the National Research Foundation of Korea (NRF) funded by the Ministry of Education (2019R1I1A2A01041209).

Institutional Review Board Statement

The material in this paper has not been published and is not under active consideration by another journal. The research was conducted in accordance with the Declaration of Helsinki.

Informed Consent Statement

Not applicable.

Data Availability Statement

Data collected during the present study are available from the corresponding author upon reasonable request.

Conflicts of Interest

The authors declare no conflict of interest.

Abbreviations

BSOl-buthionine sulfoximine
CMFDA5-chloromethylfluorescein diacetate
DHEdihydroethidium
DMSOdimethyl sulfoxide
DTNB5,5′-dithiobis (2-nitrobenzoic acid)
Ex/EmExcitation/Emission
FBSfetal bovine serum
FDAFood and Drug Administration
FITCfluorescein isothiocyanate
GSHglutathione
H2DCFDA2′,7′-dichlorodihydrofluorescein diacetate
H2O2hydrogen peroxide
HPFhuman pulmonary fibroblast
LUADlung adenocarcinoma
LULClung large-cell carcinoma
LUSClung squamous cell carcinoma
MMPmitochondrial membrane potential (∆Ψm)
NACN-acetyl cysteine
NADPHnicotinamide adenine dinucleotide phosphate
NSCLCnon-small-cell lung cancer
ONOO•peroxynitrite
PARPpoly (ADP ribose) polymerase
PBSphosphate-buffered saline
PVDFpoly-vinylidene difluoride
redoxreduction-oxidation
RIPAradio immunoprecipitation assay
ROSreactive oxygen species
SCLCsmall-cell lung cancer
SDS-PAGEsodium dodecyl sulfate-polyacrylamide gel electrophoresis
Trxthioredoxin
TrxRthiore-doxin reductase
•OHhydroxyl radical

References

  1. Bray, F.; Ferlay, J.; Soerjomataram, I.; Siegel, R.L.; Torre, L.A.; Jemal, A. Global cancer statistics 2018: GLOBOCAN estimates of incidence and mortality worldwide for 36 cancers in 185 countries. CA Cancer J. Clin. 2018, 68, 394–424. [Google Scholar] [CrossRef] [PubMed]
  2. Blandin Knight, S.; Crosbie, P.A.; Balata, H.; Chudziak, J.; Hussell, T.; Dive, C. Progress and prospects of early detection in lung cancer. Open Biol. 2017, 7, 170070. [Google Scholar] [CrossRef] [PubMed]
  3. Watanabe, T.; Miura, T.; Degawa, Y.; Fujita, Y.; Inoue, M.; Kawaguchi, M.; Furihata, C. Comparison of lung cancer cell lines representing four histopathological subtypes with gene expression profiling using quantitative real-time PCR. Cancer Cell Int. 2010, 10, 2. [Google Scholar] [CrossRef] [PubMed]
  4. Xu, Q.; Wang, Y.; Liu, H.; Meng, S.; Zhou, S.; Xu, J.; Schmid-Bindert, G.; Zhou, C. Treatment outcome for patients with primary NSCLC and synchronous solitary metastasis. Clin. Transl. Oncol. 2013, 15, 802–809. [Google Scholar] [CrossRef]
  5. De Silva, M.; Itchins, M.; Pavlakis, N. Breakthrough 5-year survival with pembrolizumab in Keynote-001 study: Horizon shifting in advanced non-small cell lung cancer with immune check point inhibition. Ann. Transl. Med. 2020, 8, 555. [Google Scholar] [CrossRef]
  6. Noreldeen, H.A.A.; Liu, X.; Xu, G. Metabolomics of lung cancer: Analytical platforms and their applications. J. Sep. Sci. 2020, 43, 120–133. [Google Scholar] [CrossRef]
  7. Sharma, P.; Mehta, M.; Dhanjal, D.S.; Kaur, S.; Gupta, G.; Singh, H.; Thangavelu, L.; Rajeshkumar, S.; Tambuwala, M.; Bakshi, H.A.; et al. Emerging trends in the novel drug delivery approaches for the treatment of lung cancer. Chem. Biol. Interact. 2019, 309, 108720. [Google Scholar] [CrossRef]
  8. Nagasaka, M.; Gadgeel, S.M. Role of chemotherapy and targeted therapy in early-stage non-small cell lung cancer. Expert Rev. Anticancer 2018, 18, 63–70. [Google Scholar] [CrossRef]
  9. Wang, L.; Li, X.; Ren, Y.; Geng, H.; Zhang, Q.; Cao, L.; Meng, Z.; Wu, X.; Xu, M.; Xu, K. Cancer-associated fibroblasts contribute to cisplatin resistance by modulating ANXA3 in lung cancer cells. Cancer Sci. 2019, 110, 1609–1620. [Google Scholar] [CrossRef]
  10. Becker, A.; van Wijk, A.; Smit, E.F.; Postmus, P.E. Side-effects of long-term administration of erlotinib in patients with non-small cell lung cancer. J. Thorac. Oncol. 2010, 5, 1477–1480. [Google Scholar] [CrossRef]
  11. Davalli, P.; Mitic, T.; Caporali, A.; Lauriola, A.; D’Arca, D. ROS, Cell Senescence, and Novel Molecular Mechanisms in Aging and Age-Related Diseases. Oxid. Med. Cell Longev. 2016, 2016, 3565127. [Google Scholar] [CrossRef]
  12. Sena, L.A.; Chandel, N.S. Physiological roles of mitochondrial reactive oxygen species. Mol. Cell. 2012, 48, 158–167. [Google Scholar] [CrossRef]
  13. Brieger, K.; Schiavone, S.; Miller, F.J., Jr.; Krause, K.H. Reactive oxygen species: From health to disease. Swiss Med. Wkly. 2012, 142, w13659. [Google Scholar] [CrossRef]
  14. Trachootham, D.; Alexandre, J.; Huang, P. Targeting cancer cells by ROS-mediated mechanisms: A radical therapeutic approach? Nat. Rev. Drug Discov. 2009, 8, 579–591. [Google Scholar] [CrossRef]
  15. Nogueira, V.; Hay, N. Molecular pathways: Reactive oxygen species homeostasis in cancer cells and implications for cancer therapy. Clin. Cancer Res. 2013, 19, 4309–4314. [Google Scholar] [CrossRef]
  16. Perillo, B.; Di Donato, M.; Pezone, A.; Di Zazzo, E.; Giovannelli, P.; Galasso, G.; Castoria, G.; Migliaccio, A. ROS in cancer therapy: The bright side of the moon. Exp. Mol. Med. 2020, 52, 192–203. [Google Scholar] [CrossRef]
  17. Hua, P.; Sun, M.; Zhang, G.; Zhang, Y.; Song, G.; Liu, Z.; Li, X.; Zhang, X.; Li, B. Costunolide Induces Apoptosis through Generation of ROS and Activation of P53 in Human Esophageal Cancer Eca-109 Cells. J. Biochem. Mol. Toxicol. 2016, 30, 462–469. [Google Scholar] [CrossRef]
  18. Park, W.H. Gallic acid induces HeLa cell death via increasing GSH depletion rather than ROS levels. Oncol. Rep. 2017, 37, 1277–1283. [Google Scholar] [CrossRef]
  19. Gao, C.; Sun, X.; Wu, Z.; Yuan, H.; Han, H.; Huang, H.; Shu, Y.; Xu, M.; Gao, R.; Li, S.; et al. A Novel Benzofuran Derivative Moracin N Induces Autophagy and Apoptosis Through ROS Generation in Lung Cancer. Front Pharm. 2020, 11, 391. [Google Scholar] [CrossRef]
  20. Lu, J.; Holmgren, A. The thioredoxin antioxidant system. Free Radic. Biol. Med. 2014, 66, 75–87. [Google Scholar] [CrossRef]
  21. Jia, J.J.; Geng, W.S.; Wang, Z.Q.; Chen, L.; Zeng, X.S. The role of thioredoxin system in cancer: Strategy for cancer therapy. Cancer Chemother. Pharm. 2019, 84, 453–470. [Google Scholar] [CrossRef]
  22. Arner, E.S.; Holmgren, A. Physiological functions of thioredoxin and thioredoxin reductase. Eur. J. Biochem. 2000, 267, 6102–6109. [Google Scholar] [CrossRef]
  23. Selenius, M.; Rundlof, A.K.; Olm, E.; Fernandes, A.P.; Bjornstedt, M. Selenium and the selenoprotein thioredoxin reductase in the prevention, treatment and diagnostics of cancer. Antioxid. Redox. Signal 2010, 12, 867–880. [Google Scholar] [CrossRef]
  24. Karlenius, T.C.; Tonissen, K.F. Thioredoxin and Cancer: A Role for Thioredoxin in all States of Tumor Oxygenation. Cancers 2010, 2, 209–232. [Google Scholar] [CrossRef]
  25. Mohammadi, F.; Soltani, A.; Ghahremanloo, A.; Javid, H.; Hashemy, S.I. The thioredoxin system and cancer therapy: A review. Cancer Chemother. Pharmacol. 2019, 84, 925–935. [Google Scholar] [CrossRef]
  26. Zheng, X.; Ma, W.; Sun, R.; Yin, H.; Lin, F.; Liu, Y.; Xu, W.; Zeng, H. Butaselen prevents hepatocarcinogenesis and progression through inhibiting thioredoxin reductase activity. Redox Biol. 2018, 14, 237–249. [Google Scholar] [CrossRef]
  27. Bhatia, M.; McGrath, K.L.; Di Trapani, G.; Charoentong, P.; Shah, F.; King, M.M.; Clarke, F.M.; Tonissen, K.F. The thioredoxin system in breast cancer cell invasion and migration. Redox Biol. 2016, 8, 68–78. [Google Scholar] [CrossRef]
  28. Lim, J.Y.; Yoon, S.O.; Hong, S.W.; Kim, J.W.; Choi, S.H.; Cho, J.Y. Thioredoxin and thioredoxin-interacting protein as prognostic markers for gastric cancer recurrence. World J. Gastroenterol. 2012, 18, 5581–5588. [Google Scholar] [CrossRef]
  29. Uzawa, K.; Iwasawa, S.; Yamano, Y.; Takiguchi, Y.; Tanzawa, H.; Tatsumi, K. Upregulation of thioredoxin reductase 1 in human oral squamous cell carcinoma. Oncol. Rep. 2011, 25, 637–644. [Google Scholar] [CrossRef]
  30. Fernandes, A.P.; Capitanio, A.; Selenius, M.; Brodin, O.; Rundlöf, A.-K.; Björnstedt, M. Expression profiles of thioredoxin family proteins in human lung cancer tissue: Correlation with proliferation and differentiation. Histopathology 2009, 55, 313–320. [Google Scholar] [CrossRef]
  31. Onodera, T.; Momose, I.; Kawada, M. Potential Anticancer Activity of Auranofin. Chem. Pharm. Bull. 2019, 67, 186–191. [Google Scholar] [CrossRef] [PubMed]
  32. Chaffman, M.; Brogden, R.; Heel, R.; Speight, T.; Avery, G.J.D. Auranofin. A preliminary review of its pharmacological properties and therapeutic use in rheumatoid arthritis. Drugs 1984, 27, 378–424. [Google Scholar] [CrossRef] [PubMed]
  33. Madeira, J.M.; Gibson, D.L.; Kean, W.F.; Klegeris, A. The biological activity of auranofin: Implications for novel treatment of diseases. Inflammopharmacology 2012, 20, 297–306. [Google Scholar] [CrossRef] [PubMed]
  34. Roder, C.; Thomson, M.J. Auranofin: Repurposing an Old Drug for a Golden New Age. Drugs R&D 2015, 15, 13–20. [Google Scholar] [CrossRef]
  35. Rigobello, M.P.; Messori, L.; Marcon, G.; Cinellu, M.A.; Bragadin, M.; Folda, A.; Scutari, G.; Bindoli, A. Gold complexes inhibit mitochondrial thioredoxin reductase: Consequences on mitochondrial functions. J. Inorg. Biochem. 2004, 98, 1634–1641. [Google Scholar] [CrossRef]
  36. Zhang, X.; Selvaraju, K.; Saei, A.A.; D’Arcy, P.; Zubarev, R.A.; Arnér, E.S.; Linder, S. Repurposing of auranofin: Thioredoxin reductase remains a primary target of the drug. Biochimie 2019, 162, 46–54. [Google Scholar] [CrossRef]
  37. Fiskus, W.; Saba, N.; Shen, M.; Ghias, M.; Liu, J.; Das Gupta, S.; Chauhan, L.; Rao, R.; Gunewardena, S.; Schorno, K.; et al. Auranofin Induces Lethal Oxidative and Endoplasmic Reticulum Stress and Exerts Potent Preclinical Activity against Chronic Lymphocytic Leukemia. Cancer Res. 2014, 74, 2520–2532. [Google Scholar] [CrossRef]
  38. Zou, P.; Chen, M.; Ji, J.; Chen, W.; Chen, X.; Ying, S.; Zhang, J.; Zhang, Z.; Liu, Z.; Yang, S.; et al. Auranofin induces apoptosis by ROS-mediated ER stress and mitochondrial dysfunction and displayed synergistic lethality with piperlongumine in gastric cancer. Oncotarget 2015, 6, 36505–36521. [Google Scholar] [CrossRef]
  39. Cui, X.Y.; Park, S.H.; Park, W.H. Auranofin inhibits the proliferation of lung cancer cells via necrosis and caspase-dependent apoptosis. Oncol. Rep. 2020, 44, 2715–2724. [Google Scholar] [CrossRef]
  40. Ott, I. On the medicinal chemistry of gold complexes as anticancer drugs. Co-ord. Chem. Rev. 2009, 253, 1670–1681. [Google Scholar] [CrossRef]
  41. Boullosa, L.F.; Van Loenhout, J.; Flieswasser, T.; De Waele, J.; Hermans, C.; Lambrechts, H.; Cuypers, B.; Laukens, K.; Bartholomeus, E.; Siozopoulou, V.; et al. Auranofin reveals therapeutic anticancer potential by triggering distinct molecular cell death mechanisms and innate immunity in mutant p53 non-small cell lung cancer. Redox Biol. 2021, 42, 101949. [Google Scholar] [CrossRef]
  42. Dunigan-Russell, K.; Li, Q.; Li, R.; Locy, M.L.; Wall, S.B.; Tipple, T.E. The thioredoxin reductase inhibitor auranofin induces heme oxygenase-1 in lung epithelial cells via Nrf2-dependent mechanisms. Am. J. Physiol. Cell. Mol. Physiol. 2018, 315, L545–L552. [Google Scholar] [CrossRef]
  43. Li, H.; Hu, J.; Wu, S.; Wang, L.; Cao, X.; Zhang, X.; Dai, B.; Cao, M.; Shao, R.; Zhang, R.; et al. Auranofin-mediated inhibition of PI3K/AKT/mTOR axis and anticancer activity in non-small cell lung cancer cells. Oncotarget 2015, 7, 3548–3558. [Google Scholar] [CrossRef]
  44. Gandin, V.; Fernandes, A.P.; Rigobello, M.P.; Dani, B.; Sorrentino, F.; Tisato, F.; Björnstedt, M.; Bindoli, A.; Sturaro, A.; Rella, R.; et al. Cancer cell death induced by phosphine gold(I) compounds targeting thioredoxin reductase. Biochem. Pharmacol. 2010, 79, 90–101. [Google Scholar] [CrossRef]
  45. Weir, S.J.; DeGennaro, L.J.; Austin, C.P. Repurposing Approved and Abandoned Drugs for the Treatment and Prevention of Cancer through Public-Private Partnership. Cancer Res. 2012, 72, 1055–1058. [Google Scholar] [CrossRef]
  46. You, B.R.; Park, W.H. Auranofin induces mesothelioma cell death through oxidative stress and GSH depletion. Oncol. Rep. 2016, 35, 546–551. [Google Scholar] [CrossRef]
  47. Hwang-Bo, H.; Jeong, J.-W.; Han, M.H.; Park, C.; Hong, S.-H.; Kim, G.-Y.; Moon, S.-K.; Cheong, J.; Kim, W.-J.; Yoo, Y.H.; et al. Auranofin, an inhibitor of thioredoxin reductase, induces apoptosis in hepatocellular carcinoma Hep3B cells by generation of reactive oxygen species. Gen. Physiol. Biophys. 2017, 36, 117–128. [Google Scholar] [CrossRef]
  48. Ehrenfeld, V.; Heusel, J.R.; Fulda, S.; Van Wijk, S.J.L. ATM inhibition enhances Auranofin-induced oxidative stress and cell death in lung cell lines. PLoS ONE 2020, 15, e0244060. [Google Scholar] [CrossRef]
  49. Di Sarra, F.; Fresch, B.; Bini, R.; Saielli, G.; Bagno, A. Reactivity of Auranofin with Selenols and Thiols-Implications for the Anticancer Activity of Gold(I) Compounds. Eur. J. Inorg. Chem. 2013, 2013, 2718–2727. [Google Scholar] [CrossRef]
  50. Ferrer, M.D.; Sureda, A.; Tauler, P.; Palacín, C.; Tur, J.A.; Pons, A. Impaired lymphocyte mitochondrial antioxidant defences in variegate porphyria are accompanied by more inducible reactive oxygen species production and DNA damage. Br. J. Haematol. 2010, 149, 759–767. [Google Scholar] [CrossRef]
  51. Uttara, B.; Singh, A.V.; Zamboni, P.; Mahajan, R.T. Oxidative Stress and Neurodegenerative Diseases: A Review of Upstream and Downstream Antioxidant Therapeutic Options. Curr. Neuropharmacol. 2009, 7, 65–74. [Google Scholar] [CrossRef]
  52. Powis, G.; Mustacich, D.; Coon, A. Medicine, The role of the redox protein thioredoxin in cell growth and cancer. Free Radic. Biol. Med. 2000, 29, 312–322. [Google Scholar] [CrossRef]
  53. Ortega, A.L.; Mena, S.; Estrela, J.M. Glutathione in Cancer Cell Death. Cancers 2011, 3, 1285–1310. [Google Scholar] [CrossRef]
  54. Winterbourn, C.C. Toxicity of iron and hydrogen peroxide: The Fenton reaction. Toxicol. Lett. 1995, 82–83, 969–974. [Google Scholar] [CrossRef]
  55. Aldini, G.; Altomare, A.A.; Baron, G.; Vistoli, G.; Carini, M.; Borsani, L.; Sergio, F. N-Acetylcysteine as an antioxidant and disulphide breaking agent: The reasons why. Free Radic. Res. 2018, 52, 751–762. [Google Scholar] [CrossRef]
  56. Hayes, J.; McLellan, L.I. Glutathione and glutathione-dependent enzymes represent a co-ordinately regulated defence against oxidative stress. Free Radic. Res. 1999, 31, 273–300. [Google Scholar] [CrossRef]
  57. Iversen, R.; Andersen, P.A.; Jensen, K.S.; Winther, J.R.; Sigurskjold, B.W. Thiol-Disulfide Exchange between Glutaredoxin and Glutathione. Biochemistry 2010, 49, 810–820. [Google Scholar] [CrossRef]
  58. Kumar, C.; Igbaria, A.; D’Autreaux, B.; Planson, A.-G.; Junot, C.; Godat, E.; Bachhawat, A.K.; Delaunay-Moisan, A.; Toledano, M.B. Glutathione revisited: A vital function in iron metabolism and ancillary role in thiol-redox control. EMBO J. 2011, 30, 2044–2056. [Google Scholar] [CrossRef]
  59. Dunning, S.; Rehman, A.U.; Tiebosch, M.H.; Hannivoort, R.A.; Haijer, F.W.; Woudenberg, J.; Heuvel, F.A.V.D.; Buist-Homan, M.; Faber, K.N.; Moshage, H. Glutathione and antioxidant enzymes serve complementary roles in protecting activated hepatic stellate cells against hydrogen peroxide-induced cell death. Biochim. Biophys. Acta Mol. Basis Dis. 2013, 1832, 2027–2034. [Google Scholar] [CrossRef]
  60. Franco, R.; Cidlowski, J.A. Glutathione Efflux and Cell Death. Antioxidants Redox Signal. 2012, 17, 1694–1713. [Google Scholar] [CrossRef]
  61. Elmore, S. Apoptosis: A review of programmed cell death. Toxicol. Pathol. 2007, 35, 495–516. [Google Scholar] [CrossRef] [PubMed]
  62. Budihardjo, I.; Oliver, H.; Lutter, M.; Luo, X.; Wang, X. Biochemical Pathways of Caspase Activation During Apoptosis. Annu. Rev. Cell Dev. Biol. 1999, 15, 269–290. [Google Scholar] [CrossRef] [PubMed]
  63. Fan, T.-J.; Han, L.-H.; Cong, R.-S.; Liang, J. Caspase Family Proteases and Apoptosis. Acta Biochim. Biophys. Sin. 2005, 37, 719–727. [Google Scholar] [CrossRef] [PubMed]
  64. Cohen, G.M. Caspases: The executioners of apoptosis. Biochem. J. 1997, 326, 1–16. [Google Scholar] [CrossRef]
  65. Choudhary, G.S.; Al-Harbi, S.; Almasan, A. Caspase-3 activation is a critical determinant of genotoxic stress-induced apoptosis. In Apoptosis and Cancer; Springer: Berlin/Heidelberg, Germany, 2015; pp. 1–9. [Google Scholar]
  66. Brauns, S.C.; Dealtry, G.; Milne, P.; Naudé, R.; Van De Venter, M. Caspase-3 activation and induction of PARP cleavage by cyclic dipeptide cyclo(Phe-Pro) in HT-29 cells. Anticancer Res. 2005, 25, 4197–4202. [Google Scholar]
  67. Soini, Y.; Kahlos, K.; Näpänkangas, U.; Kaarteenaho-Wiik, R.; Säily, M.; Koistinen, P.; Pääakkö, P.; Holmgren, A.; Kinnula, V.L. Widespread expression of thioredoxin and thioredoxin reductase in non-small cell lung carcinoma. Clin. Cancer Res. 2001, 7, 1750–1757. [Google Scholar]
  68. Noike, T.; Miwa, S.; Soeda, J.; Kobayashi, A.; Miyagawa, S.-I. Increased expression of thioredoxin-1, vascular endothelial growth factor, and redox factor-1 is associated with poor prognosis in patients with liver metastasis from colorectal cancer. Hum. Pathol. 2008, 39, 201–208. [Google Scholar] [CrossRef]
  69. Kim, S.J.; Miyoshi, Y.; Taguchi, T.; Tamaki, Y.; Nakamura, H.; Yodoi, J.; Kato, K.; Noguchi, S. High Thioredoxin Expression Is Associated with Resistance to Docetaxel in Primary Breast Cancer. Clin. Cancer Res. 2005, 11, 8425–8430. [Google Scholar] [CrossRef]
  70. Zhang, J.; Li, X.; Han, X.; Liu, R.; Fang, J. Targeting the Thioredoxin System for Cancer Therapy. Trends Pharmacol. Sci. 2017, 38, 794–808. [Google Scholar] [CrossRef]
  71. Yokomizo, A.; Ono, M.; Nanri, H.; Makino, Y.; Ohga, T.; Wada, M.; Okamoto, T.; Yodoi, J.; Kuwano, M.; Kohno, K. Cellular levels of thioredoxin associated with drug sensitivity to cisplatin, mitomycin C, doxorubicin, and etoposide. Cancer Res. 1995, 55, 4293–4296. [Google Scholar]
  72. Javvadi, P.; Hertan, L.; Kosoff, R.; Datta, T.; Kolev, J.; Mick, R.; Tuttle, S.W.; Koumenis, C. Thioredoxin Reductase-1 Mediates Curcumin-Induced Radiosensitization of Squamous Carcinoma Cells. Cancer Res. 2010, 70, 1941–1950. [Google Scholar] [CrossRef]
  73. Liang, Y.-W.; Zheng, J.; Li, X.; Zheng, W.; Chen, T. Selenadiazole derivatives as potent thioredoxin reductase inhibitors that enhance the radiosensitivity of cancer cells. Eur. J. Med. Chem. 2014, 84, 335–342. [Google Scholar] [CrossRef]
Figure 1. Effects of auranofin on cell proliferation in lung cancer cells. Exponentially growing cells were incubated in the presence of the indicated concentrations of auranofin for 24 h. Live and dead cell numbers were evaluated by trypan blue staining cell counting. Graphs illustrate the numbers of live and dead cells in normal HPF cells (A) and cells from the lung cancer cell lines Calu-6 (B), A549 (C), SK-LU-1 (D), NCI-H460 (E), and NCI-H1299 (F). * p < 0.05 compared with auranofin-untreated control cells.
Molecules 27 05207 g001
Figure 2. Effects of auranofin on intracellular DCF (ROS) levels in lung cancer cells. Exponentially growing cells were incubated in the presence of the indicated concentrations of auranofin for 24 h. DCF (ROS) levels in cells were measured using a FACStar flow cytometer. Graphs illustrate DCF (ROS) levels (%) in normal HPF cells (A) and cells from the lung cancer cell lines Calu-6 (B), A549 (C), SK-LU-1 (D), NCI-H460 (E), and NCI-H1299 (F), compared with each group of control cells. * p < 0.05 compared with the auranofin-untreated control group.
Molecules 27 05207 g002
Figure 3. Effects of auranofin on intracellular DHE (O2•−) levels in lung cancer cells. Exponentially growing cells were incubated in the presence of the indicated concentrations of auranofin for 24 h. DHE (O2•−) levels in cells were measured using a FACStar flow cytometer. Graphs illustrate DHE (O2•−) levels (%) in normal HPF cells (A) and cells from the lung cancer cell lines Calu-6 (B), A549 (C), SK-LU-1 (D), NCI-H460 (E), and NCI-H1299 (F), compared with each group of control cells. * p < 0.05 compared with the auranofin-untreated control group.
Molecules 27 05207 g003
Figure 4. Effects of auranofin on intracellular GSH depletion in lung cancer cells. Exponentially growing cells were incubated in the presence of the indicated concentrations of auranofin for 24 h. Intracellular GSH levels in cells were evaluated using a FACStar flow cytometer. Graphs designate the percentages of negative CMF (GSH-depleted) cells in normal HPF cells (A) and cells from the lung cancer cell lines Calu-6 (B), A549 (C), SK-LU-1 (D), NCI-H460 (E), and NCI-H1299 (F). * p < 0.05 compared with the auranofin-untreated control group.
Molecules 27 05207 g004
Figure 5. Effects of NAC and BSO on cell death, MMP (∆Ψm), DHE (O2•−) levels, and GSH depletion in auranofin-treated Calu-6 and A549 cells. Exponentially growing Calu-6 and A549 cells were incubated with 3 and 5 µM auranofin for 24 h, respectively, following 1 h preincubation with 2 mM NAC or 10 μM BSO. A, B, E and F: Graphs illustrate the percentages of annexin V-FITC-stained cells in Calu-6 cells (A) and A549 cells (E) and rhodamine 123-negative MMP (∆Ψm) cells in Calu-6 cells (B) and A549 cells (F), respectively. (C,G): Graphs indicate DHE (O2•−) levels (%) compared with control cells in Calu-6 cells (C) and A549 cells (G), respectively. (D,H): Graphs designate the percentages of negative CMF (GSH-depleted) cells in Calu-6 cells (D) and A549 cells (H). * p < 0.05 compared with auranofin-untreated control cells. # p < 0.05 compared with cells treated with auranofin only.
Molecules 27 05207 g005
Figure 6. Effects of NAC and BSO on apoptosis-related protein levels in auranofin-treated Calu-6 cells. Exponentially growing Calu-6 cells were incubated in the presence of 3 µM auranofin for 24 h following 1 h preincubation with 2 mM NAC or 10 μM BSO. Whole-cell extracts were prepared, and equal amounts of lysates were then resolved through SDS-PAGE, transferred onto PVDF membranes, and immunoblotted with the indicated antibodies against PARP, cleaved PARP, procaspase-3, cleaved caspase-3, and GAPDH (A and B). GAPDH detection was used to confirm equal protein loading. Graphs show ratio of cleaved PARP/PARP and cleaved caspase-3/caspase-3 in auranofin-treated cells, and band intensities were quantified using the Image J program (A,B). * p < 0.05 compared with auranofin-untreated control cells. # p < 0.05 compared with cells treated with auranofin only.
Molecules 27 05207 g006
Figure 7. Effects of NAC and BSO on apoptosis-related protein levels in auranofin-treated A549 cells. Exponentially growing A549 cells were incubated in 5 µM auranofin for 24 h following 1 h preincubation with 2 mM NAC or 10 μM BSO. Whole-cell extracts were prepared, and equal amounts of lysates were then resolved through SDS-PAGE, transferred onto PVDF membranes, and immunoblotted with the indicated antibodies against PARP, cleaved PARP, procaspase-3, cleaved caspase-3, and GAPDH (A,B). GAPDH detection was used to confirm equal protein loading. Graphs show ratio of cleaved PARP/PARP and cleaved caspase-3/caspase-3 in auranofin-treated A549 cells, and band intensities were quantified using the Image J program (A,B). * p < 0.05 compared with auranofin-untreated control cells. # p < 0.05 compared with cells treated with auranofin only.
Molecules 27 05207 g007
Figure 8. Effects of NAC and BSO on TrxR activity in auranofin-treated Calu-6 and A549 cells. Exponentially growing Calu-6 cells or A549 cells were incubated in the presence of the indicated concentrations of auranofin for 24 h following 1 h pre-incubation with 2 mM NAC or 10 μM BSO. TrxR activity was measured using the insulin reduction assay. (AD): The graphs indicate the inhibition of TrxR activity by auranofin or combination treatment with NAC or BSO in Calu-6 cells (A,B) and A549 cells (C,D). E and F: Whole-cell extracts were prepared, and equal amounts of lysates were then resolved through SDS-PAGE, transferred onto PVDF membranes, and immunoblotted with TrxR-1 antibody. GAPDH detection was used to confirm equal protein loading. Graphs show ratio of TrxR-1/GAPDH by auranofin or combination treatment with NAC or BSO in Calu-6 cells (E) and A549 cells (F), and band intensities were quantified using the Image J program. * p < 0.05 compared with auranofin-untreated control cells. # p < 0.05 compared with cells treated with auranofin only.
Molecules 27 05207 g008
Publisher’s Note: MDPI stays neutral with regard to jurisdictional claims in published maps and institutional affiliations.

