
Comprehensive Evaluation of the Quality of Tripterygium Glycosides Tablets Based on Multi-Component Quantification Combined with an In Vitro Biological Assay


Abstract
:1. Introduction
2. Results
2.1. Optimization of Extraction Conditions
2.2. Optimization of Chromatographic and Mass Spectrometric Conditions
2.3. Method Validation
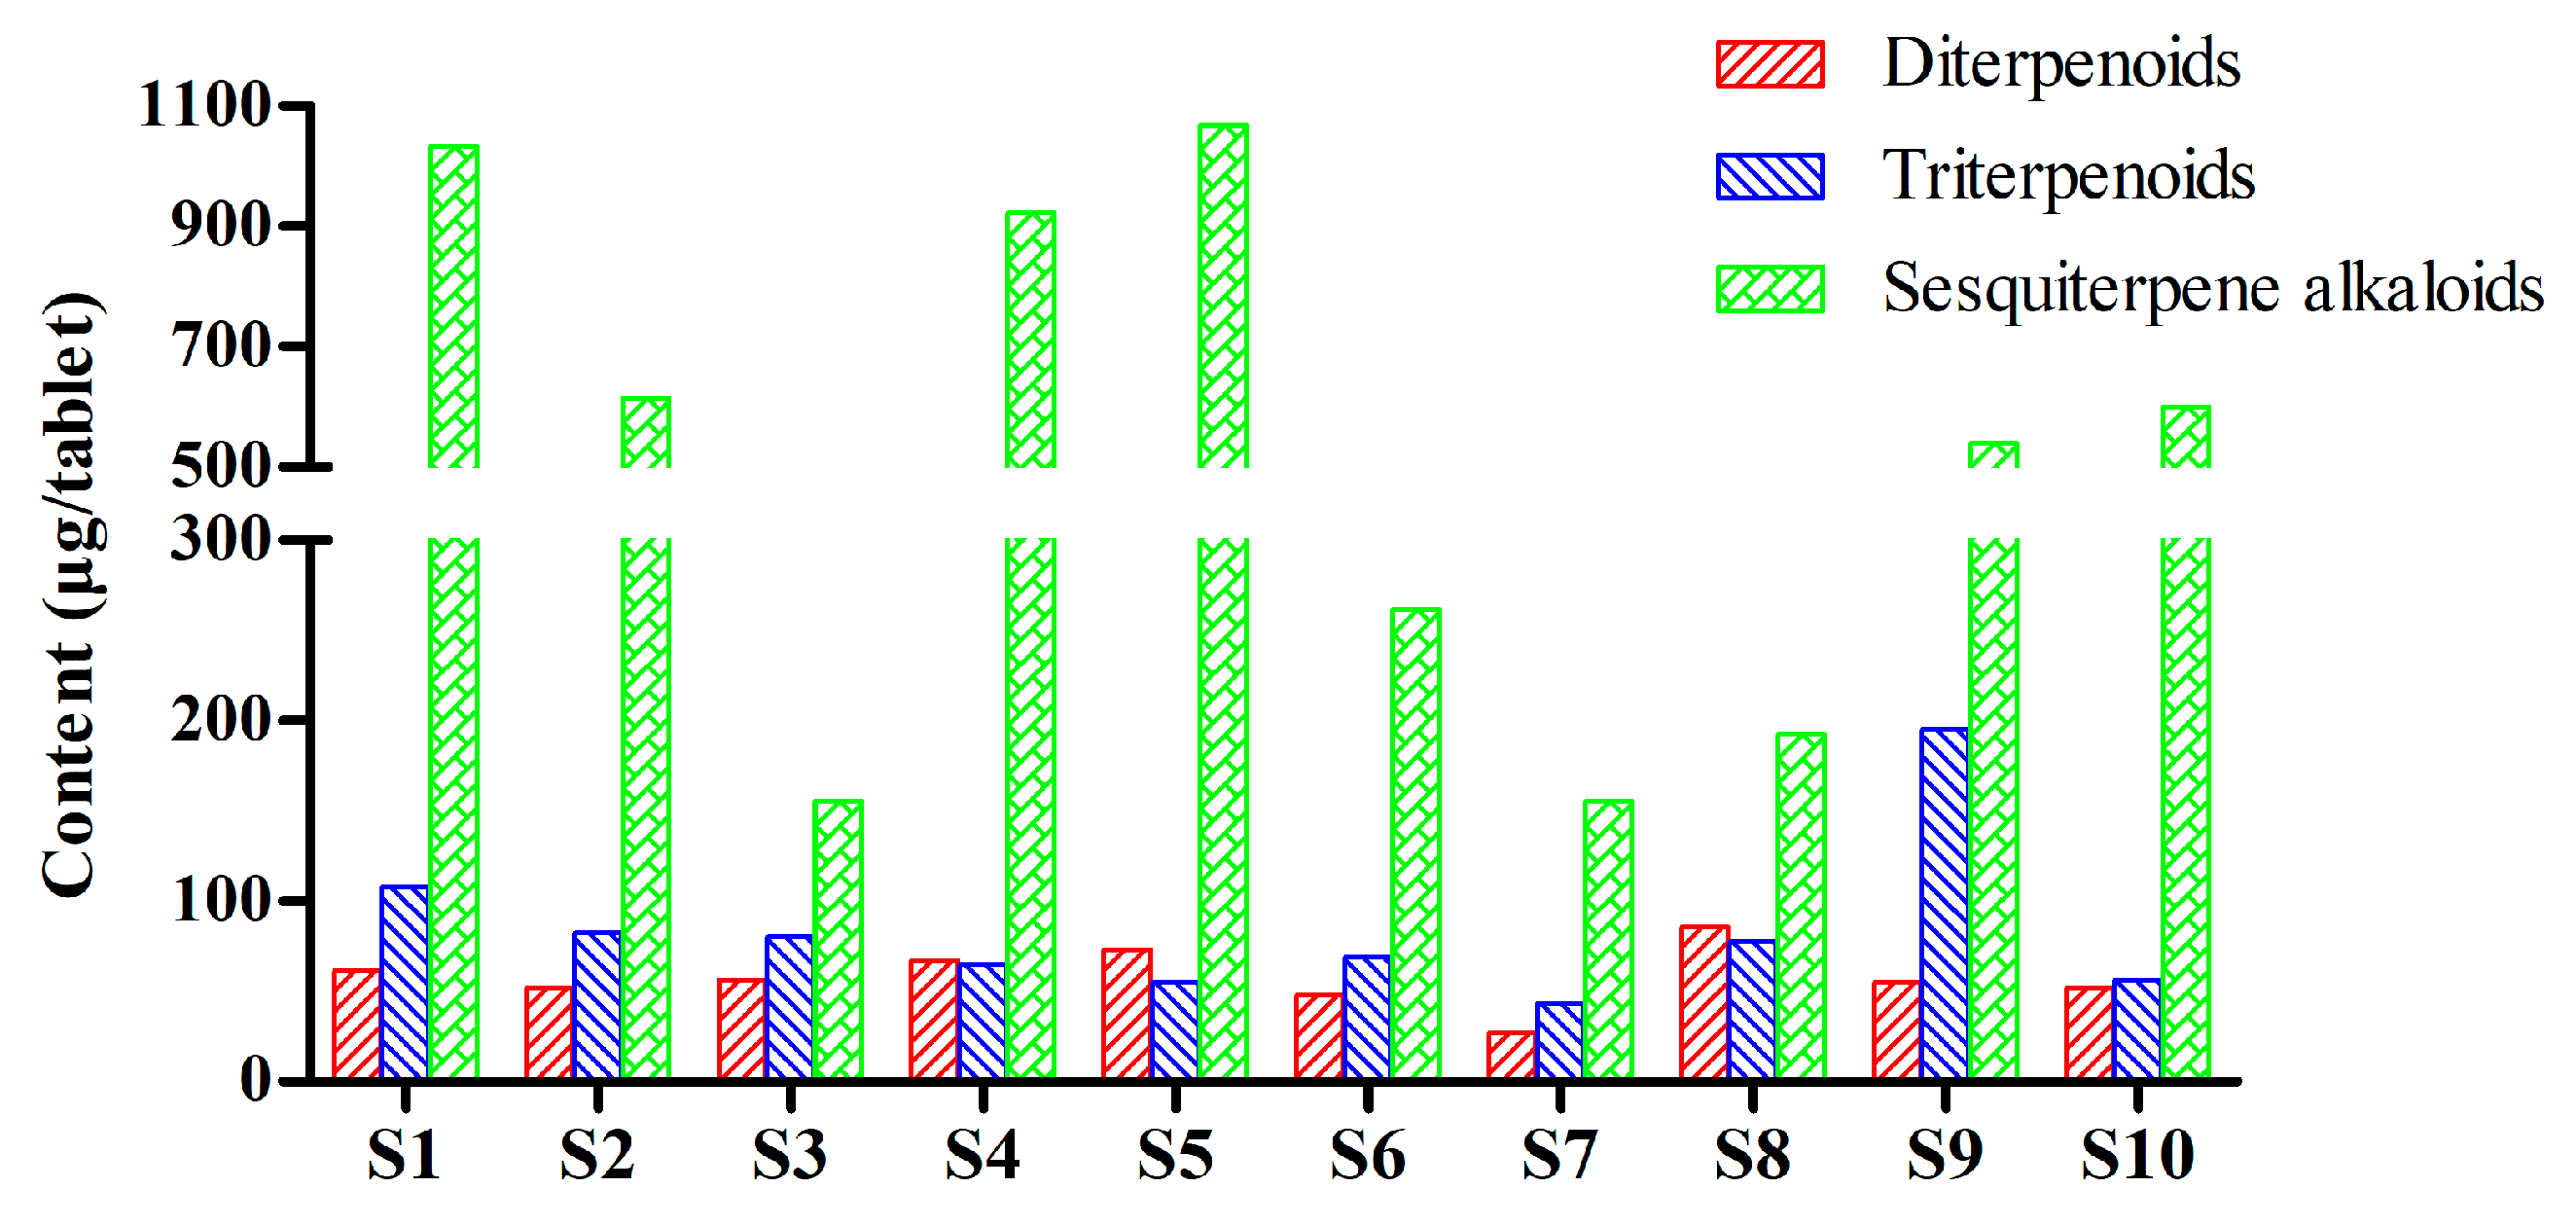
2.4. Quantitative Analysis of TGTs from Different Manufacturers
2.5. Anti-Inflammatory Activities and Cytotoxicities of TGTs
2.6. Anti-Inflammatory Activities and Cytotoxicites of the Investigated Compounds
3. Discussion
4. Materials and Methods
4.1. Chemicals and Reagents
4.2. Preparation of Standard Solutions
4.3. Preparation of Sample Solutions
4.4. RRLC–ESI–MS/MS Conditions
4.5. Method Validation
4.5.1. Linearity, LOQs, and LODs
4.5.2. Precision, Repeatability, and Stability
4.5.3. Recovery
4.6. Cell Culture
4.7. Anti-Inflammation Assay
4.8. Cytotoxicity Assay
Supplementary Materials
Author Contributions
Funding
Institutional Review Board Statement
Informed Consent Statement
Data Availability Statement
Acknowledgments
Conflicts of Interest
Sample Availability
References
- Zhang, Y.; Mao, X.; Li, W.; Chen, W.; Wang, X.; Ma, Z.; Lin, N. Tripterygium wilfordii: An inspiring resource for rheumatoid arthritis treatment. Med. Res. Rev. 2021, 41, 1337–1374. [Google Scholar] [CrossRef] [PubMed]
- Luo, D.; Zuo, Z.; Zhao, H.; Tan, Y.; Xiao, C. Immunoregulatory effects of Tripterygium wilfordii Hook F and its extracts in clinical practice. Front. Med. 2019, 13, 556–563. [Google Scholar] [CrossRef] [PubMed]
- Song, C.Y.; Xu, Y.G.; Lu, Y.Q. Use of Tripterygium wilfordii Hook F for immune-mediated inflammatory diseases: Progress and future prospects. J. Zhejiang Univ. Sci. B 2020, 21, 280–290. [Google Scholar] [CrossRef]
- Tao, X.; Lipsky, P.E. The Chinese anti-inflammatory and immunosuppressive herbal remedy Tripterygium wilfordii Hook F. Rheum. Dis. Clin. N. Am. 2000, 26, 29–50. [Google Scholar] [CrossRef]
- Yu, Y.; Liu, W.; Zhan, X.; Zhong, Y.; Feng, Y.; Cao, Q.; Tan, B. Synergistic effect of Tripterygium glycosides and cisplatin on drug-resistant human epithelial ovarian cancer via ILK/GSK3β/Slug signal pathway. Am. J. Transl. Res. 2022, 14, 2051–2062. [Google Scholar]
- Lv, H.; Jiang, L.; Zhu, M.; Li, Y.; Luo, M.; Jiang, P.; Tong, S.; Zhang, H.; Yan, J. The genus Tripterygium: A phytochemistry and pharmacological review. Fitoterapia 2019, 137, 104190. [Google Scholar] [CrossRef] [PubMed]
- Tian, Y.G.; Su, X.H.; Liu, L.L.; Kong, X.Y.; Lin, N. Overview of hepatotoxicity studies on Tripterygium wilfordii in recent 20 years. Zhongguo Zhongyao Zazhi 2019, 44, 3399–3405. [Google Scholar] [CrossRef] [PubMed]
- Li, X.X.; Du, F.Y.; Liu, H.X.; Ji, J.B.; Xing, J. Investigation of the active components in Tripterygium wilfordii leading to its acute hepatotoxicty and nephrotoxicity. J. Ethnopharmacol. 2015, 162, 238–243. [Google Scholar] [CrossRef]
- Ding, Q.; Wu, Y.; Liu, W. Molecular mechanism of reproductive toxicity induced by Tripterygium Wilfordii based on network pharmacology. Medicine 2021, 100, e26197. [Google Scholar] [CrossRef]
- Lin, N.; Zhang, Y.Q.; Jiang, Q.; Liu, W.; Liu, J.; Huang, Q.C.; Wu, K.Y.; Tu, S.H.; Zhou, Z.S.; Chen, W.H.; et al. Clinical practice guideline for Tripterygium glycosides/Tripterygium wilfordii tablets in the treatment of rheumatoid arthritis. Front. Pharmacol. 2021, 11, 608703. [Google Scholar] [CrossRef]
- Du, X.; Nyagblordzro, M.; An, L.; Gao, X.; Du, L.; Wang, Y.; Ondieki, G.; Kikete, S.; He, X. Pharmacokinetic and toxicological characteristics of Tripterigium glycosides and their derivatives. Curr. Drug Metab. 2018, 19, 605–627. [Google Scholar] [CrossRef] [PubMed]
- Luo, H.; Wu, X.; Huang, H.; Chen, S.; Yang, W.; Zhang, L.; Cui, H.; Yang, J.; Yang, A. Simultaneous determination of triptolide, tripterifordin, celastrol and nine sesquiterpene alkaloids in Tripterygium preparations using high-performance liquid chromatography–triple quadrupole mass spectrometry. J. Pharm. Biomed. Anal. 2016, 117, 195–204. [Google Scholar] [CrossRef]
- Su, M.X.; Zhou, W.D.; Lan, J.; Di, B.; Huang, T. Rapid and sensitive analysis of multiple bioactive constituents in tripterygium glycosides tablets using liquid chromatography coupled with time-of-flight mass spectrometry. J. Sep. Sci. 2015, 38, 804–812. [Google Scholar] [CrossRef] [PubMed]
- Fu, Q.; Li, Z.; Sun, C.; Xin, H.; Ke, Y.; Jin, Y.; Liang, X. Rapid and simultaneous analysis of sesquiterpene pyridine alkaloids from Tripterygium wilfordii Hook. f. Using supercritical fluid chromatography-diode array detector-tandem mass spectrometry. J. Supercritical. Fluids 2015, 104, 85–93. [Google Scholar] [CrossRef]
- Qiu, D.; Kao, P.N. Immunosuppressive and anti-inflammatory mechanisms of triptolide, the principal active diterpenoid from the Chinese medicinal herb Tripterygium wilfordii Hook. f. Drug R D. 2003, 4, 1–18. [Google Scholar] [CrossRef]
- Xi, C.; Peng, S.; Wu, Z.; Zhou, Q.; Zhou, J. Toxicity of triptolide and the molecular mechanisms involved. Biomed. Pharmacother. 2017, 90, 531–541. [Google Scholar] [CrossRef]
- Duan, H.; Takaishi, Y.; Momota, H.; Ohmoto, Y.; Taki, T.; Jia, Y.; Li, D. Immunosuppressive diterpenoids from Tripterygium wilfordii. J. Nat. Prod. 1999, 62, 1522–1525. [Google Scholar] [CrossRef]
- Takaish, Y.; Shishido, K.; Wariish, N.; Shibuya, M.; Goto, K.; Kido, M.; Taka, M.; Ono, Y. Triptoquinine A and B, novel interleukin-1 inhibitors from Tripterygium wilfordii var regeli. Tetrahedron. Lett. 1992, 33, 7177–7180. [Google Scholar] [CrossRef]
- Ziaei, S.; Halaby, R. Immunosuppressive, anti-inflammatory and anti-cancer properties of triptolide: A mini review. Avicenna J. Phytomed. 2016, 6, 149–164. [Google Scholar] [CrossRef]
- Zhang, Z.; Yeung, S.; Chen, S.; Moatazedi, Y.; Chow, M.S.S. Bioavailability of wilforlide A in mice and its concentration determination using an HPLC-APCI-MS/MS method. J. Chromatogr. B 2018, 1090, 65–72. [Google Scholar] [CrossRef]
- Brinker, A.M.; Ma, J.; Lipsky, P.E.; Raskin, I. Medicinal chemistry and pharmacology of genus Tripterygium (Celastraceae). Phytochemistry 2007, 68, 732–766. [Google Scholar] [CrossRef] [PubMed] [Green Version]


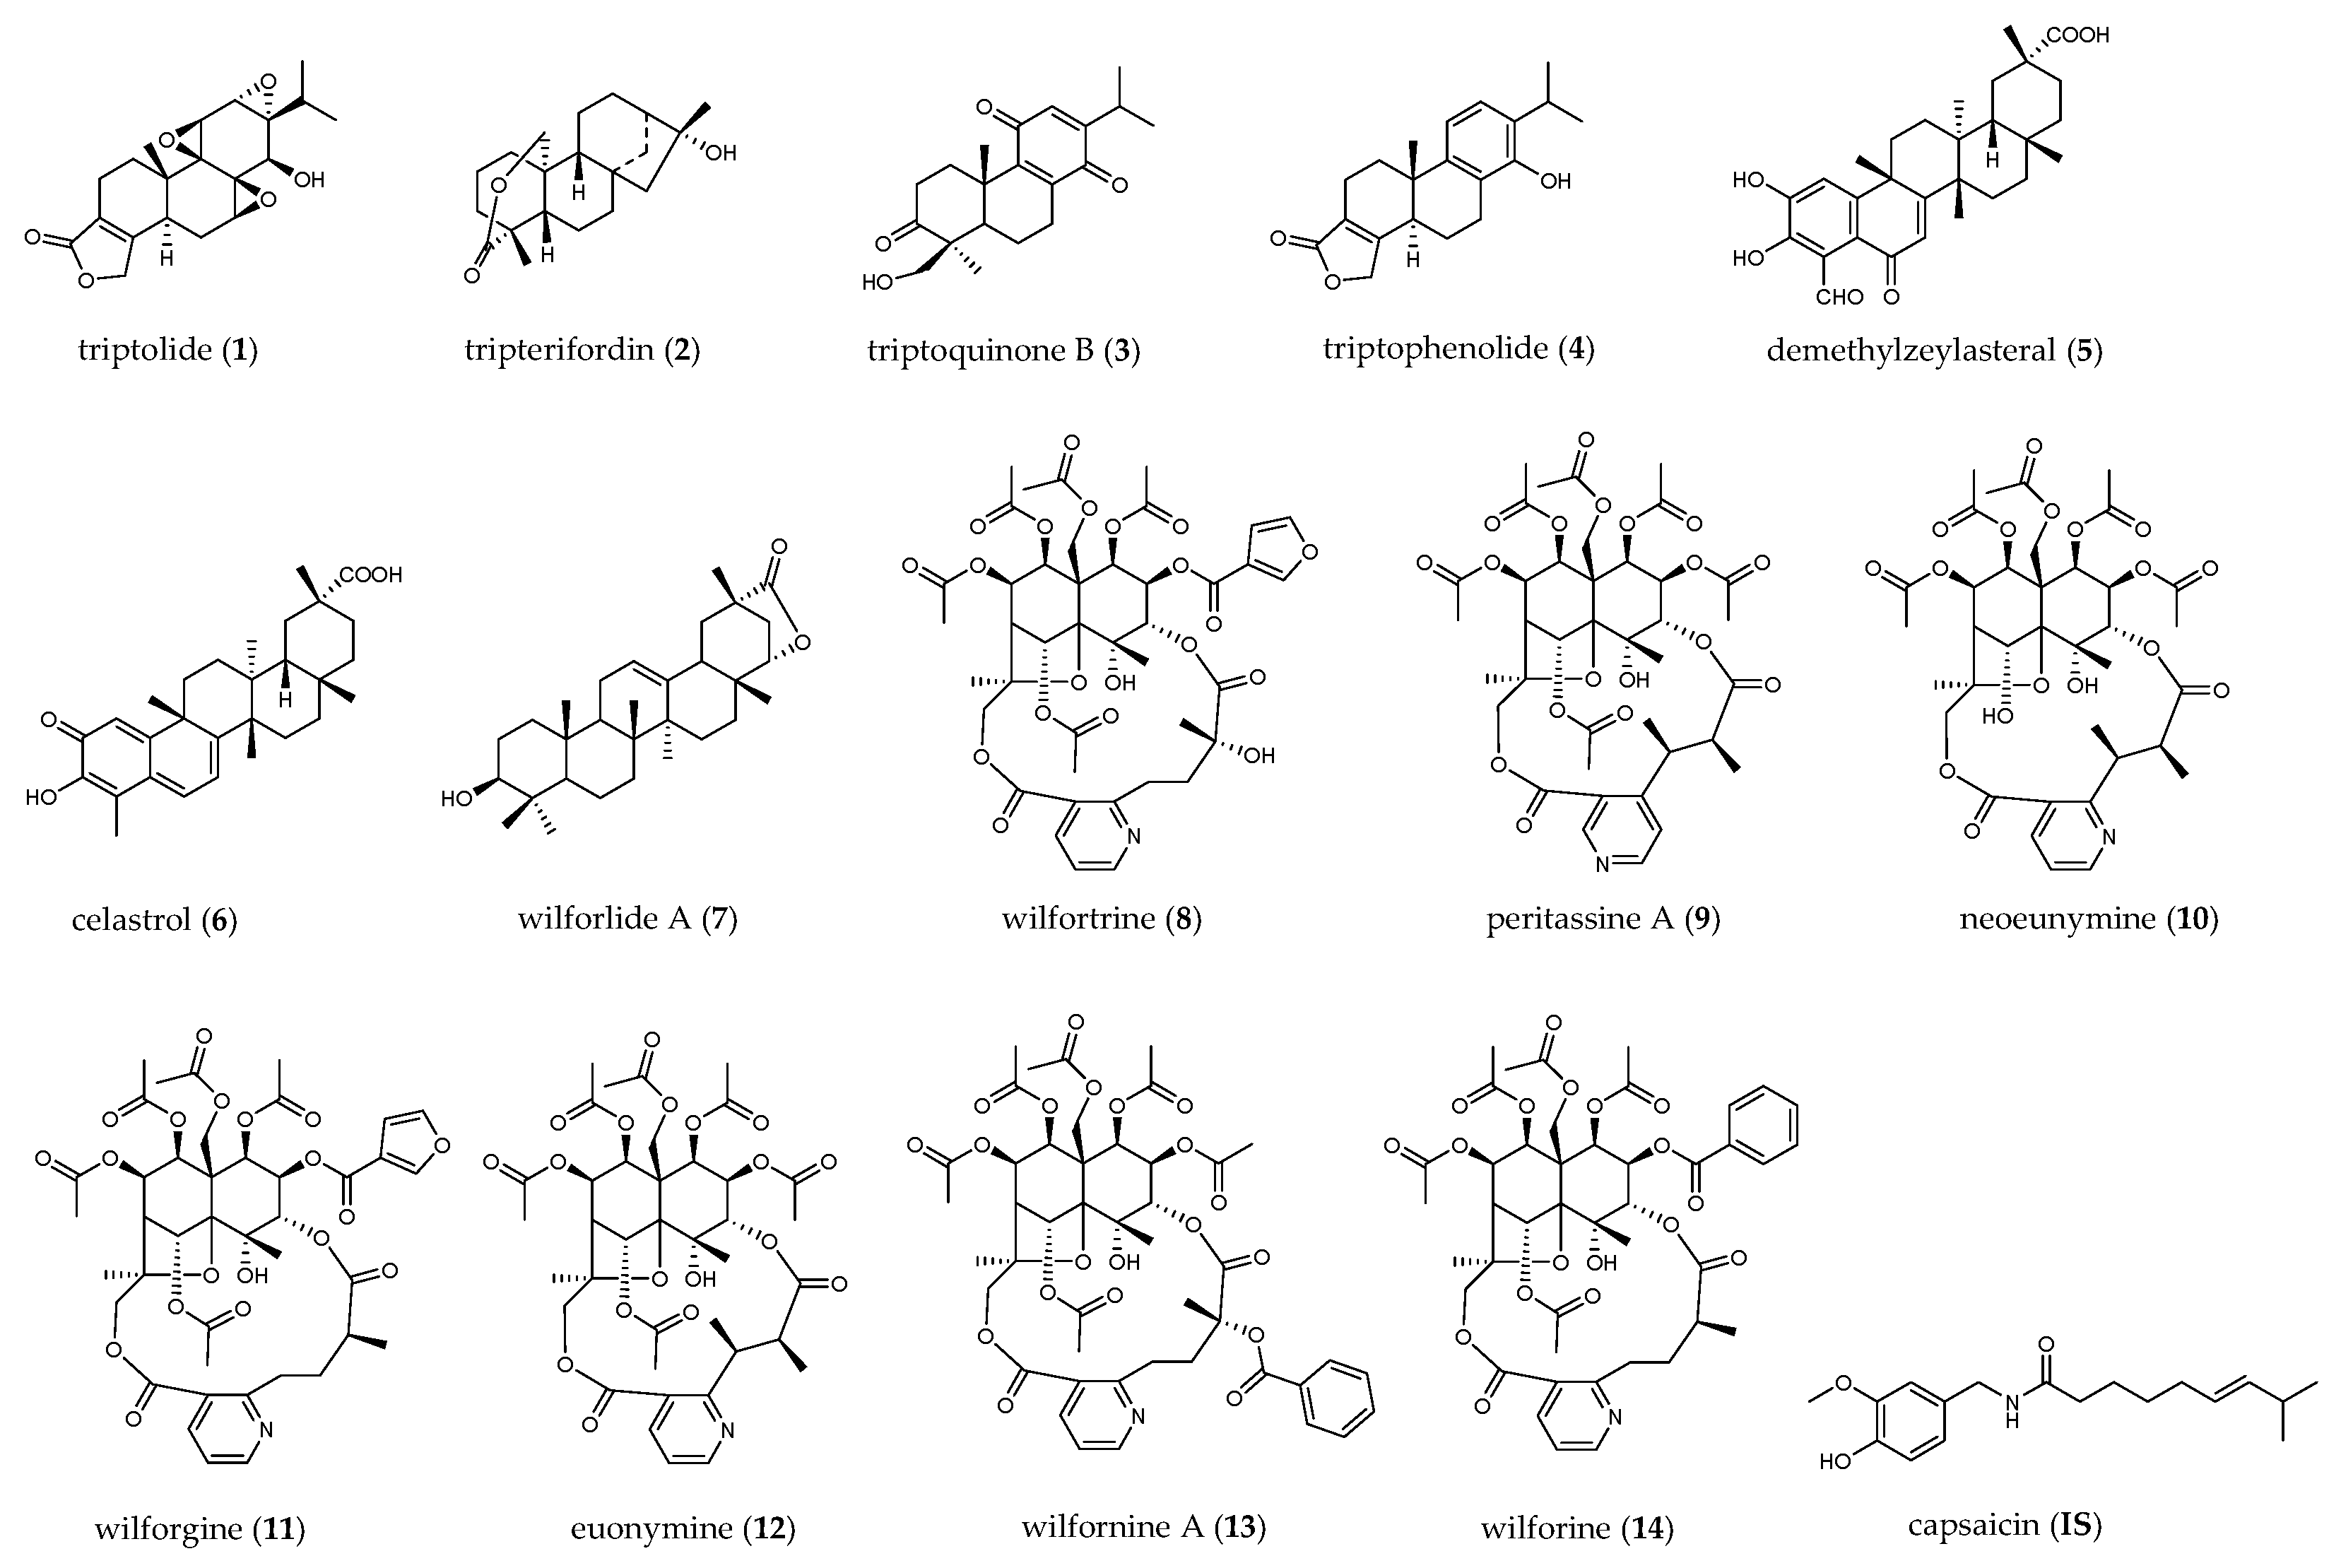
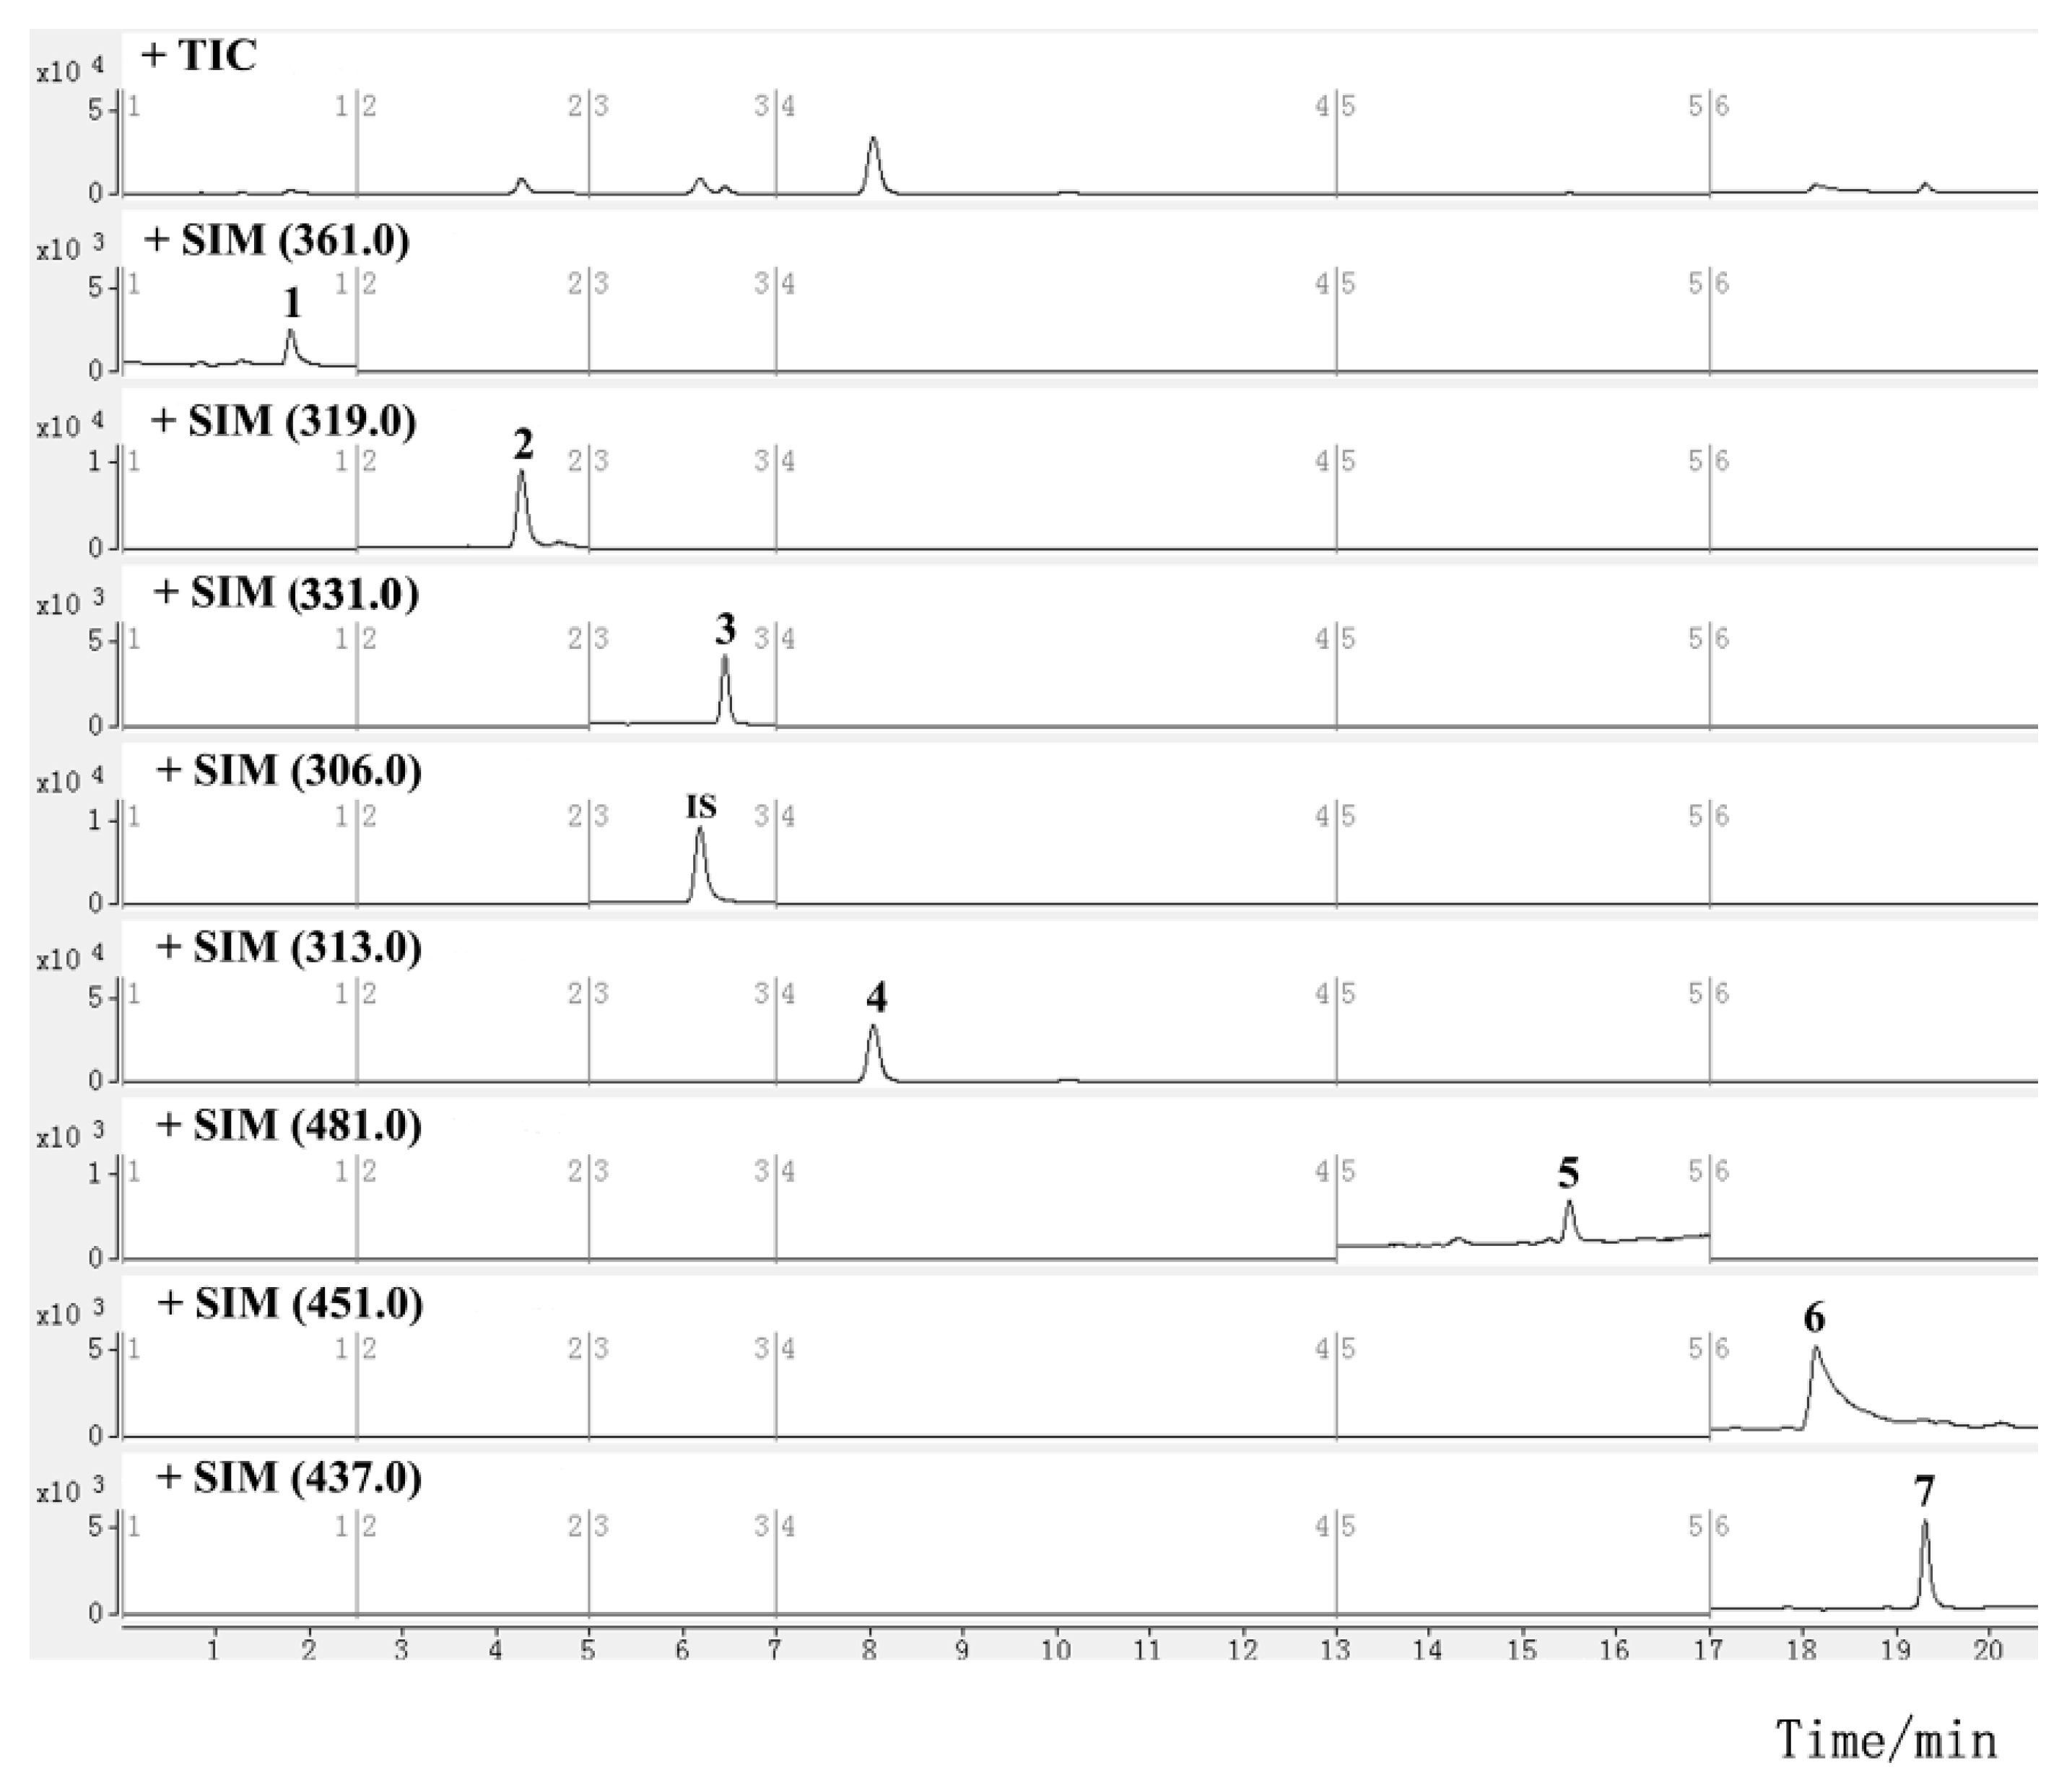
| Analytes | Retention Time (min) | Selected Ion (m/z) | Fragment Voltage (V) |
|---|---|---|---|
| triptolide (1) | 1.80 | 361.0 [M + H]+ | 150 |
| tripterifordin (2) | 4.27 | 319.0 [M + H]+ | 50 |
| triptoquinone B (3) | 6.45 | 331.0 [M + H]+ | 200 |
| triptophenolide (4) | 8.04 | 313.0 [M + H]+ | 125 |
| demethylzeylasteral (5) | 15.50 | 481.0 [M + H]+ | 150 |
| celastrol (6) | 18.14 | 451.0 [M + H]+ | 125 |
| wilforlide A (7) | 19.31 | 437.0 [M − H2O + H]+ | 175 |
| capsaicin (IS) | 6.18 | 306.0 [M + H]+ | 75 |
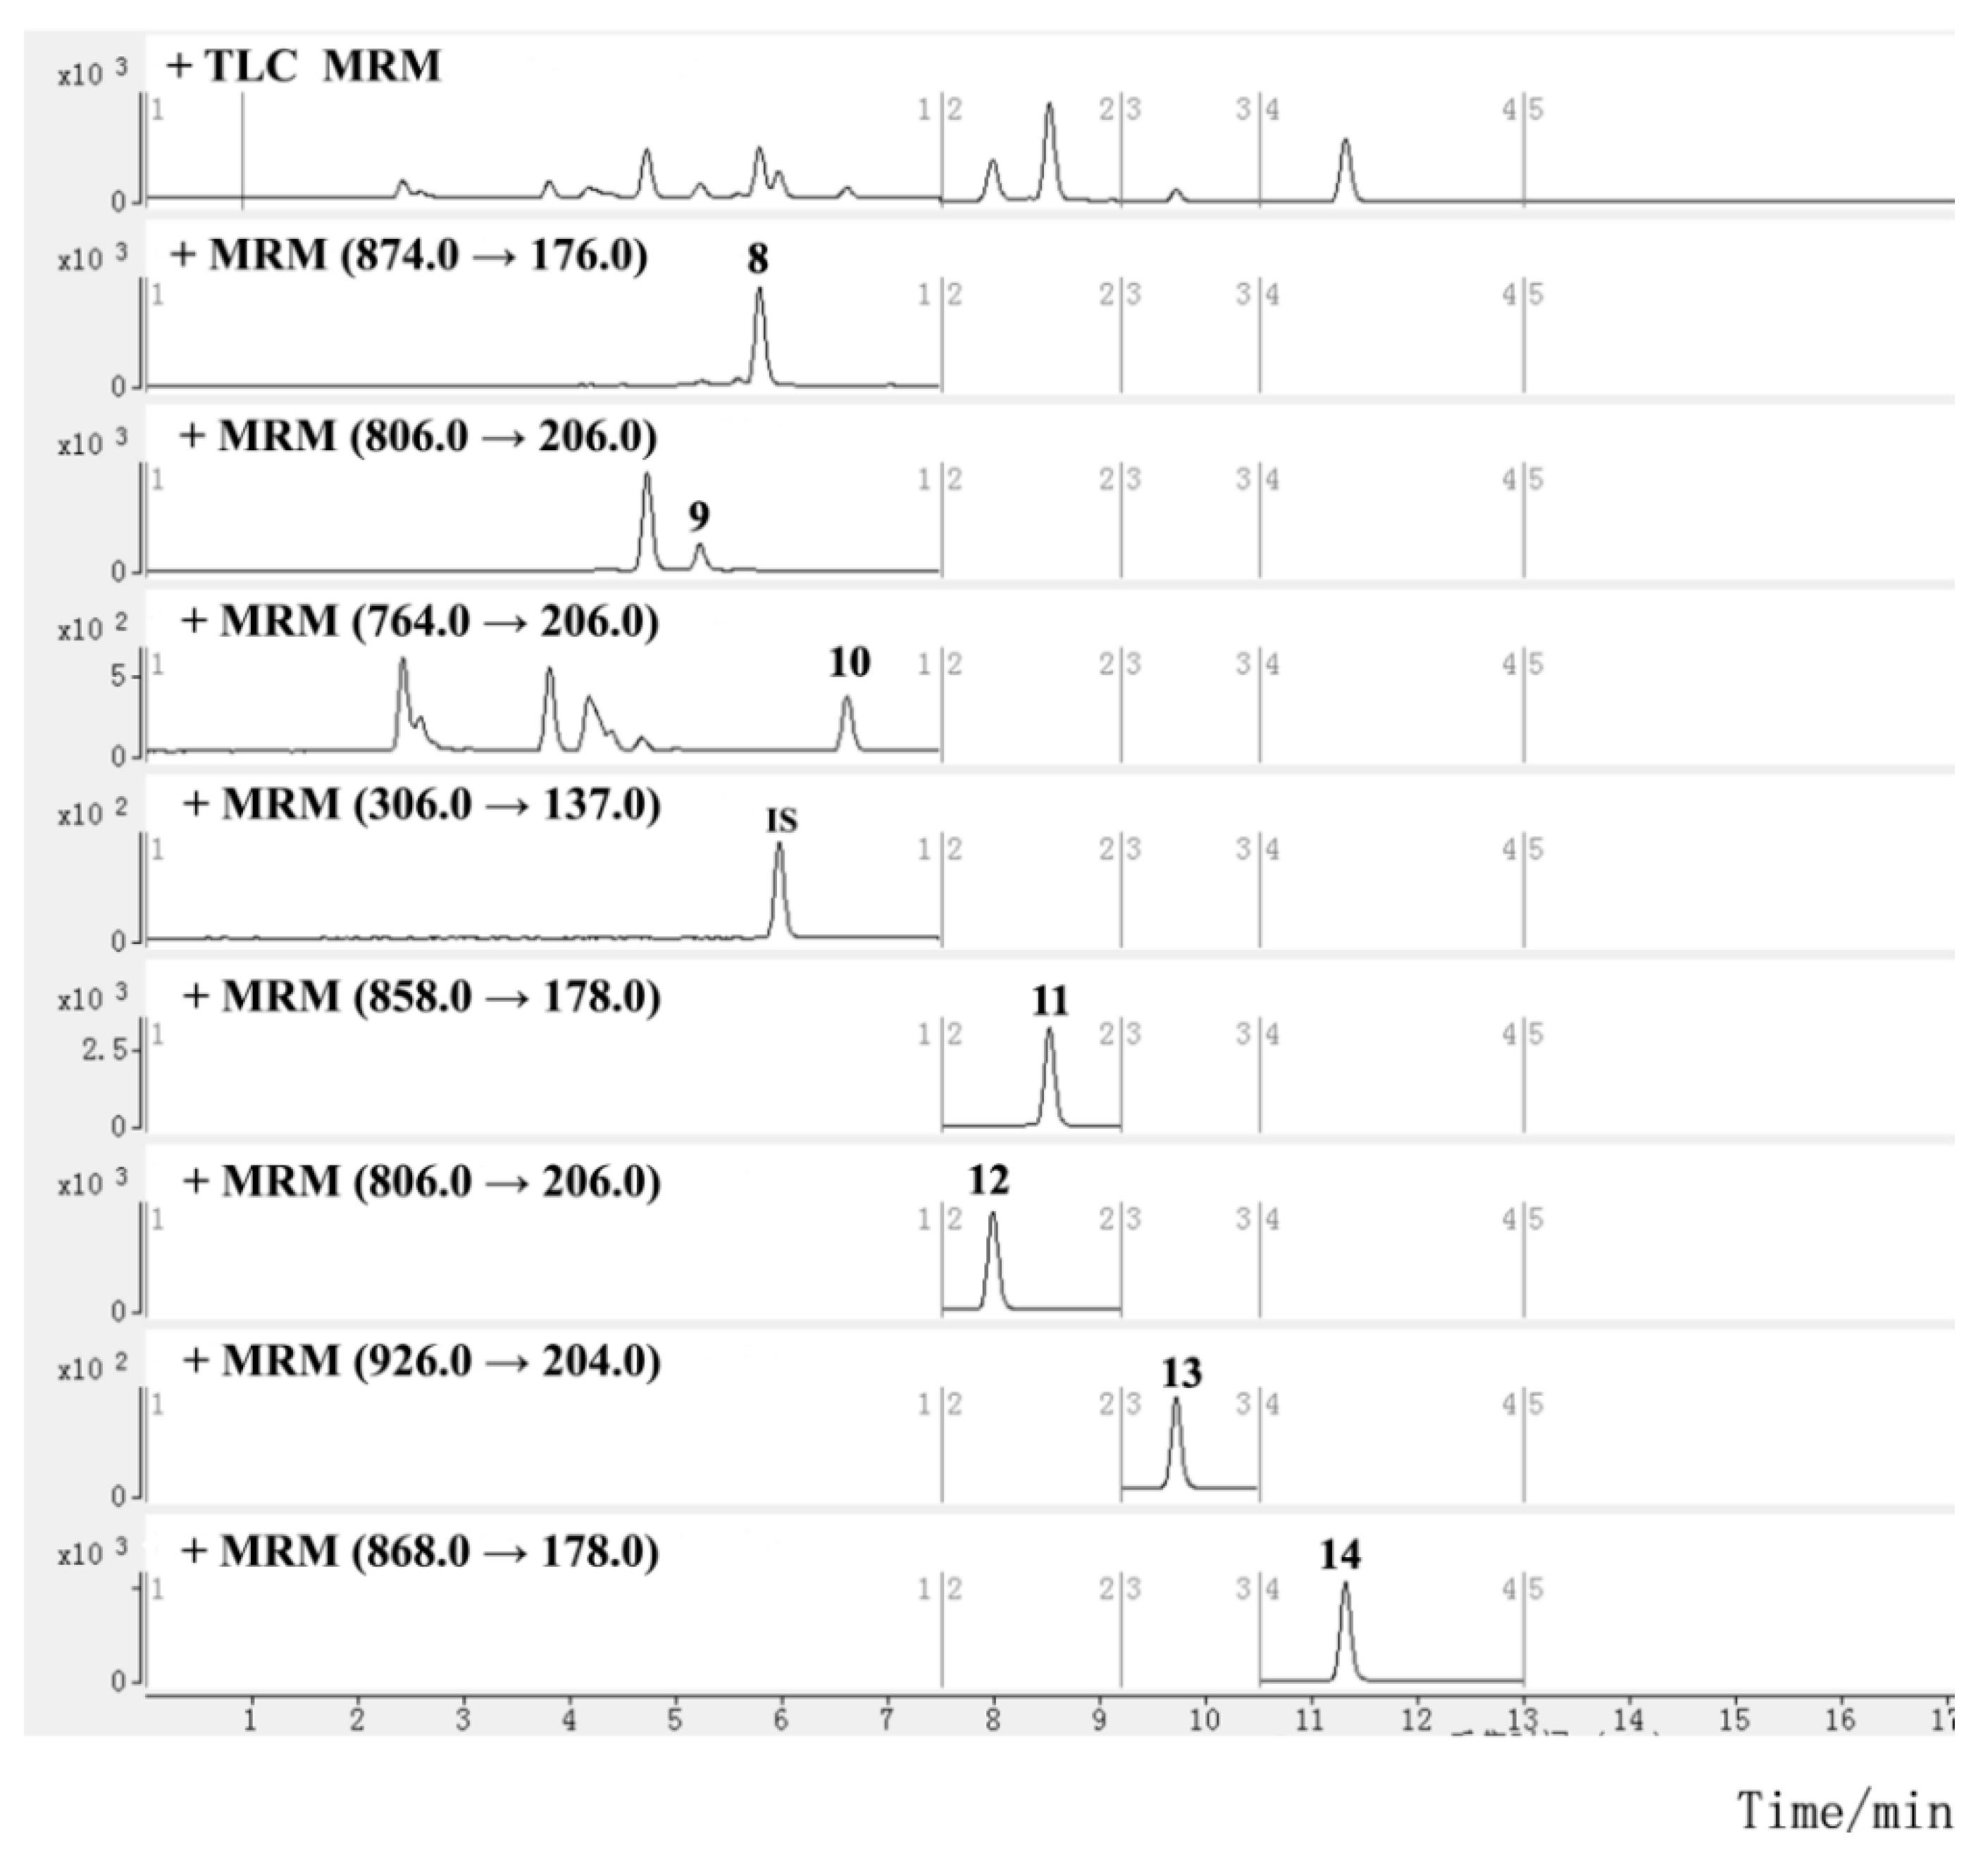
| Analytes | Retention Time (min) | Precursor Ion (m/z) | Product Ion (m/z) | Fragment Voltage (V) | Collision Energy (eV) |
|---|---|---|---|---|---|
| wilfortrine (8) | 5.79 | 874.0 [M + H]+ | 176.0 | 175 | 40 |
| peritassine A (9) | 5.66 | 806.0 [M + H]+ | 206.0 | 175 | 40 |
| neoeunymine (10) | 6.62 | 764.0 [M + H]+ | 206.0 | 175 | 40 |
| wilforgine (11) | 8.53 | 858.0 [M + H]+ | 178.0 | 175 | 60 |
| euonymine (12) | 7.69 | 806.0 [M + H]+ | 206.0 | 175 | 40 |
| wilfornine A (13) | 9.72 | 926.0 [M + H]+ | 204.0 | 175 | 50 |
| Wilforine (14) | 11.32 | 868.0 [M + H]+ | 178.0 | 175 | 70 |
| capsaicin (IS) | 5.97 | 306.0 [M + H]+ | 137.0 | 75 | 30 |
| Analytes | Calibration Curves | R2 | Linear Range (µg/mL) | LOQ (ng/mL) | LOD (ng/mL) | Precision (RSD, %) | Repeatability (RSD, %, n = 6) | Stability (RSD, %, n = 6) | |
|---|---|---|---|---|---|---|---|---|---|
| Intra-Day (n = 6) | Inter-Day (n = 3) | ||||||||
| triptolide | Y = 0.7269 X − 0.0054 | 1.0000 | 0.00090–3.59 | 0.9 | 0.3 | 0.73 | 1.78 | 2.07 | 2.14 |
| tripterifordin | Y = 0.0837 X + 0.0019 | 0.9997 | 0.00050–1.00 | 0.5 | 0.2 | 1.09 | 2.03 | 2.43 | 2.65 |
| triptoquinone B | Y = 0.0453 X − 0.0111 | 0.9990 | 0.0075–15.00 | 7.5 | 2.5 | 2.78 | 3.65 | 3.93 | 3.07 |
| triptophenolide | Y = 6.1908 X − 0.0469 | 0.9991 | 0.0016–1.55 | 1.6 | 0.5 | 1.54 | 3.12 | 2.71 | 2.98 |
| demethylzeylasteral | Y = 0.2556 X + 0.0031 | 0.9995 | 0.0020–8.18 | 2.0 | 0.6 | 1.85 | 1.74 | 3.64 | 1.87 |
| celastrol | Y = 1.9742 X + 0.0063 | 0.9999 | 0.00022–4.39 | 0.2 | 0.06 | 0.99 | 2.05 | 0.52 | 1.55 |
| wilforlide A | Y = 0.0517 X − 0.0003 | 0.9995 | 0.0059–2.35 | 5.9 | 2.0 | 2.25 | 2.66 | 1.66 | 3.45 |
| wilfortrine | Y = 4.4918 X + 0.0110 | 0.9998 | 0.00086–1.72 | 0.9 | 0.3 | 0.34 | 1.54 | 1.71 | 1.23 |
| peritassine A | Y = 1.6421 X − 0.0001 | 0.9997 | 0.0013–1.62 | 1.3 | 0.5 | 1.06 | 1.23 | 1.79 | 1.55 |
| neoeunymine | Y = 21.280 X − 0.0010 | 0.9997 | 0.00023–0.14 | 0.2 | 0.08 | 1.14 | 2.23 | 1.66 | 2.47 |
| wilforgine | Y = 7.0238 X − 0.0839 | 0.9993 | 0.0011–1.08 | 1.1 | 0.4 | 0.35 | 0.89 | 1.39 | 1.90 |
| euonymine | Y = 13.977 X + 0.0001 | 0.9998 | 0.00063–0.76 | 0.6 | 0.2 | 0.86 | 1.12 | 1.51 | 2.55 |
| wilfornine A | Y = 2.6602 X − 0.0007 | 0.9997 | 0.0019–1.12 | 1.9 | 0.6 | 0.82 | 2.32 | 1.72 | 1.03 |
| wilforine | Y = 4.7038 X + 0.0527 | 0.9995 | 0.0010–1.02 | 1.0 | 0.3 | 0.85 | 1.67 | 1.01 | 1.24 |
| Analytes | Original (μg) | Spiked (μg) | Detected (μg) | Mean Recovery (%) (RSD, %, n = 3) |
|---|---|---|---|---|
| triptolide | 32.78 | 23.08 | 55.92 | 100.26 (2.01) |
| 38.48 | 70.79 | 98.78 (1.30) | ||
| 53.86 | 88.39 | 103.24 (1.92) | ||
| tripterifordin | 58.78 | 37.88 | 97.09 | 101.14 (1.11) |
| 63.13 | 120.86 | 98.34 (1.94) | ||
| 88.38 | 148.10 | 101.06 (2.55) | ||
| triptoquinone B | 118.04 | 90.00 | 207.09 | 98.94 (2.48) |
| 150.00 | 268.25 | 100.14 (2.26) | ||
| 210.00 | 324.40 | 98.27 (2.03) | ||
| triptophenolide | 50.08 | 27.92 | 78.50 | 101.80 (3.39) |
| 46.53 | 96.31 | 99.36 (1.59) | ||
| 65.14 | 114.62 | 99.08 (2.28) | ||
| demethylzeylasteral | 31.50 | 27.59 | 59.72 | 102.26 (3.83) |
| 45.99 | 77.17 | 99.30 (3.20) | ||
| 64.39 | 98.21 | 103.60 (1.55) | ||
| celastrol | 154.16 | 86.47 | 242.99 | 102.73 (2.71) |
| 144.11 | 298.70 | 100.30 (4.23) | ||
| 201.75 | 361.67 | 102.85 (1.88) | ||
| wilforlide A | 299.45 | 144.67 | 373.47 | 99.56 (2.86) |
| 241.11 | 472.41 | 100.77 (2.84) | ||
| 337.55 | 570.56 | 101.05 (3.45) | ||
| wilfortrine | 596.35 | 388.08 | 983.21 | 99.69 (2.45) |
| 646.80 | 1250.69 | 101.17 (2.81) | ||
| 905.52 | 1525.84 | 102.65 (1.40) | ||
| peritassine A | 381.92 | 243.45 | 623.69 | 99.31 (1.69) |
| 405.75 | 802.83 | 103.74 (1.47) | ||
| 568.05 | 960.18 | 101.80 (1.65) | ||
| neoeunymine | 26.90 | 20.41 | 46.91 | 98.04 (2.50) |
| 34.02 | 60.53 | 98.87 (2.62) | ||
| 47.63 | 74.62 | 100.20 (2.60) | ||
| wilforgine | 792.10 | 487.80 | 1270.60 | 98.09 (0.96) |
| 813.00 | 1600.98 | 99.49 (0.62) | ||
| 1138.20 | 1911.79 | 98.37 (0.86) | ||
| euonymine | 175.92 | 113.85 | 290.24 | 100.41 (1.53) |
| 189.75 | 364.51 | 99.39 (0.73) | ||
| 265.65 | 443.02 | 100.55 (1.81) | ||
| wilfornine A | 272.20 | 168.53 | 438.62 | 98.75 (3.79) |
| 280.88 | 545.86 | 97.43 (1.50) | ||
| 393.23 | 659.75 | 98.56 (2.31) | ||
| wilforine | 824.66 | 457.20 | 1279.68 | 99.52 (2.09) |
| 762.00 | 1584.73 | 99.75 (1.51) | ||
| 1066.80 | 1870.15 | 98.00 (0.80) |
| No | Content (μg/Tablet) | |||||||||||||
|---|---|---|---|---|---|---|---|---|---|---|---|---|---|---|
| 1 a | 2 | 3 | 4 | 5 | 6 | 7 | 8 | 9 | 10 | 11 | 12 | 13 | 14 | |
| S1 | 11.67 | 36.06 | 13.12 | 0.66 | 5.71 | 19.61 | 82.82 | 151.38 | 153.00 | 10.36 | 307.64 | 107.42 | 91.38 | 211.27 |
| S2 | 6.57 | 11.80 | 23.68 | 10.05 | 6.32 | 30.29 | 46.03 | 119.63 | 76.61 | 5.40 | 158.89 | 35.29 | 54.60 | 165.43 |
| S3 | 2.58 | 0.079 | 53.66 | 0.20 | 11.32 | 20.94 | 48.26 | 150.08 | 3.16 | tr b | 1.42 | tr | 0.61 | 0.49 |
| S4 | 10.81 | 25.06 | 15.09 | 16.50 | 0.92 | 18.35 | 45.75 | 158.86 | 150.95 | 8.06 | 270.70 | 88.49 | 86.48 | 159.08 |
| S5 | 9.95 | 14.13 | 18.64 | 30.58 | 0.46 | 5.46 | 49.30 | 284.37 | 230.42 | 6.38 | 260.08 | 97.59 | 54.59 | 134.24 |
| S6 | tr | 23.26 | 8.743 | 16.09 | nd c | 2.14 | 66.94 | 46.46 | 25.90 | 2.33 | 101.22 | 21.55 | 12.40 | 51.96 |
| S7 | 1.59 | 7.96 | 12.68 | 5.12 | 2.66 | 18.51 | 22.15 | 20.94 | 36.48 | 1.13 | 59.37 | 11.04 | 2.86 | 23.95 |
| S8 | 1.22 | 20.90 | 21.43 | 42.45 | nd | 10.25 | 67.48 | 29.81 | 41.09 | 1.59 | 63.31 | 12.20 | 6.20 | 38.43 |
| S9 | 5.75 | 13.21 | 20.07 | 16.16 | 21.42 | 147.88 | 26.10 | 128.04 | 76.51 | 5.80 | 161.96 | 39.29 | 18.90 | 109.38 |
| S10 | 7.95 | 18.99 | 18.64 | 6.45 | 1.04 | 15.03 | 40.59 | 87.70 | 91.95 | 7.64 | 186.88 | 55.46 | 48.77 | 122.68 |
| No. | NO Inhibitory Effect IC50 (μg/mL a) | Cytotoxicity TC50 (μg/mL a) | Therapeutic Index (TI, = TC50/IC50) |
|---|---|---|---|
| S1 | 7.72 | 10.12 | 1.31 |
| S2 | 9.91 | 10.58 | 1.07 |
| S3 | 5.41 | 8.78 | 1.62 |
| S4 | 13.06 | 19.20 | 1.47 |
| S5 | 11.01 | 16.32 | 1.48 |
| S6 | 189.32 | nu b | – c |
| S7 | 52.62 | 75.03 | 1.43 |
| S8 | 61.80 | 75.93 | 1.23 |
| S9 | 6.12 | 9.12 | 1.49 |
| S10 | 6.26 | 10.55 | 1.69 |
| No. | NO Inhibitory Effect IC50 (μM) | Cytotoxicity TC50 (μM) | Therapeutic Index (TI, = TC50/IC50) |
|---|---|---|---|
| triptolide | 0.066 | 0.071 | 1.08 |
| tripterifordin | nu a | w b | – c |
| triptoquinone B | 35.65 | 0.11 | 0.0031 |
| triptophenolide | 43.11 | w | – |
| demethylzeylasteral | 3.48 | 27.59 | 7.93 |
| celastrol | 0.56 | 1.72 | 3.07 |
| wilforlide A | nu | nu | – |
| wilfortrine | nu | nu | – |
| peritassine A | nu | nu | – |
| neoeunymine | nu | nu | – |
| wilforgine | w | w | – |
| euonymine | nu | nu | – |
| wilfornine A | w | w | – |
| wilforine | w | w | – |
Publisher’s Note: MDPI stays neutral with regard to jurisdictional claims in published maps and institutional affiliations. |
© 2022 by the authors. Licensee MDPI, Basel, Switzerland. This article is an open access article distributed under the terms and conditions of the Creative Commons Attribution (CC BY) license (https://creativecommons.org/licenses/by/4.0/).
Share and Cite
Wang, Y.; Dai, Z.; Yan, J.; Wu, X.; Ma, S. Comprehensive Evaluation of the Quality of Tripterygium Glycosides Tablets Based on Multi-Component Quantification Combined with an In Vitro Biological Assay. Molecules 2022, 27, 5102. https://doi.org/10.3390/molecules27165102
Wang Y, Dai Z, Yan J, Wu X, Ma S. Comprehensive Evaluation of the Quality of Tripterygium Glycosides Tablets Based on Multi-Component Quantification Combined with an In Vitro Biological Assay. Molecules. 2022; 27(16):5102. https://doi.org/10.3390/molecules27165102
Chicago/Turabian StyleWang, Yadan, Zhong Dai, Jiangong Yan, Xianfu Wu, and Shuangcheng Ma. 2022. "Comprehensive Evaluation of the Quality of Tripterygium Glycosides Tablets Based on Multi-Component Quantification Combined with an In Vitro Biological Assay" Molecules 27, no. 16: 5102. https://doi.org/10.3390/molecules27165102
APA StyleWang, Y., Dai, Z., Yan, J., Wu, X., & Ma, S. (2022). Comprehensive Evaluation of the Quality of Tripterygium Glycosides Tablets Based on Multi-Component Quantification Combined with an In Vitro Biological Assay. Molecules, 27(16), 5102. https://doi.org/10.3390/molecules27165102