
Development of a Gas-Tight Syringe Headspace GC-FID Method for the Detection of Ethanol, and a Description of the Legal and Practical Framework for Its Analysis, in Samples of English and Welsh Motorists’ Blood and Urine


 ,
,  , ,
, ,
Abstract
: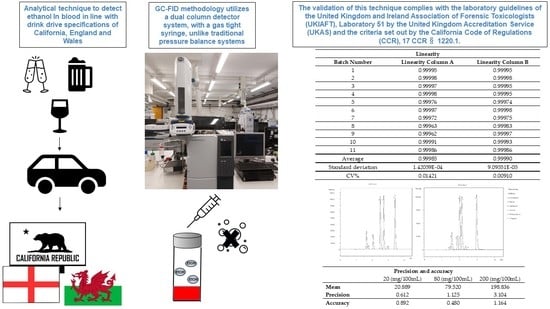
1. Introduction
2. Results
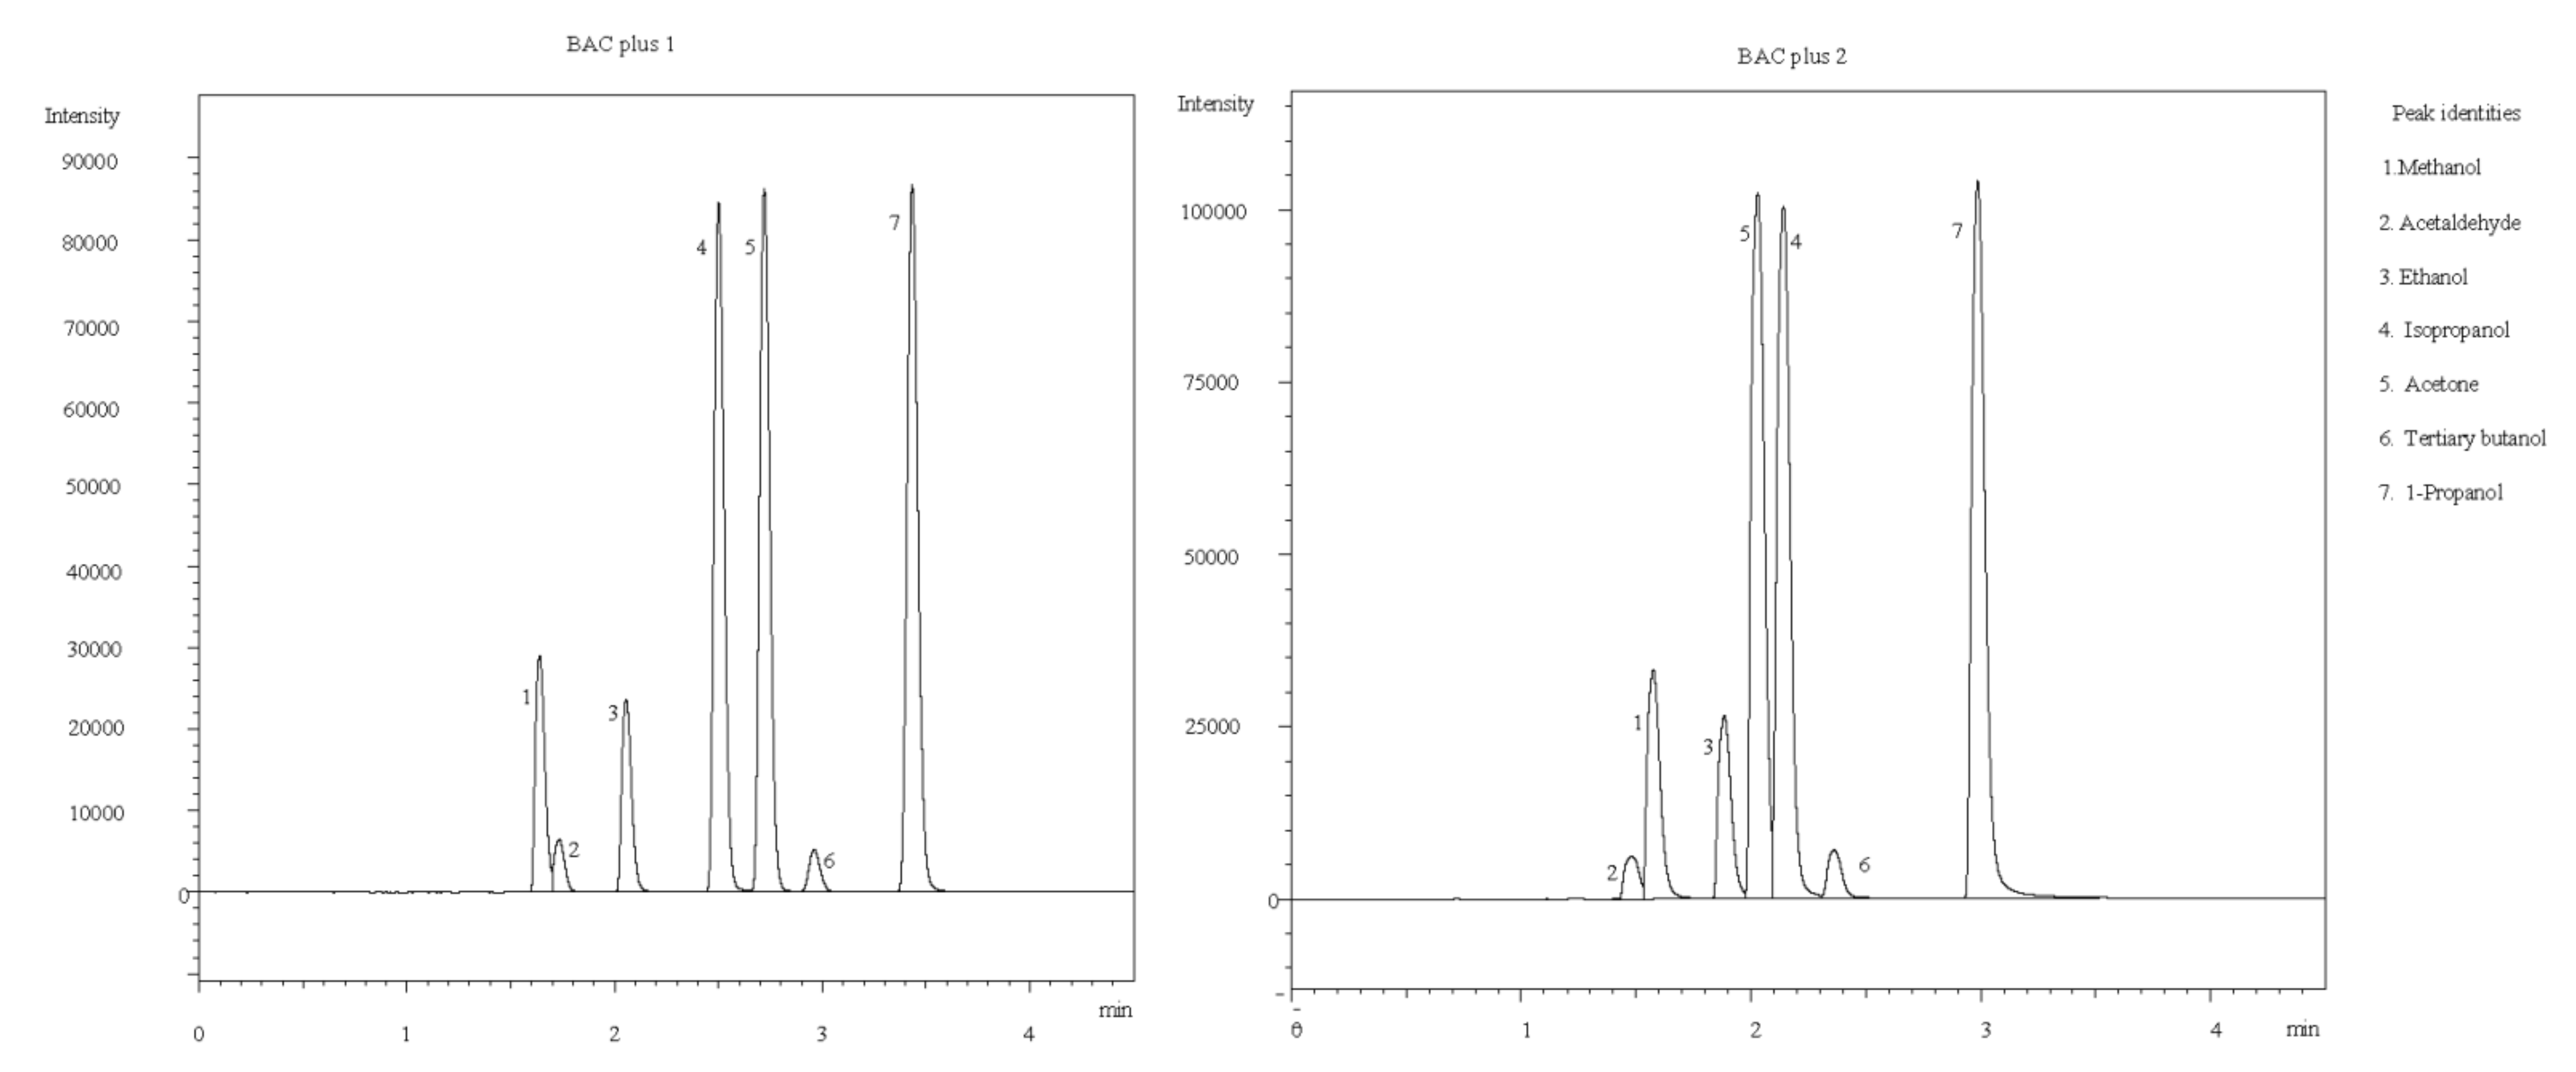
2.1. Separation Conditions
2.2. Linearity
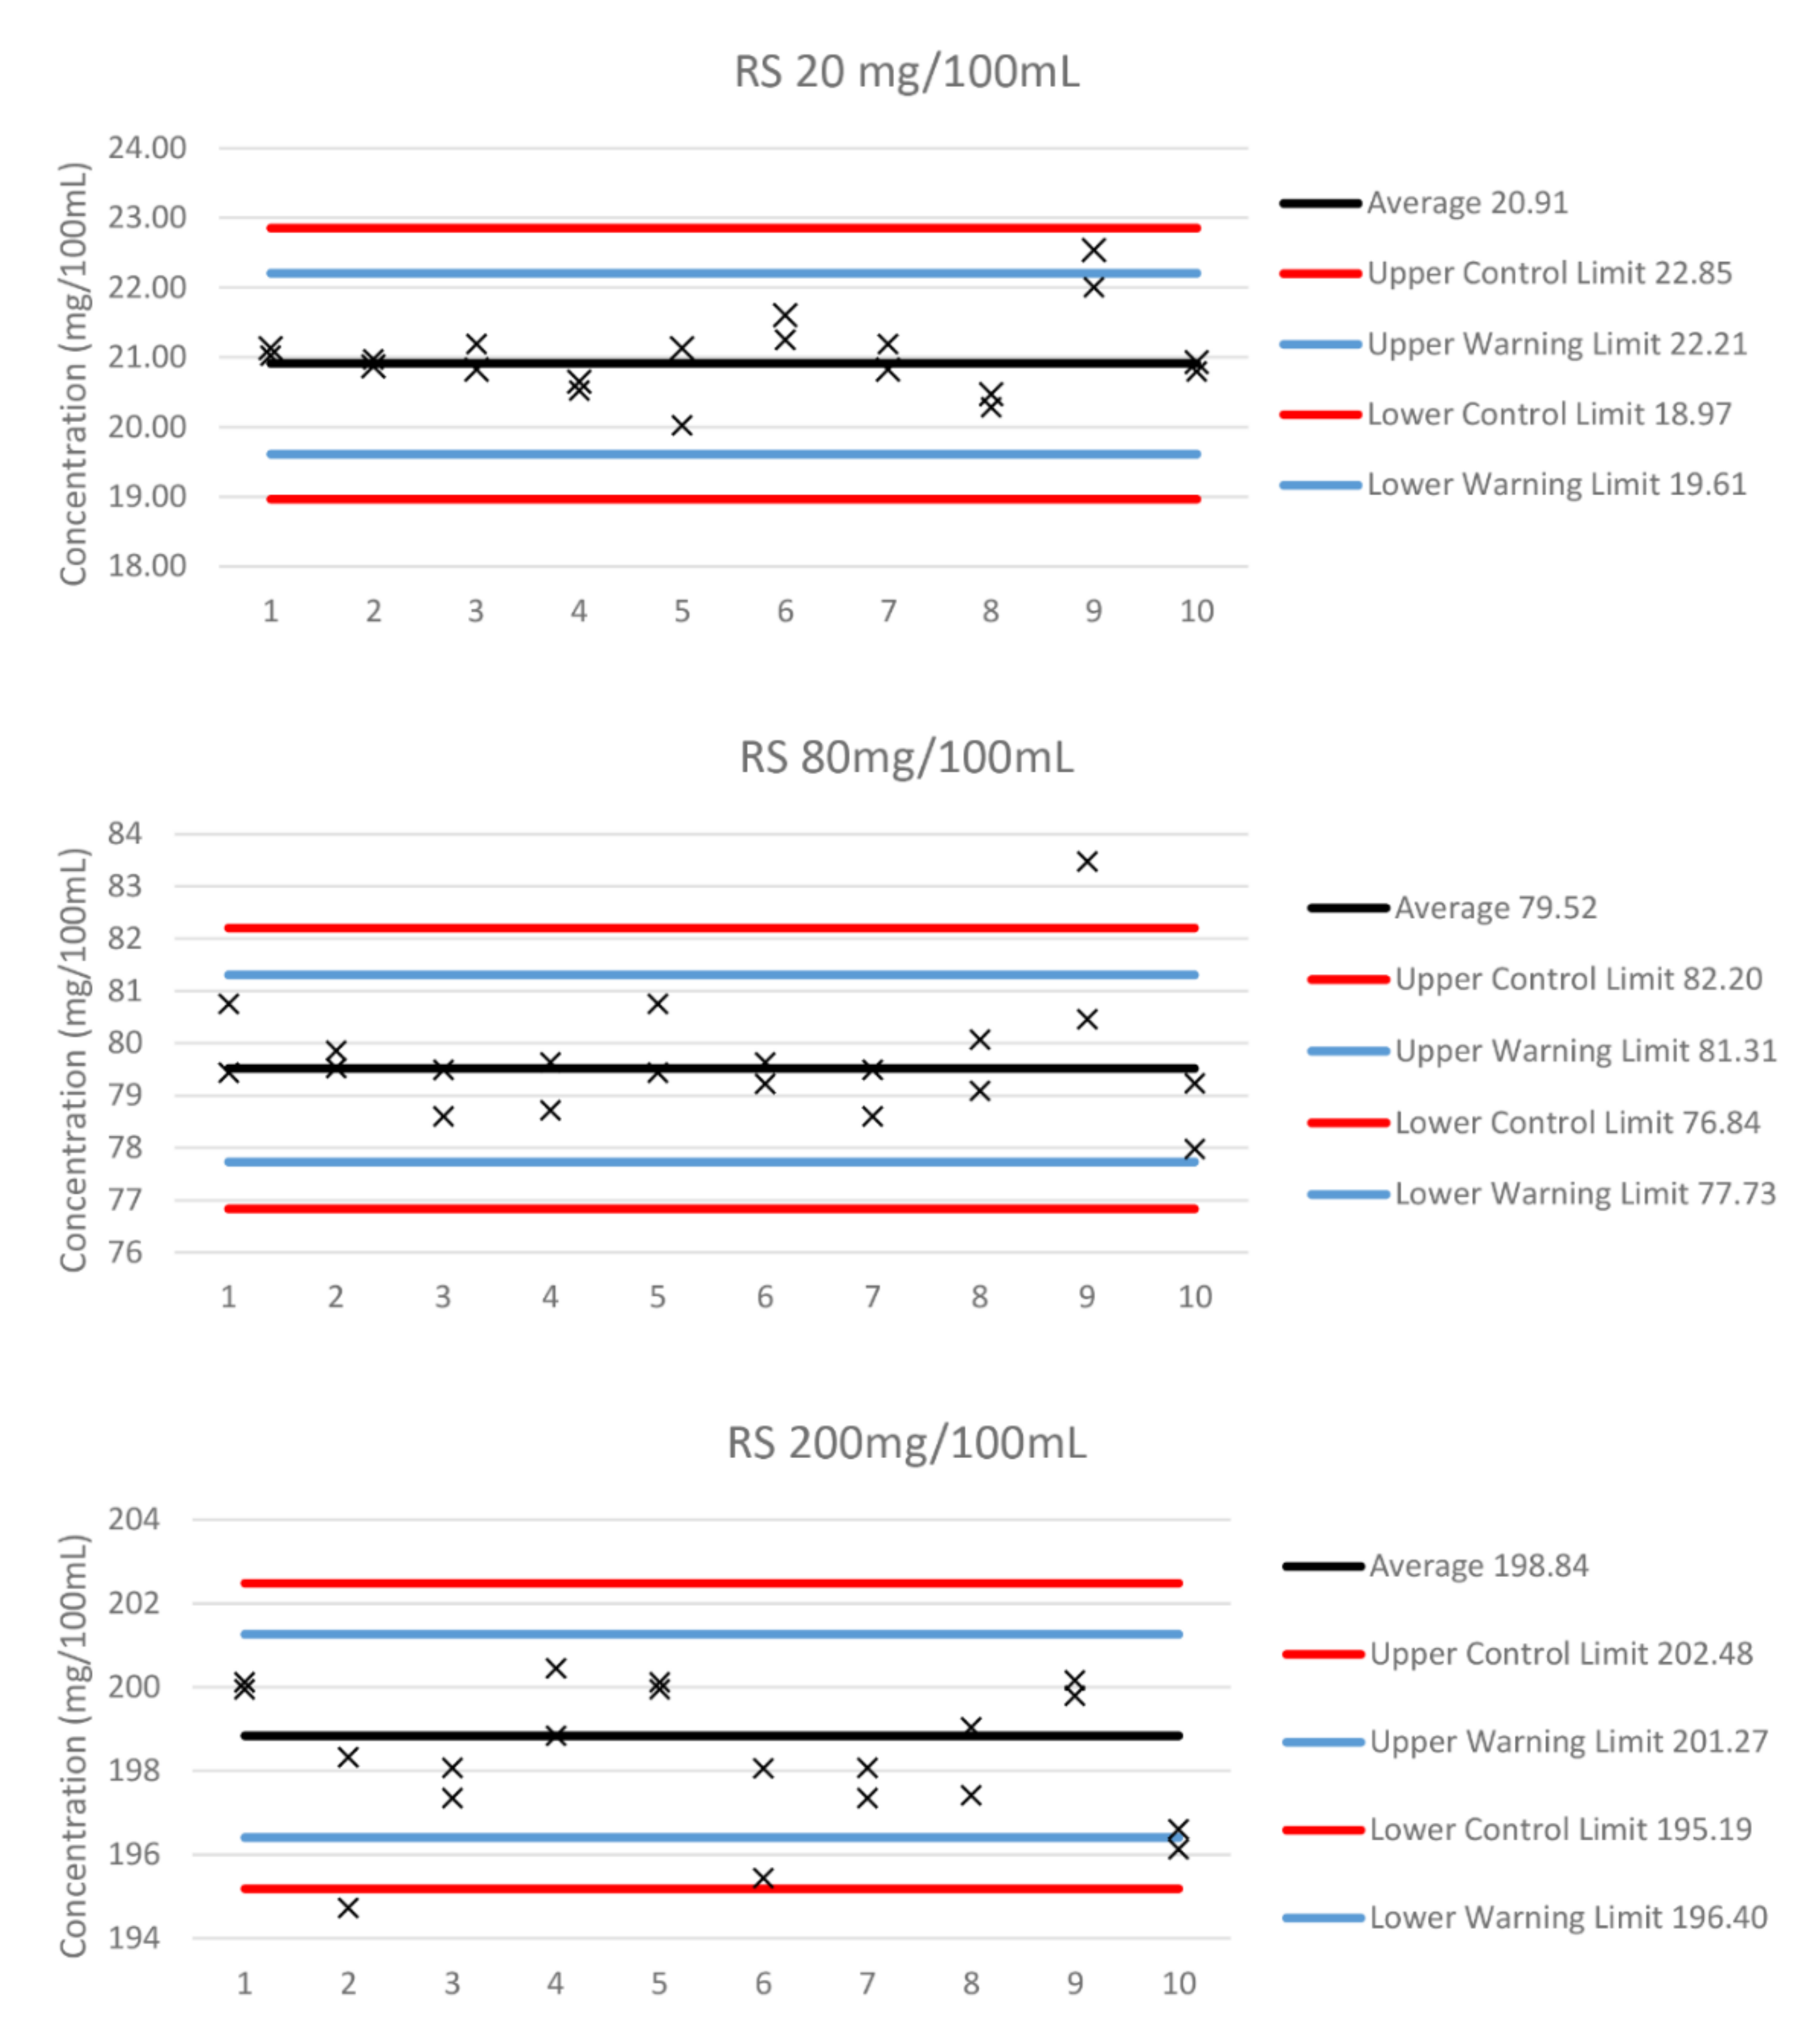
2.3. Precision
2.4. Accuracy
2.5. Uncertainty
2.6. Limit of Detection and Quantification
3. Discussion
4. Materials and Methods
4.1. Chemicals and Reagents
4.2. Instrumentation
4.3. Sample Preparation
4.4. Headspace GC-FID Method
5. Conclusions
Supplementary Materials
Author Contributions
Funding
Institutional Review Board Statement
Informed Consent Statement
Conflicts of Interest
Sample Availability
References
- Felson, R.; Staff, J. The effects of alcohol intoxication on violent versus other offending. Crim. Justice Behav. 2012, 37, 1343–1360. [Google Scholar] [CrossRef]
- Scott-Ham, M.; Burton, F.C. Toxicological findings in cases of alleged drug-facilitated sexual assault in the United Kingdom over a 3-year period. J. Clin. Forensic Med. 2005, 12, 175–186. [Google Scholar] [CrossRef] [PubMed]
- Dubowski, K. Manual for Analysis of Ethanol in Biological Liquids; Department of Transport: Washington, DC, USA, 1977.
- Legislation.gov.uk. The Road Traffic Act 1988 (Prescribed Limit) (Scotland) Regulations. 2014. Available online: https://www.legislation.gov.uk/sdsi/2014/9780111024478 (accessed on 18 February 2022).
- Legislation.gov.uk. Road Traffic (Amendment) Act (Northern Ireland). 2016. Available online: https://www.legislation.gov.uk/nia/2016/11 (accessed on 18 February 2022).
- Legislation.gov.uk. Road Traffic Act 1988. 2011. Available online: https://www.legislation.gov.uk/ukpga/1988/52/section/5 (accessed on 18 February 2022).
- North, P. Report of the Review of Drink and Drug Driving Law; DfT Publications: London, UK, 2010.
- Logan, B.K. Analysis of alcohol and other volatiles. In Gas Chromatography in Forensic Science; Tebbett, I., Ed.; Ellis Horwood: New York, NY, USA, 1992; pp. 87–108. [Google Scholar]
- Kellner, R.; Mermet, J.-M.; Otto, M.; Varcárcel, M.; Widmer, H.M. Analytical Chemistry: A Modern Approach to Analytical Science, 2nd ed.; Wiley-VCH: Weinheim, Germany, 2004. [Google Scholar]
- Kovatsi, L.; Giannakis, D.; Arzoglou, V.; Samanidou, V. Development and validation of a direct headspace GC-FID method for the determination of sevoflurane, desflurane and other volatile compounds of forensic interest in biological fluids: Application on clinical and post-mortem samples. J. Sep. Sci. 2011, 34, 1004–1010. [Google Scholar] [CrossRef] [PubMed]
- Jones, A.W.; Holmgren, A.; Ahlner, J. Toxicological analysis of blood and urine samples from female victims of alleged sexual assault. Clin. Toxicol. 2012, 50, 555–561. [Google Scholar] [CrossRef] [PubMed]
- Brown, D.J.; Long, W.C. Quality Control in Blood Alcohol Analysis: Simultaneous Quantitation and Confirmation. J. Anal. Toxicol. 1988, 12, 279–283. [Google Scholar] [CrossRef] [PubMed]
- Zuba, D.; Parczewski, A.; Reichenbacher, M. Optimisation of solid-phase microextraction conditions for gas chromatographic determination of ethanol and other volatile compounds in blood. J. Chromatogr. B 2002, 773, 75–82. [Google Scholar] [CrossRef]
- De Martinis, B.S.; Martin, C.C.S. Automated headspace solid-phase microextraction and capillary gas chromatography analysis of ethanol in postmortem specimens. Forensic Sci. Int. 2002, 182, 115–119. [Google Scholar] [CrossRef]
- De Martinis, B.S.; Martins Ruzzene, M.A.; Santos Martin, C.C. Determination of ethanol in human blood and urine by automated headspace solid-phase microextraction and capillary gas chromatography. Anal. Chim. Acta 2004, 522, 163–168. [Google Scholar] [CrossRef]
- Westland, J.L.; Dorman, F. Comparison of SPME and static headspace analysis of blood alcohol concentration utilizing two novel chromatographic stationary phases. Forensic Sci. Int. 2013, 231, e50–e56. [Google Scholar] [CrossRef] [PubMed]
- California Code of Regulations. Public Health (17) § 1220.1. 2021. Available online: https://govt.westlaw.com/calregs/Browse/Home/California/CaliforniaCodeofRegulations?guid=I8308083A5BD746EC87F10B98F14121AA&transitionType=Default&contextData=%28sc.Default%29 (accessed on 18 February 2022).
- Taylor, L.J.; Remeskevcius, V.; Saskoy, L.; Brodie, T.; Mahmud, J.; Moir, H.; Brouner, J.; Howe, C.; Thatti, B.; O’Connell, S.; et al. Determination of ethanol in micro-volumes of blood by headspace gas chromatography: Statistical comparison between capillary and venous sampling sites. Med. Sci. Law 2021, 61, 86–96, ISSN: 0025-8024. (in print). [Google Scholar] [CrossRef] [PubMed]
- Elliott, S.P.; Stephen, D.W.S.; Paterson, S. The United Kingdom and Ireland association of forensic toxicologists: Forensic toxicology laboratory guidelines. Sci. Justice 2018, 58, 335–345. [Google Scholar] [CrossRef] [PubMed]
- Mihretu, L.D.; Gebru, A.G.; Mekonnen, K.N.; Asgedom, A.G.; Desta, Y.H. Determination of ethanol in blood using headspace gas chromatography with flameionization detector (HS-GC-FID): Validation of a method. Cogent Chem. 2020, 6, 1760187. [Google Scholar] [CrossRef]
- Monteiro, C.; Proença, P.; Tavares, C.; Castañera, A.; Corte Real, F. Interference of anesthetics in blood alcohol analysis by HS-GC-FID: A case report. Forensic Sci. Int. 2016, 265, 65–69. [Google Scholar] [CrossRef] [PubMed]
- Neelamegam, R.; Ezhilan, B. GC-MS analysis of phytocomponents in the ethanol extract of Polygonum chinense L. Pharmacogn. Res. 2012, 4, 11. [Google Scholar] [CrossRef] [PubMed] [Green Version]
- Magistrates’ Court Sentencing Guidelines. 2021. Available online: https://www.sentencingcouncil.org.uk/the-magistratescourt-sentencing-guidelines (accessed on 18 February 2022).

| Linearity | ||
|---|---|---|
| Batch Number | Linearity Column A | Linearity Column B |
| 1 | 0.99995 | 0.99995 |
| 2 | 0.99998 | 0.99998 |
| 3 | 0.99997 | 0.99995 |
| 4 | 0.99998 | 0.99995 |
| 5 | 0.99976 | 0.99974 |
| 6 | 0.99997 | 0.99998 |
| 7 | 0.99972 | 0.99975 |
| 8 | 0.99963 | 0.99983 |
| 9 | 0.99962 | 0.99997 |
| 10 | 0.99991 | 0.99993 |
| 11 | 0.99986 | 0.99986 |
| Average | 0.99985 | 0.99990 |
| Standard deviation | 1.42059 × 10⁻⁴ | 9.09551 × 10⁻⁵ |
| CV% | 0.01421 | 0.00910 |
| Precision and Accuracy | |||
|---|---|---|---|
| 20 (mg/100 mL) | 80 (mg/100 mL) | 200 (mg/100 mL) | |
| Mean | 20.889 | 79.520 | 198.836 |
| Precision | 0.612 | 1.125 | 3.104 |
| Accuracy | 0.892 | 0.480 | 1.164 |
| Parameter | Value | |
|---|---|---|
| Inlet temperature (°C) | 110 | |
| Injection mode | Split | |
| Pressure (Kpa) | 85 | |
| Column flow (mL/min) | 2.78 | |
| Linear velocity (cm/s) | 42.30 | |
| Purge flow (mL/min) | 3.00 | |
| Split ratio | 5.00 | |
| Oven temperature (°C) | 40, isothermal | |
| Detector temperature (°C) | 280 | |
| Analysis time (min) | 4 | |
| Headspace oven temperature (°C) | 60 | |
| Syringe temperature (°C) | 70 | |
| Fill volume (mL) | 1.75 | |
| Sample volume (mL) | 1.00 | |
| Incubation time (min) | 5.00 | |
| Sample speed (mL/min) | 5.0 | |
| Shaker time (min) | 0.50 on | 0.10 off |
| Injection speed (mL/min) | 80 | |
Publisher’s Note: MDPI stays neutral with regard to jurisdictional claims in published maps and institutional affiliations. |
© 2022 by the authors. Licensee MDPI, Basel, Switzerland. This article is an open access article distributed under the terms and conditions of the Creative Commons Attribution (CC BY) license (https://creativecommons.org/licenses/by/4.0/).
Share and Cite
Taylor, L.; Saskőy, L.; Brodie, T.; Remeškevičius, V.; Moir, H.J.; Barker, J.; Fletcher, J.; Kaur Thatti, B.; Trotter, G.; Rooney, B. Development of a Gas-Tight Syringe Headspace GC-FID Method for the Detection of Ethanol, and a Description of the Legal and Practical Framework for Its Analysis, in Samples of English and Welsh Motorists’ Blood and Urine. Molecules 2022, 27, 4771. https://doi.org/10.3390/molecules27154771
Taylor L, Saskőy L, Brodie T, Remeškevičius V, Moir HJ, Barker J, Fletcher J, Kaur Thatti B, Trotter G, Rooney B. Development of a Gas-Tight Syringe Headspace GC-FID Method for the Detection of Ethanol, and a Description of the Legal and Practical Framework for Its Analysis, in Samples of English and Welsh Motorists’ Blood and Urine. Molecules. 2022; 27(15):4771. https://doi.org/10.3390/molecules27154771
Chicago/Turabian StyleTaylor, Luke, Lili Saskőy, Tara Brodie, Vytautas Remeškevičius, Hannah Jayne Moir, James Barker, John Fletcher, Baljit Kaur Thatti, Gavin Trotter, and Brian Rooney. 2022. "Development of a Gas-Tight Syringe Headspace GC-FID Method for the Detection of Ethanol, and a Description of the Legal and Practical Framework for Its Analysis, in Samples of English and Welsh Motorists’ Blood and Urine" Molecules 27, no. 15: 4771. https://doi.org/10.3390/molecules27154771
APA StyleTaylor, L., Saskőy, L., Brodie, T., Remeškevičius, V., Moir, H. J., Barker, J., Fletcher, J., Kaur Thatti, B., Trotter, G., & Rooney, B. (2022). Development of a Gas-Tight Syringe Headspace GC-FID Method for the Detection of Ethanol, and a Description of the Legal and Practical Framework for Its Analysis, in Samples of English and Welsh Motorists’ Blood and Urine. Molecules, 27(15), 4771. https://doi.org/10.3390/molecules27154771