
Metabolomics Approach on Non-Targeted Screening of 50 PPCPs in Lettuce and Maize

Abstract
:1. Introduction
2. Materials and Methods
2.1. Chemicals and Materials
2.2. Solution Preparation
2.3. Sample Preparation and Pretreatment Process
2.4. Sample Grouping and Naming
2.5. Analytical Method
2.6. Metabolomics Data Processing
3. Results and Discussion
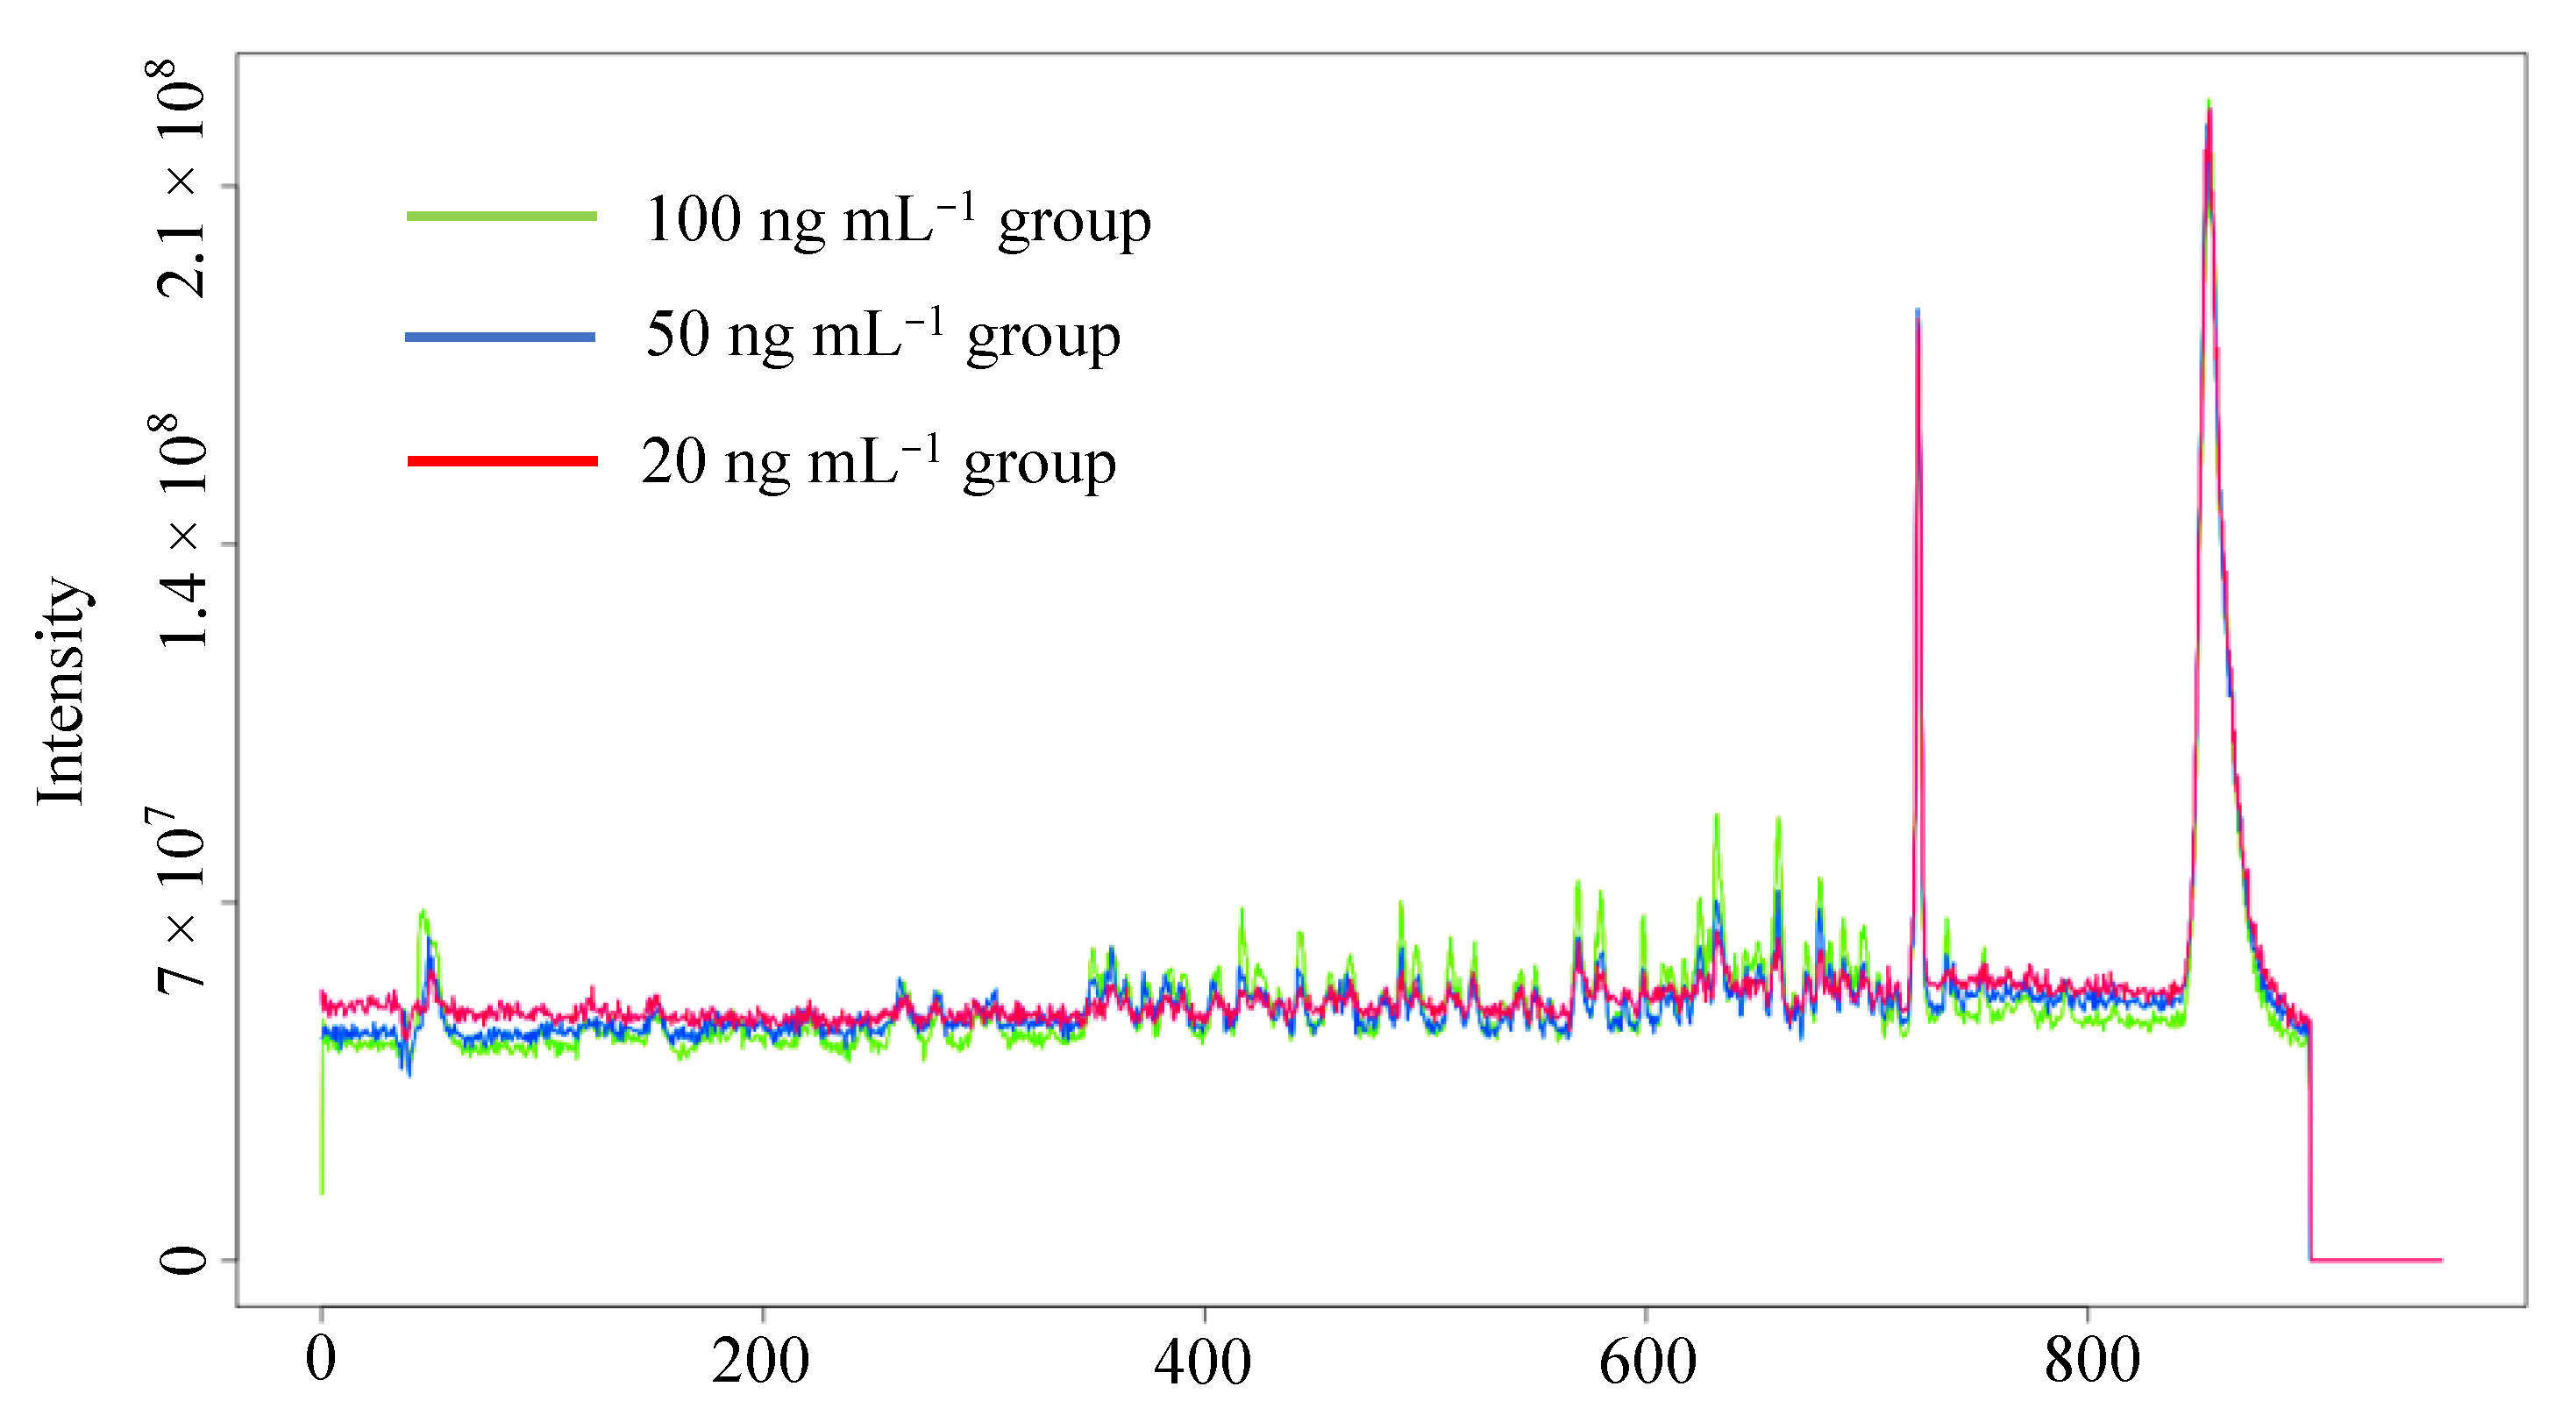
3.1. Data Preprocessing
3.2. Multivariate Analysis
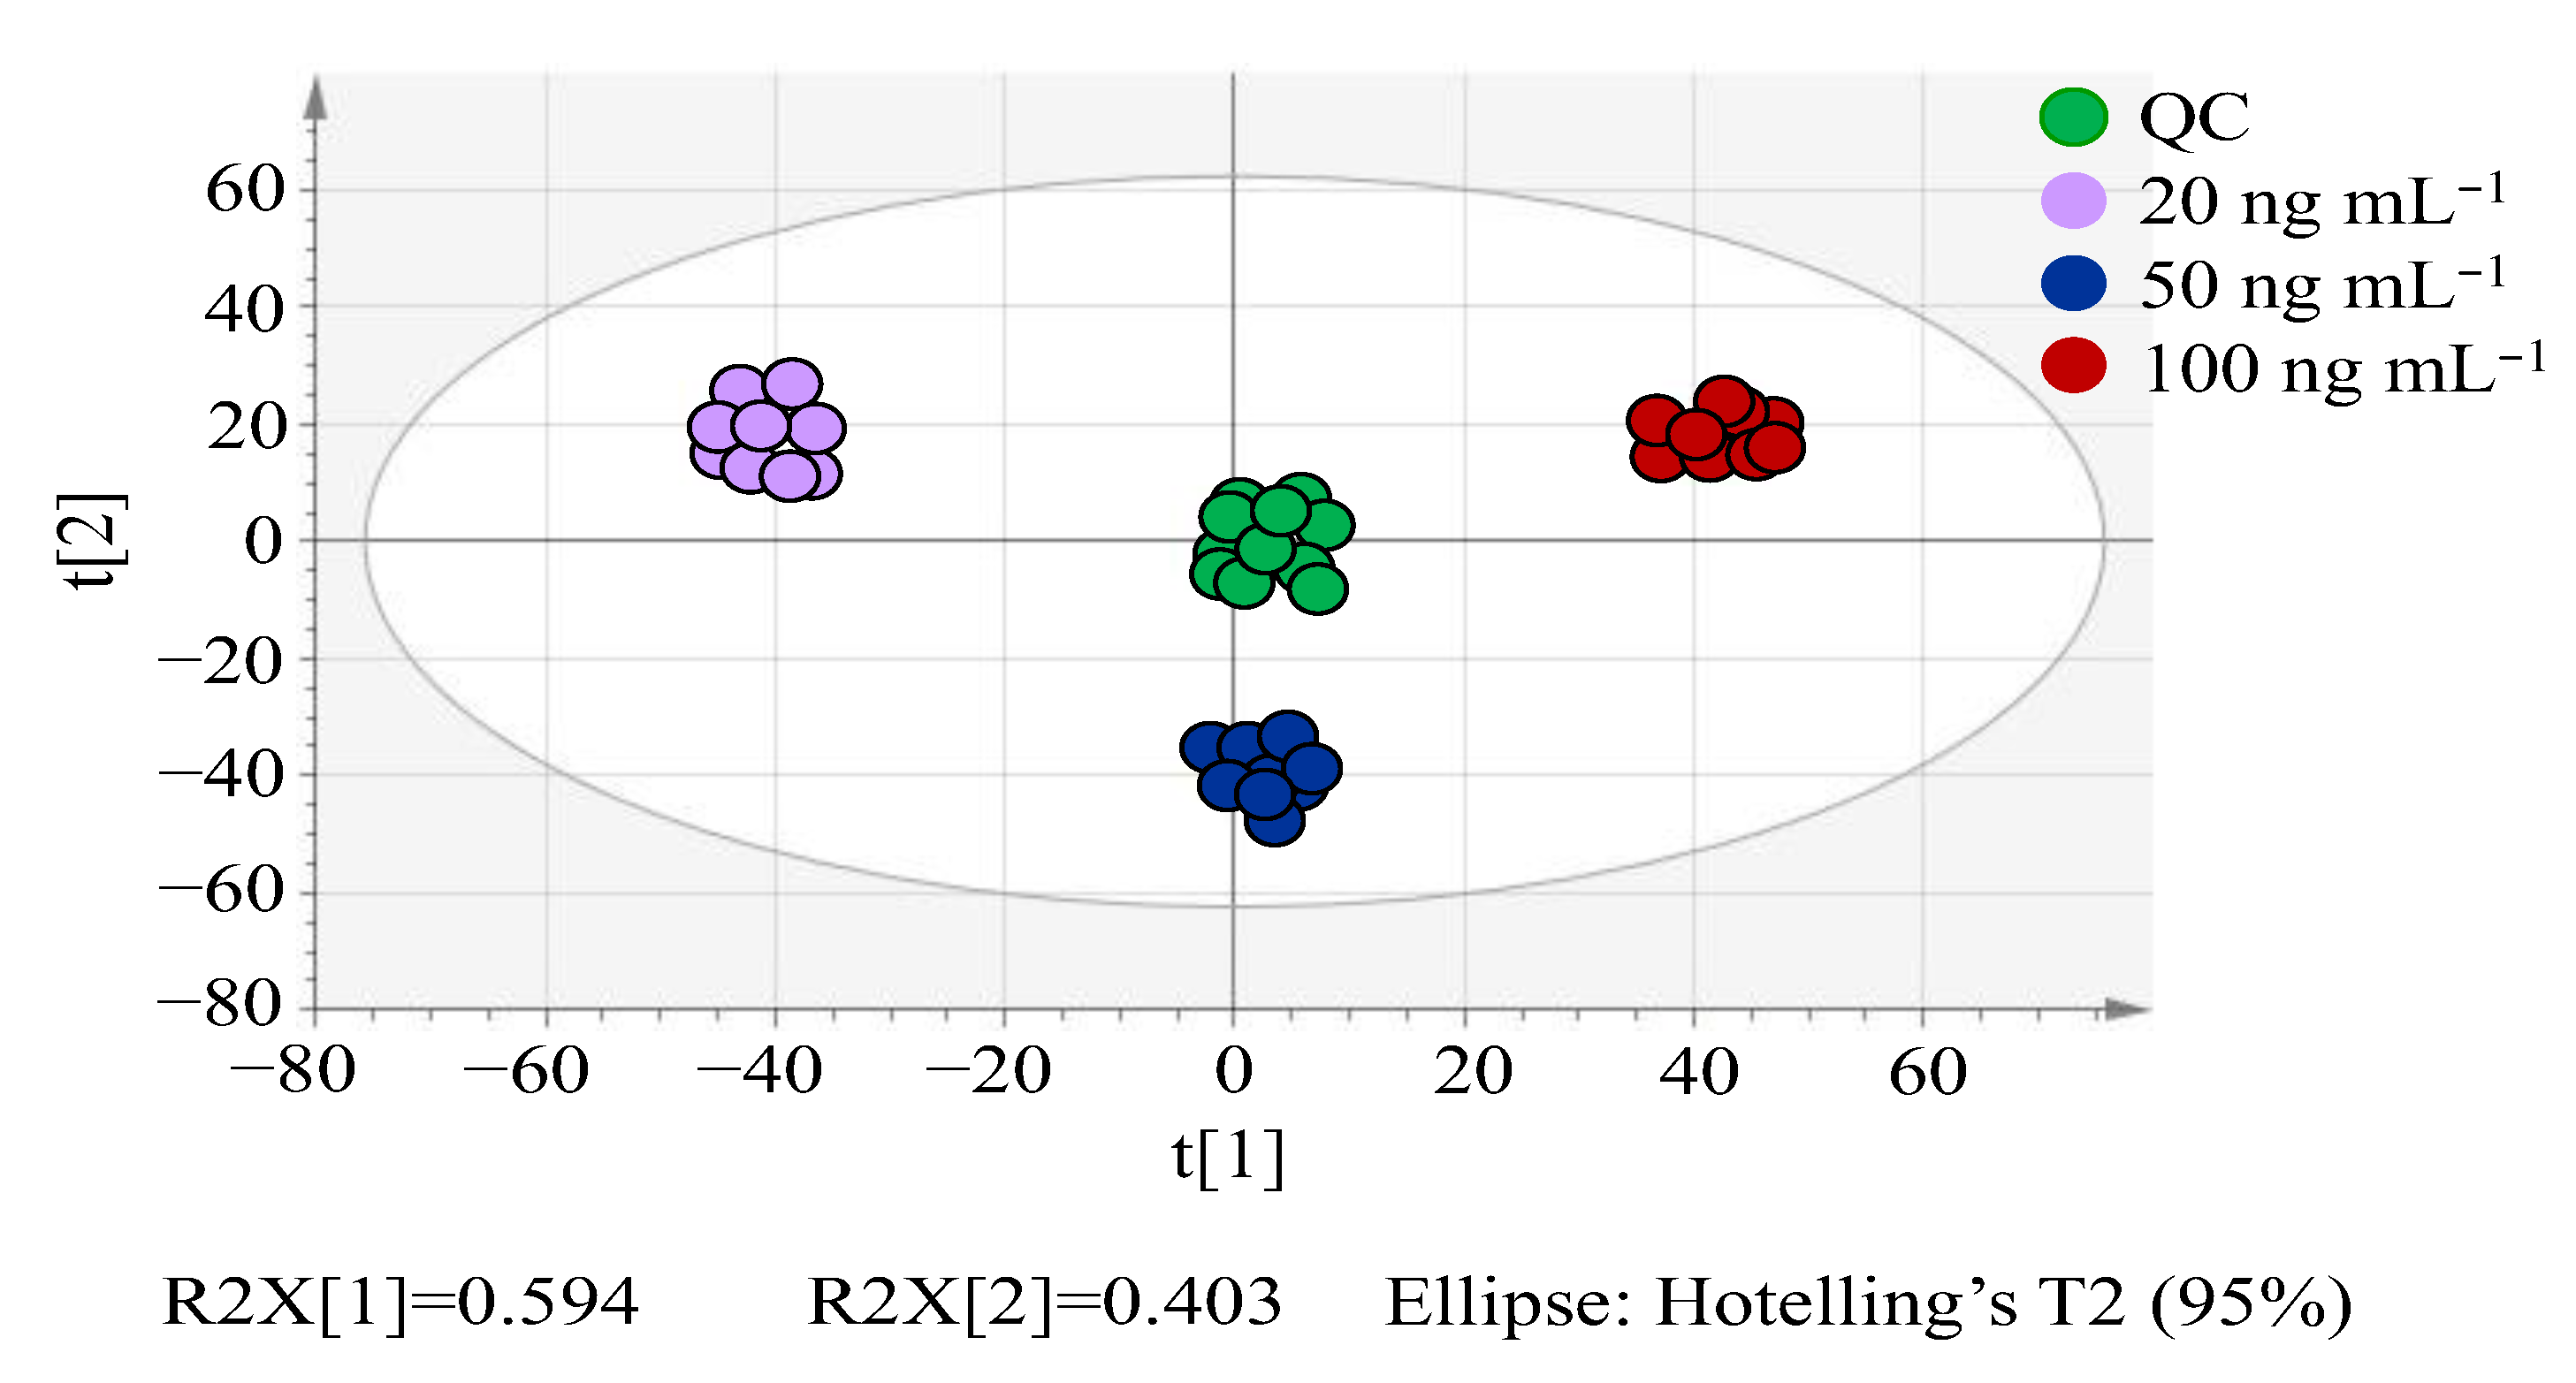
3.2.1. PCA Analysis
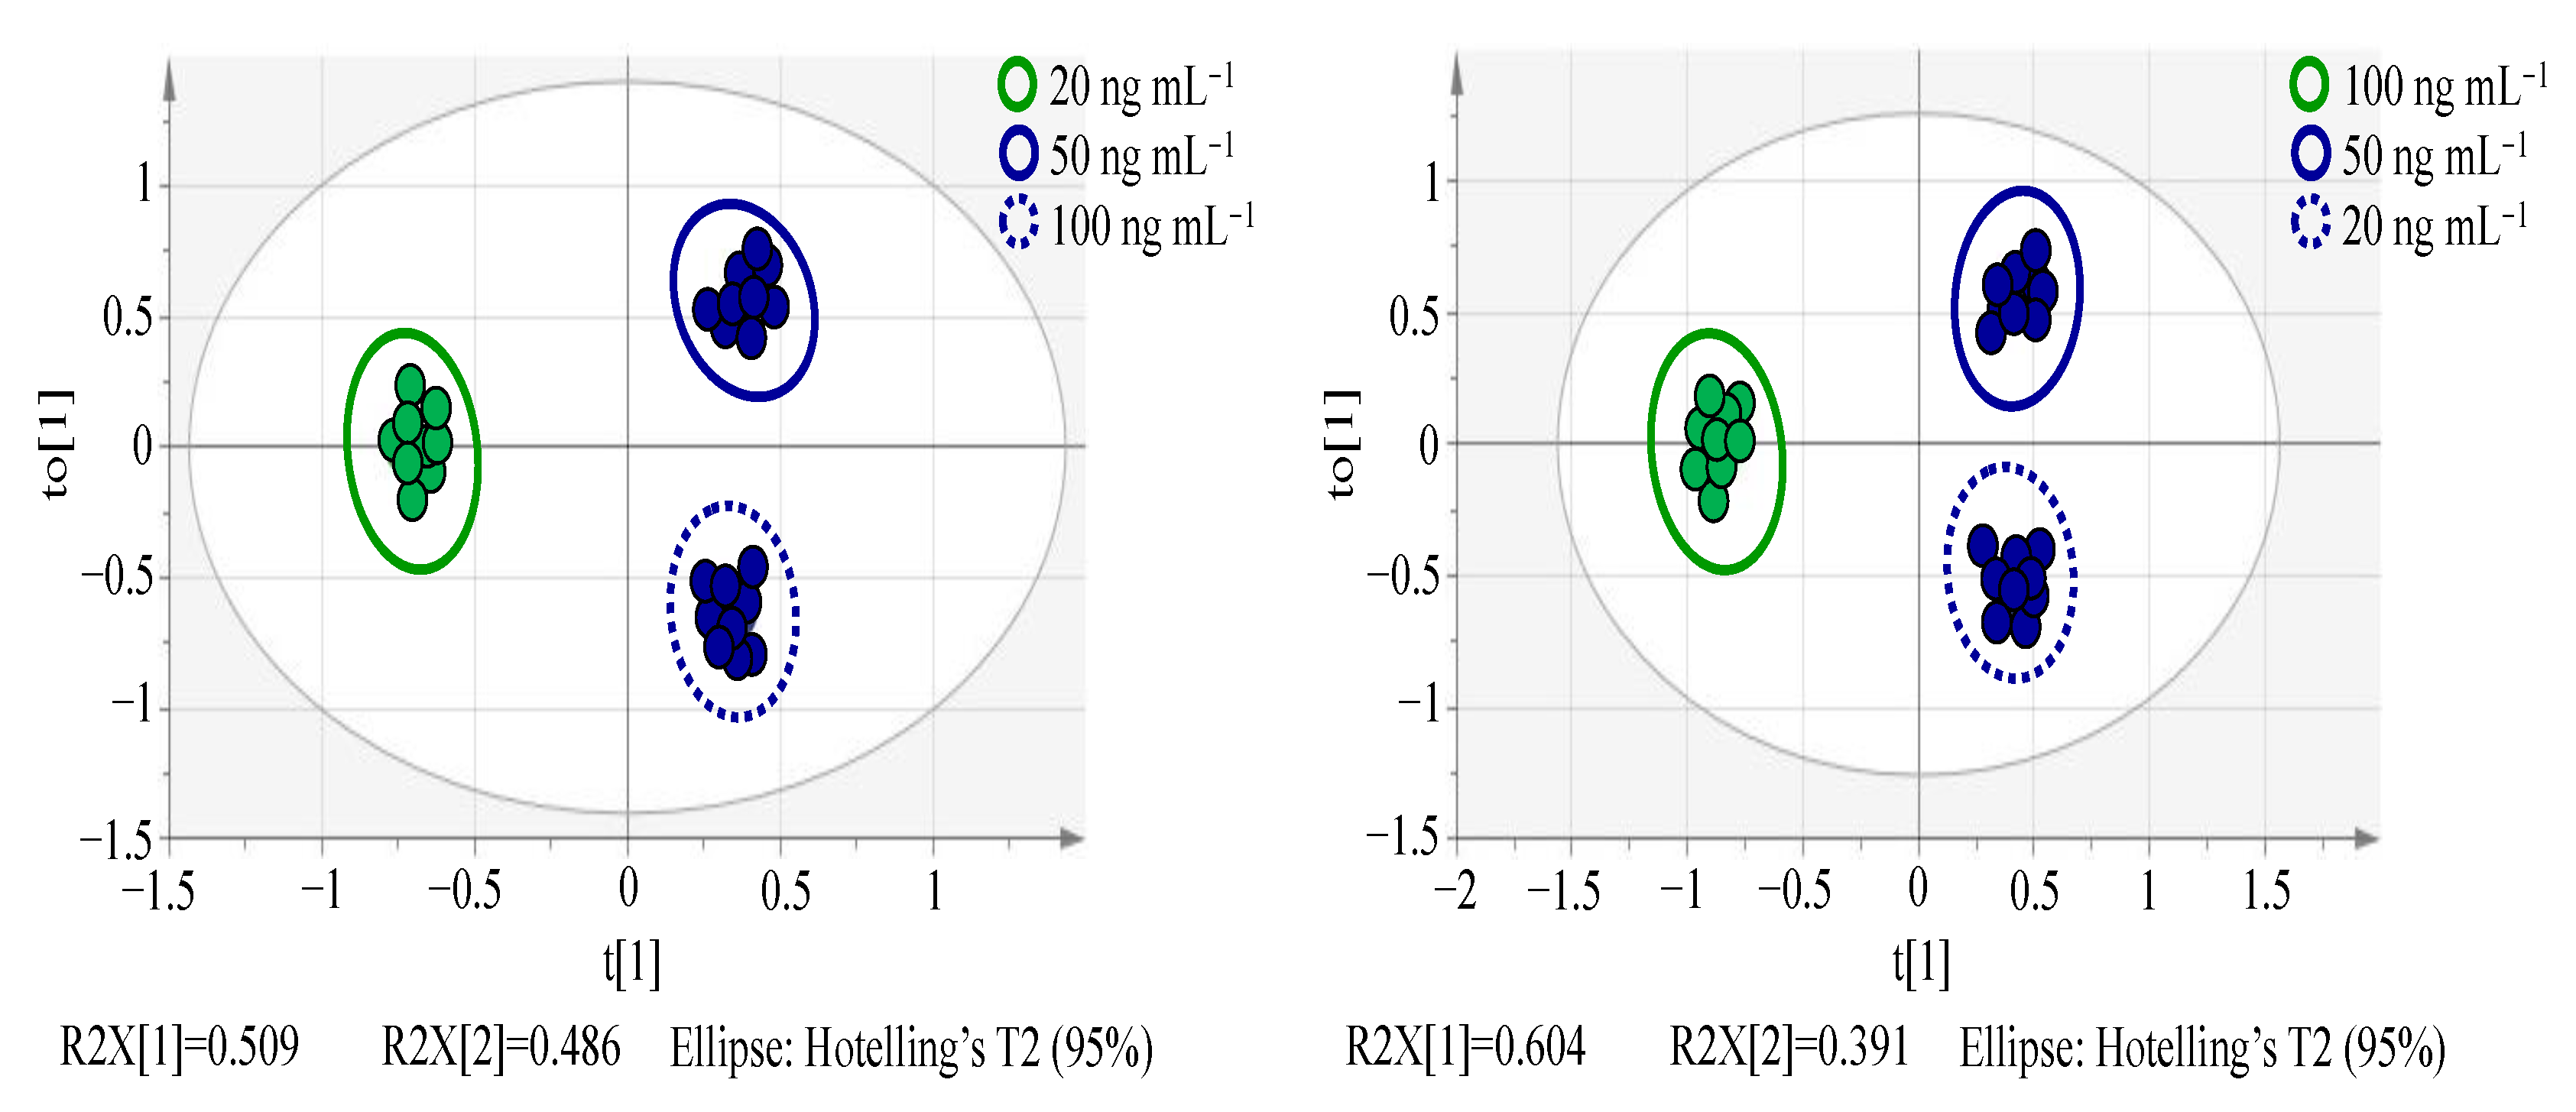
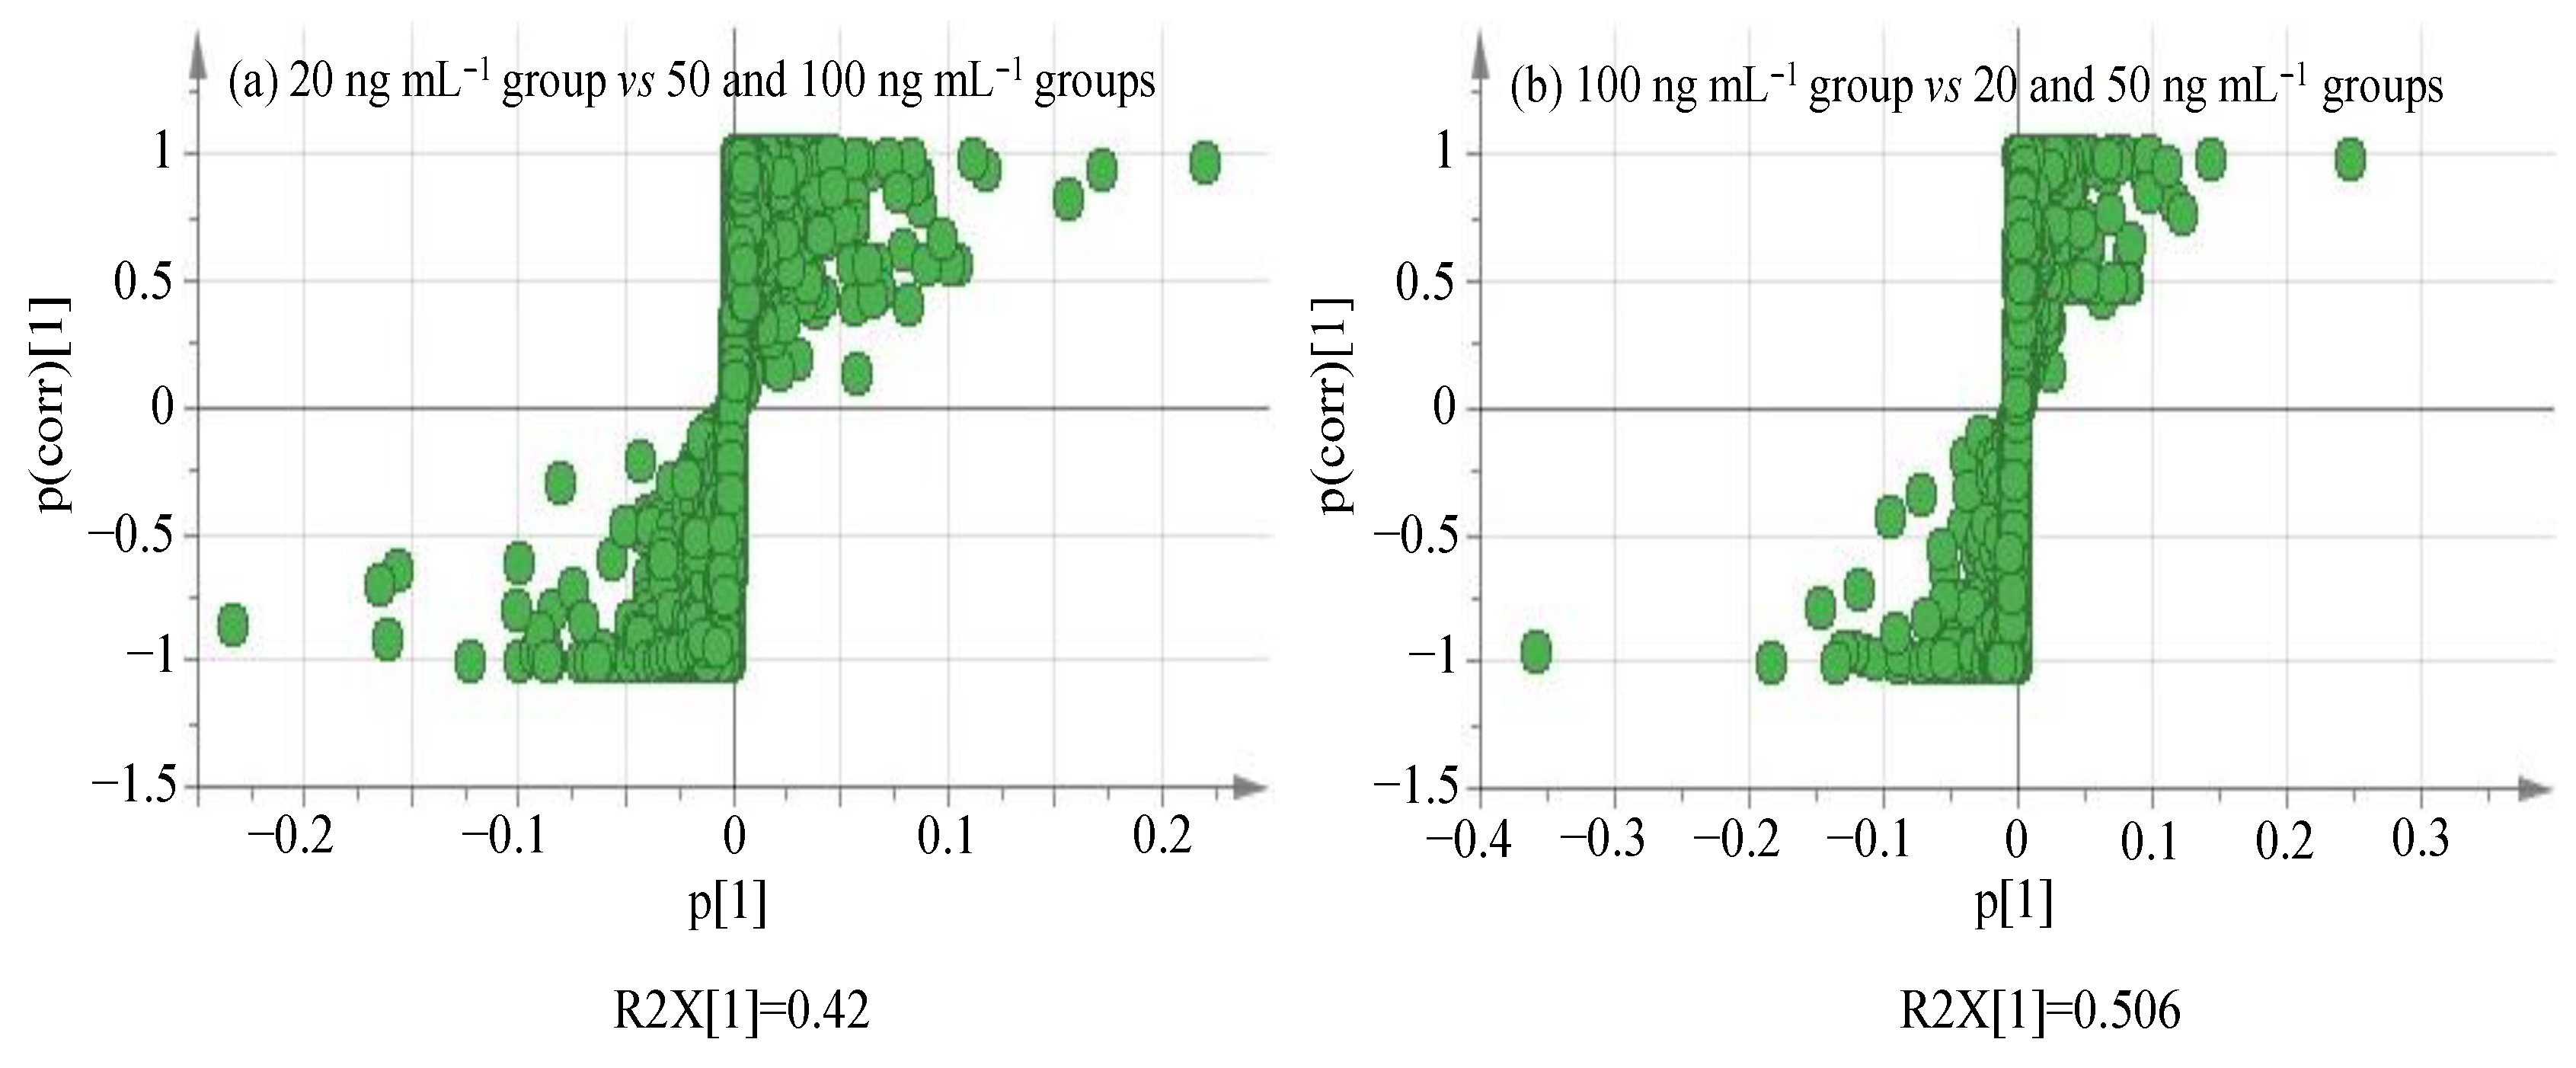
3.2.2. OPLS-DA Analysis
3.3. Univariate Analysis
3.4. Method Applicability in Maize Matrix
3.5. Real Sample Test
4. Conclusions
Supplementary Materials
Author Contributions
Funding
Institutional Review Board Statement
Informed Consent Statement
Data Availability Statement
Conflicts of Interest
Sample Availability
References
- Code of Federal Regulations (CFR). Tolerances for Residues of New Animal Drugs in Food. 2022. Available online: https://www.ecfr.gov/current/title-21/chapter-I/subchapter-E/part-556 (accessed on 15 November 2021).
- European Union (EU). Commission Regulation (EU) No 37/2010 of 22 December 2009. 2010. Available online: https://www.legislation.gov.uk/eur/2010/37 (accessed on 15 November 2021).
- The Japan Food Chemical Research Foundation (JFCRF). Maximum Residue Limits (MRLs) List of Agricultural Chemicals in Foods. 2021. Available online: https://www.ffcr.or.jp/en/zanryu/the-japanese-positive/the-japanese-positive-list-system-for-agricultural-chemical-residues-in-foods-enforcement-on-may-29-.html (accessed on 15 November 2021).
- GB 31650-2019; National Food Safety Standard-Maximum Residue Limits for Veterinary Drugs in Foods. Ministry of Agriculture and Rural Affairs of the People’s Republic of China (MARAPRC): Beijing, China, 2019.
- Qi, H.; Yan, H.; Zhang, L.; Zhang, Z.; Cui, F. Research progress in determination methods of antibiotics residues in plants. J. Food Saf. Qual. 2019, 10, 5098–5103. (In Chinese) [Google Scholar]
- Ahmed, M.B.M.; Rajapaksha, A.U.; Lim, J.E.; Vu, N.T.; Kim, S.; Kang, H.M.; Lee, S.S.; Ok, Y.S. Distribution and accumulative pattern of tetracyclines and sulfonamides in edible vegetables of cucumber, tomato and lettuce. J. Agric. Food Chem. 2015, 63, 398–405. [Google Scholar] [CrossRef] [PubMed]
- Boxall, A.B.A.; Johnson, P.; Smith, E.J.; Sinclair, C.J.; Stutt, E.; Levy, L.S. Uptake of veterinary medicines from soils into plants. J. Agric. Food Chem. 2006, 54, 2288–2297. [Google Scholar] [CrossRef] [PubMed]
- Hawker, D.W.; Cropp, R.; Boonsaner, M. Uptake of zwitterionic antibiotics by rice (Oryza sativa L.) in contaminated soil. J. Hazard. Mater. 2013, 263, 458–466. [Google Scholar] [CrossRef]
- Hu, X.; Zhou, Q.; Luo, Y. Occurrence and source analysis of typical veterinary antibiotics in manure, soil, vegetables and groundwater from organic vegetable bases, northern China. Environ. Pollut. 2010, 158, 2992–2998. [Google Scholar] [CrossRef]
- Jones-Lepp, T.L.; Sanchez, C.A.; Moy, T.; Kazemi, R. Method development and application to determine potential plant uptake of antibiotics and other drugs in irrigated crop production systems. J. Agric. Food Chem. 2010, 58, 11568–11573. [Google Scholar] [CrossRef]
- Tanoue, R.; Sato, Y.; Motoyama, M.; Nakagawa, S.; Shinohara, R.; Nomiyama, K. Plant uptake of pharmaceutical chemicals detected in recycled organic manure and reclaimed wastewater. J. Agric. Food Chem. 2012, 60, 10203–10211. [Google Scholar] [CrossRef]
- Tasho, R.P.; Cho, J.Y. Veterinary antibiotics in animal waste, its distribution in soil and uptake by plants: A review. Sci. Total Environ. 2016, 563–564, 366–376. [Google Scholar] [CrossRef]
- Wang, C.; Luo, Y.; Mao, D. Sources, fate, ecological risks and mitigation strategies of antibiotics in the soil environment. Environ. Chem. 2014, 33, 19–29. [Google Scholar]
- Zhang, M.; Xu, Q. Review on pollution and behavior of veterinary antibiotics in agricultural system. Acta Agric. Zhejiang 2013, 25, 416–424. (In Chinese) [Google Scholar]
- Bao, Y.; Li, Y.; Mo, C.; Yao, Y.; Tai, Y.; Wu, X.; Zhang, Y. Determination of six sulfonamide antibiotics in vegetables by solid phase extraction and high performance liquid chromatography. Environ. Chem. 2010, 29, 513–518. (In Chinese) [Google Scholar]
- Wu, X.; Xiang, L.; Mo, C.; Li, Y.; Jiang, Y.; Yan, Q.; Lv, X.; Huang, X. Determination of quinolones in vegetables using ultra performance liquid chromatography-electrospray ionization tandem mass spectrometry. Chin. J. Anal. Chem. 2013, 41, 876–881. (In Chinese) [Google Scholar] [CrossRef]
- Wu, X.; Bao, Y.; Xiang, L.; Yan, Q.; Jiang, Y.; Li, Y.; Huang, X.; Mo, C. Simultaneous sulfonamide antibiotics in vegetables using solid phase extraction and high performance liquid chromatography coupled with mass spectrometry. Environ. Chem. 2013, 32, 1038–1044. (In Chinese) [Google Scholar]
- Yao, Y.; Mo, C.; Li, Y.; Bao, Y.; Tai, Y.; Wu, X. Determination of tetracyclines in vegetables using solid phase extraction and HPLC with fluorescence detection. Environ. Chem. 2010, 29, 536–541. (In Chinese) [Google Scholar]
- Pan, M.; Wong, C.K.C.; Chu, L.M. Distribution of antibiotics in wastewater-irrigated soils and their accumulation in vegetable crops in the Pearl River Delta, Southern China. J. Agric. Food Chem. 2014, 62, 11062–11069. [Google Scholar] [CrossRef] [PubMed]
- Sallach, J.B.; Snow, D.; Hodges, L.; Li, X.; Bartelt-Hunt, S. Development and comparison of four methods for the extraction of antibiotics from a vegetative matrix. Environ. Toxicol. Chem. 2015, 35, 889–897. [Google Scholar] [CrossRef]
- Brack, W.; Dulio, V.; Slobodnik, J. The NORMAN network and its activities on emerging environmental substances with a focus on effect-directed analysis of complex environmental contamination. Environ. Sci. Eur. 2012, 24, 29–33. [Google Scholar] [CrossRef] [Green Version]
- Fu, Y.; Zhou, Z.; Kong, H.; Lu, X.; Zhao, X.; Chen, Y.; Chen, J.; Wu, Z.; Xu, Z.; Zhao, C.; et al. Nontargeted screening method for illegal additives based on ultrahigh-performance liquid chromatography-high-resolution mass spectrometry. Anal. Chem. 2016, 88, 8870–8877. [Google Scholar] [CrossRef]
- Hakme, E.; Lozano, A.; Gómez-Ramos, M.M.; Hernando, M.D.; Fernández-Alba, A.R. Non-target evaluation of contaminants in honey bees and pollen samples by gas chromatography time-of-flight mass spectrometry. Chemosphere 2017, 184, 1310–1319. [Google Scholar] [CrossRef]
- Kunzelmann, M.; Winter, M.; Aberg, M.; Hellenäs, K.E.; Rosén, J. Non-targeted analysis of unexpected food contaminants using LC-HRMS. Anal. Bioanal. Chem. 2018, 410, 5593–5602. [Google Scholar] [CrossRef] [Green Version]
- Shepherd, L.V.; Fraser, P.; Stewart, D. Metabolomics: A second-generation platform for crop and food analysis. Bioanalysis 2011, 3, 1143–1159. [Google Scholar] [CrossRef] [PubMed] [Green Version]
- Bueno, M.J.M.; Díaz-Galiano, F.J.; Rajski, L.; Cutillas, V.; Fernández-Alba, A.R. A non-targeted metabolomic approach to identify food markers to support discrimination between organic and conventional tomato crops. J. Chromatogr. A 2018, 1546, 66–76. [Google Scholar] [CrossRef] [PubMed]
- Johanningsmeier, S.D.; Harris, G.K.; Klevorn, C.M. Metabolomic technologies for improving the quality of food: Practice and promise. Annu. Rev. Food Sci. Technol. 2016, 7, 413–438. [Google Scholar] [CrossRef] [PubMed] [Green Version]
- Tengstrand, E.; Rosén, J.; Hellenäs, K.E.; Aberg, K.M. A concept study on non-targeted screening for chemical contaminants in food using liquid chromatography-mass spectrometry in combination with a metabolomics approach. Anal. Bioanal. Chem. 2013, 405, 1237–1243. [Google Scholar] [CrossRef] [Green Version]
- Delaporte, G.; Cladière, M.; Jouan-Rimbaud Bouveresse, D.; Camel, V. Untargeted food contaminant detection using UHPLC-HRMS combined with multivariate analysis: Feasibility study on tea. Food Chem. 2019, 277, 54–62. [Google Scholar] [CrossRef] [PubMed]
- Azanu, D.; Mortey, C.; Darko, G.; Weisser, J.J.; Styrishave, B.; Abaidoo, R.C. Uptake of antibiotics from irrigation water by plants. Chemosphere 2016, 157, 107–114. [Google Scholar] [CrossRef]
- Du, J.; Zhao, H.; Chen, J. Simultaneous determination of 23 antibiotics in mariculture water using solid-phase extraction and high performance liquid chromatography-tandem mass spectrometry. Chin. J. Chromatogr. 2015, 33, 348–353. (In Chinese) [Google Scholar] [CrossRef] [Green Version]
- Liu, S.; Du, J.; Chen, J.; Zhao, H. Determination of 19 antibiotic and 2 sulfonamide metabolite residues in wild fish muscle in mariculture areas of Laizhou Bay using accelerated solvent extraction and high performance liquid chromatography-tandem mass spectrometry. Chin. J. Chromatogr. 2014, 32, 1320–1325. (In Chinese) [Google Scholar] [CrossRef]
- Dunn, W.B.; Broadhurst, D.; Begley, P.; Zelena, E.; Francis-McIntyre, S.; Anderson, N.; Brown, M.; Knowles, J.D.; Halsall, A.; Haselden, J.N.; et al. Procedures for large-scale metabolic profiling of serum and plasma using gas chromatography and liquid chromatography coupled to mass spectrometry. Nat. Protoc. 2011, 6, 1060–1083. [Google Scholar] [CrossRef]
- Want, E.J.; Wilson, I.D.; Gika, H.; Theodoridis, G.; Plumb, R.S.; Shockcor, J.; Holmes, E.; Nicholson, J.K. Global metabolic profiling procedures for urine using UPLC-MS. Nat. Protoc. 2010, 5, 1005–1018. [Google Scholar] [CrossRef]
- Chambers, M.C.; MacLean, B.; Burke, R.; Amodei, D.; Ruderman, D.L.; Neumann, S.; Gatto, L.; Fischer, B.; Pratt, B.; Egertson, J.; et al. A cross-platform toolkit for mass spectrometry and proteomics. Nat. Biotechnol. 2012, 30, 918–920. [Google Scholar] [CrossRef] [PubMed]
- Giacomoni, F.; Le Corguille, G.; Monsoor, M.; Landi, M.; Pericard, P.; Petera, M.; Duperier, C.; Tremblay-Franco, M.; Martin, J.F.; Jacob, D.; et al. Workflow4Metabolomics: A collaborative research infrastructure for computational metabolomics. Bioinformatics 2015, 31, 1493–1495. [Google Scholar] [CrossRef] [PubMed] [Green Version]
- Smith, C.A.; Want, E.J.; O’Maille, G.; Abagyan, R.; Siuzdak, G. XCMS: Processing mass spectrometry data for metabolite profiling using nonlinear peak alignment, matching, and identification. Anal. Chem. 2006, 78, 779–787. [Google Scholar] [CrossRef] [PubMed]
- Gika, H.G.; Theodoridis, G.A.; Wilson, I.D. Liquid chromatography and ultra-performance liquid chromatography-mass spectrometry fingerprinting of human urine: Sample stability under different handling and storage conditions for metabonomics studies. J. Chromatogr. A 2008, 1189, 314–322. [Google Scholar] [CrossRef]
- Winnike, J.H.; Busby, M.G.; Watkins, P.B.; O’Connell, T.M. Effects of a prolonged standardized diet on normalizing the human metabolome. Am. J. Clin. Nutr. 2009, 90, 1496–1501. [Google Scholar] [CrossRef] [Green Version]
- Yin, P.; Peter, A.; Franken, H.; Zhao, X.; Neukamm, S.S.; Rosenbaum, L.; Lucio, M.; Zell, A.; Haring, H.U.; Xu, G.; et al. Preanalytical aspects and sample quality assessment in metabolomics studies of human blood. Clin. Chem. 2013, 59, 833–845. [Google Scholar] [CrossRef]
- Pontes, T.A.; Barbosa, A.D.; Silva, R.D.; Melo-Junior, M.R.; Silva, R.O. Osteopenia-osteoporosis discrimination in postmenopausal women by 1H NMR-based metabonomics. PLoS ONE 2019, 14, e0217348. [Google Scholar] [CrossRef] [Green Version]
- Schievano, E.; Morelato, E.; Facchin, C.; Mammi, S. Characterization of markers of botanical origin and other compounds extracted from unifloral honeys. J. Agric. Food Chem. 2013, 61, 1747–1755. [Google Scholar] [CrossRef]
- Zhao, W.; Wang, G.; Xun, W.; Yu, Y.; Ge, C.; Liao, G. Selection of water-soluble compounds by characteristic flavor in Chahua Chicken muscles based on metabolomics. Sci. Agric. Sin. 2020, 53, 1627–1642. (In Chinese) [Google Scholar]
- Dai, Y.; Lv, C.; He, L.; Yi, C.; Liu, X.; Huang, W.; Chen, J. Metabolic changes in the processing of Yunkang 10 sun-dried green tea based on metabolomics. Sci. Agric. Sin. 2020, 53, 357–370. (In Chinese) [Google Scholar]
- Inoue, K.; Tanada, C.; Sakamoto, T.; Tsutsui, H.; Akiba, T.; Min, J.Z.; Todoroki, K.; Yamano, Y.; Toyo’oka, T. Metabolomics approach of infant formula for the evaluation of contamination and degradation using hydrophilic interaction liquid chromatography coupled with mass spectrometry. Food Chem. 2015, 181, 318–324. [Google Scholar] [CrossRef] [PubMed]
- Yang, J.; Chen, T.; Sun, L.; Zhao, Z.; Wan, C. Potential metabolite markers of schizophrenia. Mol. Psychiatry 2013, 18, 67–78. [Google Scholar] [CrossRef] [PubMed] [Green Version]
- Gika, H.G.; Theodoridis, G.A.; Plumb, R.S.; Wilson, D. Current practice of liquid chromatography-mass spectrometry in metabolomics and metabonomics. J. Pharm. Biomed. Anal. 2014, 87, 12–25. [Google Scholar] [CrossRef]
- Rubert, J.; Righetti, L.; Stranska-Zachariasova, M.; Dzuman, Z.; Chrpova, J.; Dall’Asta, C.; Hajslova, J. Untargeted metabolomics based on ultra-high-performance liquid chromatography-high-resolution mass spectrometry merged with chemometrics: A new predictable tool for an early detection of mycotoxins. Food Chem. 2017, 224, 423–431. [Google Scholar] [CrossRef] [PubMed]
- Thévenot, E.A.; Roux, A.; Xu, Y.; Ezan, E.; Junot, C. Analysis of the human adult urinary metabolome variations with age, body mass index, and gender by implementing a comprehensive workflow for univariate and OPLS statistical analyses. J. Proteome Res. 2015, 14, 3322–3335. [Google Scholar] [CrossRef]
- Chen, Q.; Dai, W.; Lin, Z.; Xie, D.; Lv, M.; Lin, Z. Effects of shading on main quality components in tea (Camellia Sinensis (L) O. Kuntze) leaves based on metabolomics analysis. Scientia Agricultura Sinica 2019, 52, 1066–1077. (In Chinese) [Google Scholar]
- Taguchi, Y.H. Principal component analysis based unsupervised feature extraction applied to budding yeast temporally periodic gene expression. BioData Min. 2016, 9, 22. [Google Scholar] [CrossRef] [Green Version]
- Broadhurst, D.I.; Kella, D.B. Statistical strategies for avoiding false discoveries in metabolomics and related experiments. Metabolomics 2006, 2, 171–196. [Google Scholar] [CrossRef] [Green Version]
- Slupsky, C.M.; Steed, H.; Wells, T.H.; Dabbs, K.; Schepansky, A.; Capstick, V.; Faught, W.; Sawyer, M.B. Urine metabolite analysis offers potential early diagnosis of ovarian and breast cancers. Clin. Cancer Res. 2010, 16, 5835–5841. [Google Scholar] [CrossRef] [Green Version]
- Ortmayr, K.; Charwat, V.; Kasper, C.; Hann, S.; Koellensperger, G. Uncertainty budgeting in fold change determination and implications for non-targeted metabolomics studies in model systems. Analyst 2017, 142, 80–90. [Google Scholar] [CrossRef]
- Environmental Protection Agency (EPA). Method 8061A Phthalate Esters by Gas Chromatography with Electron Capture detection (GC/ECD). 1996. Available online: https://www.epa.gov/hw-sw846/sw-846-test-method-8061a-phthalate-esters-gas-chromatography-electron-capture-detection (accessed on 15 November 2021).
- Li, Y.; Wu, X.; Mo, C.; Tai, Y.; Huang, X.; Xiang, L. Investigation of sulfonamide, tetracycline, and quinolone antibiotics in vegetable farmland soil in the Pearl River delta area, Southern China. J. Agric. Food Chem. 2011, 59, 7268–7276. [Google Scholar] [CrossRef] [PubMed]
- Goldstein, M.; Shenker, M.; Chefetz, B. Insights into the uptake processes of wastewater-borne pharmaceuticals by vegetables. Environ. Sci. Technol. 2014, 48, 5593–5600. [Google Scholar] [CrossRef]
- Kang, D.H.; Gupta, S.; Rosen, C.; Fritz, V.; Singh, A.; Chander, Y.; Murray, H.; Rohwer, C. Antibiotic uptake by vegetable crops from manure-applied soils. J. Agric. Food Chem. 2013, 61, 9992–10001. [Google Scholar] [CrossRef] [PubMed]
- Malchi, T.; Maor, Y.; Tadmor, G.; Shenker, M.; Chefetz, B. Irrigation of root vegetables with treated wastewater: Evaluating uptake of pharmaceuticals and the associated human health risks. Environ. Sci. Technol. 2014, 48, 9325–9333. [Google Scholar] [CrossRef] [PubMed]
- Miller, E.L.; Nason, S.L.; Karthikeyan, K.G.; Pedersen, J.A. Root uptake of pharmaceuticals and personal care product ingredients. Environ. Sci. Technol. 2016, 50, 525–541. [Google Scholar] [CrossRef] [PubMed]
- Sabourin, L.; Duenk, P.; Bonte-Gelok, S.; Payne, M.; Lapen, D.R.; Topp, E. Uptake of pharmaceuticals, hormones and parabens into vegetables grown in soil fertilized with municipal biosolids. Sci. Total Environ. 2012, 431, 233–236. [Google Scholar] [CrossRef] [PubMed]
- Wu, X.; Ernst, F.; Conkle, J.L.; Gan, J. Comparative uptake and translocation of pharmaceutical and personal care products (PPCPs) by common vegetables. Environ. Int. 2013, 60, 15–22. [Google Scholar] [CrossRef] [PubMed]
- Wu, X.; Conkle, J.L.; Ernst, F.; Gan, J. Treated wastewater irrigation: Uptake of pharmaceutical and personal care products by common vegetables under field conditions. Environ. Sci. Technol. 2014, 48, 11286–11293. [Google Scholar] [CrossRef]
- Wu, X.; Dodgen, L.K.; Conkle, J.L.; Gan, J. Plant uptake of pharmaceutical and personal care products from recycled water and biosolids: A review. Sci. Total Environ. 2015, 536, 655–666. [Google Scholar] [CrossRef]
- Berrada, H.; Molto, J.C.; Manes, J.; Font, G. Determination of aminoglycoside and macrolide antibiotics in meat by pressurized liquid extraction and LC-ESI-MS. J. Sep. Sci. 2015, 33, 522–529. [Google Scholar] [CrossRef]
- Chung, S.W.C.; Lam, C. Development of a 15-class multiresidue method for analyzing 78 hydrophilic and hydrophobic veterinary drugs in milk, egg and meat by liquid chromatography-tandem mass spectrometry. Anal. Methods 2015, 7, 6764–6776. [Google Scholar] [CrossRef]
- Desmarchelier, A.; Fan, K.; Minh Tien, M.; Savoy, M.C.; Tarres, A.; Fuger, D.; Goyon, A.; Bessaire, T.; Mottier, P. Determination of 105 antibiotic, anti-inflammatory, antiparasitic agents and tranquilizers by LC-MS/MS based on an acidic QuEChERS-like extraction. Food Add. Contam. A 2018, 35, 646–660. [Google Scholar] [CrossRef] [PubMed]
- Schneider, M.J.; Lehotay, S.J.; Lightfield, A.R. Evaluation of a multi-class, multi-residue liquid chromatography-tandem mass spectrometry method for analysis of 120 veterinary drugs in bovine kidney. Drug Test. Anal. 2012, 4, 91–102. [Google Scholar] [CrossRef] [PubMed]
- Zhang, N.; Fan, S.; Xue, Y.; Liu, P.; Liu, W.; Wu, G.; Zhao, R. Rapid detection of 8 veterinary drug residues in chicken by QuEChERS-ultra performance liquid chromatography tandem mass spectrometry. J. Hyg. Res. 2017, 46, 89–93. (In Chinese) [Google Scholar]


| No. | Compound | CAS No. | Category | Adduct | Parent Ion (m/z) | Retention Time (min) |
|---|---|---|---|---|---|---|
| 1 | Clorprenaline | 3811-25-4 | Agonist | M + H | 214.09932 | 7.03 |
| 2 | Terbutaline | 23031-25-6 | 226.14377 | 2.65 | ||
| 3 | Tolobuterol | 41570-61-0 | 228.11496 | 8.23 | ||
| 4 | Cimbuterol | 54239-39-3 | 234.16009 | 4.47 | ||
| 5 | Propranolol | 5051-22-9 | 260.16451 | 9.53 | ||
| 6 | Sotalol | 959-24-0 | 273.12674 | 2.47 | ||
| 7 | Nadolol | 42200-33-9 | 310.20128 | 6.47 | ||
| 8 | 5-Chloro-1-methyl-4-nitroimidazole | 4897-25-0 | Nitroimidazoles | M + H | 162.00649 | 4.43 |
| 9 | Ipronidazole | 14885-29-1 | 170.09241 | 7.79 | ||
| 10 | Metronidazole | 443-48-1 | 172.07167 | 2.58 | ||
| 11 | Metronidazole-hydroxy | 4812-40-2 | 188.06658 | 1.69 | ||
| 12 | Ronidazole | 7681-76-7 | 201.06183 | 2.96 | ||
| 13 | Thiabendazole | 148-79-8 | 202.04334 | 5.83 | ||
| 14 | Ornidazole | 16773-42-5 | 220.04835 | 6.41 | ||
| 15 | Tinidazole | 19387-91-8 | 248.06996 | 4.96 | ||
| 16 | Albendazole | 54965-21-8 | 266.09577 | 10.48 | ||
| 17 | Fenbendazole | 43210-67-9 | 300.08012 | 11.06 | ||
| 18 | Oxolinic acid | 14698-29-4 | Quinolones | M + H | 262.07100 | 9.16 |
| 19 | Cinoxacin | 28657-80-9 | 263.06625 | 8.69 | ||
| 20 | Norfloxacin | 70458-96-7 | 320.14051 | 6.50 | ||
| 21 | Enoxacin | 74011-58-8 | 321.13575 | 6.35 | ||
| 22 | Ciprofloxacin | 85721-33-1 | 332.14052 | 6.73 | ||
| 23 | Lomefloxacin | 98079-51-7 | 352.14672 | 7.12 | ||
| 24 | Danofloxacin | 112398-08-0 | 358.15615 | 7.00 | ||
| 25 | Enrofloxacin | 93106-60-6 | 360.17183 | 7.00 | ||
| 26 | Ofloxacin | 82419-36-1 | 362.15106 | 6.39 | ||
| 27 | Marbofloxacin | 11550-35-1 | 363.14631 | 5.93 | ||
| 28 | Sparfloxacin | 110871-86-8 | 393.17327 | 8.34 | ||
| 29 | Difloxacin | 98106-17-3 | 400.14672 | 7.42 | ||
| 30 | Trenbolone | 10161-33-8 | Steroid | M + H | 271.16926 | 10.98 |
| 31 | Boldenone | 846-48-0 | 287.20056 | 11.02 | ||
| 32 | Testosterone propionate | 57-85-2 | 345.24242 | 12.30 | ||
| 33 | Deflazacort | 14484-47-0 | 442.22241 | 11.06 | ||
| 34 | Tetracycline | 60-54-8 | Tetracyclines | M + H | 445.13444 | 6.56 |
| 35 | Oxytetracycline | 79-57-2 | 461.13391 | 6.41 | ||
| 36 | Chlorotetracycline | 57-62-5 | 479.38028 | 7.88 | ||
| 37 | Sulphacetamide | 144-80-9 | Sulfonamides | M + H | 215.04849 | 1.99 |
| 38 | Sulfapyridine | 144-83-2 | 250.06447 | 4.68 | ||
| 39 | Sulfadiazine | 68-35-9 | 251.05972 | 3.37 | ||
| 40 | Sulfathiazole | 72-14-0 | 256.02089 | 4.32 | ||
| 41 | Sulfamerazine | 127-79-7 | 265.07537 | 5.11 | ||
| 42 | Sulfamoxole | 729-99-7 | 268.07504 | 6.10 | ||
| 43 | Sulfamethizole | 144-82-1 | 271.03179 | 6.11 | ||
| 44 | Sulfabenzamide | 127-71-9 | 277.06414 | 8.05 | ||
| 45 | Sulfmethazine | 57-68-1 | 279.09102 | 3.76 | ||
| 46 | Sulfisomidine | 515-64-0 | 279.09102 | 6.24 | ||
| 47 | Sulfachloropyridazine | 80-32-0 | 285.02075 | 6.80 | ||
| 48 | Trimethoprim | 738-70-5 | 291.14517 | 6.01 | ||
| 49 | Sulfaquinoxaline | 59-40-5 | 301.07537 | 9.26 | ||
| 50 | Sulfanitran | 122-16-7 | 336.06486 | 10.08 |
| Var ID (Primary) | Marker Compounds | VIP Pred a | Coordinate in S-Plot b | Mass Error (ppm) c | LOD (µg kg−1) |
|---|---|---|---|---|---|
| M214T418 | Clorprenaline | 3.300/3.057 | (−0.077, −0.911)/(0.057, 0.934) | −0.225 | 1.3 |
| M226T148 | Terbutaline | 2.297/2.467 | (−0.049, −0.969)/(0.049, 0.945) | −1.751 | 2.0 |
| M228T491 | Tolobuterol | 4.045/3.311 | (−0.098, −0.922)/(0.063, 0.929) | −0.294 | 0.6 |
| M234T261 | Cimbuterol | 3.226/4.071 | (−0.075, −0.934)/(0.082, 0.965) | −2.061 | 1.1 |
| M260T571 | Propranolol | 3.710/4.505 | (−0.089, −0.927)/(0.099, 0.945) | 0.617 | 0.5 |
| M273T138 | Sotalol | 1.513/1.453 | (−0.025, −0.923)/(0.025, 0.916) | 0.563 | 0.7 |
| M310T388 | Nadolol | 4.165/2.141 | (−0.101, −0.981)/(0.038, 0.933) | −2.351 | 0.7 |
| M162T266 | 5-Chloro-1-methyl-4-nitroimidazole | 1.854/1.675 | (−0.038, −0.971)/(0.032, 0.948) | −0.394 | 0.6 |
| M170T467 | Ipronidazole | 4.537/4.102 | (−0.111, −0.921)/(0.087, 0.927) | 2.920 | 0.4 |
| M172T152 | Metronidazole | 2.838/2.675 | (−0.064, −0.928)/(0.052, 0.967) | 2.916 | 1.7 |
| M188T101 | Metronidazole-hydroxy | 2.178/2.756 | (−0.046, −0.964)/(0.053, 0.956) | −0.353 | 1.7 |
| M201T179 | Ronidazole | 1.957/1.673 | (−0.040, −0.961)/(0.032, 0.907) | −1.134 | 2.0 |
| M202T351 | Thiabendazole | 3.879/4.056 | (−0.093, −0.946)/(0.078, 0.986) | −1.654 | 0.9 |
| M220T383 | Ornidazole | 3.627/1.928 | (−0.087, −0.932)/(0.035, 0.914) | −1.476 | 1.4 |
| M248T298 | Tinidazole | 2.977/3.588 | (−0.069, −0.938)/(0.070, 0.952) | −2.146 | 0.4 |
| M266T625 | Albendazole | 4.193/3.237 | (−0.102, −0.918)/(0.060, 0.911) | 0.143 | 1.7 |
| M300T661 | Fenbendazole | 3.050/2.891 | (−0.071, −0.946)/(0.054, 0.961) | −0.272 | 1.1 |
| M262T553 | Oxolinic acid | 2.091/2.258 | (−0.044, −0.932)/(0.040, 0.955) | 4.435 | 0.5 |
| M263T524 | Cinoxacin | 2.481/2.115 | (−0.055, −0.986)/(0.037, 0.973) | 2.106 | 0.7 |
| M320T375 | Norfloxacin | 2.684/2.113 | (−0.059, −0.966)/(0.037, 0.949) | 0.600 | 0.6 |
| M321T381 | Enoxacin | 2.479/3.480 | (−0.055, −0.937)/(0.067, 0.924) | 1.102 | 0.7 |
| M332T406 | Ciprofloxacin | 3.110/3.589 | (−0.072, −0.934)/(0.070, 0.948) | 4.829 | 1.0 |
| M352T427 | Lomefloxacin | 3.052/2.676 | (−0.071, −0.928)/(0.052, 0.933) | 1.175 | 1.6 |
| M358T420 | Danofloxacin | 2.842/2.469 | (−0.065, −0.929)/(0.049, 0.937) | 2.019 | 1.8 |
| M360T422 | Enrofloxacin | 2.836/2.397 | (−0.064, −0.957)/(0.045, 0.959) | 0.770 | 1.9 |
| M362T386 | Ofloxacin | 1.553/1.672 | (−0.028, −0.925)/(0.031, 0.966) | 0.908 | 0.8 |
| M363T386 | Marbofloxacin | 1.617/1.678 | (−0.030, −0.923)/(0.032, 0.929) | −4.510 | 0.6 |
| M393T500 | Sparfloxacin | 1.827/2.946 | (−0.036, −0.911)/(0.056, 0.945) | −3.455 | 0.8 |
| M400T446 | Difloxacin | 1.535/2.317 | (−0.028, −0.937)/(0.042, 0.949) | −2.715 | 0.8 |
| M271T659 | Trenbolone | 3.077/1.586 | (−0.071, −0.947)/(0.029, 0.945) | 1.869 | 0.7 |
| M287T661 | Boldenone | 2.071/2.398 | (−0.043, −0.944)/(0.045, 0.936) | −0.921 | 0.8 |
| M345T738 | Testosterone propionate | 2.698/1.676 | (−0.061, −0.928)/(0.032, 0.927) | 0.122 | 0.8 |
| M442T663 | Deflazacort | 1.535/1.545 | (−0.026, −0.977)/(0.027, 0.919) | −4.677 | 1.0 |
| M445T393 | Tetracycline | 4.047/4.059 | (−0.098, −0.911)/(0.079, 0.941) | −0.539 | 1.0 |
| M461T385 | Oxytetracycline | 2.708/2.677 | (−0.061, −0.928)/(0.052, 0.934) | 1.062 | 0.5 |
| M479T473 | Chlorotetracycline | 2.180/2.392 | (−0.046, −0.945)/(0.044, 0.928) | 1.502 | 0.5 |
| M215T120 | Sulphacetamide | 1.615/1.468 | (−0.030, −0.915)/(0.026, 0.933) | 4.277 | 0.7 |
| M250T278 | Sulfapyridine | 3.108/4.087 | (−0.072, −0.956)/(0.085, 0.927) | −0.686 | 0.7 |
| M251T200 | Sulfadiazine | 2.075/1.893 | (−0.043, −0.912)/(0.034, 0.921) | 0.422 | 0.7 |
| M256T260 | Sulfathiazole | 3.880/2.893 | (−0.093, −0.945)/(0.054, 0.948) | 0.280 | 0.9 |
| M265T304 | Sulfamerazine | 2.415/3.483 | (−0.053, −0.987)/(0.067, 0.987) | −2.799 | 0.4 |
| M268T345 | Sulfamoxole | 3.301/3.312 | (−0.077, −0.922)/(0.063, 0.909) | 0.002 | 1.1 |
| M271T366 | Sulfamethizole | 2.704/1.412 | (−0.061, −0.956)/(0.023, 0.919) | −2.372 | 1.8 |
| M277T482 | Sulfabenzamide | 1.883/2.417 | (−0.038, −0.944)/(0.046, 0.951) | 2.561 | 0.6 |
| M279T222 | Sulfmethazine | 4.119/3.117 | (−0.100, −0.927)/(0.058, 0.978) | −4.681 | 1.3 |
| M279T374 | Sulfisomidine | 2.711/3.661 | (−0.061, −0.946)/(0.072, 0.923) | −3.077 | 0.5 |
| M285T407 | Sulfachloropyridazine | 1.639/1.569 | (−0.031, −0.982)/(0.028, 0.958) | −2.350 | 0.5 |
| M291T360 | Trimethoprim | 1.952/1.585 | (−0.040, −0.945)/(0.029, 0.928) | 0.465 | 0.6 |
| M301T557 | Sulfaquinoxaline | 1.829/2.115 | (−0.036, −0.934)/(0.037, 0.922) | −0.561 | 0.4 |
| M336T672 | Sulfanitran | 1.535/1.568 | (−0.027, −0.928)/(0.028, 0.927) | 2.996 | 1.6 |
Publisher’s Note: MDPI stays neutral with regard to jurisdictional claims in published maps and institutional affiliations. |
© 2022 by the authors. Licensee MDPI, Basel, Switzerland. This article is an open access article distributed under the terms and conditions of the Creative Commons Attribution (CC BY) license (https://creativecommons.org/licenses/by/4.0/).
Share and Cite
Xue, W.; Yang, C.; Liu, M.; Lin, X.; Wang, M.; Wang, X. Metabolomics Approach on Non-Targeted Screening of 50 PPCPs in Lettuce and Maize. Molecules 2022, 27, 4711. https://doi.org/10.3390/molecules27154711
Xue W, Yang C, Liu M, Lin X, Wang M, Wang X. Metabolomics Approach on Non-Targeted Screening of 50 PPCPs in Lettuce and Maize. Molecules. 2022; 27(15):4711. https://doi.org/10.3390/molecules27154711
Chicago/Turabian StyleXue, Weifeng, Chunguang Yang, Mengyao Liu, Xiaomei Lin, Mei Wang, and Xiaowen Wang. 2022. "Metabolomics Approach on Non-Targeted Screening of 50 PPCPs in Lettuce and Maize" Molecules 27, no. 15: 4711. https://doi.org/10.3390/molecules27154711
APA StyleXue, W., Yang, C., Liu, M., Lin, X., Wang, M., & Wang, X. (2022). Metabolomics Approach on Non-Targeted Screening of 50 PPCPs in Lettuce and Maize. Molecules, 27(15), 4711. https://doi.org/10.3390/molecules27154711