
Protein–Ligand Docking in the Machine-Learning Era


Abstract
:1. Introduction
2. Protein–Ligand Scoring Functions
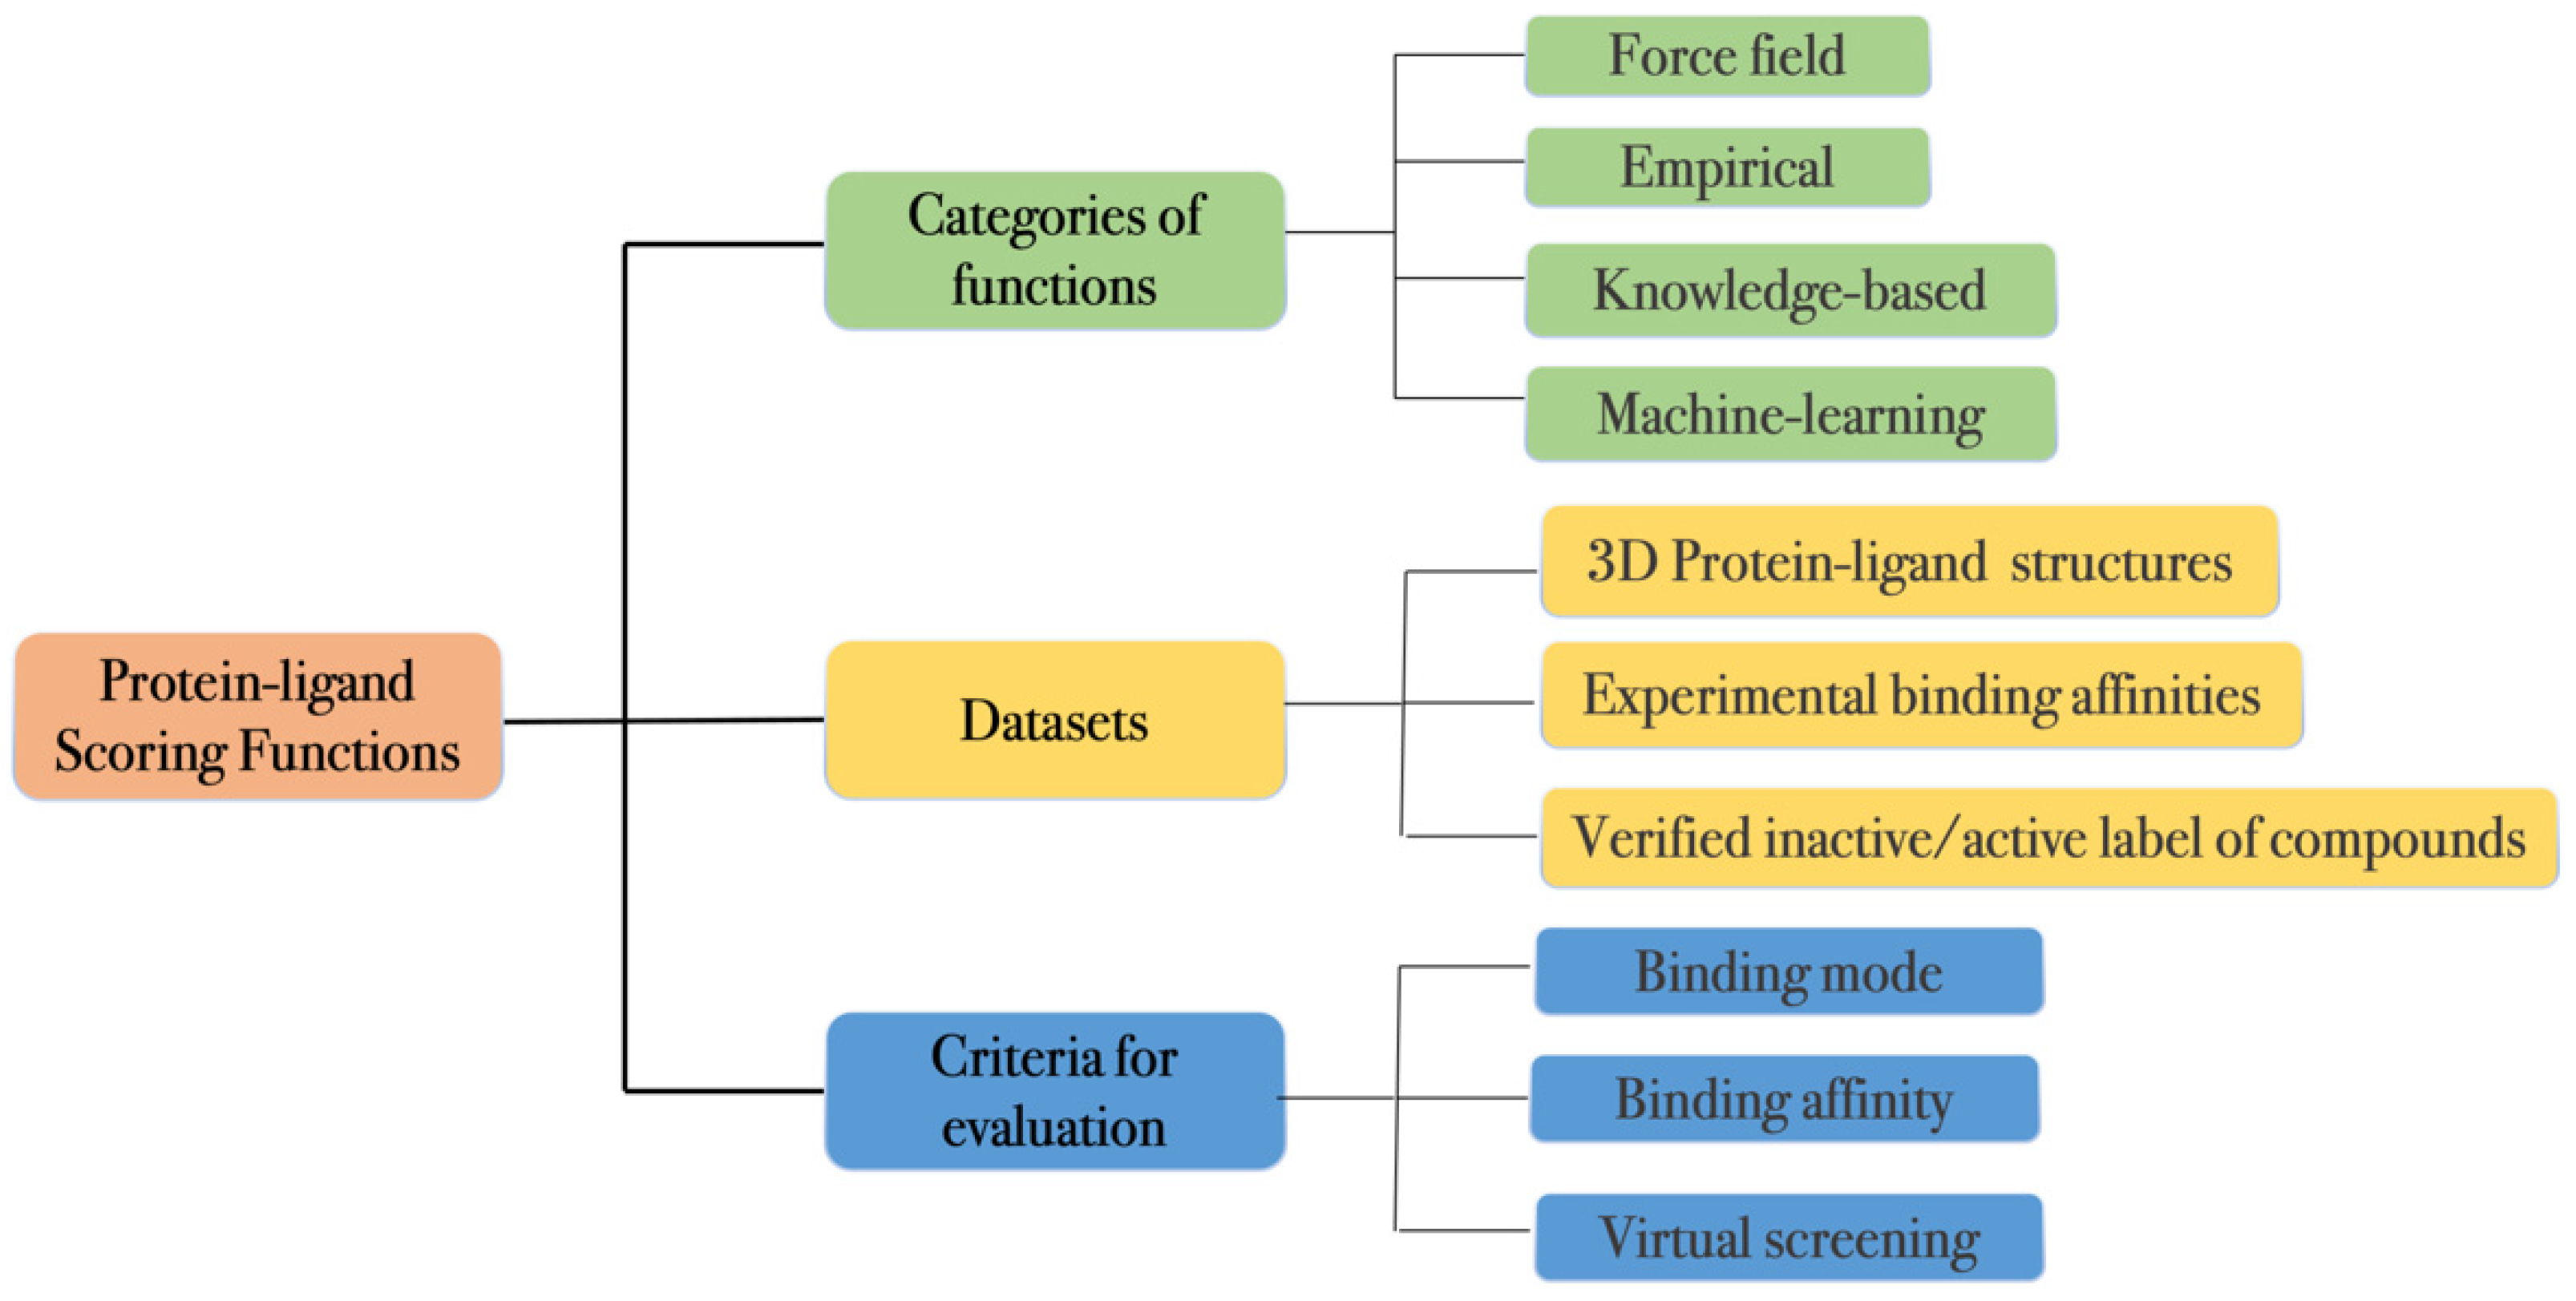
2.1. Classification
- (1)
- Physics-based scoring functions are centered on molecular mechanical calculations [20,21,36]. These scoring functions are often predicated on fundamental molecular physics terms such as Van der Waals interactions (Lennard-Jones potential), electrostatic interactions (coulombic potential) and desolvation energies. These terms can be derived from both experimental data and ab initio quantum mechanical calculations. Due to the computational cost, solvation and entropy terms are usually oversimplified or ignored in physics-based scoring functions. Programs such as GoldScore, DOCK and early versions of AutoDock use this type of scoring function [20,21,36].
- (2)
- Knowledge-based scoring functions consist of statistical potentials derived from experimentally determined protein–ligand structures. The frequency of specific interactions from many protein–ligand complexes are used to generate these potentials via the inverse Boltzmann distribution. This approach approximates complicated and difficult-to-characterize physical interactions using large numbers of the protein–ligand atom-pairwise terms. As a result, the scoring function lacks an immediate physical interpretation. DrugScore, ITScore and PMF are examples of knowledge-based scoring function [37,38,39,40].
- (3)
- Empirical scoring functions characterize the binding affinity of protein–ligand complexes based on a set of weighted scoring terms. These scoring terms may include descriptors for VDW, electrostatics, hydrogen bond, hydrophobic, desolvation, entropy, etc. The corresponding weights of the descriptors are determined by fitting experimental binding affinity data of protein–ligand complexes via linear regression. Empirical scoring functions draw from both physics-based and knowledge-based scoring functions. Empirical scoring functions use physically meaningful terms similarly to physics-based scoring functions. The contribution (weight) of each term is learned from the training data, similarly to knowledge-based scoring functions. Compared to knowledge-based scoring functions, empirical scoring functions are less prone to overfitting due to the constraints imposed by the physical terms. The scoring terms also provide insight into the individual contributions to the final binding affinity. Bohm pioneered the first empirical scoring function, LUDI, in 1994 [41,42]. Other famous empirical scoring functions, such as ChemScore, GlideScore, X-Score and Autodock Vina, were developed afterwards [21,22,23,43,44]. Autodock Vina is one of the widely used open-source docking programs, and its scoring function consists of five empirical interaction terms (two gaussian terms, a repulsion term, a hydrogen bond term, and a hydrophobic term) and a ligand torsion count term [43]. Recently, a linear empirical scoring function inspired from Vina scoring function, Lin_F9, was developed to improve the scoring performance and overcome some of the limitations of Vina by introducing new empirical terms, such as the mid-range interactions and metal–ligand interactions. Trained on a small but high-quality protein–ligand dataset, Lin_F9 achieved better scoring accuracy than Vina in binding affinity prediction [45].
- (4)
- Machine learning (ML) scoring functions are a group of methods that use ML techniques to learn the functional form of the binding affinity by associating patterns in the training data. Without employing a predetermined functional form, ML scoring functions can implicitly capture intermolecular interactions that are hard to model explicitly. ML scoring functions have shown marked improvements in binding affinity prediction in recent years [46,47]. In Section 3, we will discuss ML scoring functions in detail.
2.2. Datasets
- (1)
- Datasets that consist of 3D protein–ligand structures with experimentally measured binding affinities are typically used to evaluate methods in binding pose identification and binding affinity prediction [53,54,55]. One example, PDBbind, provides 3D protein–ligand structures with experimentally measured binding affinity data manually collected from their original references. PDBbind is currently one of the largest datasets of protein–ligand structures for the development and validation of docking methodologies and scoring functions. The current release (version 2020) of PDBbind general set contains 19,443 protein–ligand complexes with binding affinity data (Kd, Ki or IC50) ranging from 1.2 pM to 10 mM, and is annually updated to keep up with the growth of Protein Data Bank (PDB) [56,57]. PDBbind also contains a refined subset of high-quality data according to several criteria concerning the quality of the structures and the affinity data. In addition, PDBbind provides a benchmarking “core set” used for the comparative assessment of scoring functions (CASF) [33,34], which will be discussed in Section 2.3 in detail. Similar datasets, such as the Community Structure-Activity Resource (CSAR) [58,59,60,61,62,63] exercises and the D3R Grand Challenge [64,65,66,67], are mainly curated to validate SBDD.
- (2)
- Datasets that label active/inactive compounds to protein structure or sequence targets are generally used to develop and evaluate methods in VS tasks, such as early hit enrichment and active/inactive classification [68]. The Database of Useful Decoys (DUD) [69] and Database of Useful Decoys-Enhanced (DUD-E) [70] have been widely used for benchmarking. DUD-E consists of 102 targets with 22,886 active compounds with binding affinities. For each active compound, DUD-E also includes 50 computer-generated decoy compounds, which have similar physiochemical properties but dissimilar two-dimensional topology to the active compound. Many decoys are presumed, without experimental verification, to be inactive compounds. This remains a major drawback for DUD-E dataset because false negative samples might exist in the dataset.
- (3)
- Other datasets contain a large variety of compounds with binding affinity data but contain few or lack annotated protein–ligand structures, such as the Binding Database (BindingDB) and ChEMBL. These are used in developing ligand-based or sequence-based approaches to predict binding affinities and can supplement protein–ligand scoring function development and validation [75,76,77,78,79,80,81,82]. As of 4 May 2022, BindingDB contains 2,513,948 binding data for 8839 protein targets and 1,077,922 small molecules. ChEMBL is a manually curated database of bioactive molecules with drug-like properties. The current release (version 30) contains 19,286,751 activities for 14,885 targets and 2,157,379 compounds.
2.3. Evaluation Metrics
- (1)
- The goal of binding pose identification is to determine the native binding pose among computer-generated decoys. Given a set of decoys, a reliable scoring function should be able to rank the native binding pose to the top by their binding scores. The root-mean-square deviation (RMSD) between the top docking pose and the experimentally determined ligand pose is a commonly used evaluation metric. If the RMSD is ≤2 Å, the binding pose prediction is considered successful. Due to its simplicity and ease of implementation, the RMSD metric for binding pose prediction has been widely used in the field [33,34,64,65,66,67,83]. It should be noted that the minimum symmetry-corrected RMSD should be calculated for small molecules with symmetric functional groups or whole-molecule symmetry [84,85,86,87].
- (2)
- Binding affinity prediction aims to predict the binding affinity for a given protein–ligand complex. Nevertheless, some scoring functions give a score that cannot be directly compared to experimental binding data [20,88]. Thus, a widely used criterion for affinity prediction is the Pearson correlation coefficient between the predicted scores and the experimental binding data on benchmark test sets [33,34]. Since the correlation between the predicted scores and experimental binding data does not have to be linear, an alternative criterion is the Spearman ranking correlation coefficient. This first ranks the predicted and experimental scores and then calculates the correlation between the two ranking sets [89].
- (3)
- VS aims to identify true actives in a compound library. The screening performance typically estimates whether a scoring function is able to rank the known binders above many inactive compounds in the library. There are several evaluation metrics, including enrichment factor (EF), area under the curve (AUC), and receiver operating characteristics (ROC) curve, to quantify the screening performance of a scoring function [90]. EF is defined as the accumulated rate of true binders found above a certain percentile of the ranked database that includes both the actives and inactives. A higher EF at a fixed percentage of ranked database indicates better early hit enrichment (a higher likelihood to select actives based on predicted scores). EF is computed as follows:where is the number of true binders among top α percentile of ranked candidates (e.g., α = 1%, 5%, 10%) based on predicted binding scores and is the total number of true binders in the database. AUC-ROC is an evaluation method for classifiers assessing true binder identification. ROC plots the false positive rates (FPR, also called specificity) and true positive rates (TPR, also called recall or sensitivity) into a curve whose area under the curve (AUC) ranges from 0 to 1, where 0.5 reflects a random-level selection and 1 for perfect selection. This method is more appropriate when the number of inactive compounds is comparable to the number of active compounds.
3. Machine-Learning Scoring Function
4. Structure-Based Virtual Screening
- (1)
- There have been developments in structure-based VS approaches, including improvements in sampling and scoring methods, that have resulted in significant improvements in docking, scoring and screening performances [46].
- (2)
- Developments in GPU processing speeds and cloud computing have dramatically increased computational power. Researchers are now able to computationally process vast numbers of compounds in the drug-like chemical space.
- (3)
- (4)
- The number of compounds that are commercially available or can be readily synthesized has grown dramatically in recent years. For example, as of March 2021, the WuXi GalaXi and Enamine REAL Space collections contain 2.1 billion and 17 billion compounds, respectively [129]. In June 2022, the WuXi GalaXI and Enamine REAL Space collections have grown up to 4.4 billion and 22.7 billion compounds, respectively.
4.1. Molecular Docking Protocol
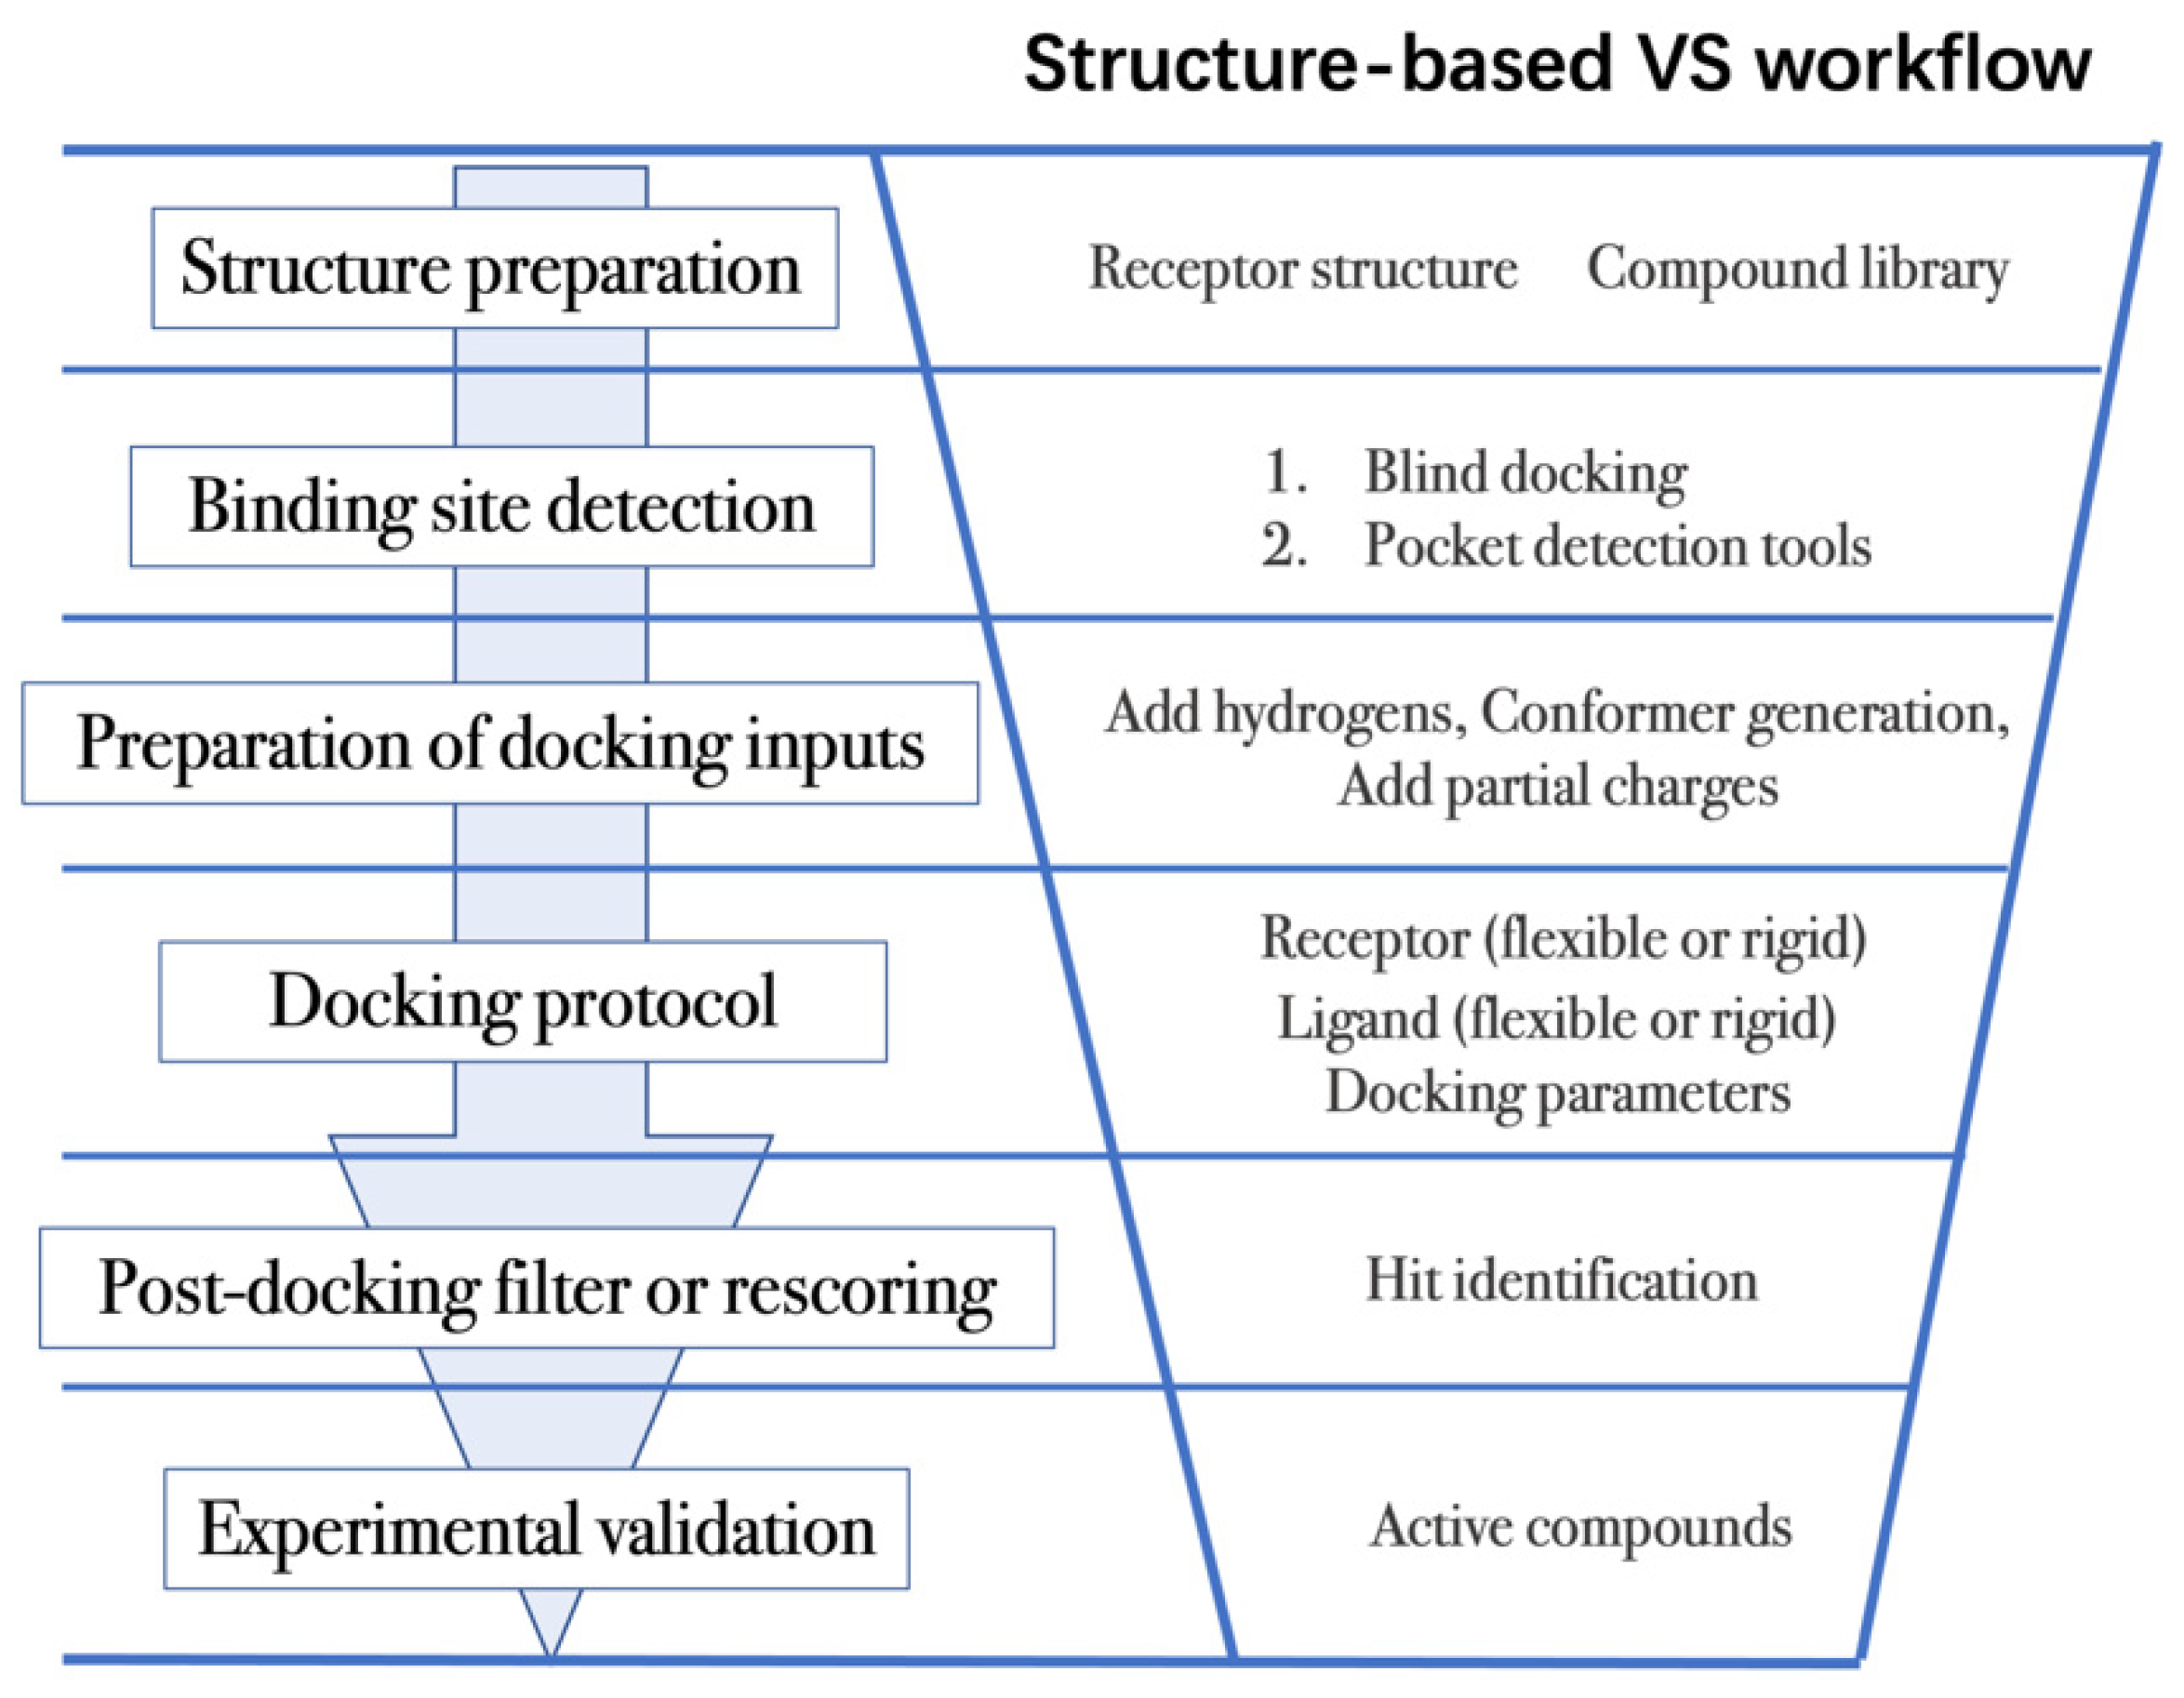
4.2. Workflow in Virtual Screening
- (1)
- The first step is to obtain the 3D structures of a given target as well as the compound library. Experimental determined structures can be readily retrieved from the Protein Data Bank (PDB) [146], in which more than 120,000 unique protein structures have been determined through an enormous experimental effort. However, this represents a small fraction of the billions of known protein sequences whereby the 3D structure of a novel target is usually not available. In order to overcome this limitation, traditional computational prediction methods (such as homolog modelling and ab initio modelling) [147,148], as well as the recently developed DL methods (such as AlphaFold2 and RoseTTAFold) [95,127] can be employed to obtain the 3D structures of target proteins. In addition, the compound library or chemical space used in VS is also vital for hit identification.
- (2)
- The next step is to detect the binding site. Typically, the binding pocket on which to focus the docking calculations is known. For example, the binding site is chosen based on the information of co-crystallized ligand/substrate binding site, such as ATP binding site or protein–protein interactions (PPI) interface. However, when the binding site information is missing or a novel binding pocket needs to be explored, there are two commonly employed approaches, “blind docking” simulation [160,161] and pocket prediction algorithms. The first approach uses docking methods to search over the entire target structure to find a favorable ligand binding site, but it has a high computational cost in sampling. For the second approach, several available software can be employed to detect binding pockets, including AlphaSpace [162,163], FTMap [164], MDpocket [165], Fpocket [166], SiteMap [167] etc. These methods detect concave pockets on the protein surface by characterizing the spatial composition of amino acids or using the chemical probe to find favorable hot spots. Since drug resistance can arise for the orthosteric site of target proteins, these methods can be used to identify additional binding pockets that can be exploited for the design of novel inhibitors, such as allosteric or cryptic pockets [168,169].
- (3)
- Once the binding site is determined it is important to carefully prepare docking input files to achieve successful VS. The preparation of protein structures starts from the assignment of protonation states for the amino acids, which can be done using software including PROPKA [170], H++ [171], and SPORES [172]. Then hydrogen atoms and partial charges are assigned. A popular software for this task is PDB2PQR [173,174]. In addition, the consideration of water molecules and metal ions can be crucial in certain target structures. Explicit water molecules mediating protein–ligand interactions should be analyzed and can be used to identify water-mediated interactions and avoid incorrect binding poses [175,176,177]. It is also important to consider coordination interactions between metal ions and ligand molecules for metalloprotein complexes [45,178].
- (4)
- After the input files are created, the appropriate docking protocol must be selected. As has been discussed in Molecular Docking Protocol (Section 4.1), there are many different docking protocols that consider protein and ligand flexibility to enhance the performance of pose prediction. One of the most commonly used protocols is to perform flexible ligand–rigid receptor docking for each docking run, and then dock multiple protein conformations using the ensemble docking strategy [139]. In addition, several docking programs can be combined to avoid the limitations of one algorithm. For instance, Ren and co-workers have explored the effects of using multiple softwares in the pose generation step [187]. They use a RMSD-based criterion to come up with representative poses derived from 3 to 11 different docking programs. The resulting pose prediction achieves better performance than that of each individual docking program.
- (5)
- Following docking, the results can be rescored or filtered. The computer-generated poses are evaluated based on the ability of the docking protocol to (i) select favorable binding poses for each ligand, and (ii) rank the ligand library to select high scoring hits for experimental measurement. Although the docking calculations are fast enough to process large compound libraries, they suffer from the inherent problem of calculating binding affinities from several simplified scoring terms. One remedy for improving the performance of VS is to employ more rigorous free energy calculations to postprocess docking poses. The main limiting factor in the application of free energy calculations to large chemical libraries is the high computational cost.
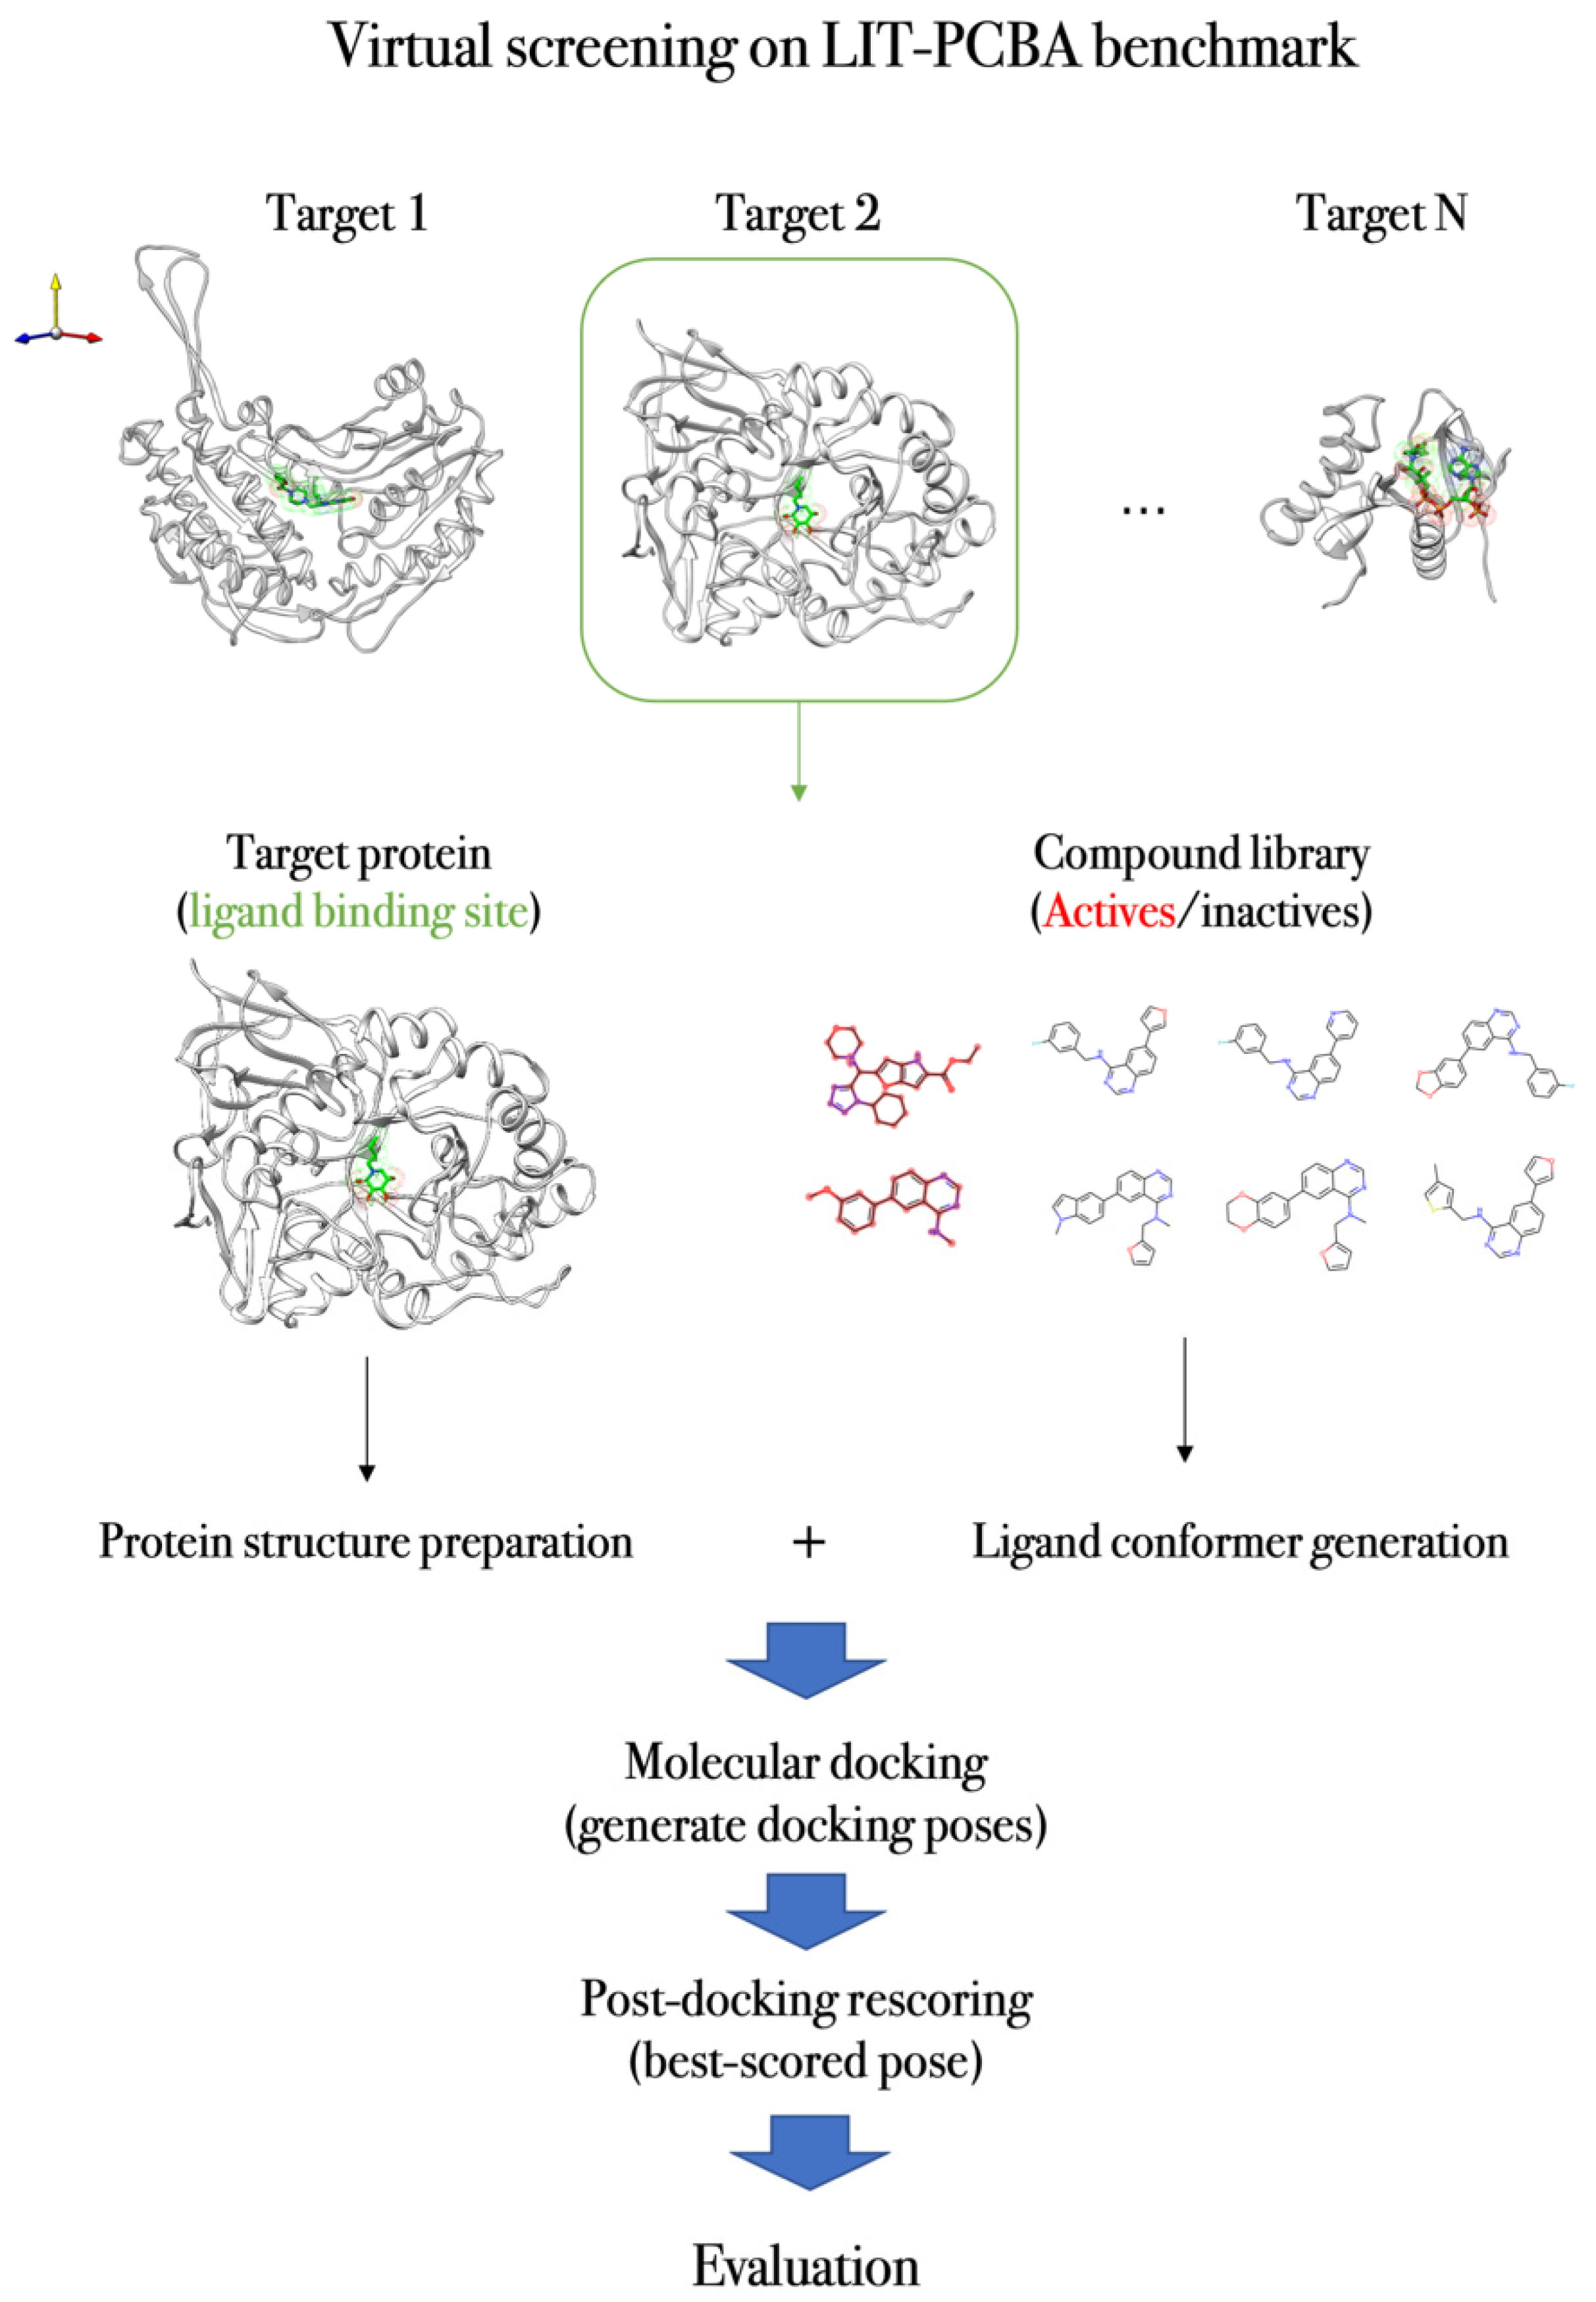
4.3. Case Study
5. Concluding Remarks and Perspectives
Author Contributions
Funding
Conflicts of Interest
References
- Kawai, K.; Nagata, N.; Takahashi, Y. De novo design of drug-like molecules by a fragment-based molecular evolutionary approach. J. Chem. Inf. Model. 2014, 54, 49–56. [Google Scholar] [CrossRef] [PubMed]
- Lionta, E.; Spyrou, G.; K Vassilatis, D.; Cournia, Z. Structure-based virtual screening for drug discovery: Principles, applications and recent advances. Curr. Top. Med. Chem. 2014, 14, 1923–1938. [Google Scholar] [CrossRef] [PubMed]
- Gorgulla, C.; Boeszoermenyi, A.; Wang, Z.-F.; Fischer, P.D.; Coote, P.W.; Padmanabha Das, K.M.; Malets, Y.S.; Radchenko, D.S.; Moroz, Y.S.; Scott, D.A. An open-source drug discovery platform enables ultra-large virtual screens. Nature 2020, 580, 663–668. [Google Scholar] [CrossRef]
- Stumpfe, D.; Bajorath, J.r. Current trends, overlooked issues, and unmet challenges in virtual screening. J. Chem. Inf. Model. 2020, 60, 4112–4115. [Google Scholar] [CrossRef] [PubMed]
- Talele, T.T.; Khedkar, S.A.; Rigby, A.C. Successful applications of computer aided drug discovery: Moving drugs from concept to the clinic. Curr. Top. Med. Chem. 2010, 10, 127–141. [Google Scholar] [CrossRef] [PubMed]
- Stein, R.M.; Kang, H.J.; McCorvy, J.D.; Glatfelter, G.C.; Jones, A.J.; Che, T.; Slocum, S.; Huang, X.-P.; Savych, O.; Moroz, Y.S. Virtual discovery of melatonin receptor ligands to modulate circadian rhythms. Nature 2020, 579, 609–614. [Google Scholar] [CrossRef]
- Hartman, G.D.; Egbertson, M.S.; Halczenko, W.; Laswell, W.L.; Duggan, M.E.; Smith, R.L.; Naylor, A.M.; Manno, P.D.; Lynch, R.J. Non-peptide fibrinogen receptor antagonists. 1. Discovery and design of exosite inhibitors. J. Med. Chem. 1992, 35, 4640–4642. [Google Scholar] [CrossRef]
- Greer, J.; Erickson, J.W.; Baldwin, J.J.; Varney, M.D. Application of the three-dimensional structures of protein target molecules in structure-based drug design. J. Med. Chem. 1994, 37, 1035–1054. [Google Scholar] [CrossRef]
- Wlodawer, A.; Vondrasek, J. Inhibitors of HIV-1 protease: A major success of structure-assisted drug design. Annu. Rev. Biophys. Biomol. Struct. 1998, 27, 249–284. [Google Scholar] [CrossRef] [Green Version]
- Van Drie, J.H. Computer-aided drug design: The next 20 years. J. Comput. Aided Mol. Des. 2007, 21, 591–601. [Google Scholar] [CrossRef]
- Abdolmaleki, A.; B Ghasemi, J.; Ghasemi, F. Computer aided drug design for multi-target drug design: SAR/QSAR, molecular docking and pharmacophore methods. Curr. Drug Targets 2017, 18, 556–575. [Google Scholar] [CrossRef] [PubMed]
- Acharya, C.; Coop, A.; E Polli, J.; D MacKerell, A. Recent advances in ligand-based drug design: Relevance and utility of the conformationally sampled pharmacophore approach. Curr. Comput. Aided Drug Des. 2011, 7, 10–22. [Google Scholar] [CrossRef] [PubMed] [Green Version]
- Ferreira, L.G.; Dos Santos, R.N.; Oliva, G.; Andricopulo, A.D. Molecular docking and structure-based drug design strategies. Molecules 2015, 20, 13384–13421. [Google Scholar] [CrossRef] [PubMed]
- De Ruyck, J.; Brysbaert, G.; Blossey, R.; Lensink, M.F. Molecular docking as a popular tool in drug design, an in silico travel. Adv. Appl. Bioinform. Chem. 2016, 9, 1. [Google Scholar] [CrossRef] [Green Version]
- Lavecchia, A.; Di Giovanni, C. Virtual screening strategies in drug discovery: A critical review. Curr. Med. Chem. 2013, 20, 2839–2860. [Google Scholar] [CrossRef]
- Torres, P.H.; Sodero, A.C.; Jofily, P.; Silva-Jr, F.P. Key topics in molecular docking for drug design. Int. J. Mol. Sci. 2019, 20, 4574. [Google Scholar] [CrossRef] [Green Version]
- Fan, J.; Fu, A.; Zhang, L. Progress in molecular docking. Quant. Biol. 2019, 7, 83–89. [Google Scholar] [CrossRef] [Green Version]
- Koshland Jr, D.E. The key–lock theory and the induced fit theory. Angew. Chem. Int. Ed. Engl. 1995, 33, 2375–2378. [Google Scholar] [CrossRef]
- Miteva, M.A.; Lee, W.H.; Montes, M.O.; Villoutreix, B.O. Fast structure-based virtual ligand screening combining FRED, DOCK, and Surflex. J. Med. Chem. 2005, 48, 6012–6022. [Google Scholar] [CrossRef]
- Allen, W.J.; Balius, T.E.; Mukherjee, S.; Brozell, S.R.; Moustakas, D.T.; Lang, P.T.; Case, D.A.; Kuntz, I.D.; Rizzo, R.C. DOCK 6: Impact of new features and current docking performance. J. Comput. Chem. 2015, 36, 1132–1156. [Google Scholar] [CrossRef] [Green Version]
- Verdonk, M.L.; Cole, J.C.; Hartshorn, M.J.; Murray, C.W.; Taylor, R.D. Improved protein–ligand docking using GOLD. Proteins: Struct. Funct. Bioinform. 2003, 52, 609–623. [Google Scholar] [CrossRef] [PubMed]
- Friesner, R.A.; Banks, J.L.; Murphy, R.B.; Halgren, T.A.; Klicic, J.J.; Mainz, D.T.; Repasky, M.P.; Knoll, E.H.; Shelley, M.; Perry, J.K. Glide: A new approach for rapid, accurate docking and scoring. 1. Method and assessment of docking accuracy. J. Med. Chem. 2004, 47, 1739–1749. [Google Scholar] [CrossRef] [PubMed]
- Halgren, T.A.; Murphy, R.B.; Friesner, R.A.; Beard, H.S.; Frye, L.L.; Pollard, W.T.; Banks, J.L. Glide: A new approach for rapid, accurate docking and scoring. 2. Enrichment factors in database screening. J. Med. Chem. 2004, 47, 1750–1759. [Google Scholar] [CrossRef] [PubMed]
- Jain, A.N. Surflex-Dock 2.1: Robust performance from ligand energetic modeling, ring flexibility, and knowledge-based search. J. Comput. Aided Mol. Des. 2007, 21, 281–306. [Google Scholar] [CrossRef] [Green Version]
- Jorgensen, W.L.; Thomas, L.L. Perspective on free-energy perturbation calculations for chemical equilibria. J. Chem. Theory Comput. 2008, 4, 869–876. [Google Scholar] [CrossRef] [Green Version]
- Deflorian, F.; Perez-Benito, L.; Lenselink, E.B.; Congreve, M.; van Vlijmen, H.W.; Mason, J.S.; Graaf, C.d.; Tresadern, G. Accurate prediction of GPCR ligand binding affinity with free energy perturbation. J. Chem. Inf. Model. 2020, 60, 5563–5579. [Google Scholar] [CrossRef]
- Bhati, A.P.; Wan, S.; Wright, D.W.; Coveney, P.V. Rapid, accurate, precise, and reliable relative free energy prediction using ensemble based thermodynamic integration. J. Chem. Theory Comput. 2017, 13, 210–222. [Google Scholar] [CrossRef]
- Genheden, S.; Nilsson, I.; Ryde, U. Binding affinities of factor Xa inhibitors estimated by thermodynamic integration and MM/GBSA. J. Chem. Inf. Model. 2011, 51, 947–958. [Google Scholar] [CrossRef] [Green Version]
- Lyu, J.; Wang, S.; Balius, T.E.; Singh, I.; Levit, A.; Moroz, Y.S.; O’Meara, M.J.; Che, T.; Algaa, E.; Tolmachova, K. Ultra-large library docking for discovering new chemotypes. Nature 2019, 566, 224–229. [Google Scholar] [CrossRef]
- Huang, S.-Y.; Grinter, S.Z.; Zou, X. Scoring functions and their evaluation methods for protein–ligand docking: Recent advances and future directions. Phys. Chem. Chem. Phys. 2010, 12, 12899–12908. [Google Scholar] [CrossRef]
- Böhm, H.; Stahl, M. The use of scoring functions in drug discovery applications. Rev. Comput. Chem. 2003, 18, 41–87. [Google Scholar] [CrossRef]
- Talele, T.T.; Arora, P.; Kulkarni, S.S.; Patel, M.R.; Singh, S.; Chudayeu, M.; Kaushik-Basu, N. Structure-based virtual screening, synthesis and SAR of novel inhibitors of hepatitis C virus NS5B polymerase. Biorg. Med. Chem. 2010, 18, 4630–4638. [Google Scholar] [CrossRef] [PubMed] [Green Version]
- Su, M.; Yang, Q.; Du, Y.; Feng, G.; Liu, Z.; Li, Y.; Wang, R. Comparative assessment of scoring functions: The CASF-2016 update. J. Chem. Inf. Model. 2018, 59, 895–913. [Google Scholar] [CrossRef]
- Li, Y.; Su, M.; Liu, Z.; Li, J.; Liu, J.; Han, L.; Wang, R. Assessing protein–ligand interaction scoring functions with the CASF-2013 benchmark. Nat. Protoc. 2018, 13, 666–680. [Google Scholar] [CrossRef] [PubMed]
- Liu, J.; Wang, R. Classification of current scoring functions. J. Chem. Inf. Model. 2015, 55, 475–482. [Google Scholar] [CrossRef] [PubMed]
- Goodsell, D.S.; Morris, G.M.; Olson, A.J. Automated docking of flexible ligands: Applications of AutoDock. J. Mol. Recognit. 1996, 9, 1–5. [Google Scholar] [CrossRef]
- Gohlke, H.; Hendlich, M.; Klebe, G. Knowledge-based scoring function to predict protein-ligand interactions. J. Mol. Biol. 2000, 295, 337–356. [Google Scholar] [CrossRef] [PubMed]
- Huang, S.Y.; Zou, X. An iterative knowledge-based scoring function to predict protein–ligand interactions: II. Validation of the scoring function. J. Comput. Chem. 2006, 27, 1876–1882. [Google Scholar] [CrossRef]
- Huang, S.Y.; Zou, X. An iterative knowledge-based scoring function to predict protein–ligand interactions: I. Derivation of interaction potentials. J. Comput. Chem. 2006, 27, 1866–1875. [Google Scholar] [CrossRef]
- Muegge, I.; Martin, Y.C. A general and fast scoring function for protein− ligand interactions: A simplified potential approach. J. Med. Chem. 1999, 42, 791–804. [Google Scholar] [CrossRef]
- Böhm, H.J. A novel computational tool for automated structure-based drug design. J. Mol. Recognit. 1993, 6, 131–137. [Google Scholar] [CrossRef] [PubMed]
- Böhm, H.-J. The development of a simple empirical scoring function to estimate the binding constant for a protein-ligand complex of known three-dimensional structure. J. Comput. Aided Mol. Des. 1994, 8, 243–256. [Google Scholar] [CrossRef] [PubMed]
- Trott, O.; Olson, A.J. AutoDock Vina: Improving the speed and accuracy of docking with a new scoring function, efficient optimization, and multithreading. J. Comput. Chem. 2010, 31, 455–461. [Google Scholar] [CrossRef] [Green Version]
- Wang, R.; Lai, L.; Wang, S. Further development and validation of empirical scoring functions for structure-based binding affinity prediction. J. Comput. Aided Mol. Des. 2002, 16, 11–26. [Google Scholar] [CrossRef]
- Yang, C.; Zhang, Y. Lin_F9: A Linear Empirical Scoring Function for Protein–Ligand Docking. J. Chem. Inf. Model. 2021, 61, 4630–4644. [Google Scholar] [CrossRef]
- Li, H.; Sze, K.H.; Lu, G.; Ballester, P.J. Machine-learning scoring functions for structure-based virtual screening. Wiley Interdiscip. Rev. Comput. Mol. Sci. 2021, 11, e1478. [Google Scholar] [CrossRef]
- Ain, Q.U.; Aleksandrova, A.; Roessler, F.D.; Ballester, P.J. Machine-learning scoring functions to improve structure-based binding affinity prediction and virtual screening. Wiley Interdiscip. Rev. Comput. Mol. Sci. 2015, 5, 405–424. [Google Scholar] [CrossRef] [PubMed]
- Cortes, C.; Vapnik, V. Support-vector networks. Mach. Learn. 1995, 20, 273–297. [Google Scholar] [CrossRef]
- Liaw, A.; Wiener, M. Classification and regression by random Forest. R News 2002, 2, 18–22. [Google Scholar]
- Chen, T.; Guestrin, C. Xgboost: A scalable tree boosting system. In Proceedings of the 22nd ACM Sigkdd International Conference on Knowledge Discovery and Data Mining, San Francisco, CA, USA, 13–17 August 2016; ACM: New York, NY, USA, 2016; pp. 785–794. [Google Scholar]
- Schmidhuber, J. Deep learning in neural networks: An overview. Neural Netw. 2015, 61, 85–117. [Google Scholar] [CrossRef] [Green Version]
- Zhou, J.; Cui, G.; Hu, S.; Zhang, Z.; Yang, C.; Liu, Z.; Wang, L.; Li, C.; Sun, M. Graph neural networks: A review of methods and applications. AI Open 2020, 1, 57–81. [Google Scholar] [CrossRef]
- Wang, R.; Fang, X.; Lu, Y.; Wang, S. The PDBbind database: Collection of binding affinities for protein− ligand complexes with known three-dimensional structures. J. Med. Chem. 2004, 47, 2977–2980. [Google Scholar] [CrossRef]
- Liu, Z.; Li, Y.; Han, L.; Li, J.; Liu, J.; Zhao, Z.; Nie, W.; Liu, Y.; Wang, R. PDB-wide collection of binding data: Current status of the PDBbind database. Bioinformatics 2015, 31, 405–412. [Google Scholar] [CrossRef] [PubMed]
- Liu, Z.; Su, M.; Han, L.; Liu, J.; Yang, Q.; Li, Y.; Wang, R. Forging the basis for developing protein–ligand interaction scoring functions. Acc. Chem. Res. 2017, 50, 302–309. [Google Scholar] [CrossRef] [PubMed]
- Berman, H.M.; Westbrook, J.; Feng, Z.; Gilliland, G.; Bhat, T.N.; Weissig, H.; Shindyalov, I.N.; Bourne, P.E. The protein data bank. Nucleic Acids Res. 2000, 28, 235–242. [Google Scholar] [CrossRef] [Green Version]
- Berman, H.M. The protein data bank: A historical perspective. Acta Crystallogr. A 2008, 64, 88–95. [Google Scholar] [CrossRef]
- Smith, R.D.; Dunbar Jr, J.B.; Ung, P.M.-U.; Esposito, E.X.; Yang, C.-Y.; Wang, S.; Carlson, H.A. CSAR benchmark exercise of 2010: Combined evaluation across all submitted scoring functions. J. Chem. Inf. Model. 2011, 51, 2115–2131. [Google Scholar] [CrossRef]
- Dunbar Jr, J.B.; Smith, R.D.; Yang, C.-Y.; Ung, P.M.-U.; Lexa, K.W.; Khazanov, N.A.; Stuckey, J.A.; Wang, S.; Carlson, H.A. CSAR benchmark exercise of 2010: Selection of the protein–ligand complexes. J. Chem. Inf. Model. 2011, 51, 2036–2046. [Google Scholar] [CrossRef]
- Damm-Ganamet, K.L.; Smith, R.D.; Dunbar Jr, J.B.; Stuckey, J.A.; Carlson, H.A. CSAR benchmark exercise 2011–2012: Evaluation of results from docking and relative ranking of blinded congeneric series. J. Chem. Inf. Model. 2013, 53, 1853–1870. [Google Scholar] [CrossRef]
- Dunbar Jr, J.B.; Smith, R.D.; Damm-Ganamet, K.L.; Ahmed, A.; Esposito, E.X.; Delproposto, J.; Chinnaswamy, K.; Kang, Y.-N.; Kubish, G.; Gestwicki, J.E. CSAR data set release 2012: Ligands, affinities, complexes, and docking decoys. J. Chem. Inf. Model. 2013, 53, 1842–1852. [Google Scholar] [CrossRef]
- Smith, R.D.; Damm-Ganamet, K.L.; Dunbar Jr, J.B.; Ahmed, A.; Chinnaswamy, K.; Delproposto, J.E.; Kubish, G.M.; Tinberg, C.E.; Khare, S.D.; Dou, J. CSAR benchmark exercise 2013: Evaluation of results from a combined computational protein design, docking, and scoring/ranking challenge. J. Chem. Inf. Model. 2016, 56, 1022–1031. [Google Scholar] [CrossRef] [PubMed]
- Carlson, H.A.; Smith, R.D.; Damm-Ganamet, K.L.; Stuckey, J.A.; Ahmed, A.; Convery, M.A.; Somers, D.O.; Kranz, M.; Elkins, P.A.; Cui, G. CSAR 2014: A benchmark exercise using unpublished data from pharma. J. Chem. Inf. Model. 2016, 56, 1063–1077. [Google Scholar] [CrossRef] [PubMed] [Green Version]
- Gaieb, Z.; Liu, S.; Gathiaka, S.; Chiu, M.; Yang, H.; Shao, C.; Feher, V.A.; Walters, W.P.; Kuhn, B.; Rudolph, M.G. D3R Grand Challenge 2: Blind prediction of protein–ligand poses, affinity rankings, and relative binding free energies. J. Comput. Aided Mol. Des. 2018, 32, 1–20. [Google Scholar] [CrossRef]
- Gaieb, Z.; Parks, C.D.; Chiu, M.; Yang, H.; Shao, C.; Walters, W.P.; Lambert, M.H.; Nevins, N.; Bembenek, S.D.; Ameriks, M.K. D3R Grand Challenge 3: Blind prediction of protein–ligand poses and affinity rankings. J. Comput. Aided Mol. Des. 2019, 33, 1–18. [Google Scholar] [CrossRef] [PubMed]
- Gathiaka, S.; Liu, S.; Chiu, M.; Yang, H.; Stuckey, J.A.; Kang, Y.N.; Delproposto, J.; Kubish, G.; Dunbar, J.B.; Carlson, H.A. D3R grand challenge 2015: Evaluation of protein–ligand pose and affinity predictions. J. Comput. Aided Mol. Des. 2016, 30, 651–668. [Google Scholar] [CrossRef] [PubMed] [Green Version]
- Parks, C.D.; Gaieb, Z.; Chiu, M.; Yang, H.; Shao, C.; Walters, W.P.; Jansen, J.M.; McGaughey, G.; Lewis, R.A.; Bembenek, S.D. D3R grand challenge 4: Blind prediction of protein–ligand poses, affinity rankings, and relative binding free energies. J. Comput. Aided Mol. Des. 2020, 34, 99–119. [Google Scholar] [CrossRef] [Green Version]
- Tran-Nguyen, V.-K.; Jacquemard, C.; Rognan, D. LIT-PCBA: An unbiased data set for machine learning and virtual screening. J. Chem. Inf. Model. 2020, 60, 4263–4273. [Google Scholar] [CrossRef]
- Huang, N.; Shoichet, B.K.; Irwin, J.J. Benchmarking sets for molecular docking. J. Med. Chem. 2006, 49, 6789–6801. [Google Scholar] [CrossRef] [Green Version]
- Mysinger, M.M.; Carchia, M.; Irwin, J.J.; Shoichet, B.K. Directory of useful decoys, enhanced (DUD-E): Better ligands and decoys for better benchmarking. J. Med. Chem. 2012, 55, 6582–6594. [Google Scholar] [CrossRef]
- Rohrer, S.G.; Baumann, K. Maximum unbiased validation (MUV) data sets for virtual screening based on PubChem bioactivity data. J. Chem. Inf. Model. 2009, 49, 169–184. [Google Scholar] [CrossRef]
- Wang, Y.; Suzek, T.; Zhang, J.; Wang, J.; He, S.; Cheng, T.; Shoemaker, B.A.; Gindulyte, A.; Bryant, S.H. PubChem bioassay: 2014 update. Nucleic Acids Res. 2014, 42, D1075–D1082. [Google Scholar] [CrossRef] [PubMed] [Green Version]
- Kim, S.; Thiessen, P.A.; Bolton, E.E.; Chen, J.; Fu, G.; Gindulyte, A.; Han, L.; He, J.; He, S.; Shoemaker, B.A. PubChem substance and compound databases. Nucleic Acids Res. 2016, 44, D1202–D1213. [Google Scholar] [CrossRef] [PubMed]
- Butkiewicz, M.; Lowe, E.W.; Mueller, R.; Mendenhall, J.L.; Teixeira, P.L.; Weaver, C.D.; Meiler, J. Benchmarking ligand-based virtual High-Throughput Screening with the PubChem database. Molecules 2013, 18, 735–756. [Google Scholar] [CrossRef] [PubMed] [Green Version]
- Liu, T.; Lin, Y.; Wen, X.; Jorissen, R.N.; Gilson, M.K. BindingDB: A web-accessible database of experimentally determined protein–ligand binding affinities. Nucleic Acids Res. 2007, 35, D198–D201. [Google Scholar] [CrossRef] [Green Version]
- Gilson, M.K.; Liu, T.; Baitaluk, M.; Nicola, G.; Hwang, L.; Chong, J. BindingDB in 2015: A public database for medicinal chemistry, computational chemistry and systems pharmacology. Nucleic Acids Res. 2016, 44, D1045–D1053. [Google Scholar] [CrossRef]
- Chen, X.; Liu, M.; Gilson, M.K. BindingDB: A Web-Accessible Molecular Recognition Database. Comb. Chem. High Throughput Screen. 2001, 4, 719–725. [Google Scholar] [CrossRef] [Green Version]
- Nicola, G.; Liu, T.; Hwang, L.; Gilson, M. BindingDB: A protein-ligand database for drug discovery. Biophys. J. 2012, 102, 61a. [Google Scholar] [CrossRef] [Green Version]
- Gaulton, A.; Bellis, L.J.; Bento, A.P.; Chambers, J.; Davies, M.; Hersey, A.; Light, Y.; McGlinchey, S.; Michalovich, D.; Al-Lazikani, B. ChEMBL: A large-scale bioactivity database for drug discovery. Nucleic Acids Res. 2012, 40, D1100–D1107. [Google Scholar] [CrossRef] [Green Version]
- Gaulton, A.; Hersey, A.; Nowotka, M.; Bento, A.P.; Chambers, J.; Mendez, D.; Mutowo, P.; Atkinson, F.; Bellis, L.J.; Cibrián-Uhalte, E. The ChEMBL database in 2017. Nucleic Acids Res. 2017, 45, D945–D954. [Google Scholar] [CrossRef]
- Mendez, D.; Gaulton, A.; Bento, A.P.; Chambers, J.; De Veij, M.; Félix, E.; Magariños, M.P.; Mosquera, J.F.; Mutowo, P.; Nowotka, M. ChEMBL: Towards direct deposition of bioassay data. Nucleic Acids Res. 2019, 47, D930–D940. [Google Scholar] [CrossRef]
- Bento, A.P.; Gaulton, A.; Hersey, A.; Bellis, L.J.; Chambers, J.; Davies, M.; Krüger, F.A.; Light, Y.; Mak, L.; McGlinchey, S. The ChEMBL bioactivity database: An update. Nucleic Acids Res. 2014, 42, D1083–D1090. [Google Scholar] [CrossRef] [PubMed] [Green Version]
- Liebeschuetz, J.W.; Cole, J.C.; Korb, O. Pose prediction and virtual screening performance of GOLD scoring functions in a standardized test. J. Comput. Aided Mol. Des. 2012, 26, 737–748. [Google Scholar] [CrossRef] [PubMed]
- Bell, E.W.; Zhang, Y. DockRMSD: An open-source tool for atom mapping and RMSD calculation of symmetric molecules through graph isomorphism. J. Cheminform. 2019, 11, 40. [Google Scholar] [CrossRef] [Green Version]
- Meli, R.; Biggin, P.C. spyrmsd: Symmetry-corrected RMSD calculations in Python. J. Cheminform. 2020, 12, 1–7. [Google Scholar] [CrossRef] [PubMed]
- Allen, W.J.; Rizzo, R.C. Implementation of the Hungarian algorithm to account for ligand symmetry and similarity in structure-based design. J. Chem. Inf. Model. 2014, 54, 518–529. [Google Scholar] [CrossRef]
- Brozell, S.R.; Mukherjee, S.; Balius, T.E.; Roe, D.R.; Case, D.A.; Rizzo, R.C. Evaluation of DOCK 6 as a pose generation and database enrichment tool. J. Comput. Aided Mol. Des. 2012, 26, 749–773. [Google Scholar] [CrossRef] [Green Version]
- Forli, S.; Huey, R.; Pique, M.E.; Sanner, M.F.; Goodsell, D.S.; Olson, A.J. Computational protein–ligand docking and virtual drug screening with the AutoDock suite. Nat. Protoc. 2016, 11, 905–919. [Google Scholar] [CrossRef] [Green Version]
- Ashtawy, H.M.; Mahapatra, N.R. A comparative assessment of ranking accuracies of conventional and machine-learning-based scoring functions for protein-ligand binding affinity prediction. IEEE/ACM Trans. Comput. Biol. Bioinform. 2012, 9, 1301–1313. [Google Scholar] [CrossRef]
- Sunseri, J.; Koes, D.R. Virtual Screening with Gnina 1.0. Molecules 2021, 26, 7369. [Google Scholar] [CrossRef]
- Ackloo, S.; Al-awar, R.; Amaro, R.E.; Arrowsmith, C.H.; Azevedo, H.; Batey, R.A.; Bengio, Y.; Betz, U.A.; Bologa, C.G.; Chodera, J.D. CACHE (Critical Assessment of Computational Hit-finding Experiments): A public–private partnership benchmarking initiative to enable the development of computational methods for hit-finding. Nat. Rev. Chem. 2022, 1–9. [Google Scholar] [CrossRef]
- Goh, G.B.; Hodas, N.O.; Vishnu, A. Deep learning for computational chemistry. J. Comput. Chem. 2017, 38, 1291–1307. [Google Scholar] [CrossRef] [PubMed] [Green Version]
- Li, H.; Sze, K.H.; Lu, G.; Ballester, P.J. Machine-learning scoring functions for structure-based drug lead optimization. Wiley Interdiscip. Rev. Comput. Mol. Sci. 2020, 10, e1465. [Google Scholar] [CrossRef] [Green Version]
- Ramakrishnan, R.; von Lilienfeld, O.A. Machine learning, quantum chemistry, and chemical space. Rev. Comput. Chem. 2017, 30, 225–256. [Google Scholar] [CrossRef]
- Jumper, J.; Evans, R.; Pritzel, A.; Green, T.; Figurnov, M.; Ronneberger, O.; Tunyasuvunakool, K.; Bates, R.; Žídek, A.; Potapenko, A. Highly accurate protein structure prediction with AlphaFold. Nature 2021, 596, 583–589. [Google Scholar] [CrossRef]
- Méndez-Lucio, O.; Ahmad, M.; del Rio-Chanona, E.A.; Wegner, J.K. A geometric deep learning approach to predict binding conformations of bioactive molecules. Nat. Mach. Intell. 2021, 3, 1033–1039. [Google Scholar] [CrossRef]
- Wu, Z.; Ramsundar, B.; Feinberg, E.N.; Gomes, J.; Geniesse, C.; Pappu, A.S.; Leswing, K.; Pande, V. MoleculeNet: A benchmark for molecular machine learning. Chem. Sci. 2018, 9, 513–530. [Google Scholar] [CrossRef] [Green Version]
- Shen, C.; Ding, J.; Wang, Z.; Cao, D.; Ding, X.; Hou, T. From machine learning to deep learning: Advances in scoring functions for protein–ligand docking. Wiley Interdiscip. Rev. Comput. Mol. Sci. 2020, 10, e1429. [Google Scholar] [CrossRef]
- Ballester, P.J.; Mitchell, J.B. A machine learning approach to predicting protein–ligand binding affinity with applications to molecular docking. Bioinformatics 2010, 26, 1169–1175. [Google Scholar] [CrossRef] [Green Version]
- Zilian, D.; Sotriffer, C.A. Sfcscore rf: A random forest-based scoring function for improved affinity prediction of protein–ligand complexes. J. Chem. Inf. Model. 2013, 53, 1923–1933. [Google Scholar] [CrossRef]
- Wang, C.; Zhang, Y. Improving scoring-docking-screening powers of protein–ligand scoring functions using random forest. J. Comput. Chem. 2017, 38, 169–177. [Google Scholar] [CrossRef] [Green Version]
- Lu, J.; Hou, X.; Wang, C.; Zhang, Y. Incorporating explicit water molecules and ligand conformation stability in machine-learning scoring functions. J. Chem. Inf. Model. 2019, 59, 4540–4549. [Google Scholar] [CrossRef] [PubMed]
- Yang, C.; Zhang, Y. Delta Machine Learning to Improve Scoring-Ranking-Screening Performances of Protein–Ligand Scoring Functions. J. Chem. Inf. Model. 2022, 62, 2696–2712. [Google Scholar] [CrossRef] [PubMed]
- Rayka, M.; Karimi-Jafari, M.H.; Firouzi, R. ET-score: Improving Protein-ligand Binding Affinity Prediction Based on Distance-weighted Interatomic Contact Features Using Extremely Randomized Trees Algorithm. Mol. Inform. 2021, 40, 2060084. [Google Scholar] [CrossRef] [PubMed]
- Nguyen, D.D.; Wei, G.-W. Agl-score: Algebraic graph learning score for protein–ligand binding scoring, ranking, docking, and screening. J. Chem. Inf. Model. 2019, 59, 3291–3304. [Google Scholar] [CrossRef]
- Sánchez-Cruz, N.; Medina-Franco, J.L.; Mestres, J.; Barril, X. Extended connectivity interaction features: Improving binding affinity prediction through chemical description. Bioinformatics 2021, 37, 1376–1382. [Google Scholar] [CrossRef]
- Durrant, J.D.; McCammon, J.A. NNScore: A neural-network-based scoring function for the characterization of protein−Ligand complexes. J. Chem. Inf. Model. 2010, 50, 1865–1871. [Google Scholar] [CrossRef]
- Durrant, J.D.; McCammon, J.A. NNScore 2.0: A neural-network receptor–ligand scoring function. J. Chem. Inf. Model. 2011, 51, 2897–2903. [Google Scholar] [CrossRef]
- Wallach, I.; Dzamba, M.; Heifets, A. AtomNet: A deep convolutional neural network for bioactivity prediction in structure-based drug discovery. arXiv 2015, arXiv:1510.02855. [Google Scholar]
- Stepniewska-Dziubinska, M.M.; Zielenkiewicz, P.; Siedlecki, P. Development and evaluation of a deep learning model for protein–ligand binding affinity prediction. Bioinformatics 2018, 34, 3666–3674. [Google Scholar] [CrossRef] [Green Version]
- Jiménez, J.; Skalic, M.; Martinez-Rosell, G.; De Fabritiis, G. K deep: Protein–ligand absolute binding affinity prediction via 3d-convolutional neural networks. J. Chem. Inf. Model. 2018, 58, 287–296. [Google Scholar] [CrossRef]
- Zheng, L.; Fan, J.; Mu, Y. Onionnet: A multiple-layer intermolecular-contact-based convolutional neural network for protein–ligand binding affinity prediction. ACS Omega 2019, 4, 15956–15965. [Google Scholar] [CrossRef] [PubMed] [Green Version]
- Feinberg, E.N.; Sur, D.; Wu, Z.; Husic, B.E.; Mai, H.; Li, Y.; Sun, S.; Yang, J.; Ramsundar, B.; Pande, V.S. PotentialNet for molecular property prediction. ACS Cent. Sci. 2018, 4, 1520–1530. [Google Scholar] [CrossRef] [PubMed]
- Karlov, D.S.; Sosnin, S.; Fedorov, M.V.; Popov, P. graphDelta: MPNN scoring function for the affinity prediction of protein–ligand complexes. ACS Omega 2020, 5, 5150–5159. [Google Scholar] [CrossRef] [Green Version]
- Li, S.; Zhou, J.; Xu, T.; Huang, L.; Wang, F.; Xiong, H.; Huang, W.; Dou, D.; Xiong, H. Structure-aware interactive graph neural networks for the prediction of protein-ligand binding affinity. In Proceedings of the 27th ACM SIGKDD Conference on Knowledge Discovery & Data Mining, Singapore, 14–18 August 2021; pp. 975–985. [Google Scholar]
- Ashtawy, H.M.; Mahapatra, N.R. Task-specific scoring functions for predicting ligand binding poses and affinity and for screening enrichment. J. Chem. Inf. Model. 2018, 58, 119–133. [Google Scholar] [CrossRef]
- Wójcikowski, M.; Ballester, P.J.; Siedlecki, P. Performance of machine-learning scoring functions in structure-based virtual screening. Sci. Rep. 2017, 7, 1–10. [Google Scholar] [CrossRef] [PubMed] [Green Version]
- Ragoza, M.; Hochuli, J.; Idrobo, E.; Sunseri, J.; Koes, D.R. Protein–ligand scoring with convolutional neural networks. J. Chem. Inf. Model. 2017, 57, 942–957. [Google Scholar] [CrossRef] [Green Version]
- Wang, Z.; Zheng, L.; Liu, Y.; Qu, Y.; Li, Y.-Q.; Zhao, M.; Mu, Y.; Li, W. Onionnet-2: A convolutional neural network model for predicting protein-ligand binding affinity based on residue-atom contacting shells. Front. Chem. 2021, 913. [Google Scholar] [CrossRef]
- Lim, J.; Ryu, S.; Park, K.; Choe, Y.J.; Ham, J.; Kim, W.Y. Predicting drug–target interaction using a novel graph neural network with 3D structure-embedded graph representation. J. Chem. Inf. Model. 2019, 59, 3981–3988. [Google Scholar] [CrossRef]
- Son, J.; Kim, D. Development of a graph convolutional neural network model for efficient prediction of protein-ligand binding affinities. PloS ONE 2021, 16, e0249404. [Google Scholar] [CrossRef]
- Wang, Y.; Li, L.; Zhang, B.; Xing, J.; Chen, S.; Wan, W.; Song, Y.; Jiang, H.; Jiang, H.; Luo, C. Discovery of novel disruptor of silencing telomeric 1-like (DOT1L) inhibitors using a target-specific scoring function for the (S)-adenosyl-l-methionine (SAM)-dependent methyltransferase family. J. Med. Chem. 2017, 60, 2026–2036. [Google Scholar] [CrossRef]
- Shen, C.; Weng, G.; Zhang, X.; Leung, E.L.-H.; Yao, X.; Pang, J.; Chai, X.; Li, D.; Wang, E.; Cao, D. Accuracy or novelty: What can we gain from target-specific machine-learning-based scoring functions in virtual screening? Brief. Bioinform. 2021, 22, bbaa410. [Google Scholar] [CrossRef] [PubMed]
- Yang, Y.; Lu, J.; Yang, C.; Zhang, Y. Exploring fragment-based target-specific ranking protocol with machine learning on cathepsin S. J. Comput. Aided Mol. Des. 2019, 33, 1095–1105. [Google Scholar] [CrossRef] [PubMed]
- Maia, E.H.B.; Assis, L.C.; De Oliveira, T.A.; Da Silva, A.M.; Taranto, A.G. Structure-based virtual screening: From classical to artificial intelligence. Front. Chem. 2020, 8, 343. [Google Scholar] [CrossRef]
- Varadi, M.; Anyango, S.; Deshpande, M.; Nair, S.; Natassia, C.; Yordanova, G.; Yuan, D.; Stroe, O.; Wood, G.; Laydon, A. AlphaFold Protein Structure Database: Massively expanding the structural coverage of protein-sequence space with high-accuracy models. Nucleic Acids Res. 2022, 50, D439–D444. [Google Scholar] [CrossRef]
- Baek, M.; DiMaio, F.; Anishchenko, I.; Dauparas, J.; Ovchinnikov, S.; Lee, G.R.; Wang, J.; Cong, Q.; Kinch, L.N.; Schaeffer, R.D. Accurate prediction of protein structures and interactions using a three-track neural network. Science 2021, 373, 871–876. [Google Scholar] [CrossRef] [PubMed]
- Baek, M.; Baker, D. Deep learning and protein structure modeling. Nat. Methods 2022, 19, 13–14. [Google Scholar] [CrossRef]
- Frye, L.; Bhat, S.; Akinsanya, K.; Abel, R. From computer-aided drug discovery to computer-driven drug discovery. Drug Discover. Today Technol. 2021, 39, 111–117. [Google Scholar] [CrossRef] [PubMed]
- Ma, D.-L.; Chan, D.S.-H.; Leung, C.-H. Drug repositioning by structure-based virtual screening. Chem. Soc. Rev. 2013, 42, 2130–2141. [Google Scholar] [CrossRef]
- Kramer, B.; Rarey, M.; Lengauer, T. Evaluation of the FLEXX incremental construction algorithm for protein–ligand docking. Proteins: Struct. Funct. Bioinform. 1999, 37, 228–241. [Google Scholar] [CrossRef]
- Kearsley, S.K.; Underwood, D.J.; Sheridan, R.P.; Miller, M.D. Flexibases: A way to enhance the use of molecular docking methods. J. Comput. Aided Mol. Des. 1994, 8, 565–582. [Google Scholar] [CrossRef]
- Hart, T.N.; Read, R.J. A multiple-start Monte Carlo docking method. Proteins: Struct. Funct. Bioinform. 1992, 13, 206–222. [Google Scholar] [CrossRef] [PubMed]
- Morris, G.M.; Goodsell, D.S.; Halliday, R.S.; Huey, R.; Hart, W.E.; Belew, R.K.; Olson, A.J. Automated docking using a Lamarckian genetic algorithm and an empirical binding free energy function. J. Comput. Chem. 1998, 19, 1639–1662. [Google Scholar] [CrossRef] [Green Version]
- Wong, C.F. Flexible receptor docking for drug discovery. Expert Opin. Drug Discov. 2015, 10, 1189–1200. [Google Scholar] [CrossRef] [PubMed]
- Tian, S.; Sun, H.; Pan, P.; Li, D.; Zhen, X.; Li, Y.; Hou, T. Assessing an ensemble docking-based virtual screening strategy for kinase targets by considering protein flexibility. J. Chem. Inf. Model. 2014, 54, 2664–2679. [Google Scholar] [CrossRef] [PubMed]
- Korb, O.; Olsson, T.S.; Bowden, S.J.; Hall, R.J.; Verdonk, M.L.; Liebeschuetz, J.W.; Cole, J.C. Potential and limitations of ensemble docking. J. Chem. Inf. Model. 2012, 52, 1262–1274. [Google Scholar] [CrossRef] [PubMed]
- Amaro, R.E.; Baudry, J.; Chodera, J.; Demir, Ö.; McCammon, J.A.; Miao, Y.; Smith, J.C. Ensemble docking in drug discovery. Biophys. J. 2018, 114, 2271–2278. [Google Scholar] [CrossRef] [PubMed] [Green Version]
- Totrov, M.; Abagyan, R. Flexible ligand docking to multiple receptor conformations: A practical alternative. Curr. Opin. Struct. Biol. 2008, 18, 178–184. [Google Scholar] [CrossRef] [Green Version]
- Rueda, M.; Bottegoni, G.; Abagyan, R. Recipes for the selection of experimental protein conformations for virtual screening. J. Chem. Inf. Model. 2010, 50, 186–193. [Google Scholar] [CrossRef] [Green Version]
- Mohammadi, S.; Narimani, Z.; Ashouri, M.; Firouzi, R.; Karimi-Jafari, M.H. Ensemble learning from ensemble docking: Revisiting the optimum ensemble size problem. Sci. Rep. 2022, 12, 1–15. [Google Scholar] [CrossRef]
- Chandak, T.; Mayginnes, J.P.; Mayes, H.; Wong, C.F. Using machine learning to improve ensemble docking for drug discovery. Proteins: Struct. Funct. Bioinform. 2020, 88, 1263–1270. [Google Scholar] [CrossRef]
- Huang, S.-Y.; Zou, X. Advances and challenges in protein-ligand docking. Int. J. Mol. Sci. 2010, 11, 3016–3034. [Google Scholar] [CrossRef] [PubMed] [Green Version]
- Ravindranath, P.A.; Forli, S.; Goodsell, D.S.; Olson, A.J.; Sanner, M.F. AutoDockFR: Advances in protein-ligand docking with explicitly specified binding site flexibility. PLoS Comp. Biol. 2015, 11, e1004586. [Google Scholar] [CrossRef] [PubMed] [Green Version]
- Du, X.; Li, Y.; Xia, Y.-L.; Ai, S.-M.; Liang, J.; Sang, P.; Ji, X.-L.; Liu, S.-Q. Insights into protein–ligand interactions: Mechanisms, models, and methods. Int. J. Mol. Sci. 2016, 17, 144. [Google Scholar] [CrossRef] [PubMed]
- Burley, S.K.; Berman, H.M.; Kleywegt, G.J.; Markley, J.L.; Nakamura, H.; Velankar, S. Protein Data Bank (PDB): The single global macromolecular structure archive. Protein Crystallogr. 2017, 627–641. [Google Scholar] [CrossRef] [Green Version]
- Lee, J.; Freddolino, P.L.; Zhang, Y. Ab initio protein structure prediction. In From Protein Structure to Function with Bioinformatics; Springer: Berlin/Heidelberg, Germany, 2017; pp. 3–35. [Google Scholar]
- Waterhouse, A.; Bertoni, M.; Bienert, S.; Studer, G.; Tauriello, G.; Gumienny, R.; Heer, F.T.; de Beer, T.A.P.; Rempfer, C.; Bordoli, L. SWISS-MODEL: Homology modelling of protein structures and complexes. Nucleic Acids Res. 2018, 46, W296–W303. [Google Scholar] [CrossRef] [Green Version]
- Stafford, K.A.; Anderson, B.M.; Sorenson, J.; van den Bedem, H. AtomNet PoseRanker: Enriching Ligand Pose Quality for Dynamic Proteins in Virtual High-Throughput Screens. J. Chem. Inf. Model. 2022, 62, 1178–1189. [Google Scholar] [CrossRef]
- Rollinger, J.M.; Stuppner, H.; Langer, T. Virtual screening for the discovery of bioactive natural products. Nat. Compd. Drugs Vol. I 2008, 211–249. [Google Scholar] [CrossRef]
- Sterling, T.; Irwin, J.J. ZINC 15–ligand discovery for everyone. J. Chem. Inf. Model. 2015, 55, 2324–2337. [Google Scholar] [CrossRef]
- Irwin, J.J.; Shoichet, B.K. ZINC− a free database of commercially available compounds for virtual screening. J. Chem. Inf. Model. 2005, 45, 177–182. [Google Scholar] [CrossRef] [Green Version]
- Wishart, D.S.; Feunang, Y.D.; Guo, A.C.; Lo, E.J.; Marcu, A.; Grant, J.R.; Sajed, T.; Johnson, D.; Li, C.; Sayeeda, Z. DrugBank 5.0: A major update to the DrugBank database for 2018. Nucleic Acids Res. 2018, 46, D1074–D1082. [Google Scholar] [CrossRef]
- Cuesta, S.A.; Mora, J.R.; Márquez, E.A. In silico screening of the DrugBank database to search for possible drugs against SARS-CoV-2. Molecules 2021, 26, 1100. [Google Scholar] [CrossRef] [PubMed]
- Wishart, D.S.; Knox, C.; Guo, A.C.; Shrivastava, S.; Hassanali, M.; Stothard, P.; Chang, Z.; Woolsey, J. DrugBank: A comprehensive resource for in silico drug discovery and exploration. Nucleic Acids Res. 2006, 34, D668–D672. [Google Scholar] [CrossRef] [PubMed]
- Wishart, D.S.; Tzur, D.; Knox, C.; Eisner, R.; Guo, A.C.; Young, N.; Cheng, D.; Jewell, K.; Arndt, D.; Sawhney, S. HMDB: The human metabolome database. Nucleic Acids Res. 2007, 35, D521–D526. [Google Scholar] [CrossRef] [PubMed]
- Wishart, D.S.; Feunang, Y.D.; Marcu, A.; Guo, A.C.; Liang, K.; Vázquez-Fresno, R.; Sajed, T.; Johnson, D.; Li, C.; Karu, N. HMDB 4.0: The human metabolome database for 2018. Nucleic Acids Res. 2018, 46, D608–D617. [Google Scholar] [CrossRef] [PubMed]
- Wishart, D.S.; Guo, A.; Oler, E.; Wang, F.; Anjum, A.; Peters, H.; Dizon, R.; Sayeeda, Z.; Tian, S.; Lee, B.L. HMDB 5.0: The Human Metabolome Database for 2022. Nucleic Acids Res. 2022, 50, D622–D631. [Google Scholar] [CrossRef]
- Sardanelli, A.M.; Isgrò, C.; Palese, L.L. SARS-CoV-2 main protease active site ligands in the human metabolome. Molecules 2021, 26, 1409. [Google Scholar] [CrossRef]
- Liu, Y.; Grimm, M.; Dai, W.-t.; Hou, M.-c.; Xiao, Z.-X.; Cao, Y. CB-Dock: A web server for cavity detection-guided protein–ligand blind docking. Acta Pharmacol. Sin. 2020, 41, 138–144. [Google Scholar] [CrossRef]
- Zhang, W.; Bell, E.W.; Yin, M.; Zhang, Y. EDock: Blind protein–ligand docking by replica-exchange monte carlo simulation. J. Cheminform. 2020, 12, 1–17. [Google Scholar] [CrossRef]
- Rooklin, D.; Wang, C.; Katigbak, J.; Arora, P.S.; Zhang, Y. AlphaSpace: Fragment-centric topographical mapping to target protein–protein interaction interfaces. J. Chem. Inf. Model. 2015, 55, 1585–1599. [Google Scholar] [CrossRef] [Green Version]
- Katigbak, J.; Li, H.; Rooklin, D.; Zhang, Y. AlphaSpace 2.0: Representing Concave Biomolecular Surfaces Using β-Clusters. J. Chem. Inf. Model. 2020, 60, 1494–1508. [Google Scholar] [CrossRef]
- Ngan, C.H.; Bohnuud, T.; Mottarella, S.E.; Beglov, D.; Villar, E.A.; Hall, D.R.; Kozakov, D.; Vajda, S. FTMAP: Extended protein mapping with user-selected probe molecules. Nucleic Acids Res. 2012, 40, W271–W275. [Google Scholar] [CrossRef] [PubMed]
- Schmidtke, P.; Bidon-Chanal, A.; Luque, F.J.; Barril, X. MDpocket: Open-source cavity detection and characterization on molecular dynamics trajectories. Bioinformatics 2011, 27, 3276–3285. [Google Scholar] [CrossRef] [Green Version]
- Schmidtke, P.; Le Guilloux, V.; Maupetit, J.; Tuffï¿ ½ry, P. Fpocket: Online tools for protein ensemble pocket detection and tracking. Nucleic Acids Res. 2010, 38, W582–W589. [Google Scholar] [CrossRef] [PubMed] [Green Version]
- Halgren, T.A. Identifying and characterizing binding sites and assessing druggability. J. Chem. Inf. Model. 2009, 49, 377–389. [Google Scholar] [CrossRef] [PubMed]
- Wagner, J.R.; Lee, C.T.; Durrant, J.D.; Malmstrom, R.D.; Feher, V.A.; Amaro, R.E. Emerging computational methods for the rational discovery of allosteric drugs. Chem. Rev. 2016, 116, 6370–6390. [Google Scholar] [CrossRef]
- Oleinikovas, V.; Saladino, G.; Cossins, B.P.; Gervasio, F.L. Understanding cryptic pocket formation in protein targets by enhanced sampling simulations. JACS 2016, 138, 14257–14263. [Google Scholar] [CrossRef] [Green Version]
- Bas, D.C.; Rogers, D.M.; Jensen, J.H. Very fast prediction and rationalization of pKa values for protein–ligand complexes. Proteins: Struct. Funct. Bioinform. 2008, 73, 765–783. [Google Scholar] [CrossRef]
- Anandakrishnan, R.; Aguilar, B.; Onufriev, A.V. H++ 3.0: Automating p K prediction and the preparation of biomolecular structures for atomistic molecular modeling and simulations. Nucleic Acids Res. 2012, 40, W537–W541. [Google Scholar] [CrossRef] [Green Version]
- Ten Brink, T.; Exner, T.E. pKa based protonation states and microspecies for protein—Ligand docking. J. Comput. Aided Mol. Des. 2010, 24, 935–942. [Google Scholar] [CrossRef] [Green Version]
- Dolinsky, T.J.; Nielsen, J.E.; McCammon, J.A.; Baker, N.A. PDB2PQR: An automated pipeline for the setup of Poisson–Boltzmann electrostatics calculations. Nucleic Acids Res. 2004, 32, W665–W667. [Google Scholar] [CrossRef]
- Dolinsky, T.J.; Czodrowski, P.; Li, H.; Nielsen, J.E.; Jensen, J.H.; Klebe, G.; Baker, N.A. PDB2PQR: Expanding and upgrading automated preparation of biomolecular structures for molecular simulations. Nucleic Acids Res. 2007, 35, W522–W525. [Google Scholar] [CrossRef] [PubMed]
- Lie, M.A.; Thomsen, R.; Pedersen, C.N.; Schiøtt, B.; Christensen, M.H. Molecular docking with ligand attached water molecules. J. Chem. Inf. Model. 2011, 51, 909–917. [Google Scholar] [CrossRef] [PubMed]
- Kumar, A.; Zhang, K.Y. Investigation on the effect of key water molecules on docking performance in CSARdock exercise. J. Chem. Inf. Model. 2013, 53, 1880–1892. [Google Scholar] [CrossRef] [PubMed]
- Murphy, R.B.; Repasky, M.P.; Greenwood, J.R.; Tubert-Brohman, I.; Jerome, S.; Annabhimoju, R.; Boyles, N.A.; Schmitz, C.D.; Abel, R.; Farid, R. WScore: A flexible and accurate treatment of explicit water molecules in ligand—Receptor docking. J. Med. Chem. 2016, 59, 4364–4384. [Google Scholar] [CrossRef] [PubMed]
- Santos-Martins, D.; Forli, S.; Ramos, M.J.; Olson, A.J. AutoDock4Zn: An improved AutoDock force field for small-molecule docking to zinc metalloproteins. J. Chem. Inf. Model. 2014, 54, 2371–2379. [Google Scholar] [CrossRef] [Green Version]
- Weininger, D. SMILES, a chemical language and information system. 1. Introduction to methodology and encoding rules. J. Chem. Inf. Comput. Sci. 1988, 28, 31–36. [Google Scholar] [CrossRef]
- Landrum, G. RDKit: A software suite for cheminformatics, computational chemistry, and predictive modeling. 2013. [Google Scholar]
- Bento, A.P.; Hersey, A.; Félix, E.; Landrum, G.; Gaulton, A.; Atkinson, F.; Bellis, L.J.; De Veij, M.; Leach, A.R. An open source chemical structure curation pipeline using RDKit. J. Cheminform. 2020, 12, 1–16. [Google Scholar] [CrossRef]
- O’Boyle, N.M.; Banck, M.; James, C.A.; Morley, C.; Vandermeersch, T.; Hutchison, G.R. Open Babel: An open chemical toolbox. J. Cheminform. 2011, 3, 1–14. [Google Scholar] [CrossRef] [Green Version]
- Hawkins, P.C.; Skillman, A.G.; Warren, G.L.; Ellingson, B.A.; Stahl, M.T. Conformer generation with OMEGA: Algorithm and validation using high quality structures from the Protein Databank and Cambridge Structural Database. J. Chem. Inf. Model. 2010, 50, 572–584. [Google Scholar] [CrossRef]
- Hawkins, P.C.; Nicholls, A. Conformer generation with OMEGA: Learning from the data set and the analysis of failures. J. Chem. Inf. Model. 2012, 52, 2919–2936. [Google Scholar] [CrossRef]
- Watts, K.S.; Dalal, P.; Murphy, R.B.; Sherman, W.; Friesner, R.A.; Shelley, J.C. ConfGen: A conformational search method for efficient generation of bioactive conformers. J. Chem. Inf. Model. 2010, 50, 534–546. [Google Scholar] [CrossRef] [PubMed]
- Huey, R.; Morris, G.M. Using AutoDock 4 with AutoDocktools: A tutorial. Scripps Res. Inst. USA 2008, 8, 54–56. [Google Scholar]
- Ren, X.; Shi, Y.-S.; Zhang, Y.; Liu, B.; Zhang, L.-H.; Peng, Y.-B.; Zeng, R. Novel consensus docking strategy to improve ligand pose prediction. J. Chem. Inf. Model. 2018, 58, 1662–1668. [Google Scholar] [CrossRef] [PubMed]
- Marcou, G.; Rognan, D. Optimizing fragment and scaffold docking by use of molecular interaction fingerprints. J. Chem. Inf. Model. 2007, 47, 195–207. [Google Scholar] [CrossRef]
- Bouvier, G.; Evrard-Todeschi, N.; Girault, J.-P.; Bertho, G. Automatic clustering of docking poses in virtual screening process using self-organizing map. Bioinformatics 2010, 26, 53–60. [Google Scholar] [CrossRef] [Green Version]
- Charifson, P.S.; Corkery, J.J.; Murcko, M.A.; Walters, W.P. Consensus scoring: A method for obtaining improved hit rates from docking databases of three-dimensional structures into proteins. J. Med. Chem. 1999, 42, 5100–5109. [Google Scholar] [CrossRef]
- Adeshina, Y.O.; Deeds, E.J.; Karanicolas, J. Machine learning classification can reduce false positives in structure-based virtual screening. Proc. Natl. Acad. Sci. USA 2020, 117, 18477–18488. [Google Scholar] [CrossRef]
- Yasuo, N.; Sekijima, M. Improved method of structure-based virtual screening via interaction-energy-based learning. J. Chem. Inf. Model. 2019, 59, 1050–1061. [Google Scholar] [CrossRef] [Green Version]
- Su, M.; Feng, G.; Liu, Z.; Li, Y.; Wang, R. Tapping on the black box: How is the scoring power of a machine-learning scoring function dependent on the training set? J. Chem. Inf. Model. 2020, 60, 1122–1136. [Google Scholar] [CrossRef]
- Kuzmanic, A.; Bowman, G.R.; Juarez-Jimenez, J.; Michel, J.; Gervasio, F.L. Investigating cryptic binding sites by molecular dynamics simulations. Acc. Chem. Res. 2020, 53, 654–661. [Google Scholar] [CrossRef]
- Sgobba, M.; Caporuscio, F.; Anighoro, A.; Portioli, C.; Rastelli, G. Application of a post-docking procedure based on MM-PBSA and MM-GBSA on single and multiple protein conformations. Eur. J. Med. Chem. 2012, 58, 431–440. [Google Scholar] [CrossRef] [PubMed]
- Kumar, K.; Anbarasu, A.; Ramaiah, S. Molecular docking and molecular dynamics studies on β-lactamases and penicillin binding proteins. Mol. BioSyst. 2014, 10, 891–900. [Google Scholar] [CrossRef] [PubMed]
- Zhou, H.; Cao, H.; Skolnick, J. FRAGSITE: A fragment-based approach for virtual ligand screening. J. Chem. Inf. Model. 2021, 61, 2074–2089. [Google Scholar] [CrossRef] [PubMed]
- Tran-Nguyen, V.-K.; Bret, G.; Rognan, D. True Accuracy of Fast Scoring Functions to Predict High-Throughput Screening Data from Docking Poses: The Simpler the Better. J. Chem. Inf. Model. 2021, 61, 2788–2797. [Google Scholar] [CrossRef] [PubMed]
- Gawehn, E.; Hiss, J.A.; Schneider, G. Deep learning in drug discovery. Mol. Inform. 2016, 35, 3–14. [Google Scholar] [CrossRef]
- Labbé, C.M.; Rey, J.; Lagorce, D.; Vavruša, M.; Becot, J.; Sperandio, O.; Villoutreix, B.O.; Tufféry, P.; Miteva, M.A. MTiOpenScreen: A web server for structure-based virtual screening. Nucleic Acids Res. 2015, 43, W448–W454. [Google Scholar] [CrossRef] [Green Version]
- Gentile, F.; Yaacoub, J.C.; Gleave, J.; Fernandez, M.; Ton, A.-T.; Ban, F.; Stern, A.; Cherkasov, A. Artificial intelligence–enabled virtual screening of ultra-large chemical libraries with deep docking. Nat. Protoc. 2022, 17, 672–697. [Google Scholar] [CrossRef]


| ML Algorithm | Name | Input Features | Dataset | Year |
|---|---|---|---|---|
| RF | RF-score [99] | Protein–ligand atom-type pair counts in predefined distance cutoff | PDBbind v2007 | 2010 |
| SFCscoreRF [100] | Descriptors of ligand-dependent, specific interactions, surface area | PDBbind v2007 | 2013 | |
| ΔVinaRF20 [101] | Vina empirical terms, surface area terms | PDBbind v2014 CSAR dataset | 2017 | |
| XGB | ΔVinaXGB [102] | Vina empirical terms, surface area terms, ligand stability terms, bridge water terms | PDBbind v2016 CSAR dataset | 2019 |
| ΔLinF9XGB [103] | A series of gauss terms characterizing protein–ligand interactions, surface area terms, ligand descriptors, bridge water terms and pocket features | PDBbind CSAR dataset BindingDB | 2022 | |
| ERT | ET-score [104] | Distance-weighted interatomic contacts between protein and ligand | PDBbind v2016 | 2021 |
| GBT | AGL-Score [105] | Algebraic graph theory-based features of protein–ligand complex | PDBbind | 2019 |
| ECIF-GBT [106] | Protein–ligand atom-type pair counts considering each atom connectivity | PDBbind v2016 | 2021 | |
| NN | NNScore 1.0 [107] | Descriptors of specific interactions and ligand-dependent | MOAD PDBbind | 2010 |
| NNScore 2.0 [108] | Vina empirical terms, protein–ligand atom-type pair counts in predefined distance cutoff | MOAD PDBbind | 2011 | |
| CNN | AtomNet [109] | Local structure-based 3D grid from protein–ligand structures | DUD-E | 2017 |
| Pafnucy [110] | Atom property-based 3D grid from protein–ligand structures | PDBbind v2016 | 2017 | |
| Kdeep [111] | Atom type-based 3D grid from protein–ligand structures | PDBbind v2016 | 2018 | |
| OnionNet [112] | Rotation-free element-pair specific contacts between protein and ligand atoms in different distance ranges | PDBbind v2016 | 2019 | |
| GNN | PotentialNet [113] | Atom node feature and distance matrix | PDBbind v2007 | 2018 |
| graphDelta [114] | Atom node features considering local environment and distance matrix | PDBbind v2018 | 2020 | |
| SIGN [115] | Distance matrix of atom nodes and angle matrix of bond edges | PDBbind v2016 | 2021 |
Publisher’s Note: MDPI stays neutral with regard to jurisdictional claims in published maps and institutional affiliations. |
© 2022 by the authors. Licensee MDPI, Basel, Switzerland. This article is an open access article distributed under the terms and conditions of the Creative Commons Attribution (CC BY) license (https://creativecommons.org/licenses/by/4.0/).
Share and Cite
Yang, C.; Chen, E.A.; Zhang, Y. Protein–Ligand Docking in the Machine-Learning Era. Molecules 2022, 27, 4568. https://doi.org/10.3390/molecules27144568
Yang C, Chen EA, Zhang Y. Protein–Ligand Docking in the Machine-Learning Era. Molecules. 2022; 27(14):4568. https://doi.org/10.3390/molecules27144568
Chicago/Turabian StyleYang, Chao, Eric Anthony Chen, and Yingkai Zhang. 2022. "Protein–Ligand Docking in the Machine-Learning Era" Molecules 27, no. 14: 4568. https://doi.org/10.3390/molecules27144568
APA StyleYang, C., Chen, E. A., & Zhang, Y. (2022). Protein–Ligand Docking in the Machine-Learning Era. Molecules, 27(14), 4568. https://doi.org/10.3390/molecules27144568