
Structure, Spectra and Photochemistry of 2-Amino-4-Methylthiazole: FTIR Matrix Isolation and Theoretical Studies


Abstract
:
1. Introduction
2. Results and Discussion
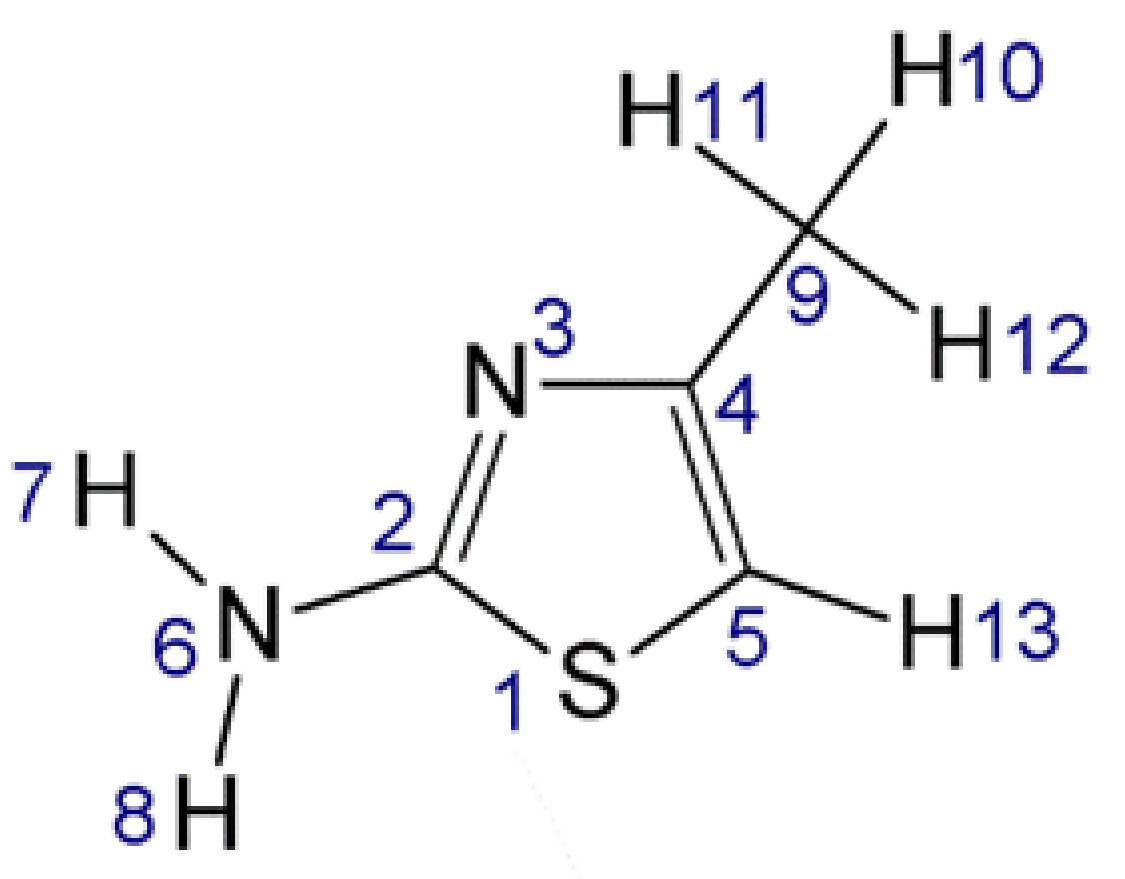
2.1. Structure and Energetics
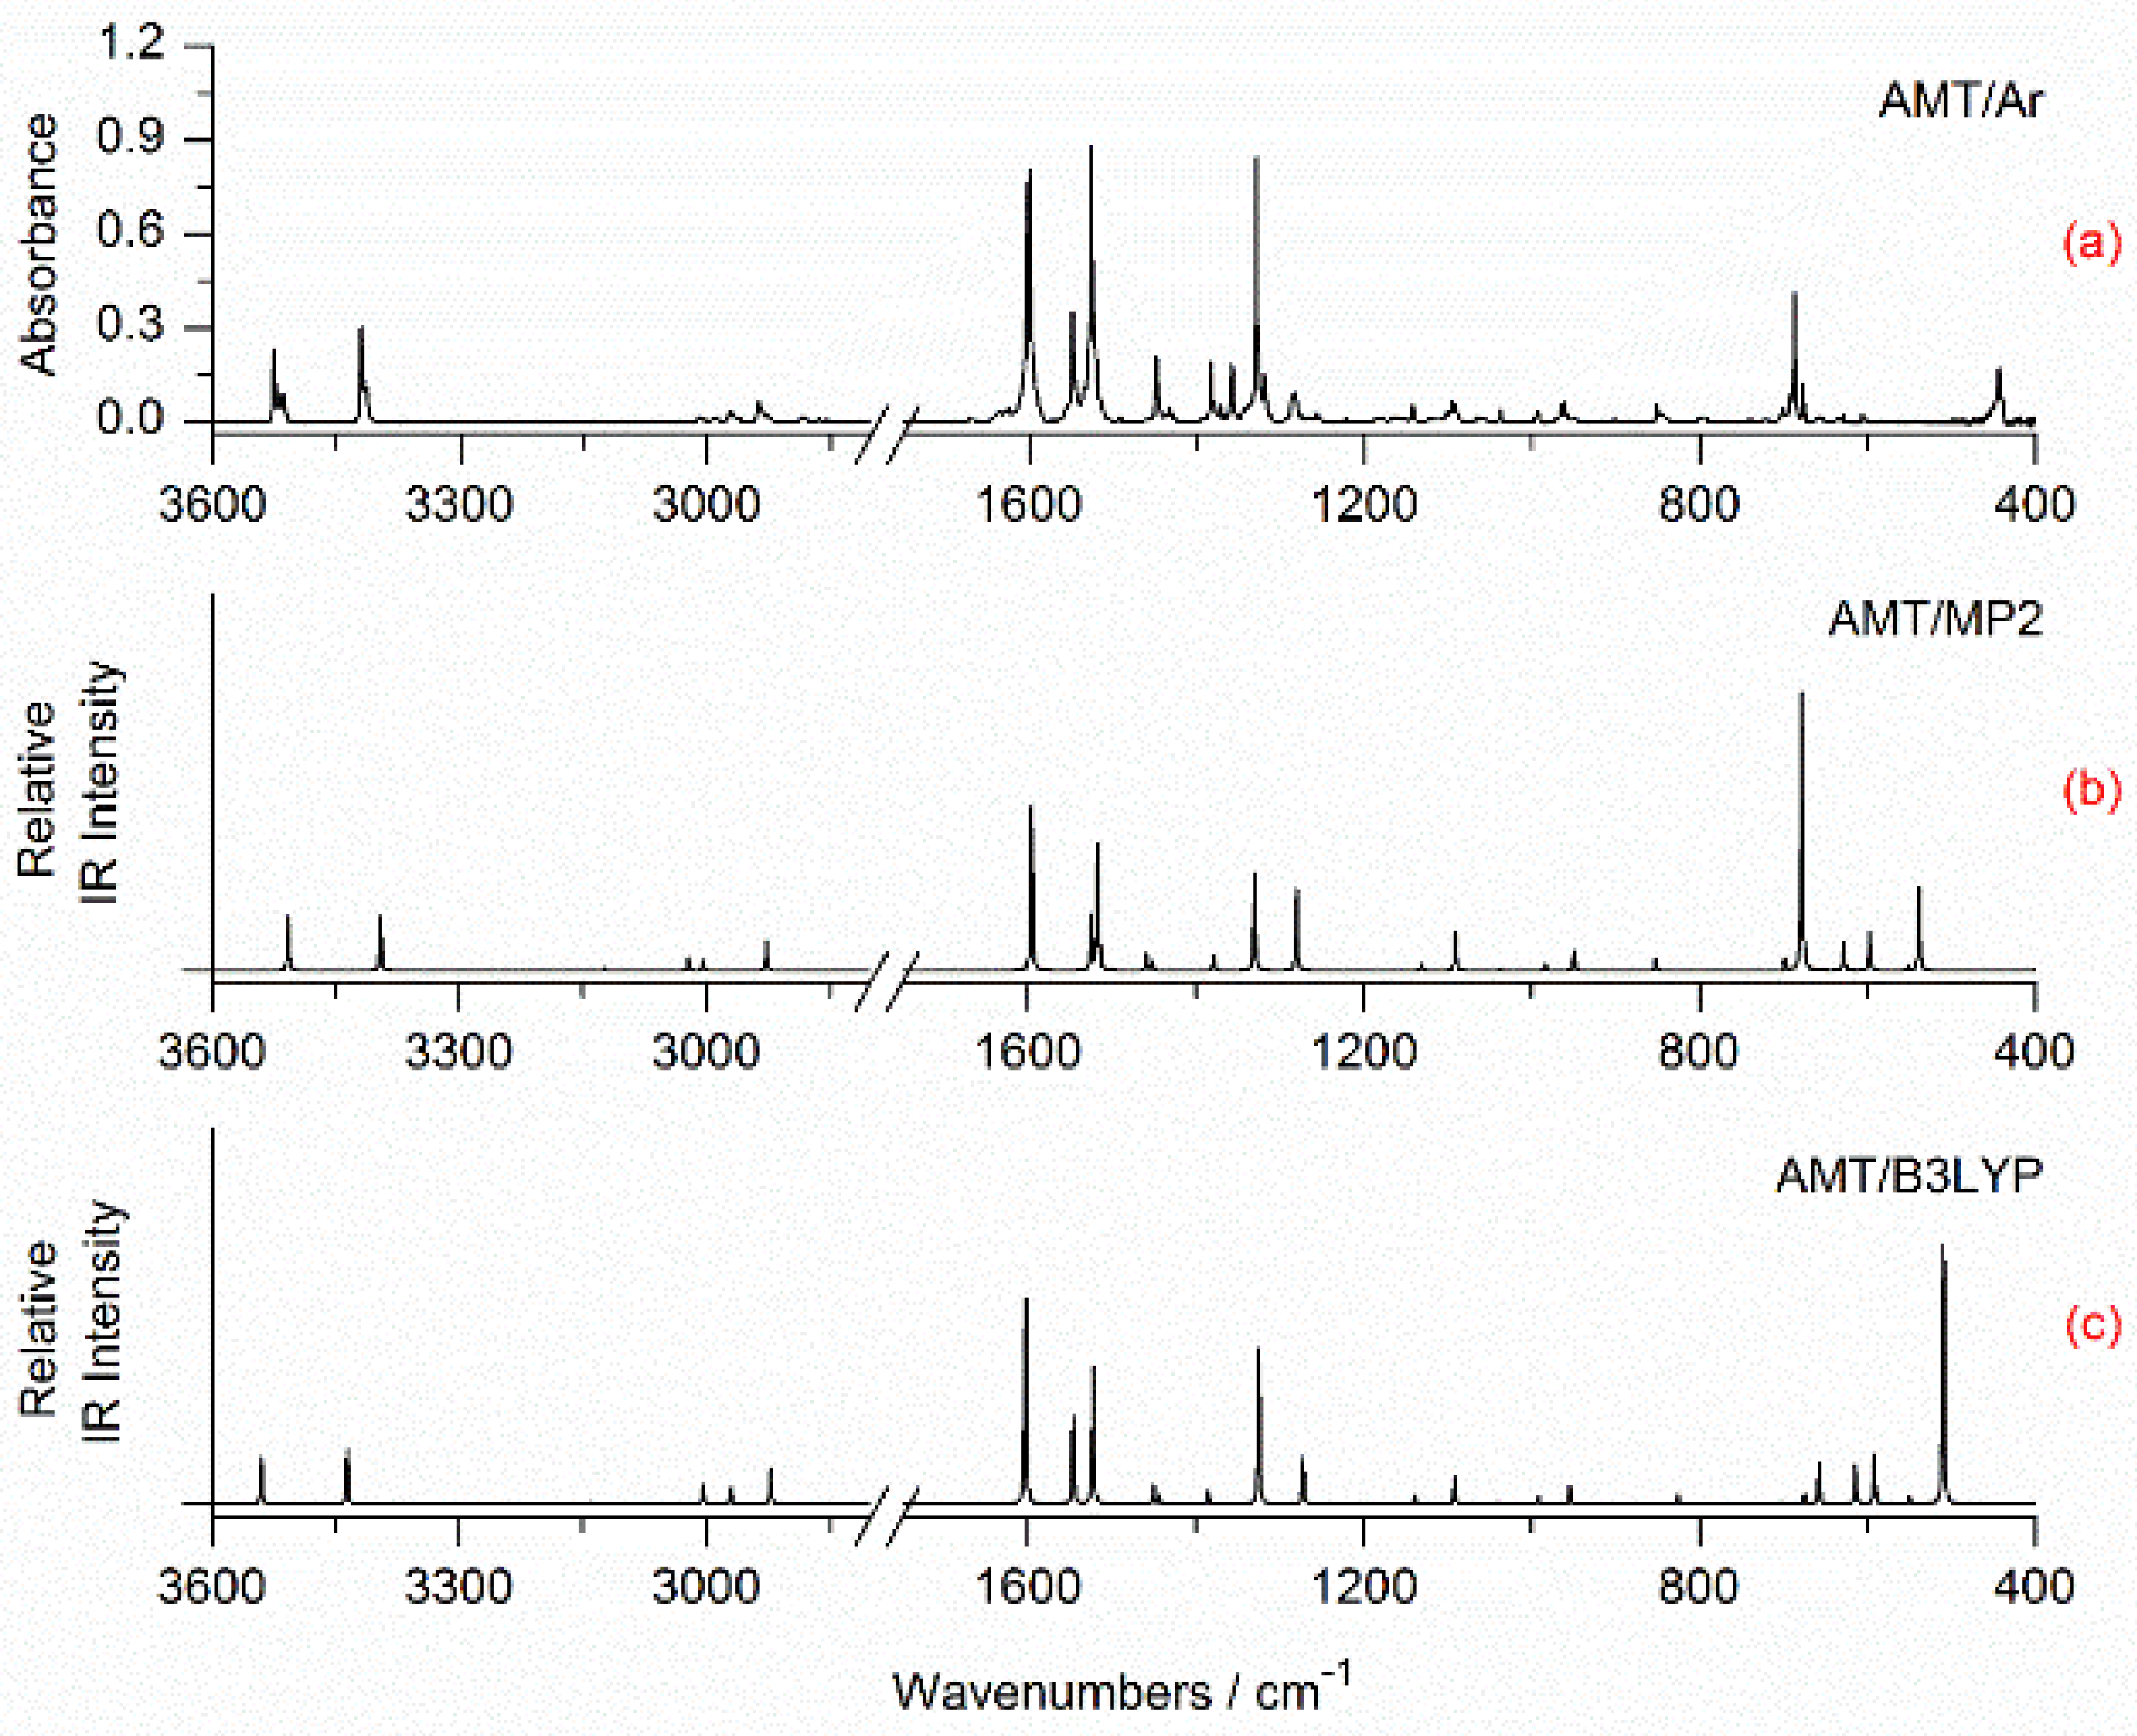
2.2. Matrix Isolation Spectra of AMT
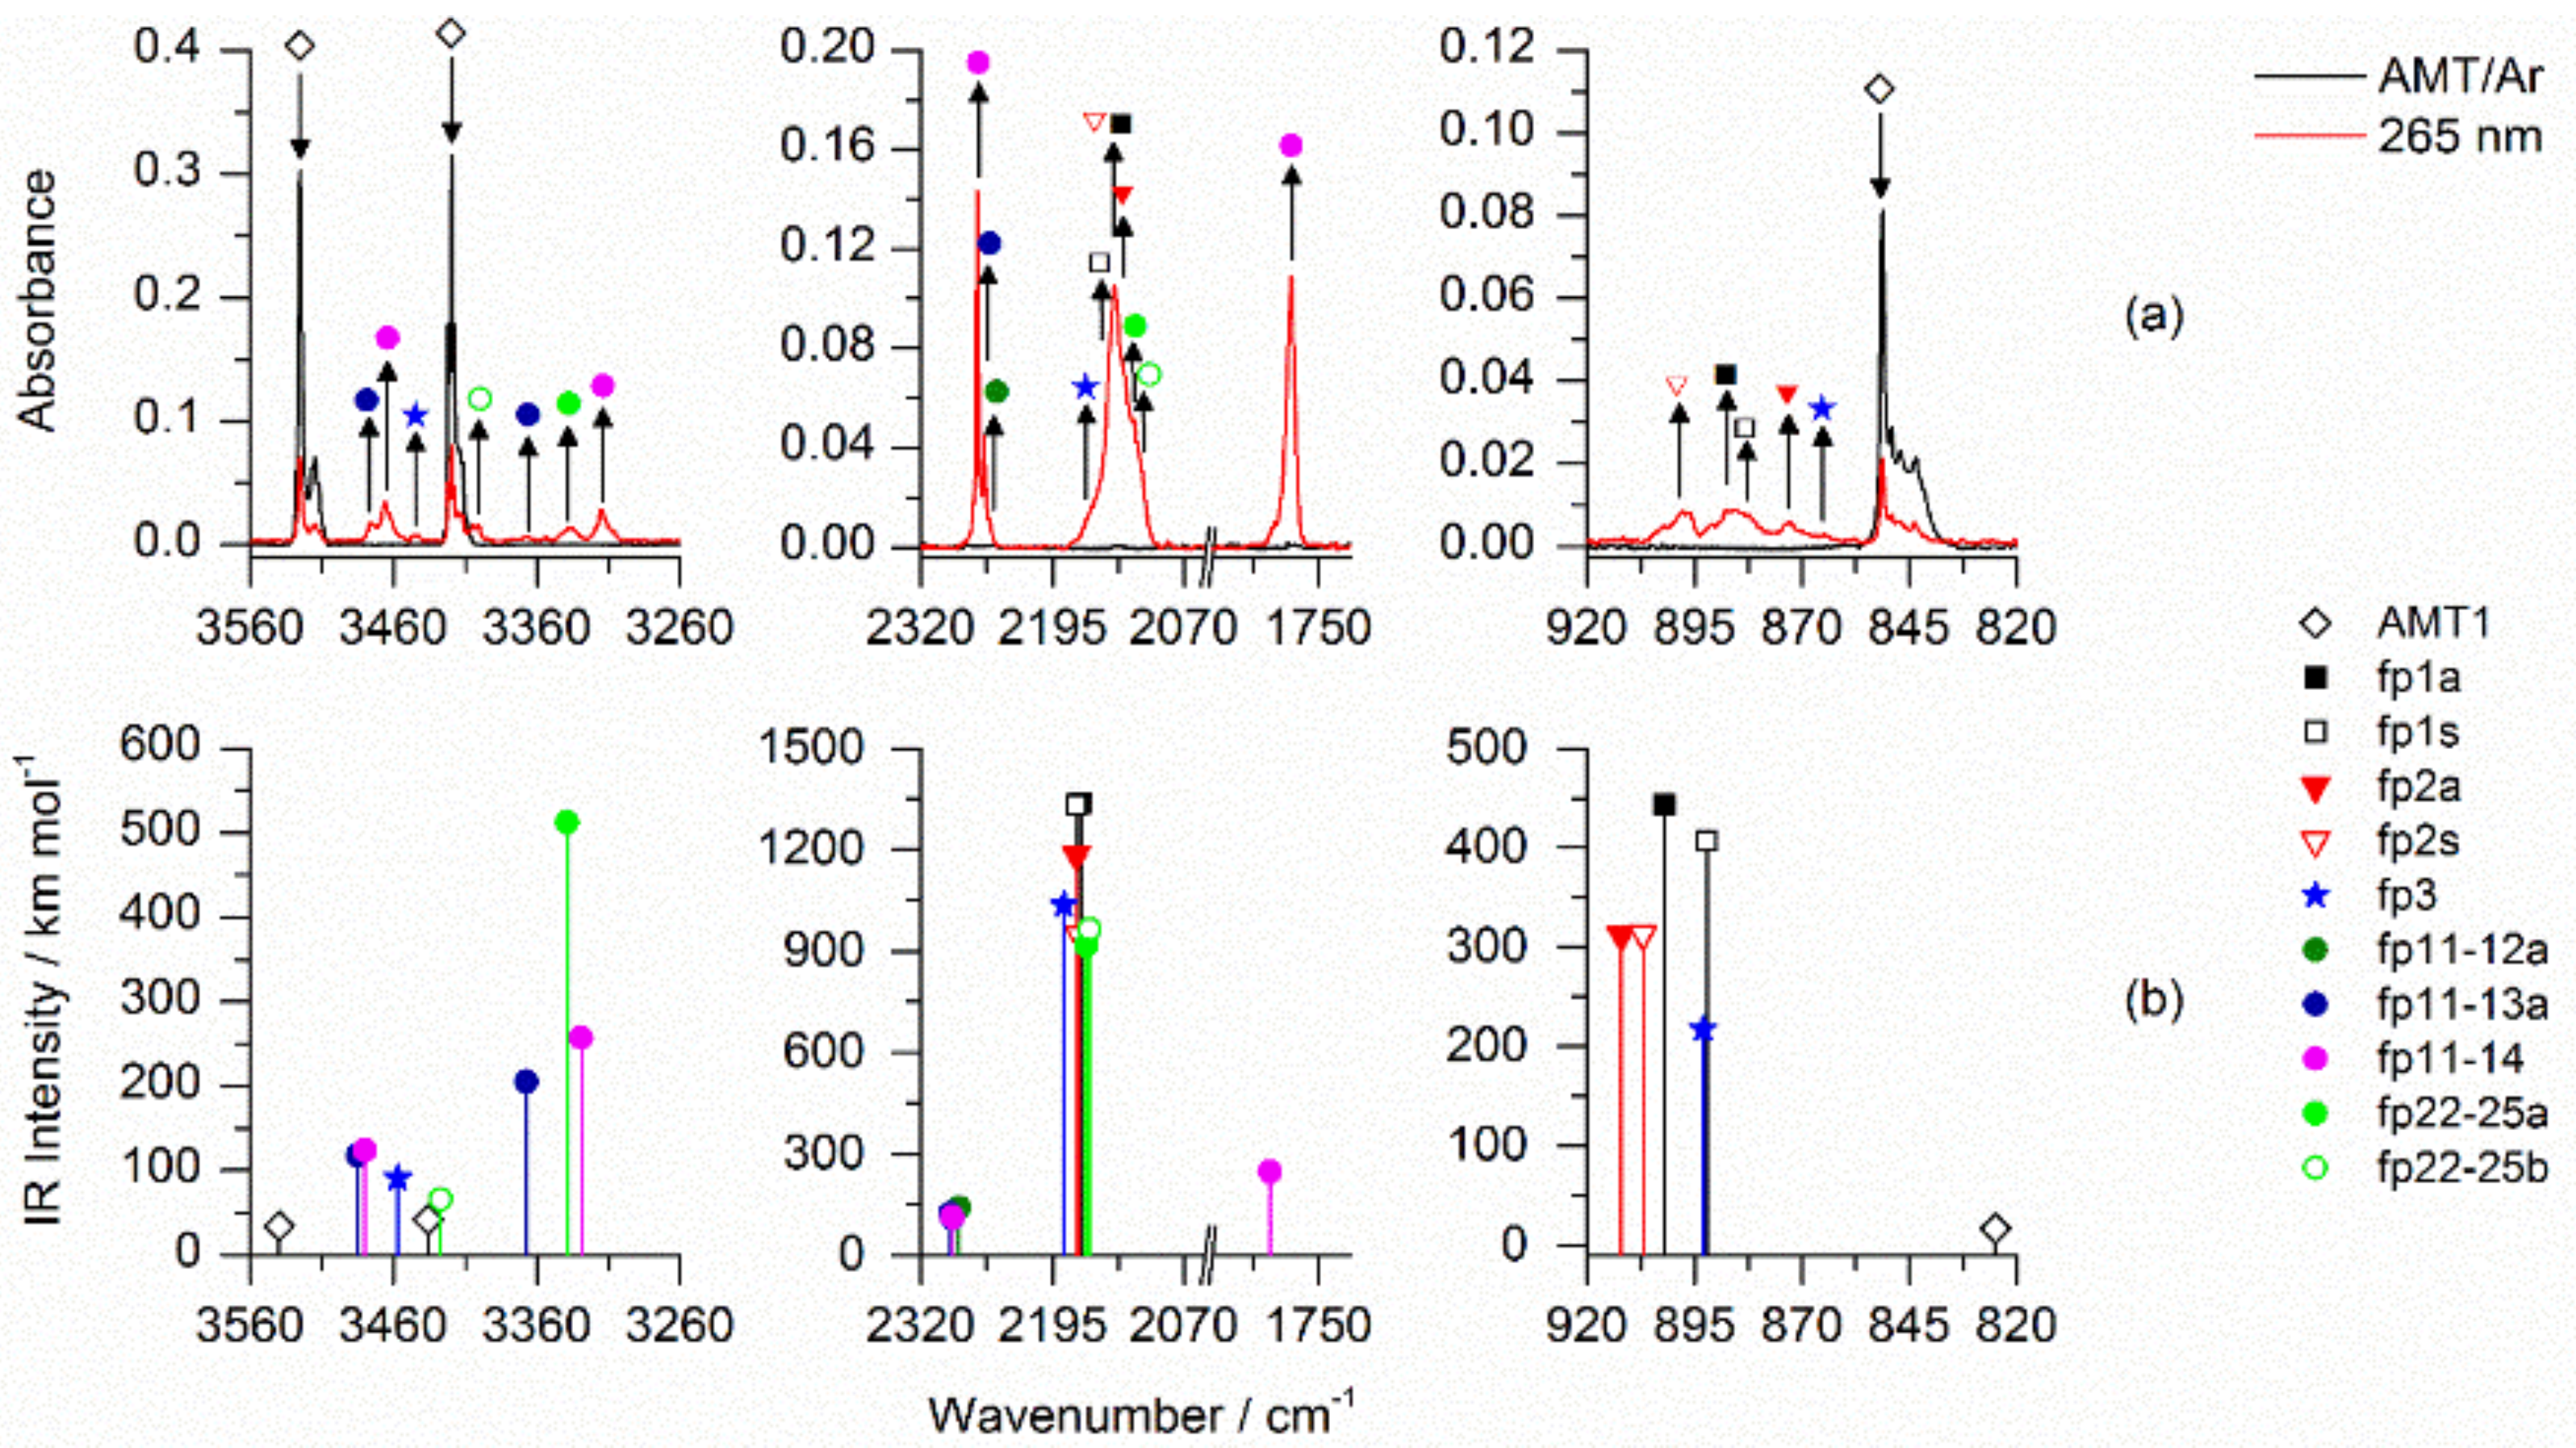
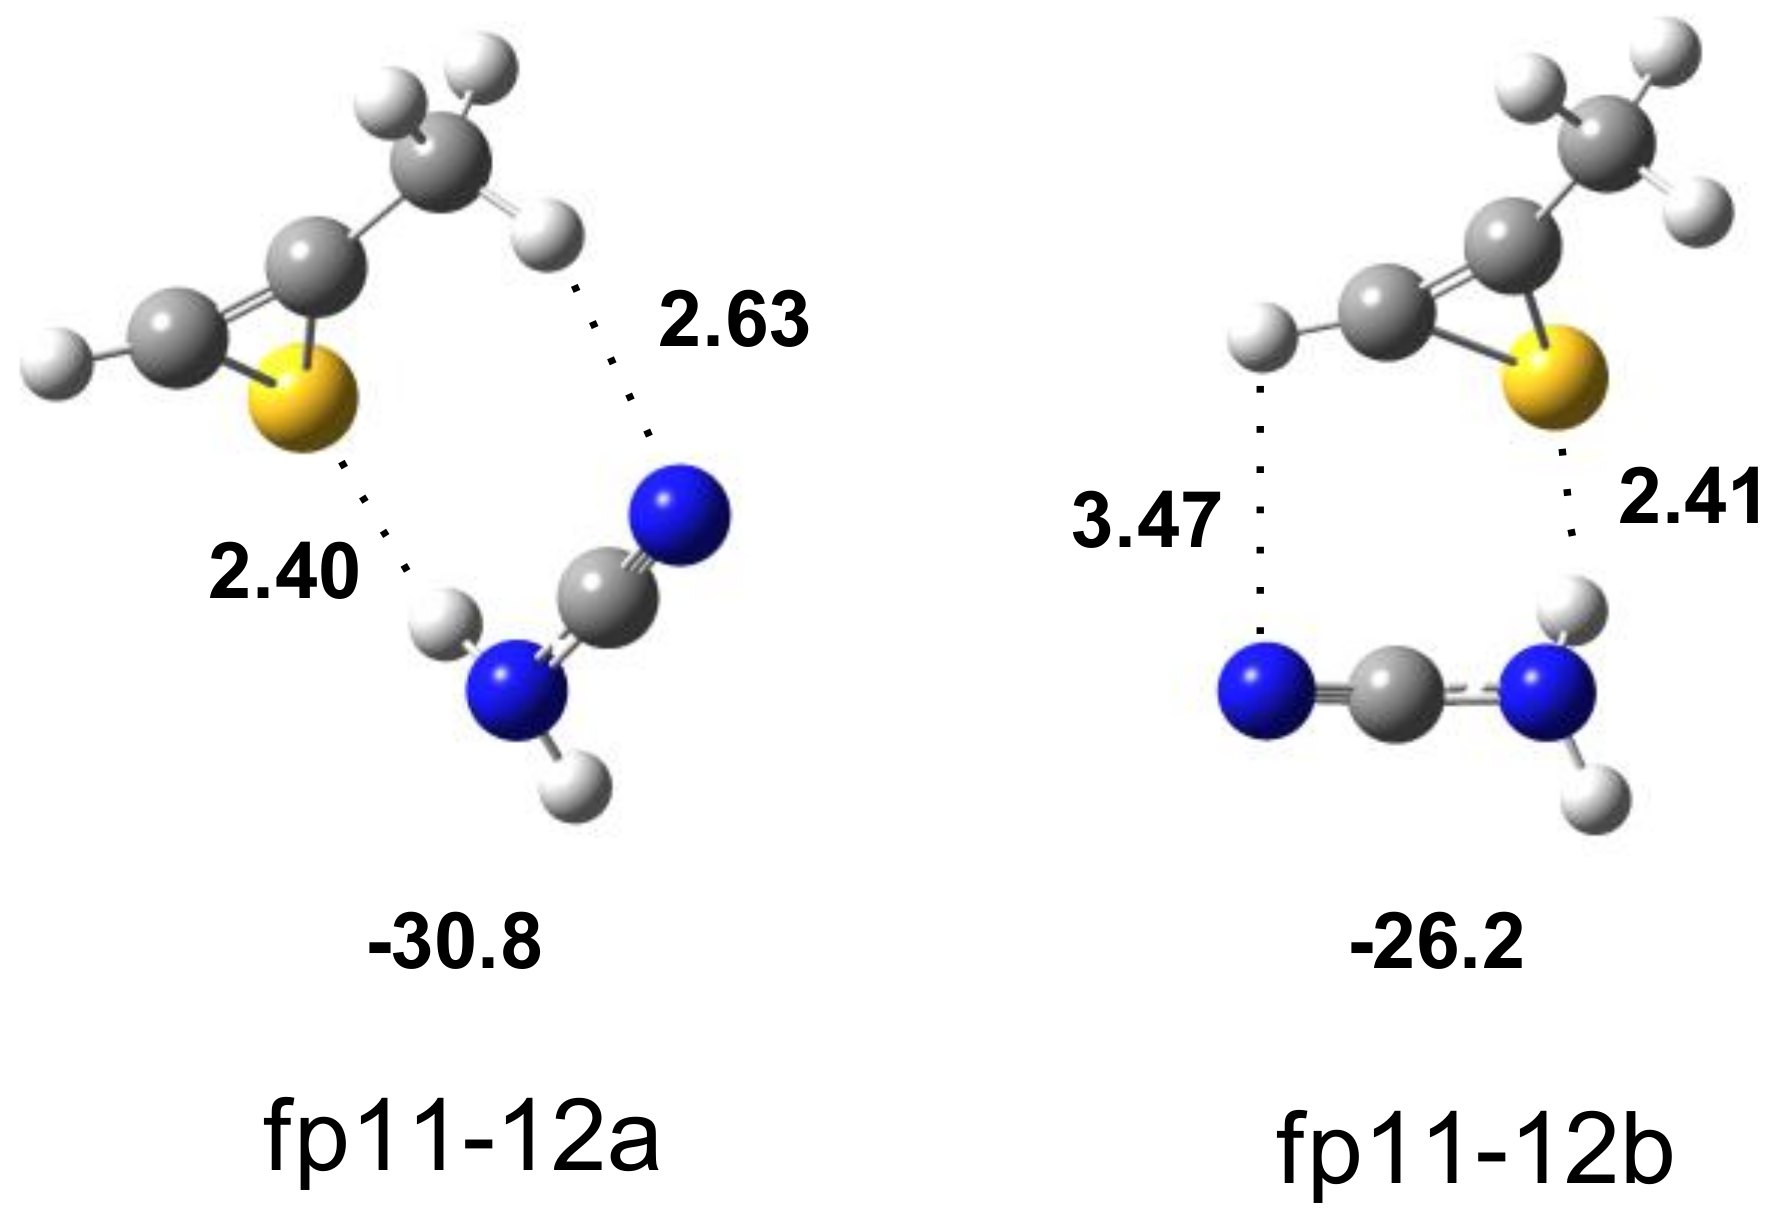
2.3. Photolysis
3. Materials and Methods
4. Conclusions
Supplementary Materials
Author Contributions
Funding
Institutional Review Board Statement
Informed Consent Statement
Data Availability Statement
Acknowledgments
Conflicts of Interest
Sample Availability
References
- Petrou, A.; Fesatidou, M.; Geronikaki, A. Thiazole ring—A biologically active scaffold. Molecules 2021, 26, 3166. [Google Scholar] [CrossRef] [PubMed]
- Siddiqui, N.; Arshad, M.F.; Ahsan, W.; Alam, M.S. Thiazoles: A valuable insight into the recent advances and biological activities. Int. J. Pharm. Sci. Drug Res. 2009, 1, 136–143. [Google Scholar]
- Chhabria, M.T.; Patel, S.; Modi, P.; Brahmkshatriya, P.S. Thiazole: A Review on Chemistry, Synthesis and Therapeutic Importance of its Derivatives. Curr. Top. Med. Chem. 2016, 16, 2841–2862. [Google Scholar] [CrossRef] [PubMed]
- Bettendorff, L.; Wins, P. Encyclopedia of Biological Chemistry III, 3rd ed.; Jez, J., Ed.; Elsevier Inc.: Amsterdam, The Netherlands, 2021; Volume 1, pp. 302–313. ISBN 9780128194607. [Google Scholar]
- Frank, R.A.W.; Leeper, F.J.; Luisi, B.F. Structure, mechanism and catalytic duality of thiamine-dependent enzymes. Cell. Mol. Life Sci. 2007, 64, 892–905. [Google Scholar] [CrossRef]
- Elsadek, M.F.; Ahmed, B.M.; Farahat, M.F. An overview on synthetic 2-aminothiazole-based compounds associated with four biological activities. Molecules 2021, 26, 1449. [Google Scholar] [CrossRef]
- Alizadeh, S.R.; Hashemi, S.M. Development and therapeutic potential of 2-aminothiazole derivatives in anticancer drug discovery. Med. Chem. Res. 2021, 30, 771–806. [Google Scholar] [CrossRef]
- Wan, Y.; Long, J.; Gao, H.; Tang, Z. 2-aminothiazole: A privileged scaffold for the discovery of anti-cancer agents. Eur. J. Med. Chem. 2021, 210, 112953. [Google Scholar] [CrossRef]
- Islam, S.; Powner, M. Prebiotic Systems Chemistry: Complexity Overcoming Clutter. Chem 2017, 2, 470–501. [Google Scholar] [CrossRef] [Green Version]
- Bacchus-Montabonel, M.-C. Role of sulfur in proton-induced collisions of RNA prebiotic precursors. Phys. Chem. Chem. Phys. 2019, 21, 1428–1434. [Google Scholar] [CrossRef]
- Todd, Z.R.; Szabla, R.; Szostak, J.W.; Sasselov, D.D. UV photostability of three 2-aminoazoles with key roles in prebiotic chemistry on the early earth. Chem. Comm. 2019, 55, 10388–10391. [Google Scholar] [CrossRef] [Green Version]
- Islam, S.; Bučar, D.K.; Powner, M.W. Prebiotic selection and assembly of proteinogenic amino acids and natural nucleotides from complex mixtures. Nat. Chem. 2017, 9, 584–589. [Google Scholar] [CrossRef]
- Pawda, A. Rearrangements in Ground and Excited States; Academic Press: New York, NY, USA, 1980; pp. 501–549. ISBN 9781483218717. [Google Scholar]
- Venkatasubramanian, R.; Krishnamachari, S.L.N.G. Non-thermal rotational and vibrational excitation of CN produced in the flash photolysis of thiazole. Pramãṇa J. Phys. 1988, 30, 529–533. [Google Scholar] [CrossRef]
- Lago, A.F.; Januário, R.D.; Simon, M.; Dávalos, J.Z. VUV photodissociation of thiazole molecule investigated by TOF-MS and photoelectron photoion coincidence spectroscopy. J. Mass. Spectrom. 2014, 49, 1163–1170. [Google Scholar] [CrossRef] [PubMed]
- Miyazaki, J.; Takiyama, H.; Nakata, M. Isocyano compounds newly recognized in photochemical reaction of thiazole: Matrix-isolation FT-IR and theoretical studies. RSC Adv. 2017, 7, 4960–4974. [Google Scholar] [CrossRef] [Green Version]
- Chang, J.; Romei, M.G.; Boxer, S.G. Structural evidence of photoisomerization pathways in fluorescent proteins. J. Am. Chem. Soc. 2019, 141, 15504–15505. [Google Scholar] [CrossRef]
- Liu, R.S.H.; Hammond, G.S. Examples of hula-twist in photochemical ci-trans isomerization. Chem. Eur. J. 2001, 7, 4536–4545. [Google Scholar] [CrossRef]
- Su, M.-D. A model study on the photochemical isomerization of isothiazoles and thiazoles. Phys. Chem. Chem. Phys. 2014, 16, 17030–17042. [Google Scholar] [CrossRef]
- D’Auria, M. An initio study on the photochemical isomerization of thiazole derivatives. Tetrahedron 2002, 58, 8037–8042. [Google Scholar] [CrossRef]
- Pagacz-Kostrzewa, M.; Sałdyka, M.; Bil, A.; Gul, W.; Wierzejewska, M.; Khomenko, D.M.; Doroschuk, R.O. Phototransformations of 2-(1,2,4-triazol-3-yl)benzoic acid in low temperature matrices. J. Phys. Chem. A 2019, 123, 841–850. [Google Scholar] [CrossRef]
- Pagacz-Kostrzewa, M.; Sałdyka, M.; Gul, W.; Wierzejewska, M.; Khomenko, D.M.; Doroschuk, R.O. Infrared spectra and photochemistry of 2-(tetrazol-5-yl)benzoic acid isolated in nitrogen matrices. J. Photochem. Photobiol. A Chem. 2019, 371, 292–299. [Google Scholar] [CrossRef]
- Lin-Vien, D.; Colthup, N.B.; Fateley, W.G.; Grasselli, J.G. The Handbook of Infrared and Raman Characteristic Frequencies of Organic Molecules, 1st ed.; Academic Press: San Diego, CA, USA, 1991; pp. 105–115. ISBN 9780080571164. [Google Scholar]
- Duvernay, F.; Chiavassa, T.; Borget, F.; Aycard, J.P. Carbodiimide production from cyanamide by UV irradiation and thermal reaction on amorphous water ice. J. Phys. Chem. A 2005, 109, 603–608. [Google Scholar] [CrossRef] [PubMed]
- King, S.T.; Strope, J.H. Infrared spectra of the argon matrix-isolated cyanamide, cyanamide-d2, and carbodiimide. J. Chem. Phys. 1971, 54, 1289–1295. [Google Scholar] [CrossRef]
- Korolev, V.A.; Baskir, E.G. IR spectroscopic study of thioacrolein and its photoisomerization to methylthioketene. Russ. Chem. Bull. 1995, 44, 448–454. [Google Scholar] [CrossRef]
- Harrison, J.A.; Frei, H. Visible light-induced oxygen transfer from nitrogen dioxide to ethyne and propyne in a cryogenic matrix. 1. Identification of products. J. Phys. Chem. 1994, 98, 12142–12151. [Google Scholar] [CrossRef]
- Araujo-Andrade, C.; Gómez-Zavaglia, A.; Reva, I.D.; Fausto, R. Conformers, infrared spectrum and UV-induced photochemistry of matrix-isolated furfuryl alcohol. J. Phys. Chem. A 2012, 116, 2352–2365. [Google Scholar] [CrossRef]
- Frisch, M.J.; Trucks, G.W.; Schlegel, H.B.; Scuseria, G.E.; Robb, M.A.; Cheeseman, J.R.; Scalmani, G.; Barone, V.; Mennucci, B. Gaussian 09, Revision D.01; Gaussian, Inc.: Wallingford, CT, USA, 2013. [Google Scholar]
- Irikura, K.K. Multiphoton Absorption Strengths from Simple Ab Initio Wavefunctions; National Institute of Standards and Technology: Gaithesburg, MD, USA, 1995. [Google Scholar]
- Boys, S.F.; Bernardi, F. The Calculation of small molecular interactions by the differences of separate total energies. Some procedures with reduced errors. Mol. Phys. 1970, 19, 553–566. [Google Scholar] [CrossRef]
- Sałdyka, M.; Mielke, Z. Photodecomposition of formohydroxamic acid. Matrix isolation FTIR and DFT studies. Phys. Chem. Chem. Phys. 2003, 5, 4790–4797. [Google Scholar] [CrossRef]
- Sałdyka, M. Photodecomposition of N-hydroxyurea in argon matrices. FTIR and theoretical studies. RSC Adv. 2013, 3, 1922–1932. [Google Scholar] [CrossRef]
- Sałdyka, M.; Mielke, Z. Photochemistry of acetohydroxamic acid in solid argon: FTIR and theoretical studies. J. Phys. Chem. A 2018, 122, 60–71. [Google Scholar] [CrossRef]
- Sałdyka, M.; Coussan, S. Infrared spectra and photodecomposition of benzohydroxamic acid isolated in argon matrices. J. Mol. Struct. 2020, 1219, 128506. [Google Scholar] [CrossRef]
- Ligterink, N.F.W.; El-Abd, S.J.; Brogan, C.L.; Hunter, T.R.; Remijan, A.J.; Garrod, R.T.; McGuire, B.M. The Family of Amide Molecules toward NGC 6334I. Astrophys. J. 2020, 901, 1–23. [Google Scholar] [CrossRef]
- Fuente, A.; García-Burillo, S.; Gerin, M.; Teyssier, D.; Usero, A.; Rizzo, J.R.; de Vicente, P. Photon-dominated Chemistry in the Nucleus of M82: Widespread HOC+ Emission in the Inner 650 Parsec Disk. Astrophys. J. 2005, 619, L155–L158. [Google Scholar] [CrossRef]


| Minima | ΔE | ΔEZPE | ΔG298.15 | %298 |
| AMT1 | 0.0 | 0.0 | 0.0 | 100 |
| AMT2 | 31.3 | 31.1 | 30.8 | 0 |
| AMT2′ | 45.3 | 44.1 | 43.8 | 0 |
| AMT3 | 42.5 | 41.3 | 40.3 | 0 |
| AMT3′ | 46.1 | 45.6 | 44.5 | 0 |
| AMT4 | 54.5 | 55.7 | 54.6 | 0 |
| AMT4′ | 68.5 | 68.9 | 68.0 | 0 |
| AMT5 | 44.4 | 44.5 | 42.6 | 0 |
| TS | ΔE | ΔEZPE | νi/cm−1 | |
| tsAMT(1-2) | 224.8 | 208.6 | 1965i | |
| tsAMT(1-5) | 379.3 | 360.3 | 1509i | |
| tsAMT(2-2′) | 77.9 | 72.1 | 850i | |
| tsAMT(2-4) | 363.0 | 343.6 | 1429i | |
| tsAMT(2′-4′) | 405.8 | 387.1 | 805i | |
| tsAMT(3′-3) | 87.8 | 86.0 | 1008i | |
| tsAMT(3-4′) | 342.0 | 324.8 | 2032i | |
| tsAMT(4-3′) | 285.0 | 266.9 | 2046i | |
| tsAMT(4-4′) | 88.0 | 80.8 | 951i | |
| tsAMT(5-4) | 211.0 | 195.4 | 1969i |
| B3LYP | MP2 | AMT/Ar | Approximate Description 4 | |||||
| Harmonic Calc | Scaled 2 Calc | Int | Harmonic Calc | Scaled Calc | Int | Exper | Int | |
| 3672 | 3540 | 34 3 | 3681 | 3508 | 38 | 3525.5 3515.0 | w | νasNH2 |
| 3564 | 3436 | 42 | 3563 | 3396 | 39 | 3419.5 3413.5 | m | νsNH2 |
| 3257 | 3140 | 1 | 3278 | 3124 | 1 | n.o. | n.o. | νCH |
| 3116 | 3004 | 15 | 3171 | 3022 | 9 | 3009.0 | vw | νasCH3 |
| 3081 | 2970 | 12 | 3151 | 3003 | 8 | 2971.5 | vw | νasCH3 |
| 3031 | 2922 | 27 | 3071 | 2927 | 22 | 2938.5 | vw | νsCH3 |
| 1639 | 1603 | 156 | 1641 | 1597 | 117 | 1600.5 | vs | δNH2 |
| 1581 | 1546 | 69 | 1567 | 1525 | 41 | 1547.5 1544.5 | m | Ring strech |
| 1557 | 1523 | 109 | 1559 | 1517 | 92 | 1525.0 | vs | Ring stretch |
| 1483 | 1450 | 14 | 1499 | 1459 | 12 | 1448.0 | w | δasCH3 |
| 1476 | 1443 | 6 | 1492 | 1452 | 7 | 1383.0 1379.5 | w | δasCH3 |
| 1417 | 1386 | 10 | 1417 | 1379 | 10 | 1358.0 | w | δsCH3 |
| 1355 | 1326 | 117 | 1368 | 1331 | 70 | 1329.5 1326.5 | vs | Ring stretch, δCH |
| 1301 | 1272 | 36 | 1316 | 1280 | 57 | 1286.0 1282.5 | vw | Ring stretch, ρNH2 |
| 1164 | 1139 | 7 | 1163 | 1132 | 5 | 1142.5 | vw | δCH |
| 1116 | 1092 | 20 | 1121 | 1091 | 28 | 1100.5 1094.5 | vw | ρNH2 |
| 1064 | 1040 | 1 | 1065 | 1036 | 1 | 1037.5 | vw | ρCH3 |
| 1015 | 992 | 6 | 1011 | 984 | 6 | 995.0 | vw | ρCH3 |
| 976 | 954 | 14 | 976 | 950 | 14 | 965.5 963.0 | vw | Ring def |
| 844 | 825 | 7 | 876 | 852 | 7 | 851.5 | vw | Ring def, νS-C |
| 705 | 705 | 23 | 711 | 711 | 17 | 701.5 | vw | γCH |
| 675 | 675 | 8 | 678 | 678 | 198 | 692.5 687.0 | m | Ring def, νS-C |
| 657 | 657 | 31 | 699 | 8 | 677.0 | vw | Ring def | |
| 614 | 614 | 31 | 628 | 20 | 657.0 | vw | Ring breath | |
| 592 | 592 | 37 | 597 | 27 | 629.0 | vw | Ring def | |
| 550 | 550 | 5 | 551 | 551 | 3 | 607.0 | vw | Ring def |
| 509 | 509 | 198 | 539 | 539 | 58 | 444.0 | w | ωNH2 |
| 402 | 402 | 1 | 398 | 398 | 2 | Skeletal def | ||
| 299 | 299 | 14 | 255 | 255 | 27 | τNH2 | ||
| 277 | 277 | 10 | 285 | 285 | 3 | Skeletal def | ||
| 267 | 267 | 8 | 272 | 272 | 4 | Skeletal def | ||
| 205 | 205 | 13 | 205 | 205 | 11 | Skeletal def | ||
| 144 | 144 | 0 | 146 | 146 | 0 | τCH3 | ||
| fp1 | Assignmt 1 | ||||||
|---|---|---|---|---|---|---|---|
| fp1a | fp1s | ||||||
| ν experim | ν harmon | ν anharm | ν experim | ν harmon | ν anharm | ||
| 2134 br | 2217 (1338) | 2171 | 2142 br | 2221 (1332) | 2182 | νasNCN | |
| 887.5 | 922 (443) | 868 | 885.0 | 912 (406) | 864 | δNH | |
| 644 br | 649 (24) | 641 | 631 (15) | 621 | δNCN | ||
| fp2 | Assignmt | ||||||
| fp2a | fp2s | ||||||
| ν experim | ν harm | ν anharm | ν experim | ν harm | ν anharm | ||
| 2130 br | 2221 (1185) | 2158 | 2137 br | 2219 (949) | 2177 | νasNCN | |
| 1282 (31) | 1257 | 1263.0 | 1314 (26) | 1281 | δCH | ||
| 1080.5 | 1085 (58) | 1071 | 1057.5 | 1077 (30) | 1058 | ρCH3 | |
| 1000.0 | 1025 (25) | 998 | 998.5 | 1012 (27) | 991 | νC-C(H3) | |
| 873.0 | 932 (312) | 855 | 898.0 | 927 (313) | 898 | δNH | |
| 595 (53) | 565 | 644 br | 655 (33) | 638 | δCCN | ||
| fp3 | Assignmt | ||||||
| ν experim | ν harm | ν anharm | |||||
| 3443.5 | 3586 (91) | 3424 | νNH | ||||
| 2160 br | 2233 (1035) | 2193 | νasNCN | ||||
| 1373.5 1375.5 | 1426 (48) | 1390 | δNH | ||||
| 865.0 | 913 (217) | 856 | δNCN | ||||
| fp15 | Assignmt | ||||||
| ν experim | fp15syn/syn | fp15anti/syn | fp15syn/anti | ||||
| ν harm | ν anharm | ν harm | ν anharm | ν harm | ν aharm | ||
| 1618.0 | 1653 (175) | 1612 | 1652 (173) | 1602 | 1677 (226) | 1636 | νC=N |
| 1250.0 | 1255 (304) | 1210 | 1268 (266) | 1220 | 1262 (166) | 1223 | δNH |
| 1103.0 | 1130 (68) | 1101 | 1120 (52) | 1096 | 1092 (47) | 1066 | νCN |
| H2N–C≡N∙∙∙CH3–CSC–H | Assignment | |||||
|---|---|---|---|---|---|---|
| Experimental | Calculated Harmonic | |||||
| fp11-12a | fp11-12b | |||||
| ν | Δν | ν | Δν | ν | Δν | |
| 3165 br | −235 | 3279 | −268 | 3294 | −253 | νsNH2 |
| 2256.0 2252.0 | −8 −12 | 2335 | −16 | 2333 | −18 | νC≡N |
| 665.0 | +251 | 695 | +206 | 672 | +183 | ωNH2 |
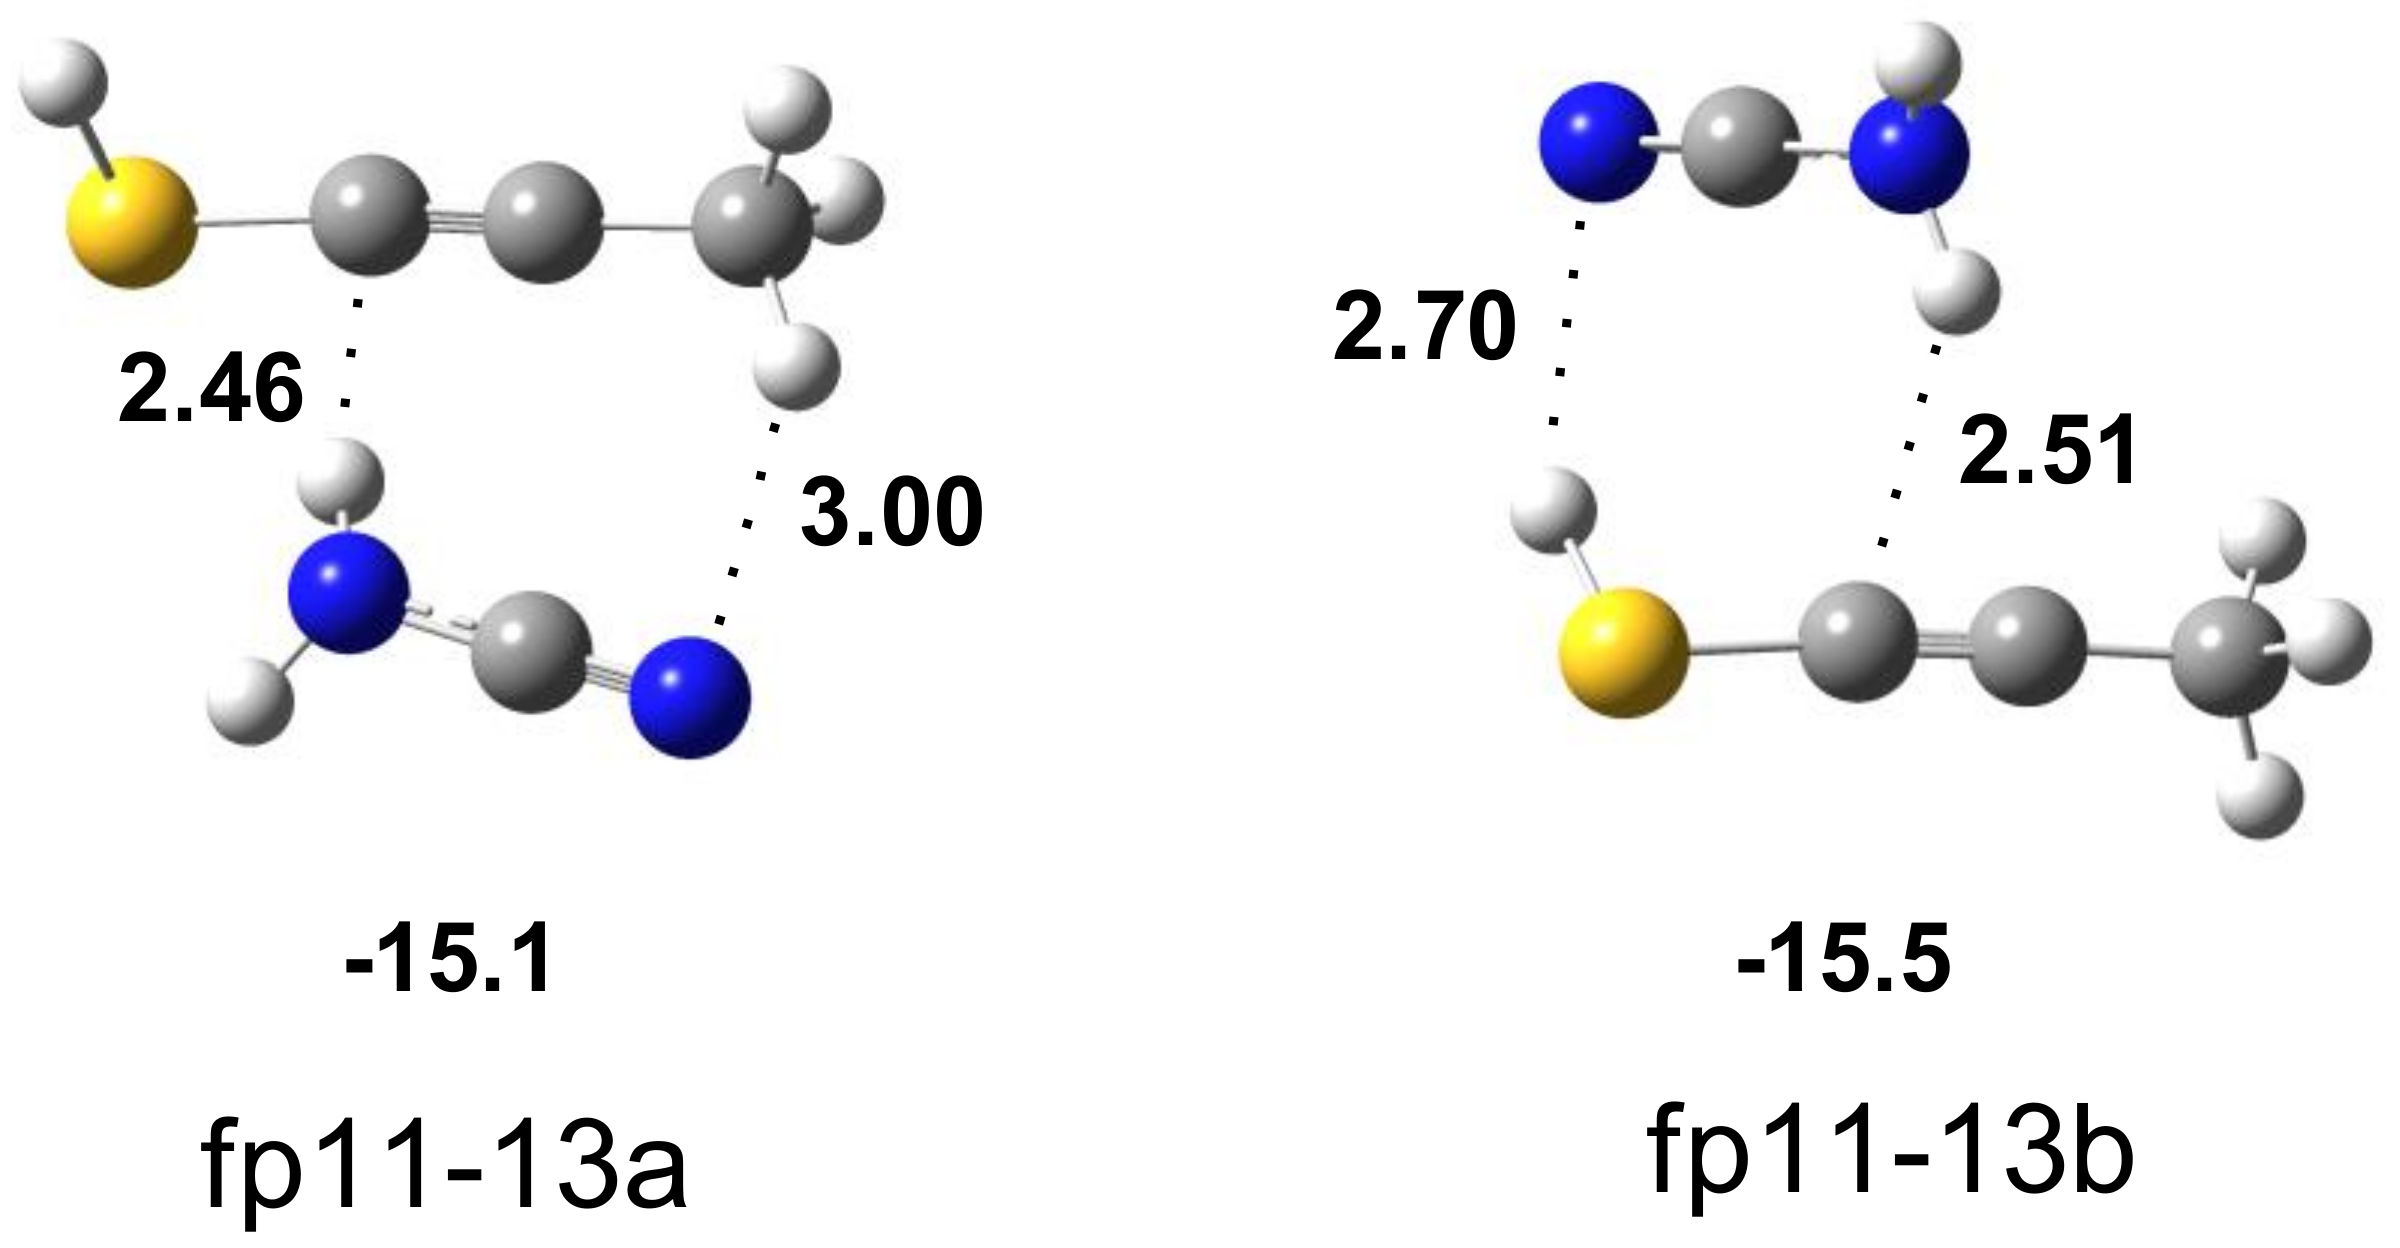
| H2N–C≡N∙∙∙CH3C≡CSH | Assignment | |||||
|---|---|---|---|---|---|---|
| Experimental | Calculated Harmonic | |||||
| fp11-13a | fp11-13b | |||||
| ν | Δν | ν | Δν | ν | Δν | |
| 3475.0 | −11 | 3615 | −22 | 3607 | −30 | νasNH2 |
| 3365 sh | −35 | 3493 | −54 | 3471 | −76 | νsNH2 |
| 2260.0 | −4 | 2343 | −8 | 2341 | −10 | νC≡N |
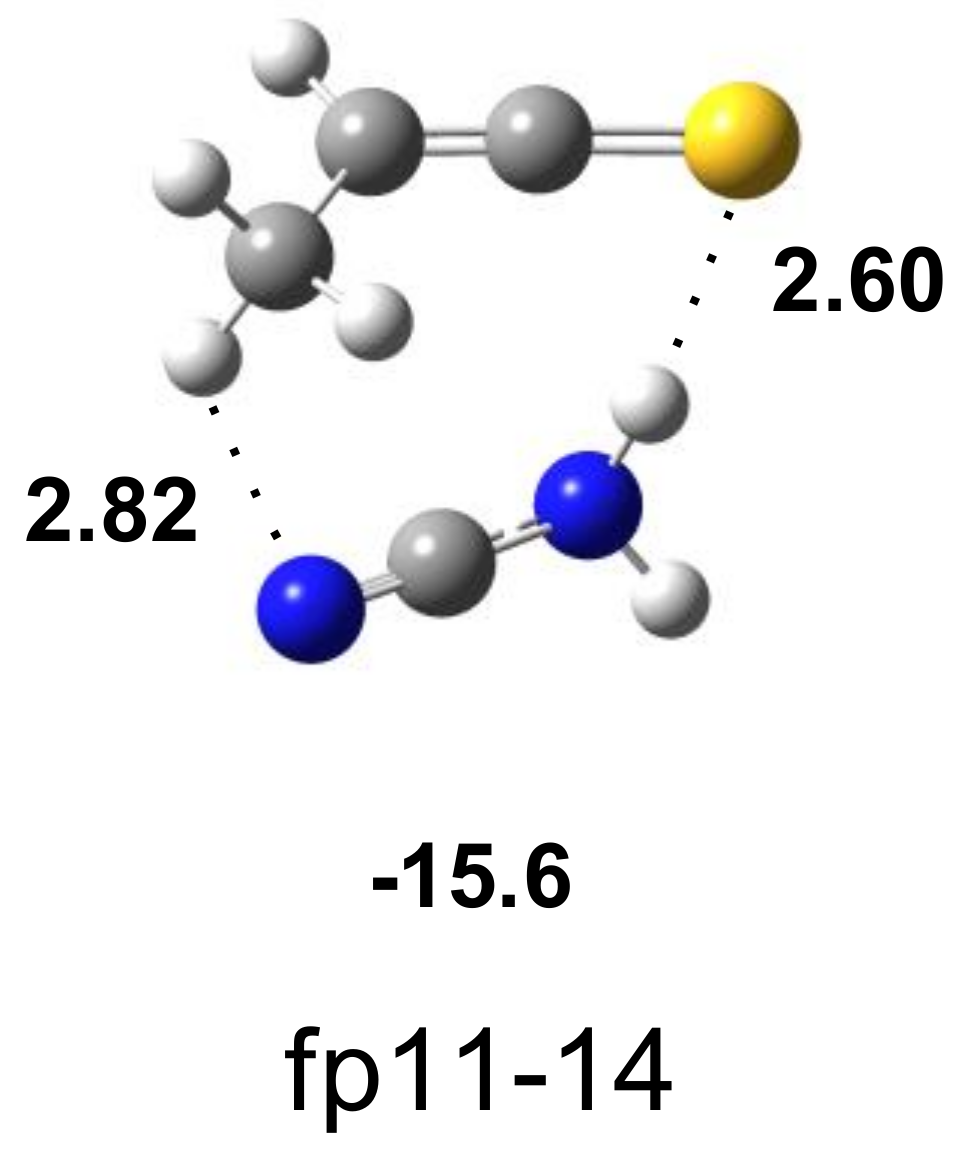
| H2N–C≡N∙∙∙S=C=C(H)CH3 | Assignment | |||
|---|---|---|---|---|
| Experimental | Calculated Harmonic | |||
| fp11-14 | ||||
| ν | Δν | ν | Δν | |
| 3466.0 | −20 | 3610 | −27 | νasNH2 |
| 3314.0 | −86 | 3453 | −94 | νsNH2 |
| 2267.0 | +3 | 2342 | −9 | νC≡N |
| 1777.0 | 0 | 1837 | 0 | νasC=C=S |
| 638.0 | +25 | 656 | +26 | γCH |
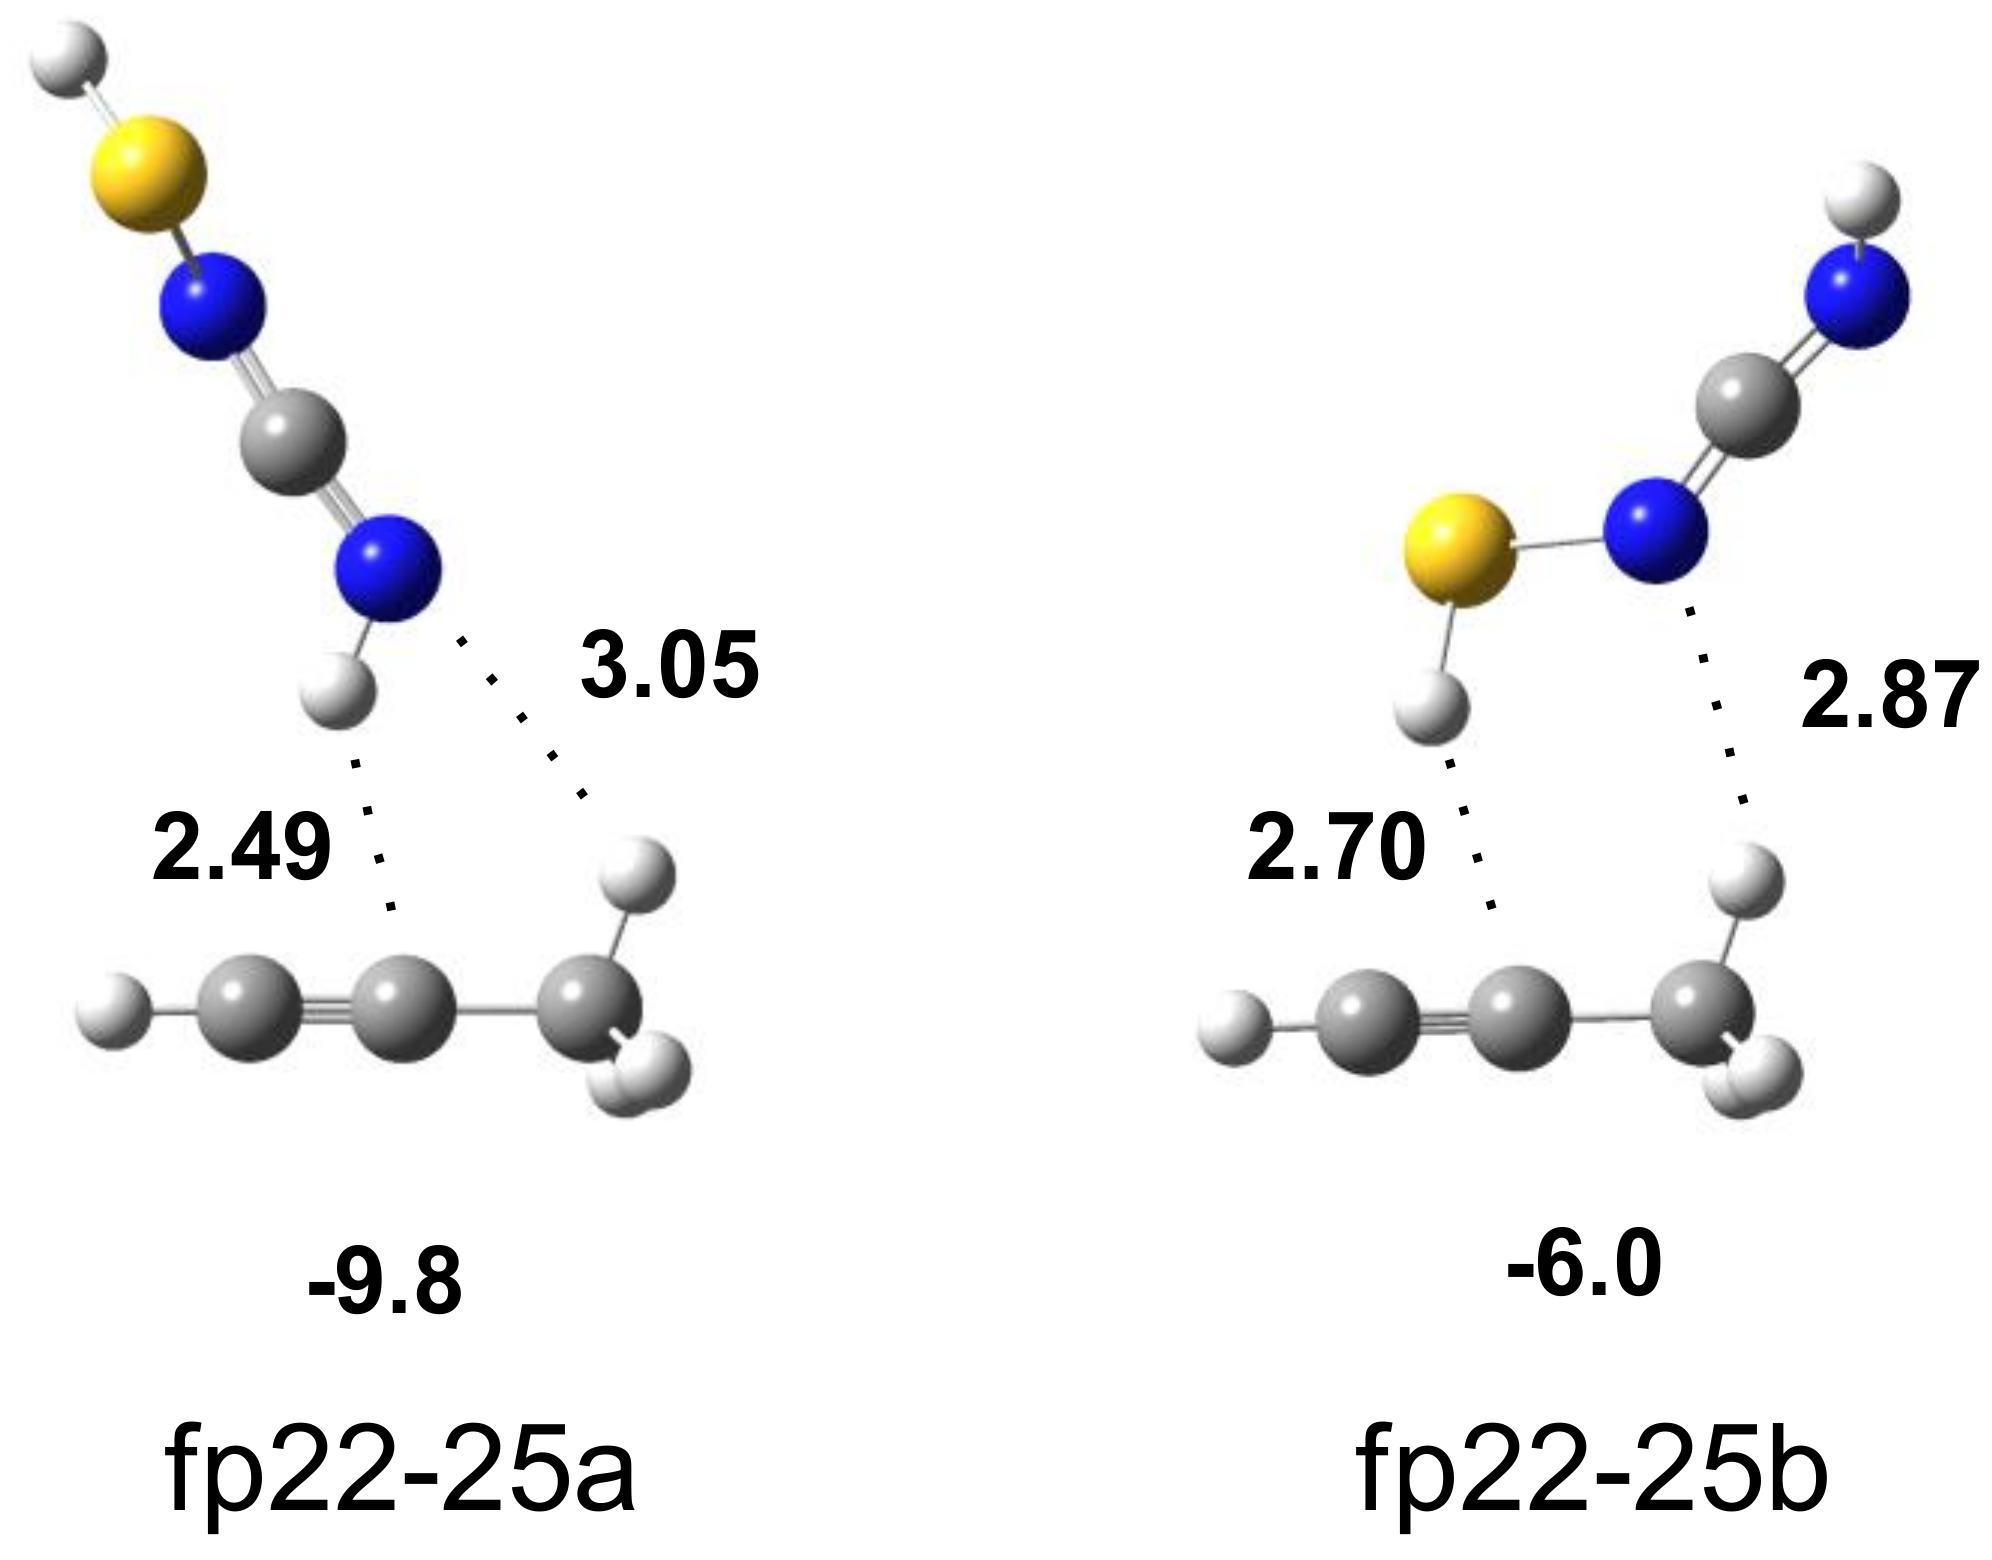
| H3C–C≡CH∙∙∙HN=C=N–SH | Assignment | |||||
|---|---|---|---|---|---|---|
| Experimental | Calculated Harmonic | |||||
| fp22-25a | fp22-25b | |||||
| ν | Δν | ν | Δν | ν | Δν | |
| 3337.0 | −40 | 3464 | −93 | 3555 | −2 | νNH |
| 2117.5 | −44.5 2 | 2211 | −1 | 2208 | −4 | νasNCN |
| 898 tentatively | +28 | 976 | +31 | 949 | +4 | δNH |
| 635 | +4 | 675 668 | +15 +2 | 668 660 | +2 −6 | δCH γCH |
Publisher’s Note: MDPI stays neutral with regard to jurisdictional claims in published maps and institutional affiliations. |
© 2022 by the authors. Licensee MDPI, Basel, Switzerland. This article is an open access article distributed under the terms and conditions of the Creative Commons Attribution (CC BY) license (https://creativecommons.org/licenses/by/4.0/).
Share and Cite
Pagacz-Kostrzewa, M.; Bumażnik, D.; Coussan, S.; Sałdyka, M. Structure, Spectra and Photochemistry of 2-Amino-4-Methylthiazole: FTIR Matrix Isolation and Theoretical Studies. Molecules 2022, 27, 3897. https://doi.org/10.3390/molecules27123897
Pagacz-Kostrzewa M, Bumażnik D, Coussan S, Sałdyka M. Structure, Spectra and Photochemistry of 2-Amino-4-Methylthiazole: FTIR Matrix Isolation and Theoretical Studies. Molecules. 2022; 27(12):3897. https://doi.org/10.3390/molecules27123897
Chicago/Turabian StylePagacz-Kostrzewa, Magdalena, Daria Bumażnik, Stéphane Coussan, and Magdalena Sałdyka. 2022. "Structure, Spectra and Photochemistry of 2-Amino-4-Methylthiazole: FTIR Matrix Isolation and Theoretical Studies" Molecules 27, no. 12: 3897. https://doi.org/10.3390/molecules27123897
APA StylePagacz-Kostrzewa, M., Bumażnik, D., Coussan, S., & Sałdyka, M. (2022). Structure, Spectra and Photochemistry of 2-Amino-4-Methylthiazole: FTIR Matrix Isolation and Theoretical Studies. Molecules, 27(12), 3897. https://doi.org/10.3390/molecules27123897