
Quality of Beef Burgers Formulated with Fat Substitute in a Form of Freeze-Dried Hydrogel Enriched with Açai Oil


 , ,
, ,  , and
, and 
Abstract
:1. Introduction
2. Results and Discussion
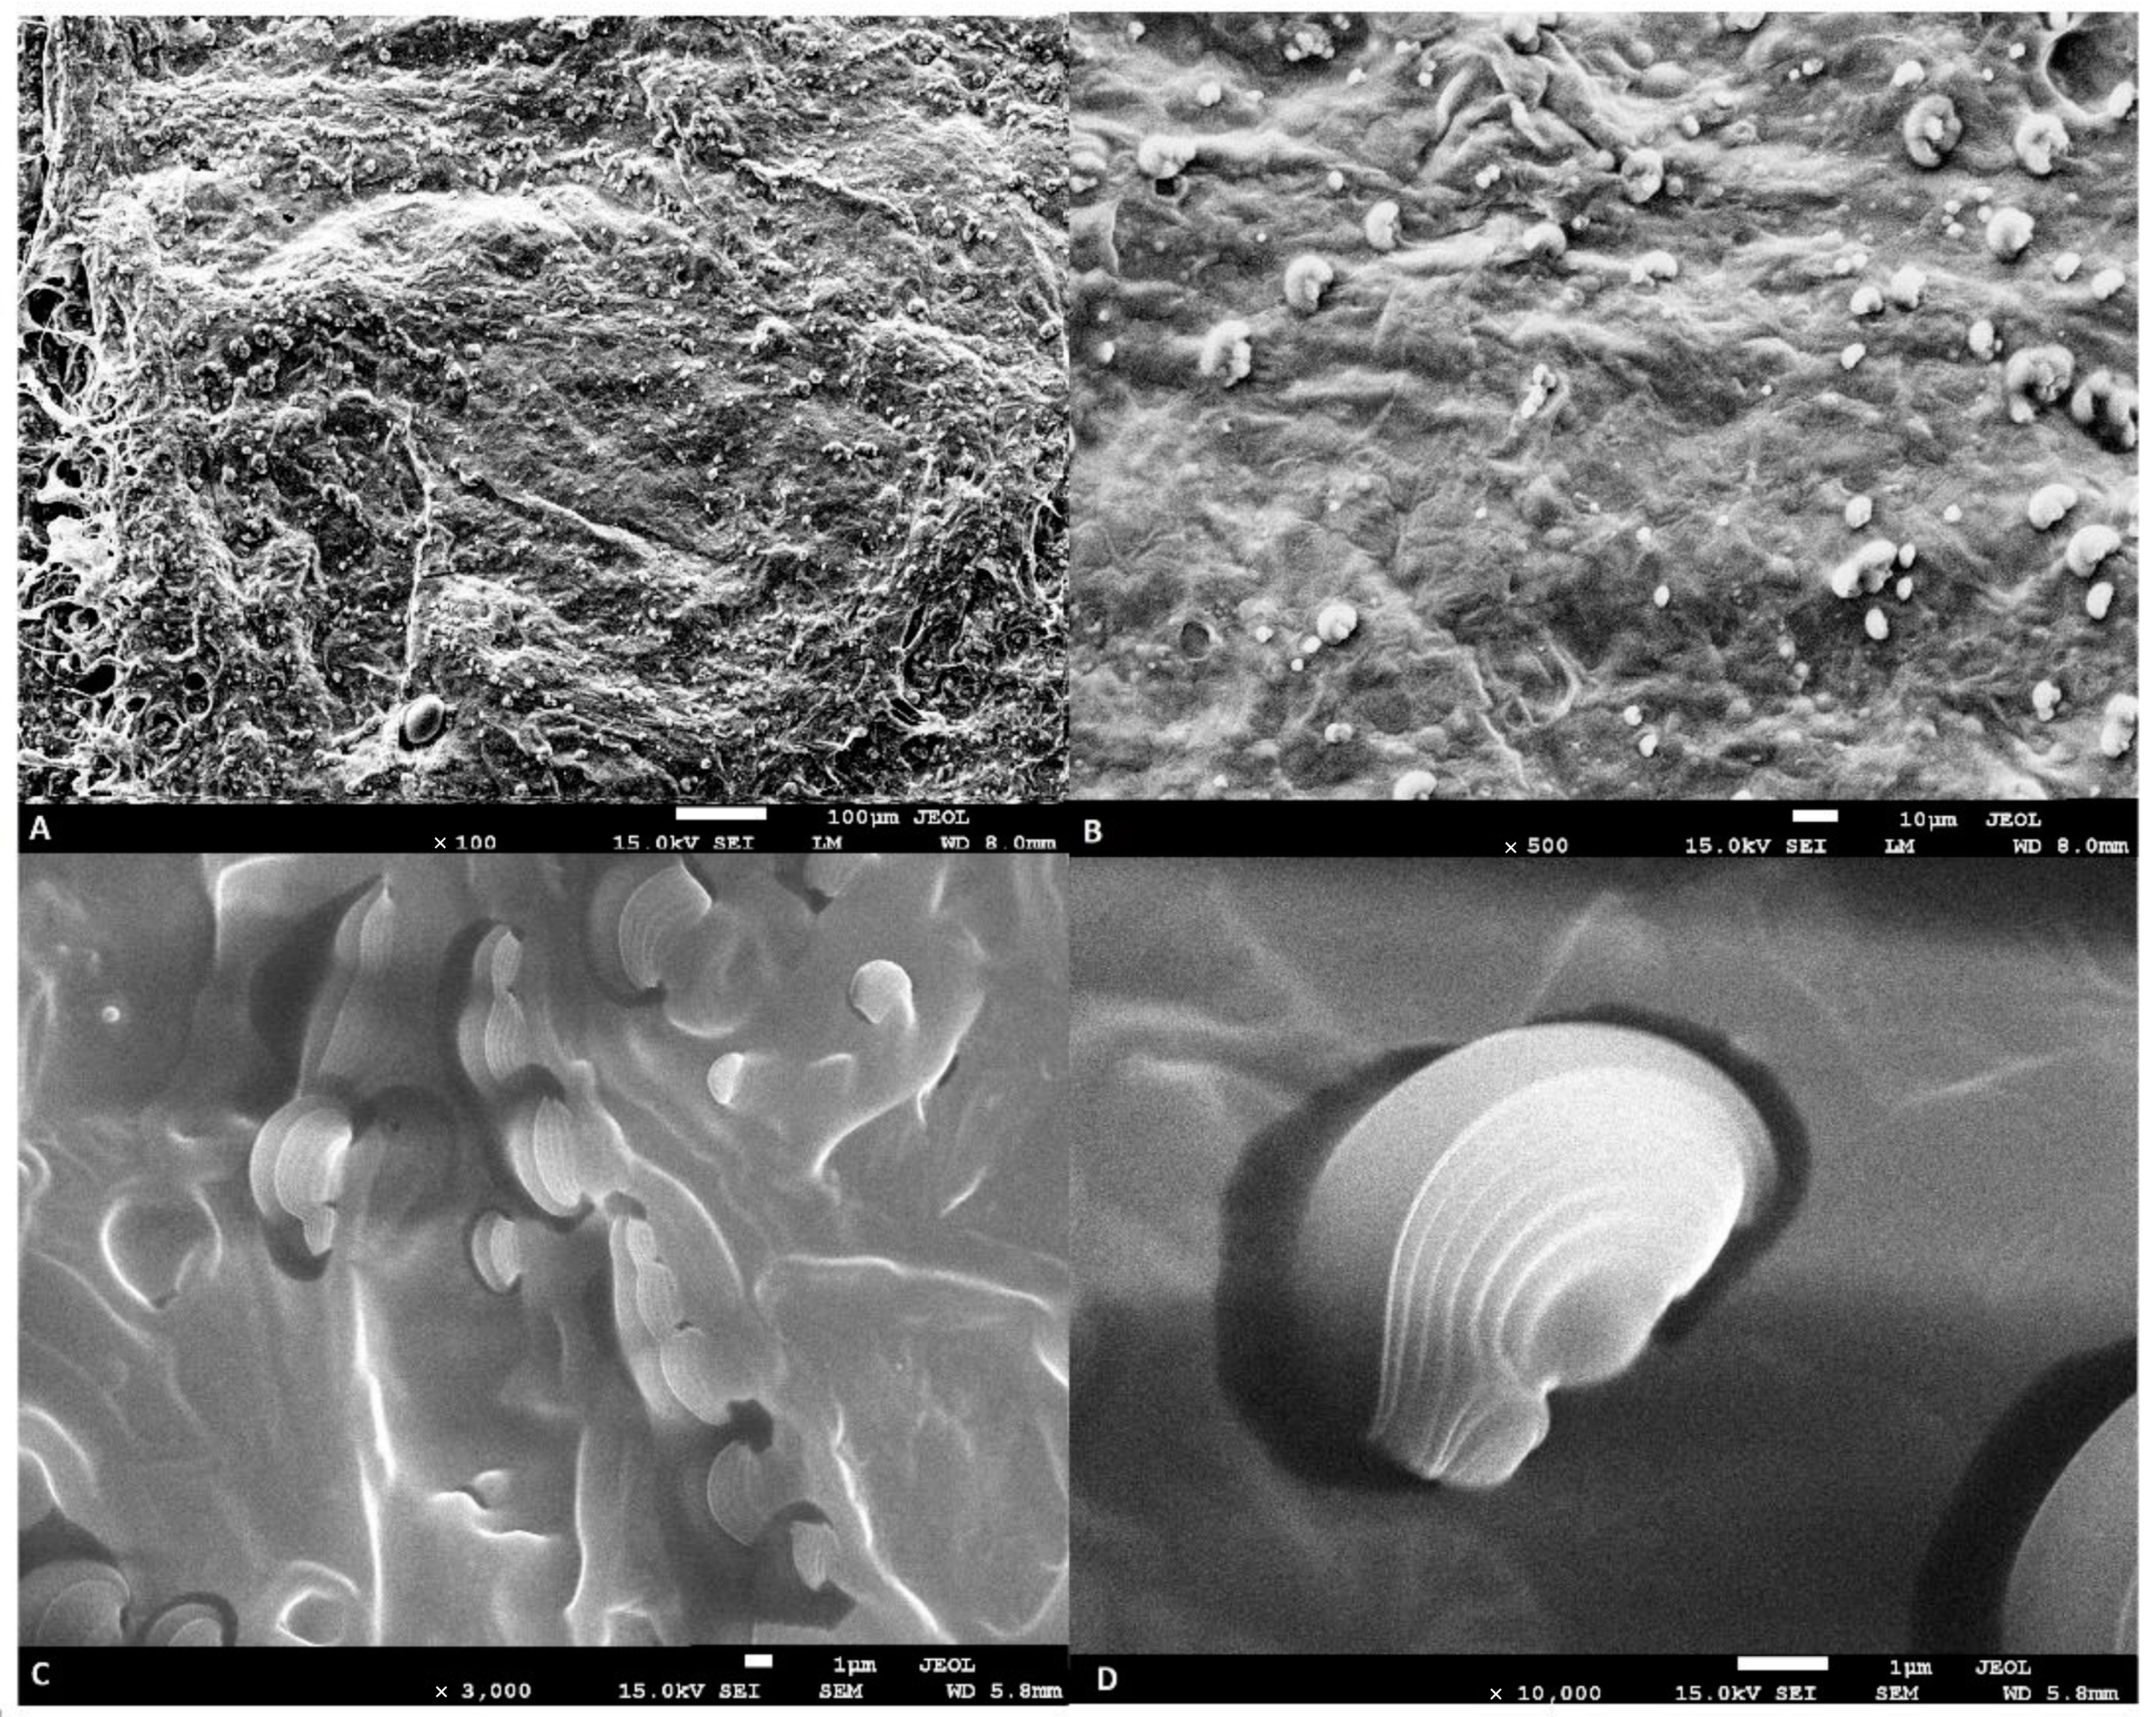
2.1. The Analysis of the Freeze-Dried Hydrogel Emulsion Using SEM
2.2. Physical Analyses of the Beef Burger
2.2.1. Color and pH Analysis
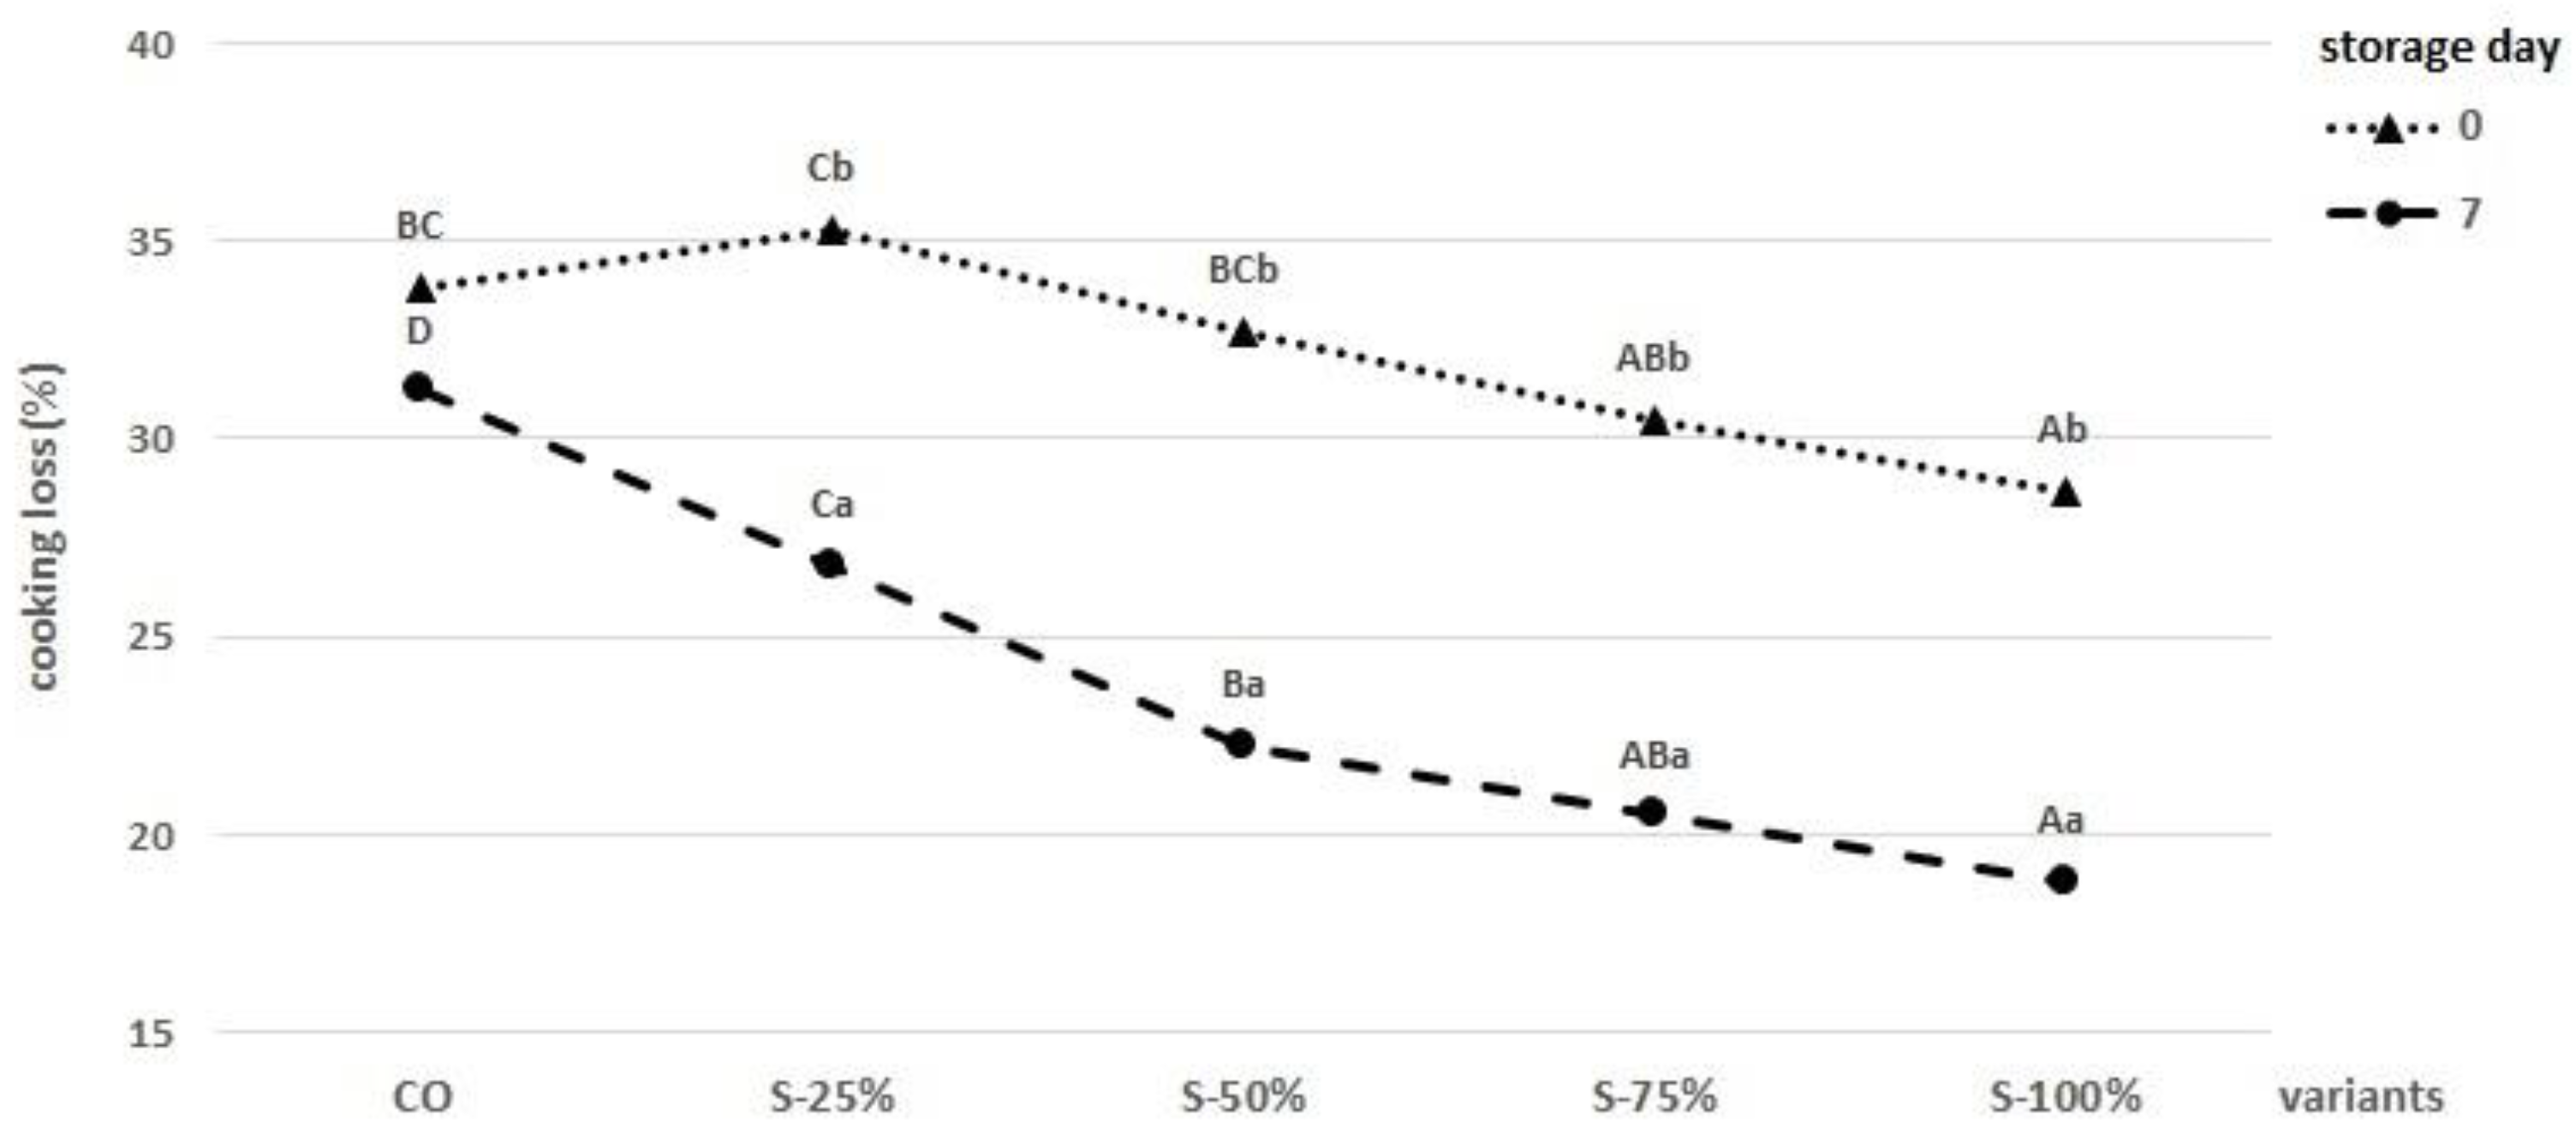
2.2.2. Texture Analysis and Cooking Loss
2.3. Chemical Analyses of the Beef Burger
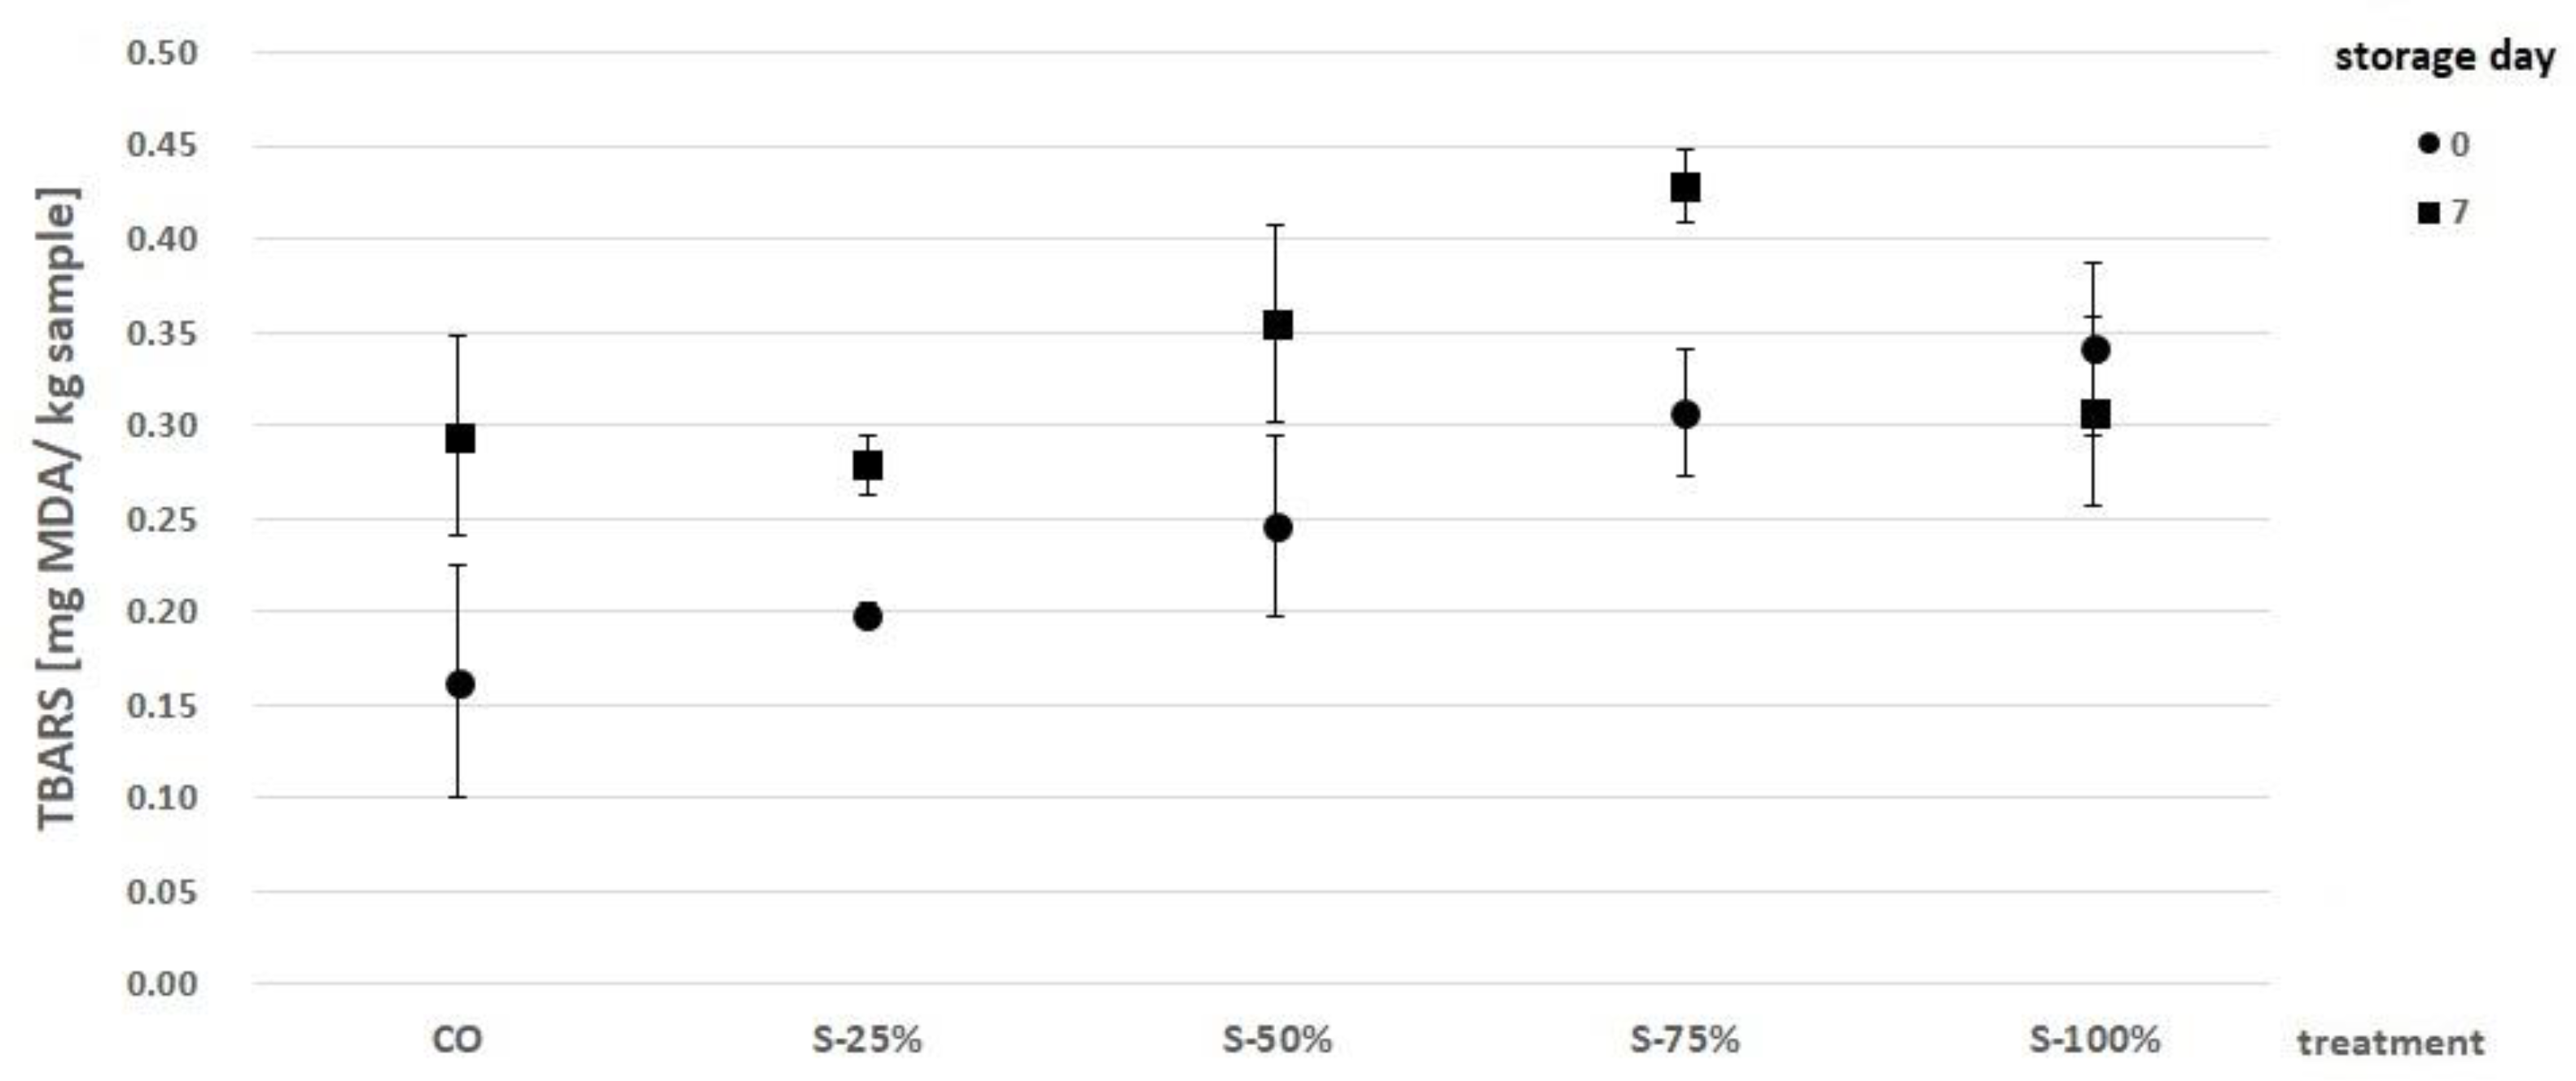
2.3.1. Oxidation Lipids Analysis
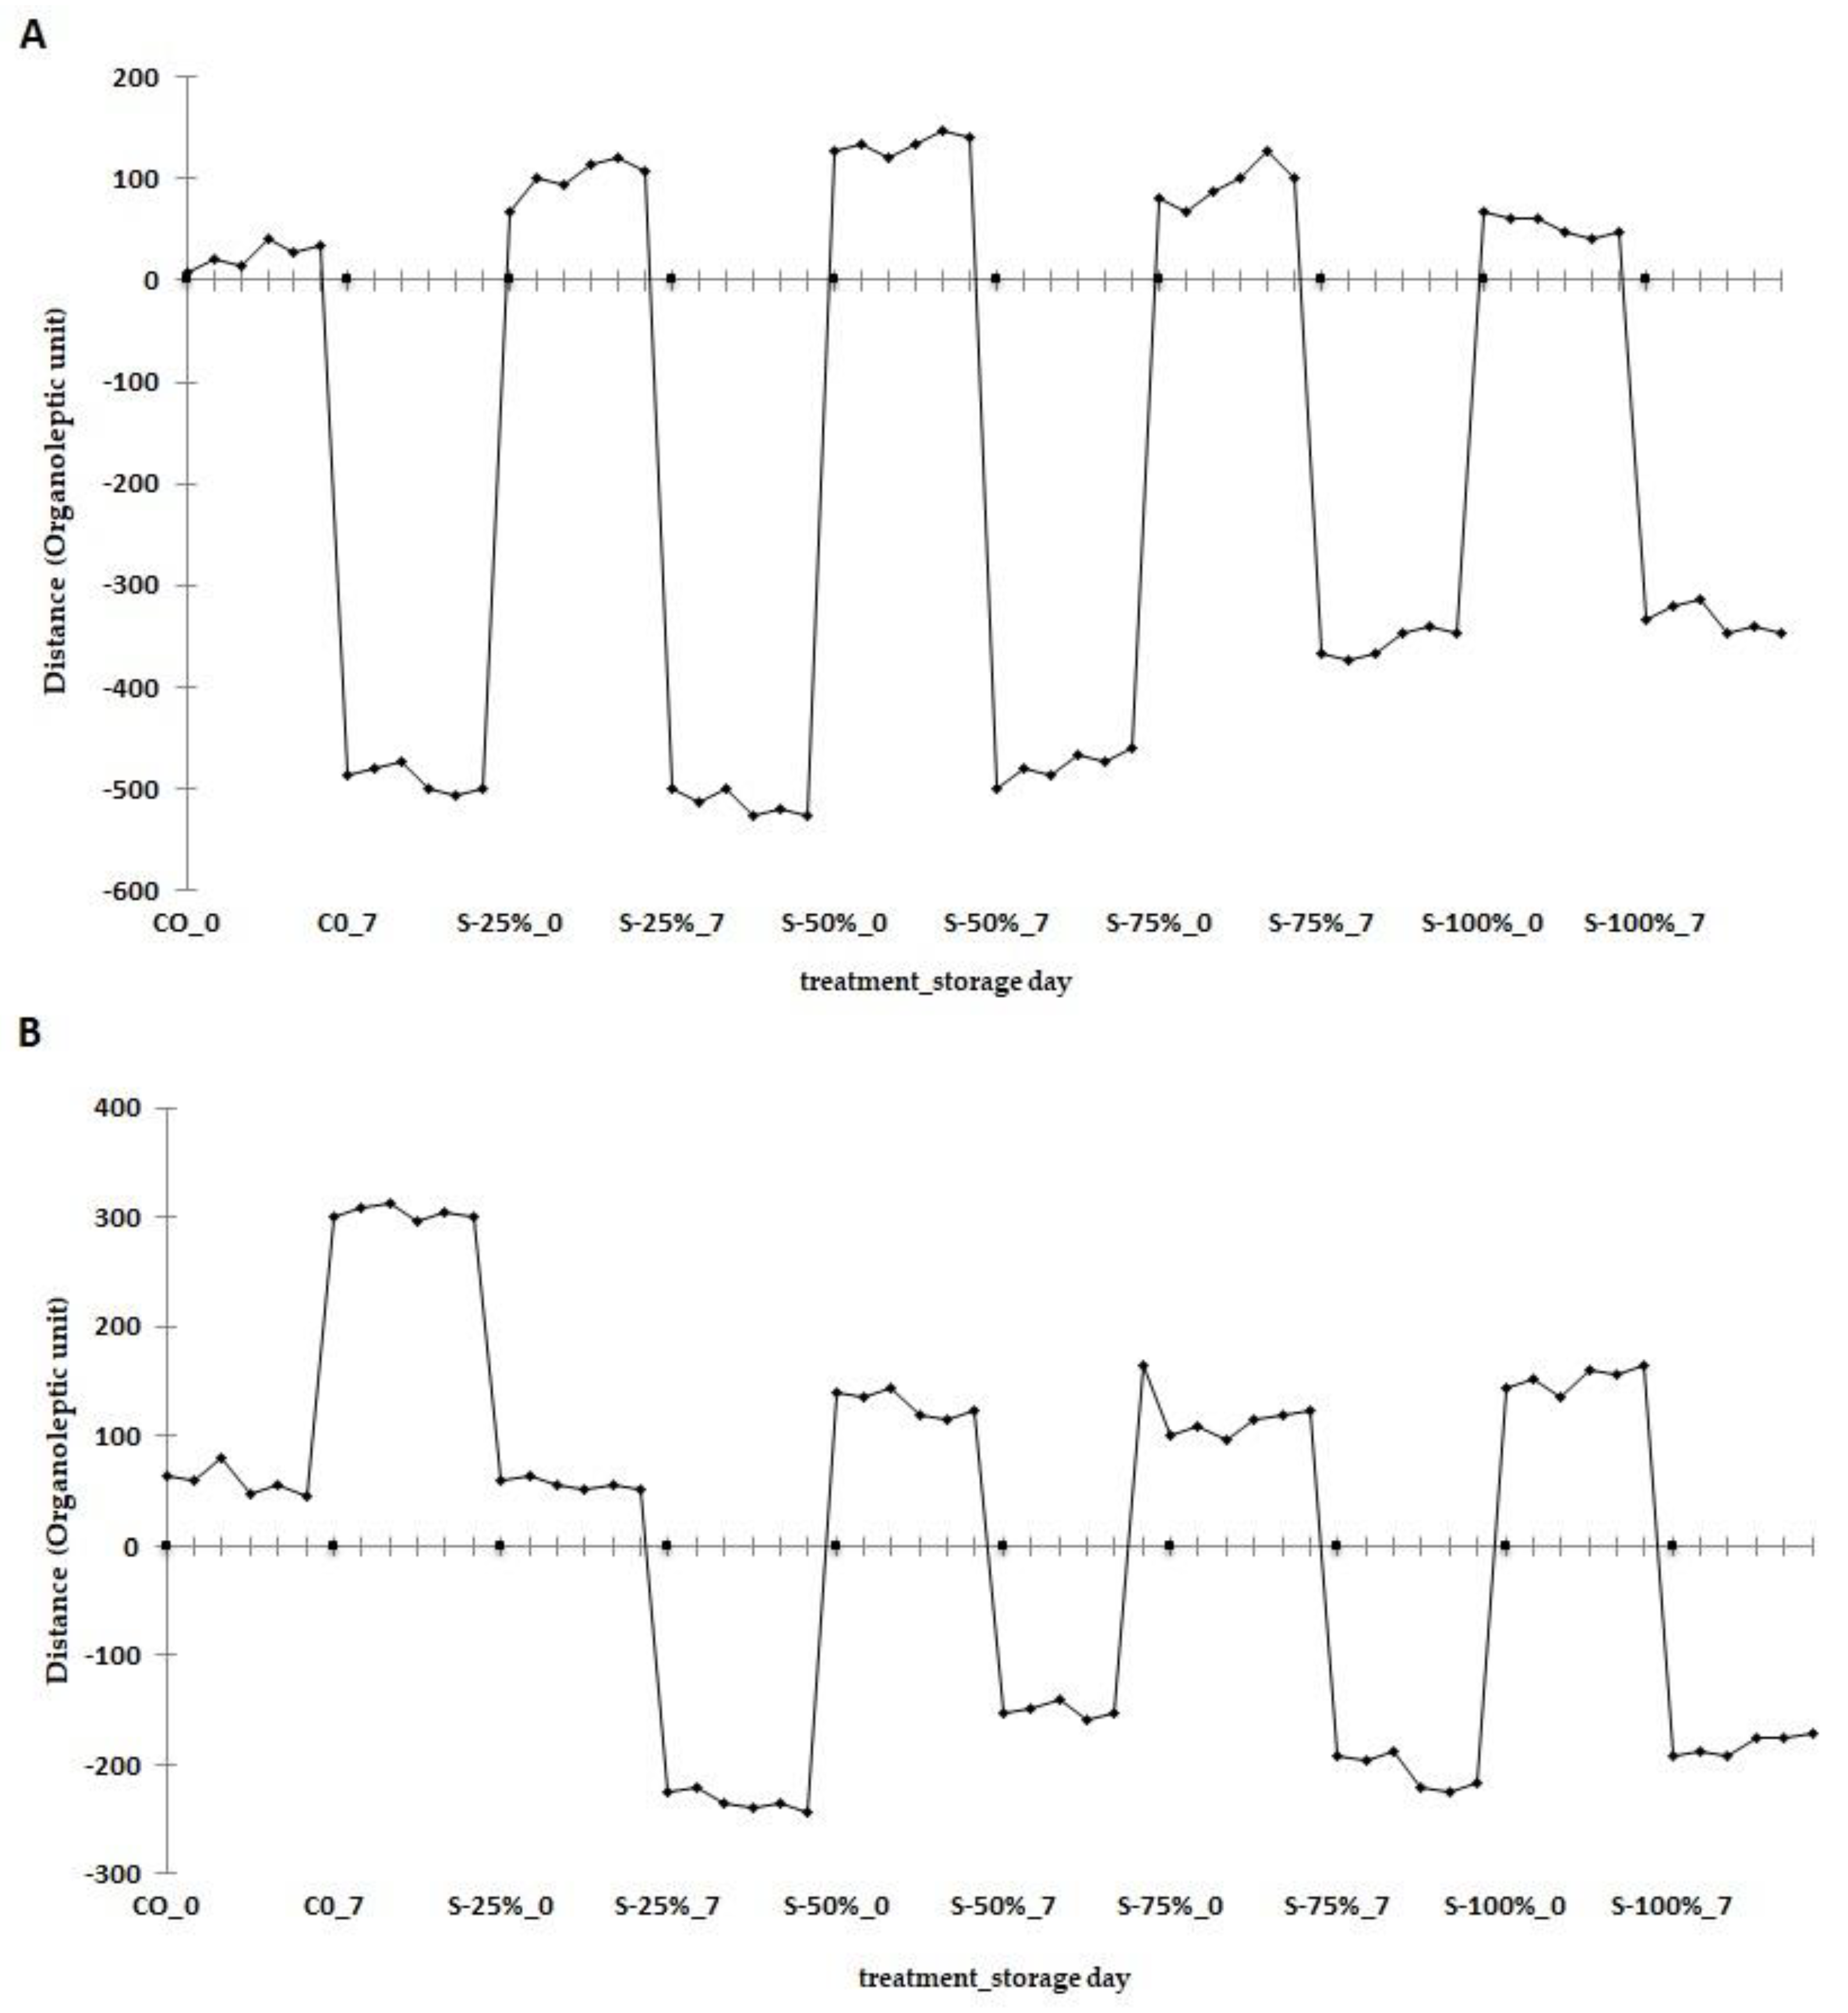
2.3.2. E-Nose Analysis
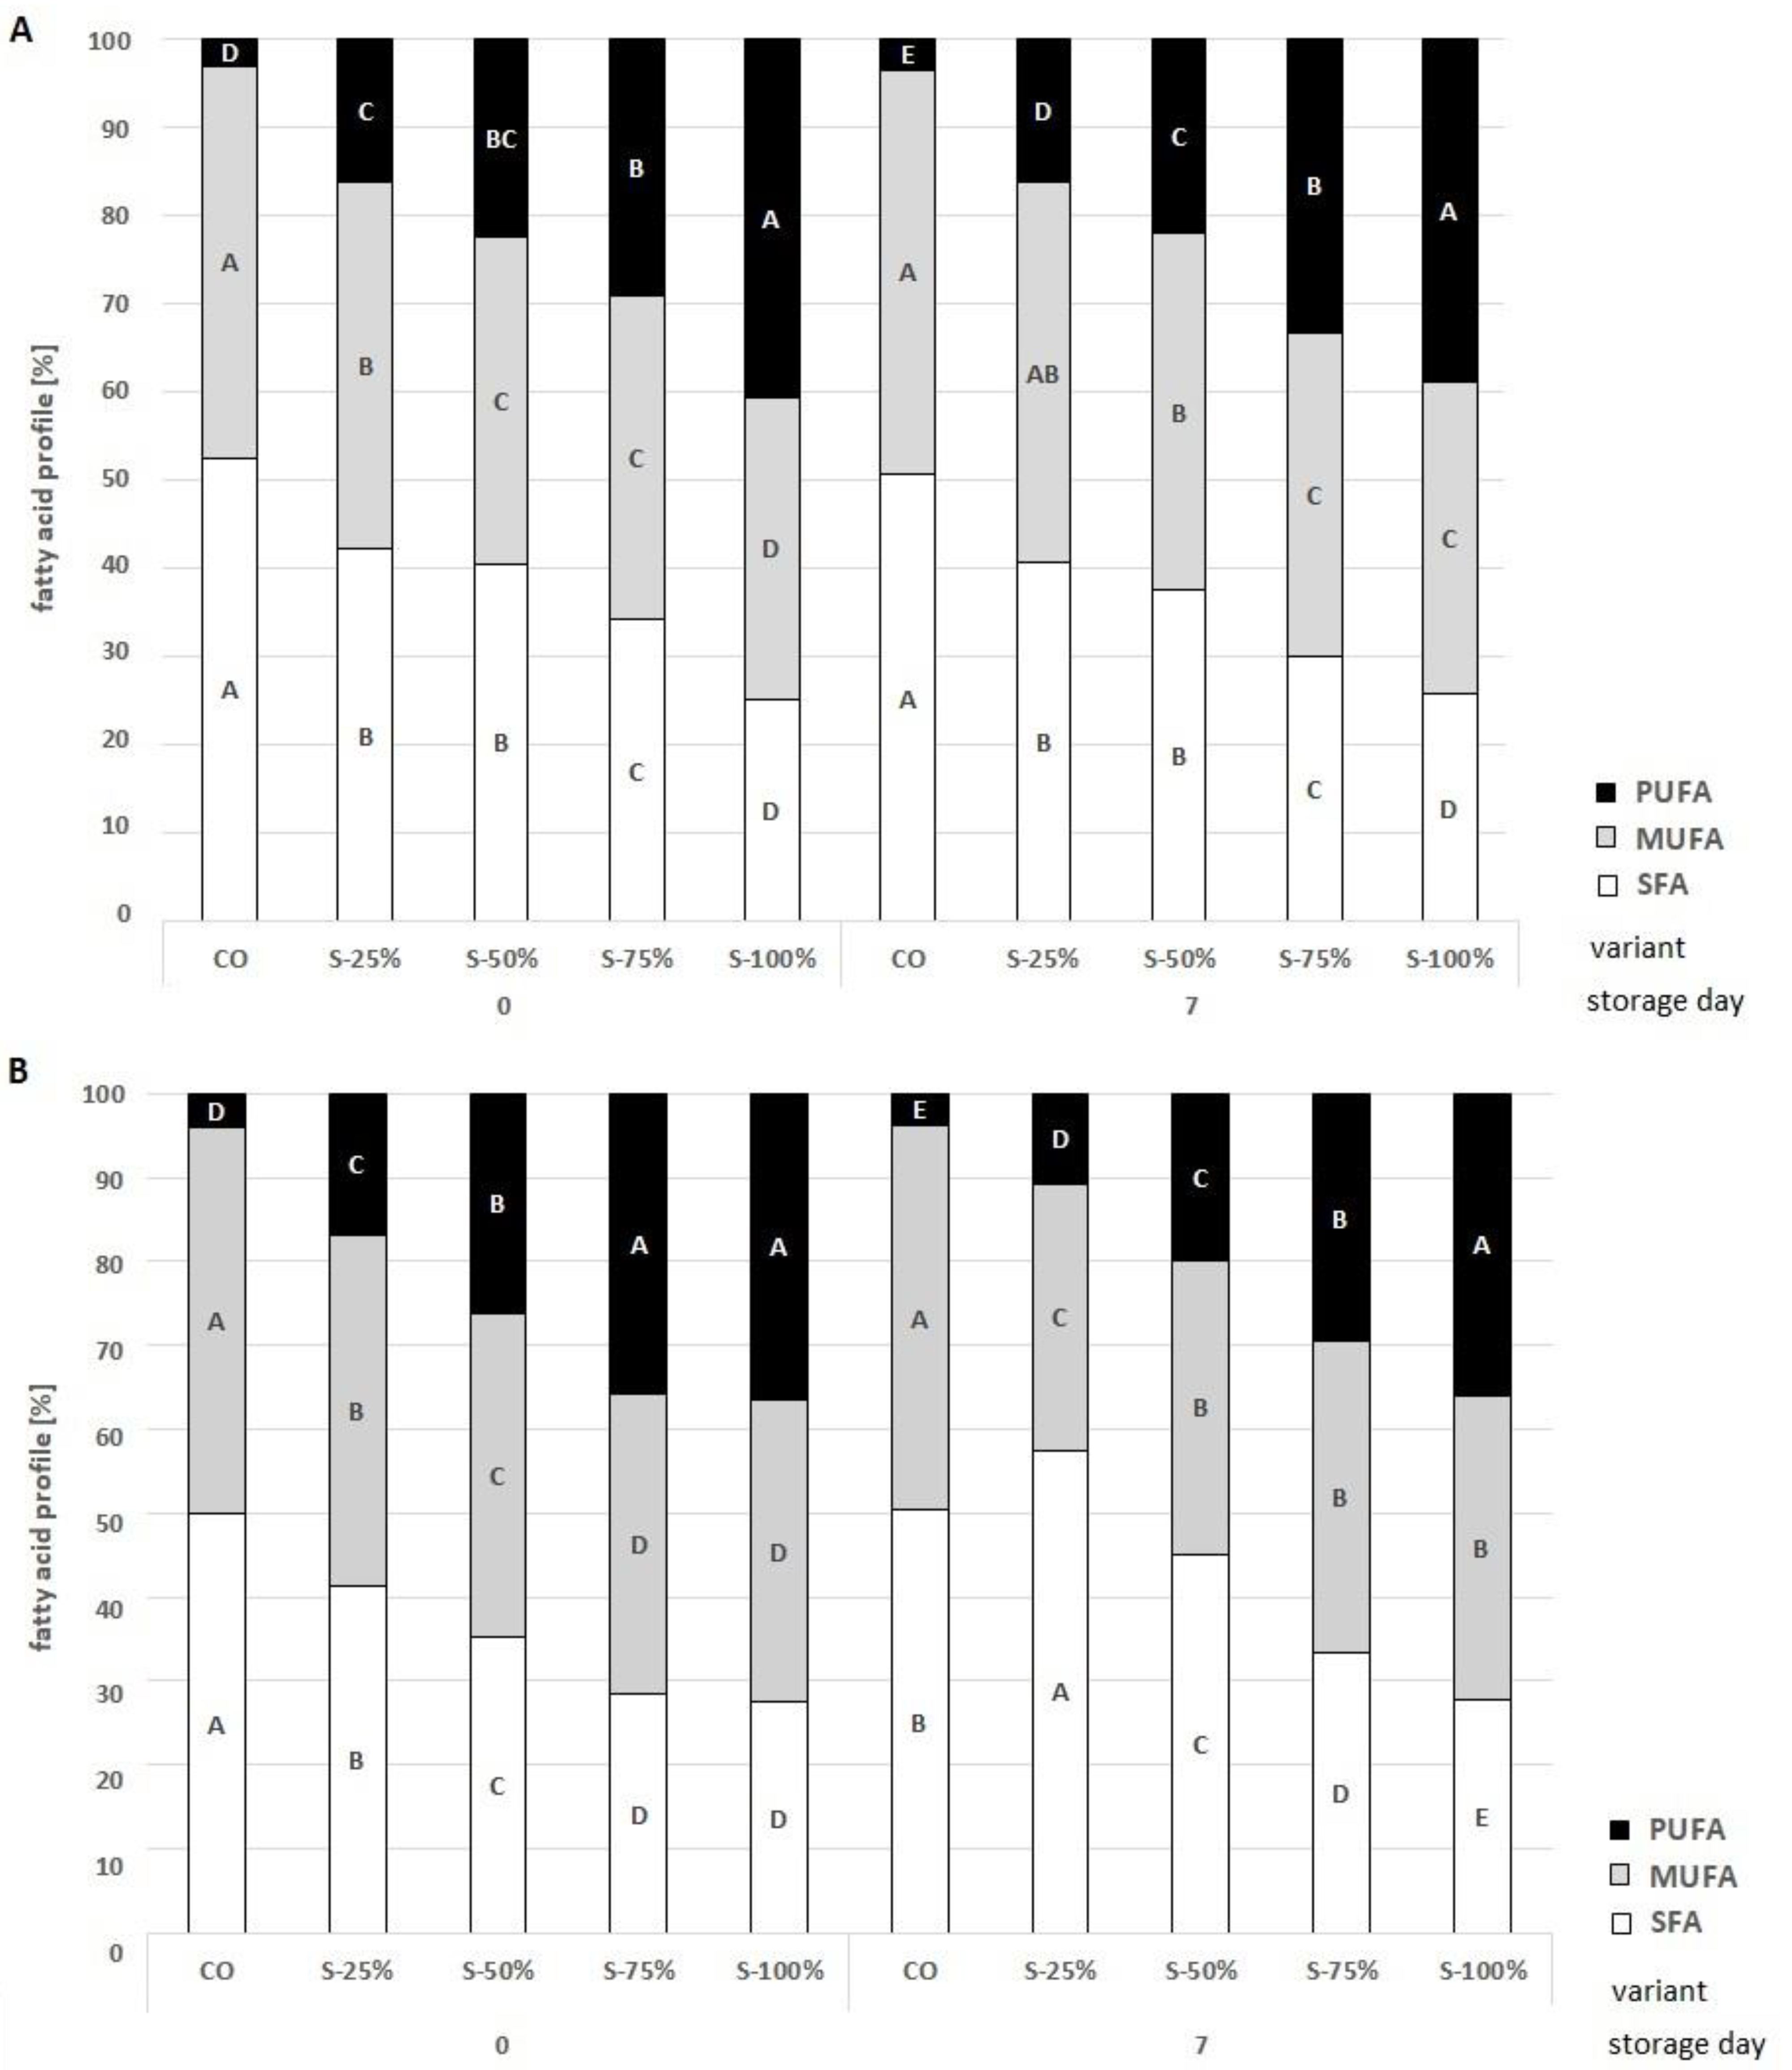
2.3.3. The Analysis of Fatty Acid Compounds and Health Indicators
2.4. Sensory Evaluation of Burger Beef
2.5. Correlation between the Chemical and Physical Parameters Analyzed in Grilled Burgers
3. Material and Methods
3.1. Preparation of the Fat Substitute
3.2. The Preparation and Packaging of Beef Burgers
3.3. Chemical Analyses
3.3.1. Thiobarbituric Acid Reactive Substances Analysis (TBARS)
3.3.2. Analysis of the Fatty Acid Profile and Health Indicators
3.3.3. Analysis of the Volatile Compounds
3.4. Physical Analyses
3.4.1. Scanning Electron Microscope (SEM) Analysis
3.4.2. Color and pH Analysis
3.4.3. Texture Profile Analysis (TPA) and Cooking Loss
- BR—raw burger weight after 7 days of storage
- BG—grilled burger weight after 7 day of storage
3.5. Sensory Evaluation of Grilled Beef Burger
3.6. Statistical Analyses
4. Conclusions
Author Contributions
Funding
Institutional Review Board Statement
Informed Consent Statement
Data Availability Statement
Conflicts of Interest
Sample Availability
References
- Barros, J.C.; Munekata, P.E.; Carvalho, F.A.L.; Domínguez, R.; Trindade, M.A.; Pateiro, M.; Lorenzo, J.M. Healthy beef burgers: Effect of animal fat replacement by algal and wheat germ oil emulsions. Meat Sci. 2021, 173, 108396. [Google Scholar] [CrossRef]
- Heck, R.T.; Saldaña, E.; Lorenzo, J.M.; Correa, L.P.; Fagundes, M.B.; Cichoski, A.J.; Menezes, C.R.; Wagner, R.; Campagnol, P.C.B. Hydrogelled emulsion from chia and linseed oils: A promising strategy to produce low-fat burgers with a healthier lipid profile. Meat Sci. 2019, 156, 174–182. [Google Scholar] [CrossRef]
- Barros, J.C.; Munekata, P.E.; de Carvalho, F.A.L.; Pateiro, M.; Barba, F.J.; Domínguez, R.; Trindade, M.A.; Lorenzo, J.M. Use of tiger nut (Cyperus esculentus L.) oil emulsion as animal fat replacement in beef burgers. Foods 2020, 9, 44. [Google Scholar] [CrossRef] [Green Version]
- Osman, M.F.E.; Mohamed, A.A.; Alamri, M.S.; Ahmed, I.A.M.; Hussain, S.; Ibraheem, M.I.; Qasem, A.A. Quality characteristics of beef patties prepared with octenyl-succinylated (Osan) starch. Foods 2021, 10, 1157. [Google Scholar] [CrossRef]
- Bakhsh, A.; Lee, S.J.; Lee, E.Y.; Hwang, Y.H.; Joo, S.T. Characteristics of Beef Patties Substituted by Different Levels of Textured Vegetable Protein and Taste Traits Assessed by Electronic Tongue System. Foods 2021, 10, 2811. [Google Scholar] [CrossRef]
- Teixeira, A.; Rodrigues, S. Consumer perceptions towards healthier meat products. Curr. Opin. Food Sci. 2021, 38, 147–154. [Google Scholar] [CrossRef]
- Ozturk-Kerimoglu, B.; Urgu-Ozturk, M.; Serdaroglu, M.; Koca, N. Chemical, technological, instrumental, microstructural, oxidative and sensory properties of emulsified sausages formulated with microparticulated whey protein to substitute animal fat. Meat Sci. 2022, 184, 108672. [Google Scholar] [CrossRef]
- Essa, R.Y.; Elsebaie, E.M. New fat replacement agent comprised of gelatin and soluble dietary fibers derived from date seed powder in beef burger preparation. LWT 2022, 156, 113051. [Google Scholar] [CrossRef]
- Domínguez, R.; Munekata, P.E.; Pateiro, M.; López-Fernández, O.; Lorenzo, J.M. Immobilization of oils using hydrogels as strategy to replace animal fats and improve the healthiness of meat products. Curr. Opin. Food Sci. 2021, 37, 135–144. [Google Scholar] [CrossRef]
- Rezvankhah, A.; Emam-Djomeh, Z.; Askari, G. Encapsulation and delivery of bioactive compounds using spray and freeze-drying techniques: A review. Dry. Technol. 2020, 38, 235–258. [Google Scholar] [CrossRef]
- Hanula, M.; Wyrwisz, J.; Moczkowska, M.; Horbańczuk, O.K.; Pogorzelska-Nowicka, E.; Wierzbicka, A. Optimization of microwave and ultrasound extraction methods of açai berries in terms of highest content of phenolic compounds and antioxidant activity. Appl. Sci. 2020, 10, 8325. [Google Scholar] [CrossRef]
- Jaramillo, J.E.C.C.; Carrillo Bautista, M.P.; Alvarez Solano, O.A.; Achenie, L.E.; González Barrios, A.F. Impact of the mode of extraction on the lipidomic profile of oils obtained from selected Amazonian fruits. Biomolecules 2019, 9, 329. [Google Scholar] [CrossRef] [PubMed] [Green Version]
- Rosa, P.; Friedrich, M.L.; Dos Santos, J.; Librelotto, D.R.N.; Maurer, L.H.; Emanuelli, T.; Silva, C.B.; Adams, A.I.H. Desonide nanoencapsulation with acai oil as oil core: Physicochemical characterization, photostability study and in vitro phototoxicity evaluation. J. Photochem. Photobiol. B Biol. 2019, 199, 111606. [Google Scholar] [CrossRef] [PubMed]
- Pacheco-Palencia, L.A.; Mertens-Talcott, S.; Talcott, S.T. Chemical composition, antioxidant properties, and thermal stability of a phytochemical enriched oil from Acai (Euterpe oleracea Mart.). J. Agric. Food Chem. 2008, 56, 4631–4636. [Google Scholar] [CrossRef] [PubMed]
- Hanula, M.; Pogorzelska-Nowicka, E.; Pogorzelski, G.; Szpicer, A.; Wojtasik-Kalinowska, I.; Wierzbicka, A.; Półtorak, A. Active Packaging of Button Mushrooms with Zeolite and Açai Extract as an Innovative Method of Extending Its Shelf Life. Agriculture 2021, 11, 653. [Google Scholar] [CrossRef]
- Aleson-Carbonell, L.; Fernández-López, J.; Pérez-Alvarez, J.A.; Kuri, V. Characteristics of beef burger as influenced by various types of lemon albedo. Innov. Food Sci. Emerg. Technol. 2005, 6, 247–255. [Google Scholar] [CrossRef]
- Traore, S.; Aubry, L.; Gatellier, P.; Przybylski, W.; Jaworska, D.; Kajak-Siemaszko, K.; Sante-Lhoutellier, V. Higher drip loss is associated with protein oxidation. Meat Sci. 2012, 90, 917–924. [Google Scholar] [CrossRef]
- Bastos, S.C.; Pimenta, M.E.S.; Pimenta, C.J.; Reis, T.A.; Nunes, C.A.; Pinheiro, A.C.M.; Fabrício, L.F.F.; Leal, R.S. Alternative fat substitutes for beef burger: Technological and sensory characteristics. J. Food Sci. Technol. 2014, 51, 2046–2053. [Google Scholar] [CrossRef] [Green Version]
- Ferreira, N.S.O.; Rosset, M.; Lima, G.; Campelo, P.M.S.; Macedo, R.E.F. Effect of adding Brosimum gaudichaudii and Pyrostegia venusta hydroalcoholic extracts on the oxidative stability of beef burgers. LWT 2019, 108, 145–152. [Google Scholar] [CrossRef]
- Wang, W.; Dong, L.; Zhang, Y.; Yu, H.; Wang, S. Reduction of the Heterocyclic Amines in Grilled Beef Patties through the Combination of Thermal Food Processing Techniques without Destroying the Grilling Quality Characteristics. Foods 2021, 10, 1490. [Google Scholar] [CrossRef]
- Warren, K.E.; Hunt, M.C.; Kropf, D.H. Myoglobin oxidative state affects internal cooked color development in ground beef patties. J. Food Sci. 1996, 61, 513–516. [Google Scholar] [CrossRef]
- Bertolo, A.P.; Kempka, A.P.; Rigo, E.; Sehn, G.A.R.; Cavalheiro, D. Incorporation of natural and mechanically ruptured brewing yeast cells in beef burger to replace textured soy protein. J. Food Sci. Technol. 2022, 59, 935–943. [Google Scholar] [CrossRef] [PubMed]
- Altmann, B.A.; Gertheiss, J.; Tomasevic, I.; Engelkes, C.; Glaesener, T.; Meyer, J.; Schäfer, A.; Wiesen, R.; Mörlein, D. Human perception of color differences using computer vision system measurements of raw pork loin. Meat Sci. 2022, 188, 108766. [Google Scholar] [CrossRef] [PubMed]
- Sharaf, A.M.; Ebrahium, M.E.; Ammar, M.S.; Abd El-Ghany, M.E. Influence of using moringa meal flour as meat extender on quality characteristics of beef burger patties during frozen storage. World J. Dairy Food Sci. 2009, 4, 32–40. [Google Scholar]
- Soares, K.S.; Souza, M.P.; Silva-Filho, E.C.; Barud, H.S.; Ribeiro, C.A.; Santos, D.D.; Rocha, K.N.S.; Moura, J.F.P.; Oliveira, R.L.; Bezerra, L.R. Effect of Edible Onion (Allium cepa L.) Film on Quality, Sensory Properties and Shelf Life of Beef Burger Patties. Molecules 2021, 26, 7202. [Google Scholar] [CrossRef]
- Oroszvári, B.K.; Bayod, E.; Sjöholm, I.; Tornberg, E. The mechanisms controlling heat and mass transfer on frying of beefburgers. III. Mass transfer evolution during frying. J. Food Eng. 2006, 76, 169–178. [Google Scholar] [CrossRef]
- Moghtadaei, M.; Soltanizadeh, N.; Goli, S.A.H.; Sharifimehr, S. Physicochemical properties of beef burger after partial incorporation of ethylcellulose oleogel instead of animal fat. J. Food Sci. Technol. 2021, 58, 4775–4784. [Google Scholar] [CrossRef]
- Zetzl, A.K.; Marangoni, A.G.; Barbut, S. Mechanical properties of ethylcellulose oleogels and their potential for saturated fat reduction in frankfurters. Food Funct. 2012, 3, 327–337. [Google Scholar] [CrossRef]
- Paglarini, C.S.; Martini, S.; Pollonio, M.A.R. Using emulsion gels made with sonicated soy protein isolate dispersions to replace fat in frankfurters. LWT 2019, 99, 453–459. [Google Scholar] [CrossRef]
- Foggiaro, D.; Domínguez, R.; Pateiro, M.; Cittadini, A.; Munekata, P.E.; Campagnol, P.C.; Fraqueza, M.J.; Palo, P.; Lorenzo, J.M. Use of Healthy Emulsion Hydrogels to Improve the Quality of Pork Burgers. Foods 2022, 11, 596. [Google Scholar] [CrossRef]
- Alejandre, M.; Astiasarán, I.; Ansorena, D.; Barbut, S. Using canola oil hydrogels and organogels to reduce saturated animal fat in meat batters. Food Res. Int. 2019, 122, 129–136. [Google Scholar] [CrossRef] [PubMed]
- Keenan, D.F.; Resconi, V.C.; Smyth, T.J.; Botinestean, C.; Lefranc, C.; Kerry, J.P.; Hamill, R.M. The effect of partial-fat substitutions with encapsulated and unencapsulated fish oils on the technological and eating quality of beef burgers over storage. Meat Sci. 2015, 107, 75–85. [Google Scholar] [CrossRef] [PubMed]
- Hanula, M.; Szpicer, A.; Górska-Horczyczak, E.; Khachatryan, G.; Pogorzelski, G.; Pogorzelska-Nowicka, E.; Poltorak, A. Hydrogel Emulsion with Encapsulated Safflower Oil Enriched with Açai Extract as a Novel Fat Substitute in Beef Burgers Subjected to Storage in Cold Conditions. Molecules 2022, 27, 2397. [Google Scholar] [CrossRef] [PubMed]
- Domínguez, R.; Pateiro, M.; Gagaoua, M.; Barba, F.J.; Zhang, W.; Lorenzo, J.M. A comprehensive review on lipid oxidation in meat and meat products. Antioxidants 2019, 8, 429. [Google Scholar] [CrossRef] [PubMed] [Green Version]
- Lorenzo, J.M.; Pateiro, M. Influence of fat content on Physico-chemical and oxidative stability of foal liver pâté. Meat Sci. 2013, 95, 330–335. [Google Scholar] [CrossRef] [PubMed]
- Fonseca, S.; Gómez, M.; Domínguez, R.; Lorenzo, J.M. Physicochemical and sensory properties of Celta dry-ripened “salchichón” as affected by fat content. Grasas Aceites 2015, 66, e059. [Google Scholar]
- Hautrive, T.P.; Piccolo, J.; Rodrigues, Â.S.; Campagnol, P.C.B.; Kubota, E.H. Effect of fat replacement by chitosan and golden flaxseed flour (wholemeal and defatted) on the quality of hamburgers. LWT—Food Sci. Technol. 2019, 102, 403–410. [Google Scholar] [CrossRef]
- Amoli, P.I.; Hadidi, M.; Hasiri, Z.; Rouhafza, A.; Jelyani, A.Z.; Hadian, Z.; Khaneghah, A.M.; Lorenzo, J.M. Incorporation of low molecular weight chitosan in a low-fat beef burger: Assessment of technological quality and oxidative stability. Foods 2021, 10, 1959. [Google Scholar] [CrossRef]
- Ladikos, D.; Lougovois, V. Lipid oxidation in muscle foods: A review. Food Chem. 1990, 35, 295–314. [Google Scholar] [CrossRef]
- Wojtasik-Kalinowska, I.; Marcinkowska-Lesiak, M.; Onopiuk, A.; Stelmasiak, A.; Szpicer, A.; Holc, D.; Wierzbicka, A.; Poltorak, A. Geese fillets flavor stability and quality characteristics at different stages of sous-vide cooking. Anim. Sci. Pap. Rep. 2021, 39, 419–435. [Google Scholar]
- Narsaiah, K.; Biswas, A.K.; Mandal, P.K. Nondestructive methods for carcass and meat quality evaluation. In Meat Quality Analysis; Academic Press: Cambridge, MA, USA, 2020; pp. 37–49. [Google Scholar] [CrossRef]
- Selani, M.M.; Shirado, G.A.; Margiotta, G.B.; Rasera, M.L.; Marabesi, A.C.; Piedade, S.M.; Contreras-Castillo, C.J.; Canniatti-Brazaca, S.G. Pineapple by-product and canola oil as partial fat replacers in low-fat beef burger: Effects on oxidative stability, cholesterol content and fatty acid profile. Meat Sci. 2016, 115, 9–15. [Google Scholar] [CrossRef] [PubMed]
- USDA. 2015–2020 Dietary Guidelines for Americans; USDA: Washington, DC, USA, 2015. [Google Scholar]
- FAO. Fat and fatty acid requirements for adults. In Fats and Fatty Acids in Human Nutrition; FAO: Rome, Italy, 2010; Volume 91. [Google Scholar]
- EFSA Dietary Reference Values for nutrients Summary report. EFSA Support. Publ. 2017, 14, e15121E.
- Ulbricht, T.L.V.; Southgate, D.A.T. Coronary heart disease: Seven dietary factors. Lancet 1991, 338, 985–992. [Google Scholar] [CrossRef]
- Carvalho, F.A.L.; Pateiro, M.; Domínguez, R.; Barba-Orellana, S.; Mattar, J.; Rimac Brnčić, S.; Barba, F.J.; Lorenzo, J.M. Replacement of meat by spinach on physicochemical and nutritional properties of chicken burgers. J. Food Process. Preserv. 2019, 43, e13935. [Google Scholar] [CrossRef]
- Wojtasik-Kalinowska, I.; Górska-Horczyczak, E.; Stelmasiak, A.; Marcinkowska-Lesiak, M.; Onopiuk, A.; Wierzbicka, A.; Półtorak, A. Effect of Temperature and Oxygen Dose During Rendering of Goose Fat to Promote Fatty Acid Profiles. Eur. J. Lipid Sci. Technol. 2021, 123, 2100085. [Google Scholar] [CrossRef]
- Rodríguez-Carpena, J.G.; Morcuende, D.A.V.I.D.; Estévez, M.A.R.I.O. Avocado, sunflower and olive oils as replacers of pork back-fat in burger patties: Effect on lipid composition, oxidative stability and quality traits. Meat Sci. 2012, 90, 106–115. [Google Scholar] [CrossRef]
- Liu, J.; Chriki, S.; Ellies-Oury, M.-P.; Legrand, I.; Pogorzelski, G.; Wierzbicki, J.; Farmer, L.; Troy, D.; Polkinghorne, R.; Hocquette, J. European conformation and fat scores of bovine carcasses are not good indicators of marbling. Meat Sci. 2020, 170, 108233. [Google Scholar] [CrossRef]
- Brodowska, M.; Guzek, D.; Kołota, A.; Głąbska, D.; Górska-Horczyczak, E.; Wojtasik-Kalinowska, I.; Weirzbicka, A. Effect of diet on oxidation and profile of volatile compounds of pork after freezing storage. J. Food Nutr. Res. 2016, 55, 40–47. [Google Scholar]
- Wojtasik-Kalinowska, I.; Guzek, D.; Brodowska, M.; Godziszewska, J.; Górska-Horczyczak, E.; Pogorzelska-Nowicka, E.; Sakowska, A.; Gantner, M.; Wierzbicka, A. The effect of addition of Nigella sativa L. oil on the quality and shelf life of pork patties. J. Food Process. Preserv. 2017, 41, e13294. [Google Scholar] [CrossRef]
- Heck, R.T.; Vendruscolo, R.G.; Etchepare, M.D.A.; Cichoski, A.J.; Menezes, C.R.; Barin, J.S.; Lorenzo, J.M.; Wagner, R.; Campagnol, P.C.B. Is it possible to produce a low-fat burger with a healthy n − 6/n − 3 PUFA ratio without affecting the technological and sensory properties? Meat Sci. 2017, 130, 16–25. [Google Scholar] [CrossRef]
- Fernández, M.; Ordóñez, J.A.; Cambero, I.; Santos, C.; Pin, C.; de la Hoz, L. Fatty acid compositions of selected varieties of Spanish dry ham related to their nutritional implications. Food Chem. 2007, 101, 107–112. [Google Scholar] [CrossRef]
- Górska-Horczyczak, E.; Wojtasik-Kalinowska, I.; Wierzbicka, A. Supplemental linseed oil and antioxidants affect fatty acid composition, oxidation and colour stability of frozen pork. S. Afr. J. Anim. Sci. 2020, 50, 253–263. [Google Scholar] [CrossRef]
- Nowak, N.; Grzebieniarz, W.; Khachatryan, G.; Khachatryan, K.; Konieczna-Molenda, A.; Krzan, M.; Grzyb, J. Synthesis of Silver and Gold Nanoparticles in Sodium Alginate Matrix Enriched with Graphene Oxide and Investigation of Properties of the Obtained Thin Films. Appl. Sci. 2021, 11, 3857. [Google Scholar] [CrossRef]
- Półtorak, A.; Wyrwisz, J.; Moczkowska, M.; Marcinkowska-Lesiak, M. The impact of the aging process on the components of texture of beef from different production systems. Postępy Tech. Przetw. Spoż. 2014, 2, 112–119. [Google Scholar]
- Antoniewska, A.; Rutkowska, J.; Pineda, M.M.; Adamska, A. Antioxidative, nutritional and sensory properties of muffins with buckwheat flakes and amaranth flour blend partially substituting for wheat flour. LWT 2018, 89, 217–223. [Google Scholar] [CrossRef]
- Djekic, I.; Lorenzo, J.M.; Munekata, P.E.; Gagaoua, M.; Tomasevic, I. Review on characteristics of trained sensory panels in food science. J. Texture Stud. 2021, 52, 501–509. [Google Scholar] [CrossRef]


| Day 0 | Day 7 | |||||||
|---|---|---|---|---|---|---|---|---|
| L* | a* | b* | pH | L* | a* | b* | pH | |
| raw | ||||||||
| CO | 42.15 (3.56) | 21.26 (3.10) b | 10.96 (1.3) Ab | 5.38 (0.02) Aa | 47.19 (3.27) B | 14.01 (1.66) Aa | 7.83 (0.78) Aa | 5.67 (0.05) Ab |
| S-25% | 42.26 (2.91) | 22.17 (1.69) b | 12.03 (1.31) ABb | 5.50 (0.02) Ba | 43.89 (4.18) AB | 17.24 (1.62) Ba | 9.87 (0.85) Ba | 5.81 (0.13) Bb |
| S-50% | 42.75 (2.46) | 22.43 (0.96) b | 11.75 (1.16) ABb | 5.51 (0.04) Ba | 41.91 (2.23) A | 19.05 (2.60) BCa | 9.92 (1.51) Ba | 5.68 (0.03) Ab |
| S-75% | 42.71 (2.17) | 22.11 (2.13) b | 11.67 (1.32) ABb | 5.56 (0.02) Ca | 42.73 (4.15) A | 19.06 (1.45) BCa | 10.30 (0.99) BCa | 5.69 (0.05) ABb |
| S-100% | 43.33 (2.59) | 23.16 (1.36) b | 12.99 (0.89) Bb | 5.56 (0.02) Ca | 41.77 (2.30) A | 20.05 (1.18) Ca | 11.46 (1.28) Ca | 5.67 (0.03) Ab |
| SEM | 0.381 | 0.283 | 0.189 | 0.016 | 0.534 | 0.388 | 0.226 | 0.016 |
| grilled | ||||||||
| CO | 30.75 (2.37) Ba | 6.76 (0.40) A | 6.8 (1.01) a | 37.76 (2.47) b | 6.38 (0.55) A | 8.82 (0.90) Ab | ||
| S-25% | 26.27 (2.19) Aa | 6.78 (1.40) A | 6.80 (1.50) a | 34.96 (2.73) b | 6.72 (0.51) A | 9.07 (0.97) Ab | ||
| S-50% | 28.36 (3.03) ABa | 7.75 (1.16) AB | 8.24 (1.53) a | 37.39 (2.65) b | 7.86 (0.77) B | 10.09 (0.96) ABb | ||
| S-75% | 29.14 (2.3) ABa | 8.05 (1.18) AB | 7.89 (1.58) a | 37.76 (2.90) b | 8.04 (0.84) BC | 10.31 (1.79) ABb | ||
| S-100% | 29.74 (1.5) Ba | 8.47 (1.17) B | 8.33 (1.34) a | 38.32 (2.74) b | 8.89 (1.15) C | 10.86 (1.23) Bb | ||
| SEM | 0.382 | 0.180 | 0.214 | 0.403 | 0.170 | 0.198 | ||
| Storage Day | Variants | Hardness (N) | Springiness (-) | Cohesiveness (-) |
|---|---|---|---|---|
| 0 | CO | 75.82 (5.07) Ca | 0.53(0.06) C | 0.39 (0.03) B |
| S-25% | 31.44 (2.31) Ba | 0.48 (0.03) BC | 0.36 (0.02) Bb | |
| S-50% | 20.64 (7.07) BA | 0.39 (0.07) B | 0.33 (0.02) Bb | |
| S-75% | 10.29 (0.47) Aa | 0.2 (0.01) A | 0.23 (0.01) Aa | |
| S-100% | 10.21 (0.68) Aa | 0.26 (0.04) A | 0.25 (0.03) A | |
| 7 | CO | 102.36 (1.94) Db | 0.52 (0.01) B | 0.38 (0) C |
| S-25% | 44.83 (3.25) Cb | 0.4 (0.04) AB | 0.3 (0.02) Ba | |
| S-50% | 27.36 (4.57) B | 0.38 (0.05) AB | 0.28 (0.03) ABa | |
| S-75% | 20.57 (3.13) BAb | 0.34 (0.09) AB | 0.29 (0.03) ABb | |
| S-100% | 18.63 (1.07) Ab | 0.27 (0.06) A | 0.24 (0.02) A | |
| SEM | 5.366 | 0.021 | 0.011 |
| Storage Day | Treatment | ||||
|---|---|---|---|---|---|
| CO | S-25% | S-50% | S-75% | S-100% | |
| Appearance | |||||
| 0 | 8.6 (1.26) A | 7.6 (1.47) AB | 7.0 (0.92) AB | 6.4 (2.47) AB | 5.5 (2.30) B |
| 7 | 8.2 (0.96) A | 7.9 (0.98) A | 6.0 (1.34) B | 5.7 (1.34) B | 5.2 (2.28) B |
| Color | |||||
| 0 | 8.1 (1.40) | 7.6 (1.19) | 6.7 (1.33) | 6.6 (1.73) | 6.5 (1.82) |
| 7 | 8.0 (0.76) A | 7.4 (1.64) AB | 5.9 (2.21) B | 5.9 (1.36) B | 5.5 (1.29) B |
| Flavor | |||||
| 0 | 8.4 (1.46) | 8.0 (1.34) | 7.0 (1.71) | 6.7 (1.94) | 6.5 (2.62) |
| 7 | 7.9 (1.20) A | 7.4 (1.59) AB | 6.0 (1.50) AB | 5.7 (1.70) B | 5.4 (1.78) B |
| Taste | |||||
| 0 | 8.5 (1.30) A | 7.9 (1.24) AB | 6.6 (1.57) ABC | 5.9 (2.23) BC | 5.4 (1.59) C |
| 7 | 7.3 (1.41) A | 6.8 (1.30) A | 5.0 (1.84) B | 4.8 (1.94) B | 4.7 (1.79) B |
| Juiciness | |||||
| 0 | 8.0 (1.80) | 7.5 (1.87) | 7.3 (1.47) | 6.2 (1.77) | 6.3 (1.63) |
| 7 | 6.9 (2.16) | 6.6 (1.41) | 5.7 (2.01) | 5.1 (1.30) | 5.1 (1.64) |
| Texture | |||||
| 0 | 8.2 (1.80) A | 7.4 (2.26) A | 6.6 (1.58) AB | 4.7 (1.94 BC | 4.0 (2.57) C |
| 7 | 6.7 (2.13) | 6.5 (2.06) | 5.4 (2.02) | 4.9 (1.94 | 4.3 (1.66) |
| Overall acceptability | |||||
| 0 | 8.3 (1.55) A | 7.6 (1.69) AB | 6.8 (1.76) AB | 5.6 (2.21) BC | 4.5 (2.26) C |
| 7 | 7.4 (1.40) A | 6.7 (1.61) AB | 5.1 (1.42) B | 5.0 (1.45) B | 4.9 (1.72) B |
| SA | SC | SF | STa | SJ | STe | SOa | FS | FM | FP | TT | TS | L* | a* | b* | pH | EAd | EAk | EK | |
|---|---|---|---|---|---|---|---|---|---|---|---|---|---|---|---|---|---|---|---|
| SA | 1 | ||||||||||||||||||
| SC | 0.92 * | 1 | |||||||||||||||||
| SF | 0.95 * | 0.96 * | 1 | ||||||||||||||||
| STa | 0.94 * | 0.94 * | 0.98 * | 1 | |||||||||||||||
| SJ | 0.83 * | 0.87 * | 0.92 * | 0.92 * | 1 | ||||||||||||||
| STe | 0.91 * | 0.80 * | 0.86 * | 0.90 * | 0.84 * | 1 | |||||||||||||
| SOa | 0.96 * | 0.88 * | 0.93 * | 0.96 * | 0.87 * | 0.97 * | 1 | ||||||||||||
| FS | 0.81 * | 0.6 | 0.64 * | 0.62 | 0.41 | 0.71 * | 0.69 * | 1 | |||||||||||
| FM | 0.6 | 0.67 * | 0.65 * | 0.69 * | 0.65 * | 0.66 * | 0.70 * | 0.26 | 1 | ||||||||||
| FP | −0.90 * | −0.75 * | −0.78 * | −0.77 * | −0.58 | −0.84 * | −0.83 * | −0.94 * | −0.58 | 1 | |||||||||
| TT | 0.79 * | 0.75 * | 0.69 * | 0.67 * | 0.49 | 0.68 * | 0.72 * | 0.75 * | 0.73 * | −0.90 * | 1 | ||||||||
| TS | 0.82 * | 0.7 * | 0.75 * | 0.78 * | 0.66 * | 0.89 * | 0.85 * | 0.79 * | 0.72 * | −0.93 * | 0.82 * | 1 | |||||||
| L* | −0.27 | −0.37 | −0.5 | −0.50 | −0.66 * | −0.29 | −0.34 | 0.19 | −0.15 | −0.10 | 0.26 | −0.01 | 1 | ||||||
| a* | −0.95 * | −0.85 * | −0.88 * | −0.85 * | −0.71 * | −0.86 * | −0.88 * | −0.87 * | −0.55 | 0.93 * | −0.80 * | −0.86 * | 0.13 | 1 | |||||
| b* | −0.66 * | −0.75 * | −0.84 * | −0.83 * | −0.88 * | −0.63 | −0.69 * | −0.21 | −0.51 | 0.36 | −0.24 | −0.4 | 0.86 * | 0.54 | 1 | ||||
| pH | −0.28 | −0.38 | −0.47 | −0.53 | −0.65 * | −0.41 | −0.44 | 0.20 | −0.61 | 0.05 | −0.05 | −0.23 | 0.73 * | 0.09 | 0.76 * | 1 | |||
| EAd | 0.42 | 0.39 | 0.25 | 0.19 | 0.02 | 0.25 | 0.28 | 0.60 | 0.30 | −0.61 | 0.78 * | 0.48 | 0.63 | −0.55 | 0.26 | 0.54 | 1 | ||
| EAk | 0.15 | 0.2 | 0.34 | 0.40 | 0.50 | 0.29 | 0.29 | −0.22 | 0.18 | 0.12 | −0.32 | 0.01 | −0.86 * | 0.00 | −0.75 * | −0.83 * | −0.8 * | 1 | |
| EK | −0.88 * | −0.84 * | −0.83 * | −0.82 * | −0.62 | −0.80 * | −0.84 * | −0.78 * | −0.75 * | 0.93 * | −0.93 * | −0.88 * | −0.02 | 0.92 * | 0.48 | 0.18 | −0.62 | 0.05 | 1 |
| Fatty Acid Profile (%) | Açai Oil | Tallow |
|---|---|---|
| C14:0 | 0.08 | 3.57 |
| C14:1 n5 c-9 | 0.00 | 1.19 |
| C15:0 | 0.01 | 0.36 |
| C16:0 | 8.27 | 26.91 |
| C16:1 n7 c-9 | 0.08 | 3.79 |
| C17:0 | 0.06 | 0.85 |
| C17:1 n7 c-10 | 0.03 | 0.63 |
| C18:0 | 3.38 | 15.36 |
| C18:1 n9 c-9 | 28.73 | 44.13 |
| C18:2 n6 c-9,12 | 54.51 | 1.71 |
| C18:3 n3 c-9,12,15 | 2.95 | 0.24 |
| C20:0 | 0.32 | 0.11 |
| C18:2 c-9, t-11 | 0.00 | 0.43 |
| C22:0 | 0.53 | 0.02 |
| C24:0 | 0.18 | 0.00 |
| SFA | 13.35 | 47.38 |
| MUFA | 28.84 | 49.76 |
| PUFA | 57.81 | 2.86 |
| Primary composition | meat | |
| Protein | 19.6% | |
| Moisture | 68.54% | |
| fat | 8.21% | |
| color | Substitute fat | |
| L* | 54.87 | |
| a* | 25.11 | |
| b* | 16.34 |
| Treatment Identification | Substitute Fat (%) | Beef Meat (g) | Tallow (g) | Freeze-Dried Emulsion Hydrogel (g) |
|---|---|---|---|---|
| CO | 0 | 96 | 24 | 0 |
| S-25% | 25 | 96 | 18 | 6 |
| S-50% | 50 | 96 | 12 | 12 |
| S-75% | 75 | 96 | 6 | 18 |
| S-100% | 100 | 96 | 0 | 24 |
Publisher’s Note: MDPI stays neutral with regard to jurisdictional claims in published maps and institutional affiliations. |
© 2022 by the authors. Licensee MDPI, Basel, Switzerland. This article is an open access article distributed under the terms and conditions of the Creative Commons Attribution (CC BY) license (https://creativecommons.org/licenses/by/4.0/).
Share and Cite
Hanula, M.; Szpicer, A.; Górska-Horczyczak, E.; Khachatryan, G.; Pogorzelska-Nowicka, E.; Poltorak, A. Quality of Beef Burgers Formulated with Fat Substitute in a Form of Freeze-Dried Hydrogel Enriched with Açai Oil. Molecules 2022, 27, 3700. https://doi.org/10.3390/molecules27123700
Hanula M, Szpicer A, Górska-Horczyczak E, Khachatryan G, Pogorzelska-Nowicka E, Poltorak A. Quality of Beef Burgers Formulated with Fat Substitute in a Form of Freeze-Dried Hydrogel Enriched with Açai Oil. Molecules. 2022; 27(12):3700. https://doi.org/10.3390/molecules27123700
Chicago/Turabian StyleHanula, Monika, Arkadiusz Szpicer, Elżbieta Górska-Horczyczak, Gohar Khachatryan, Ewelina Pogorzelska-Nowicka, and Andrzej Poltorak. 2022. "Quality of Beef Burgers Formulated with Fat Substitute in a Form of Freeze-Dried Hydrogel Enriched with Açai Oil" Molecules 27, no. 12: 3700. https://doi.org/10.3390/molecules27123700
APA StyleHanula, M., Szpicer, A., Górska-Horczyczak, E., Khachatryan, G., Pogorzelska-Nowicka, E., & Poltorak, A. (2022). Quality of Beef Burgers Formulated with Fat Substitute in a Form of Freeze-Dried Hydrogel Enriched with Açai Oil. Molecules, 27(12), 3700. https://doi.org/10.3390/molecules27123700