Stability and Anti-Aging of Encapsulated Ferulic Acid in Phosphorylated Rice Starch
Abstract
:1. Introduction
2. Results
2.1. Preparation of Encapsulated FA
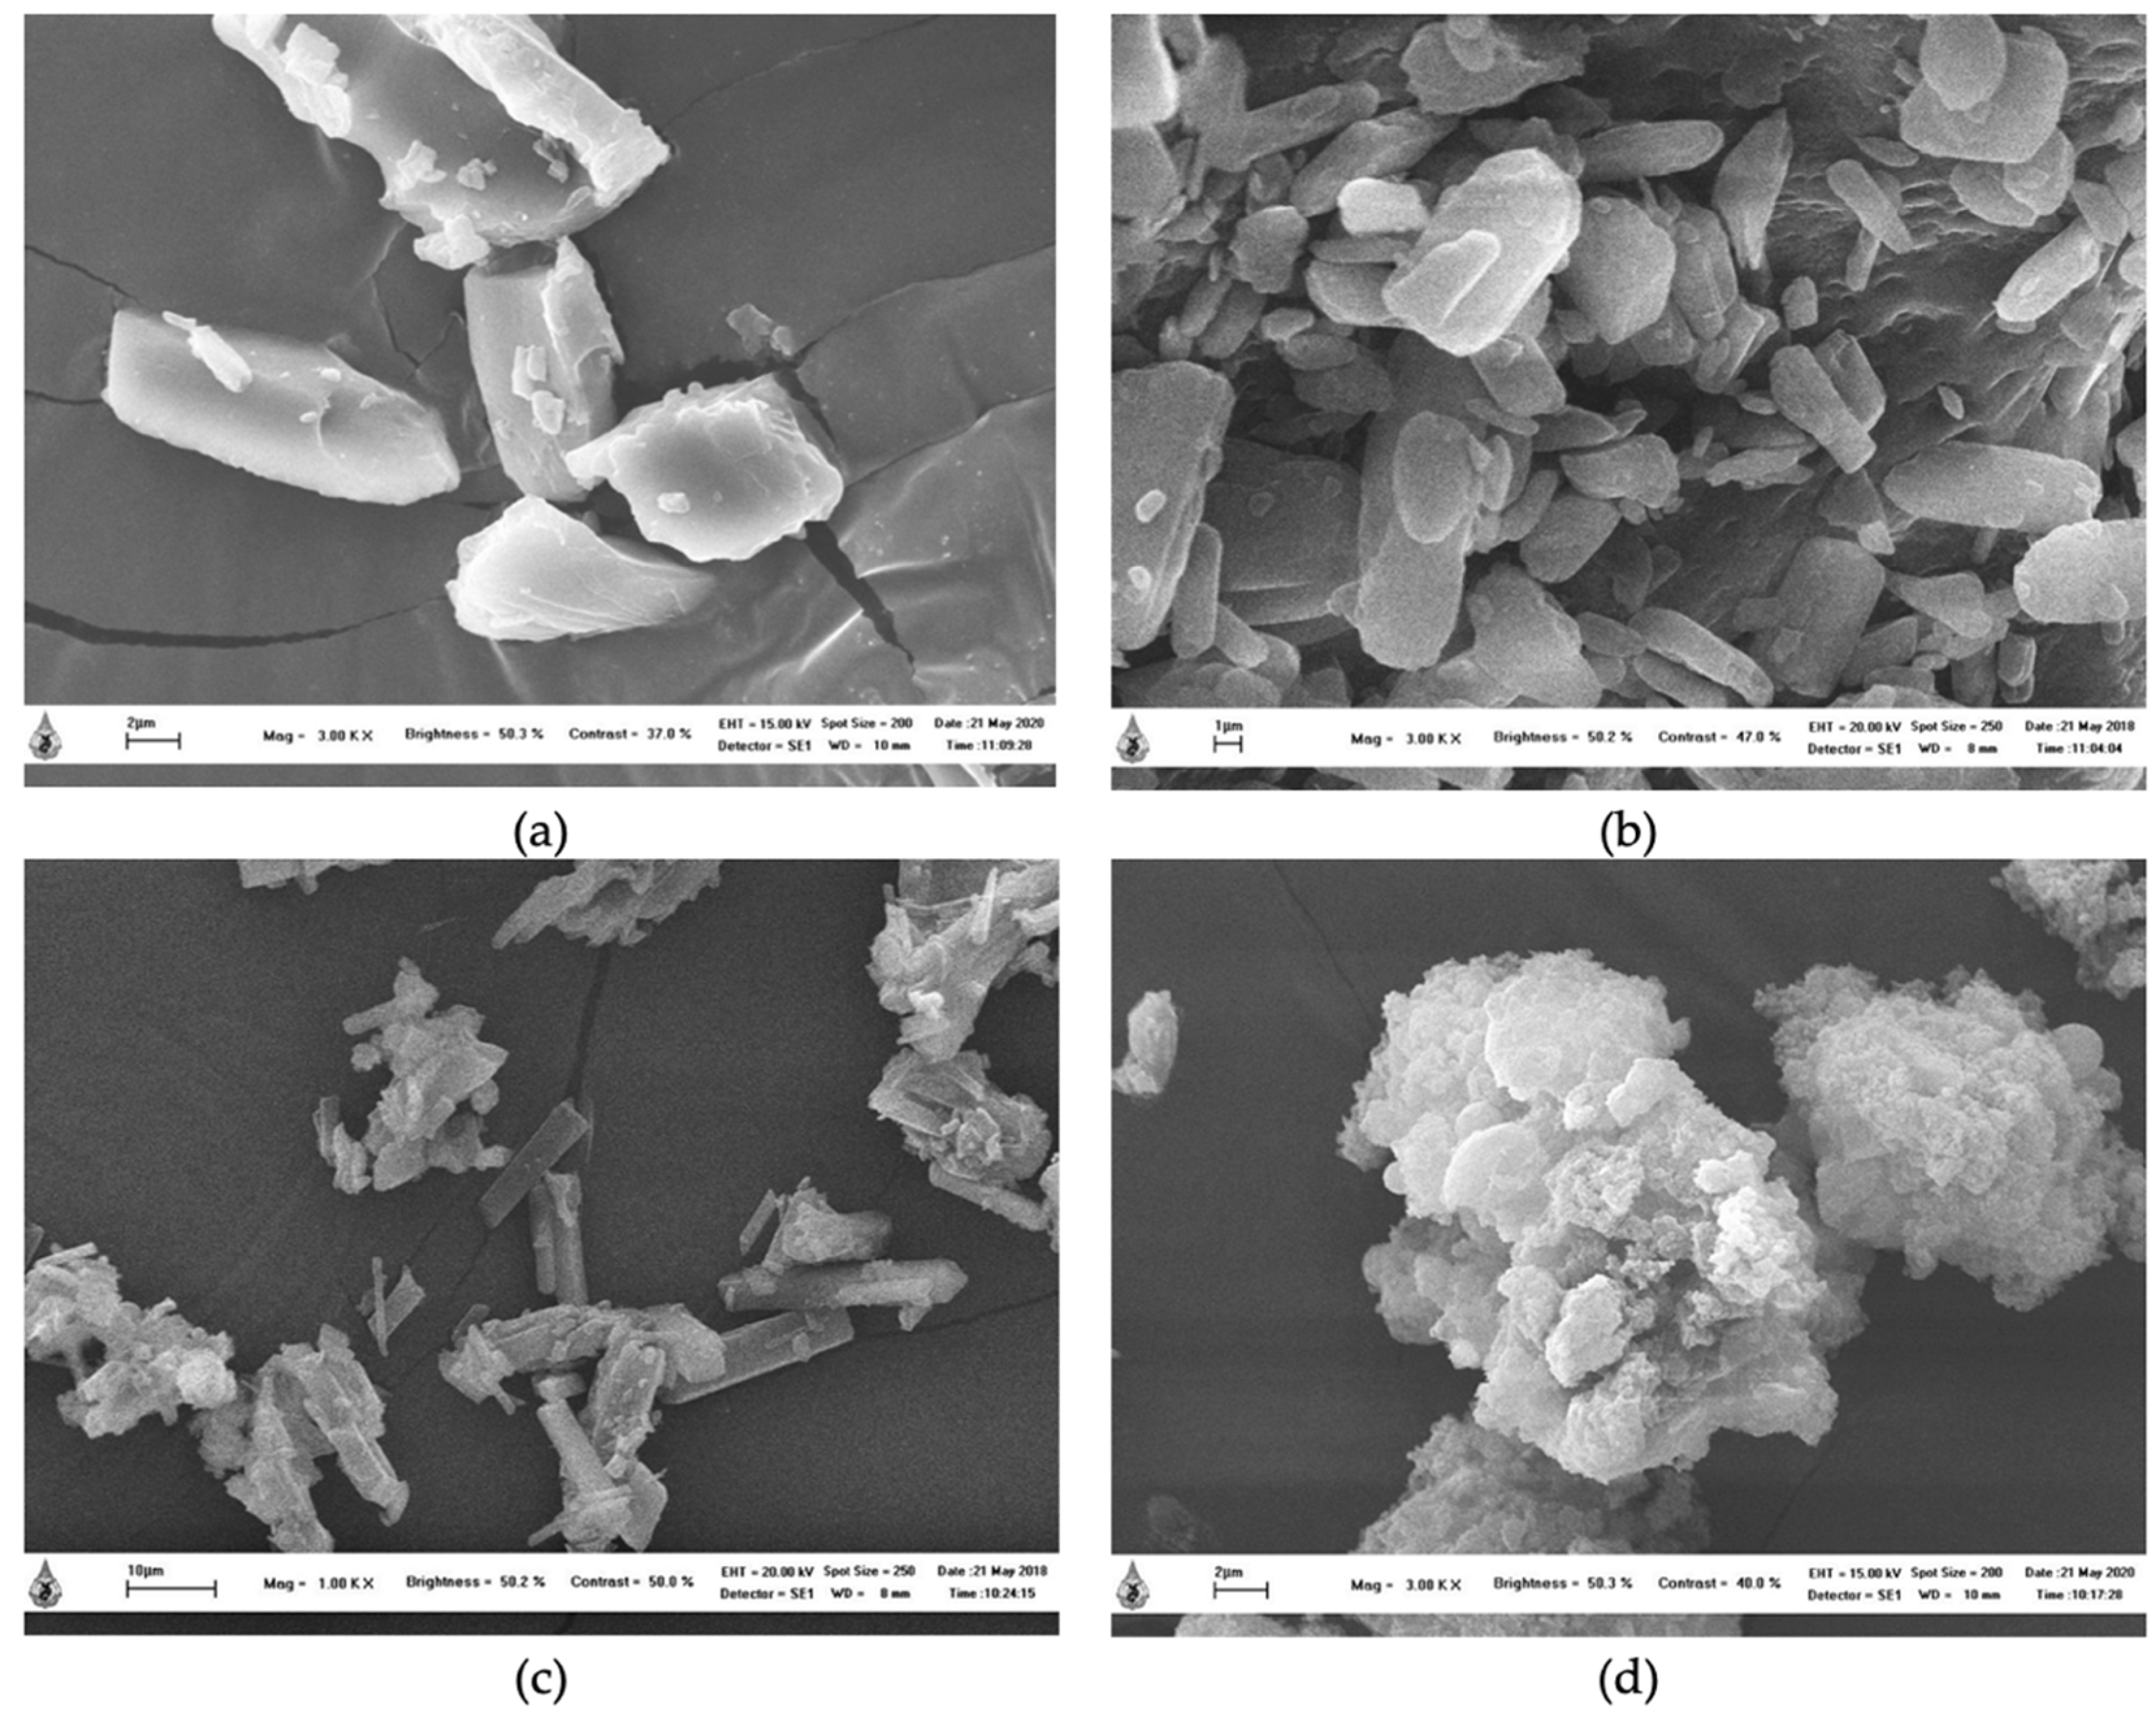
2.2. Scanning Electron Microscope (SEM)
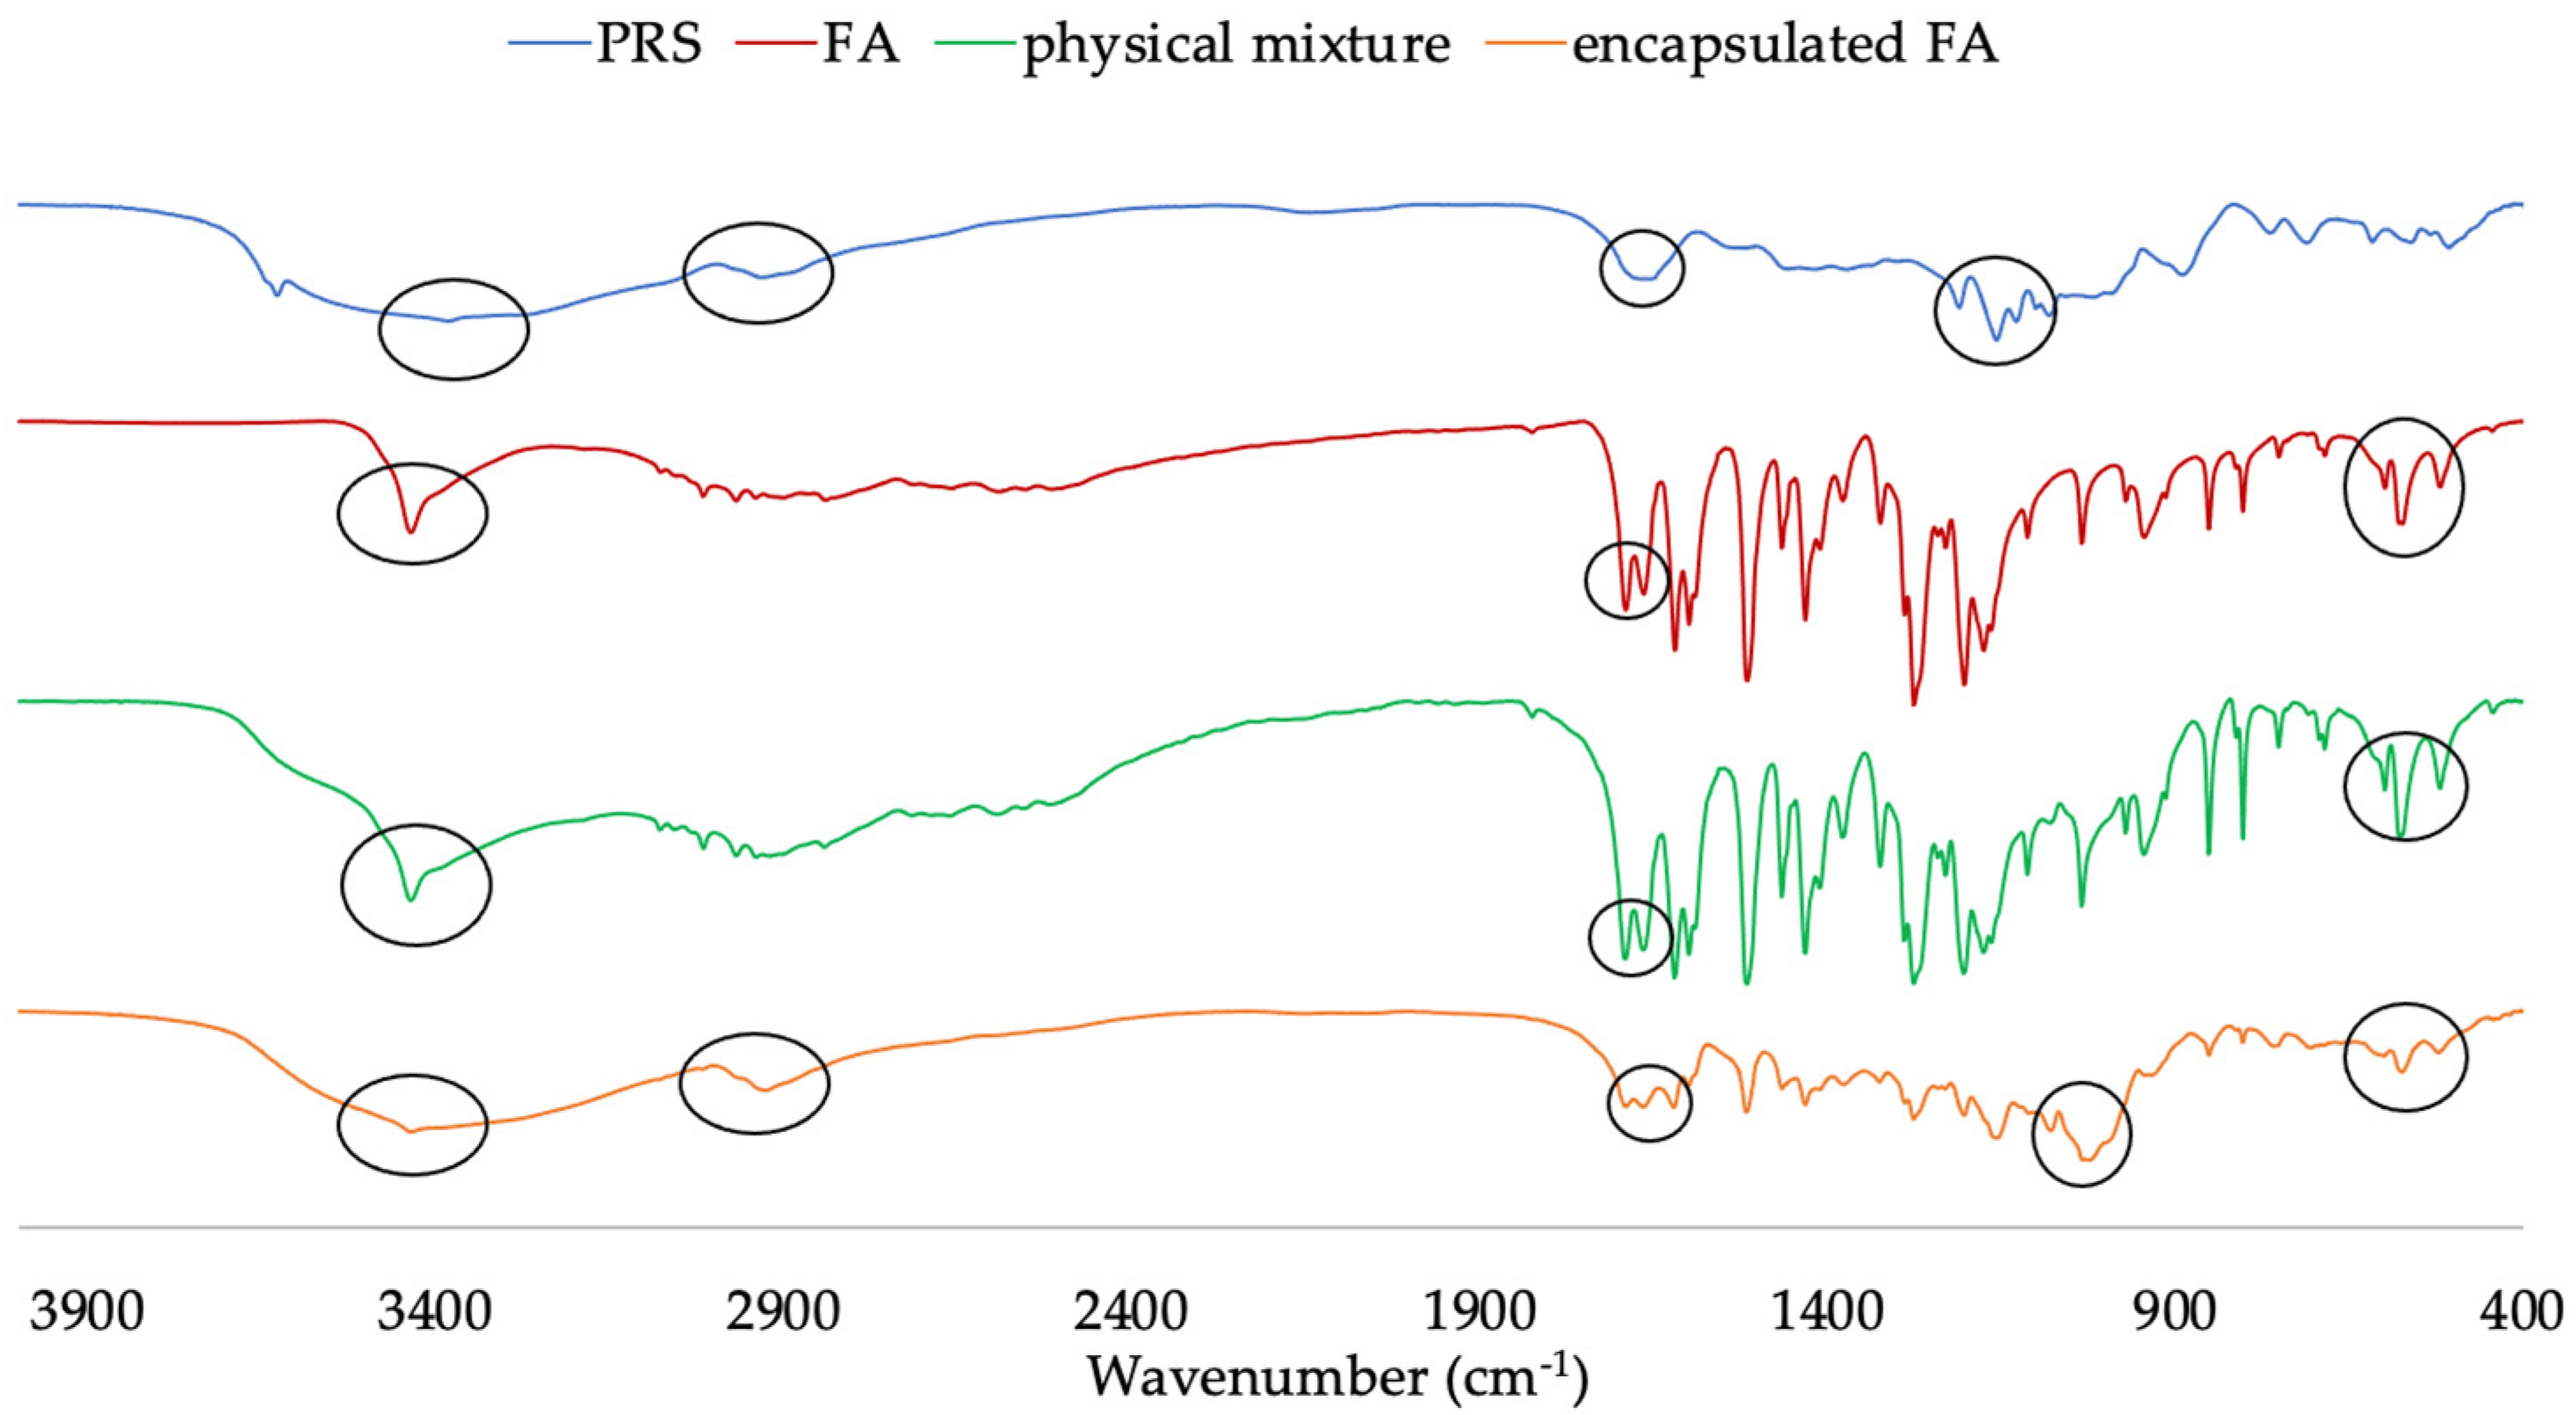
2.3. Fourier Transform Infrared Spectroscopy (FT-IR)
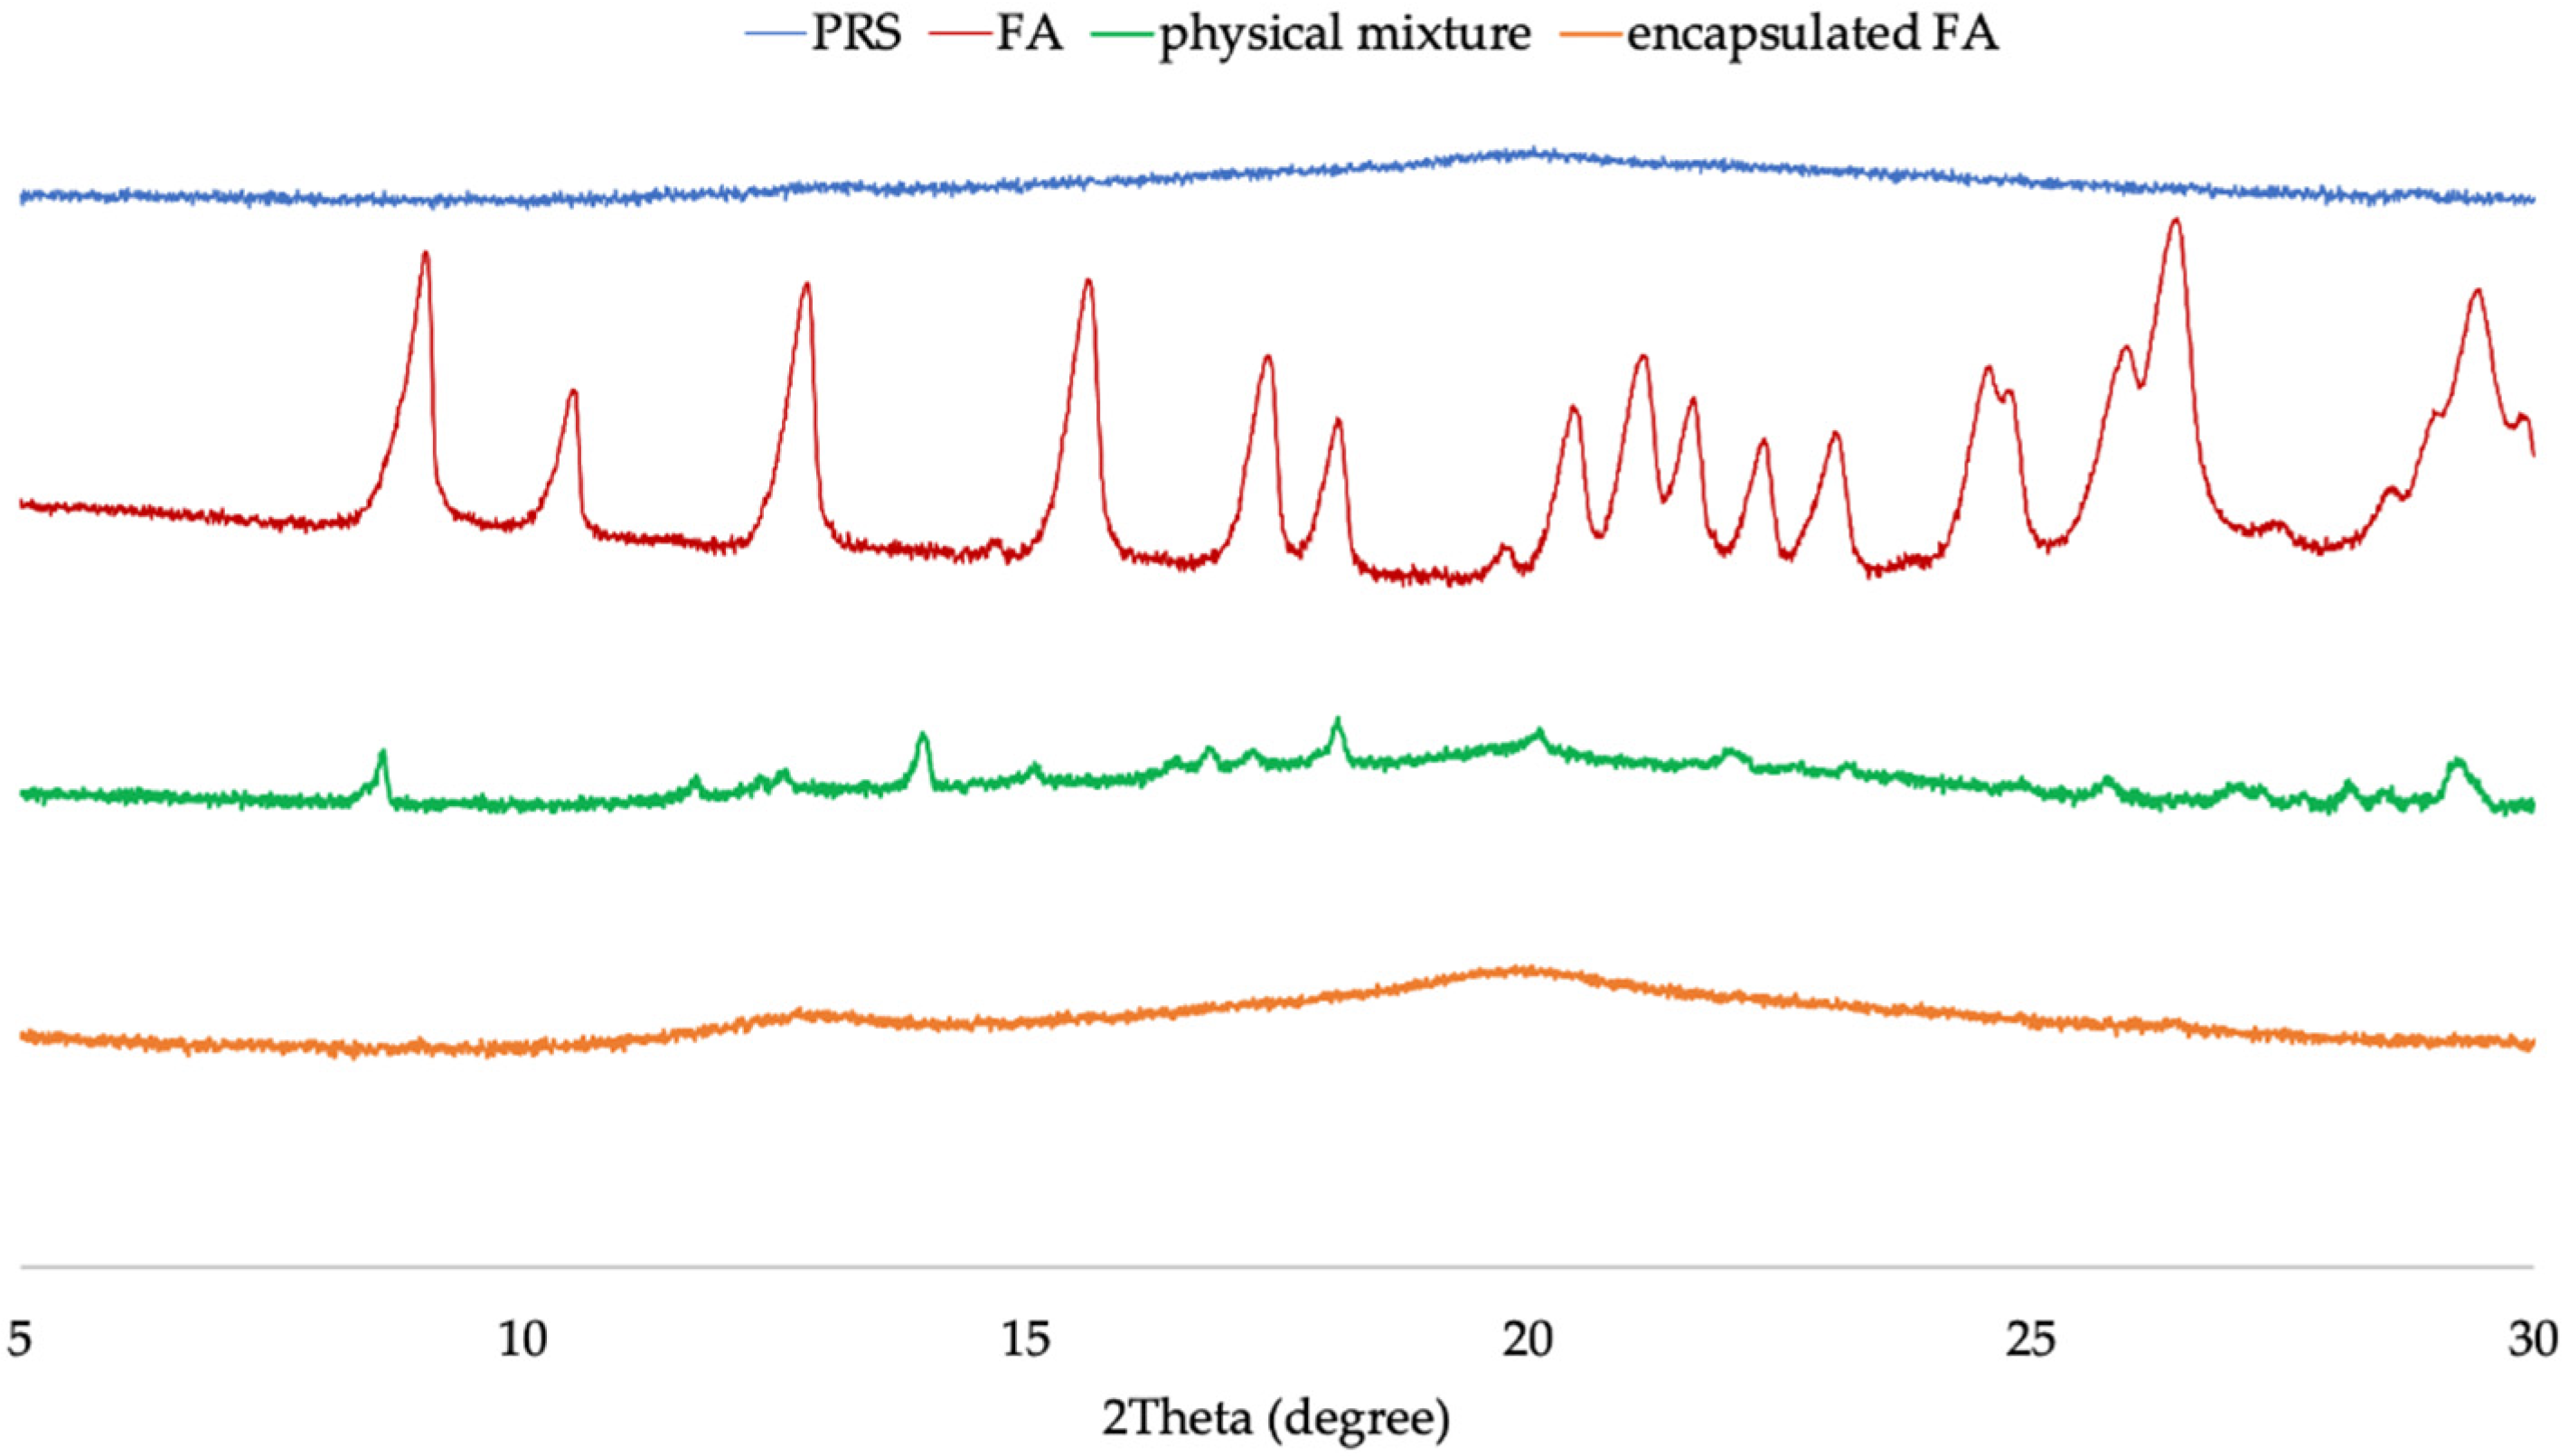
2.4. X-ray Diffraction (XRD)
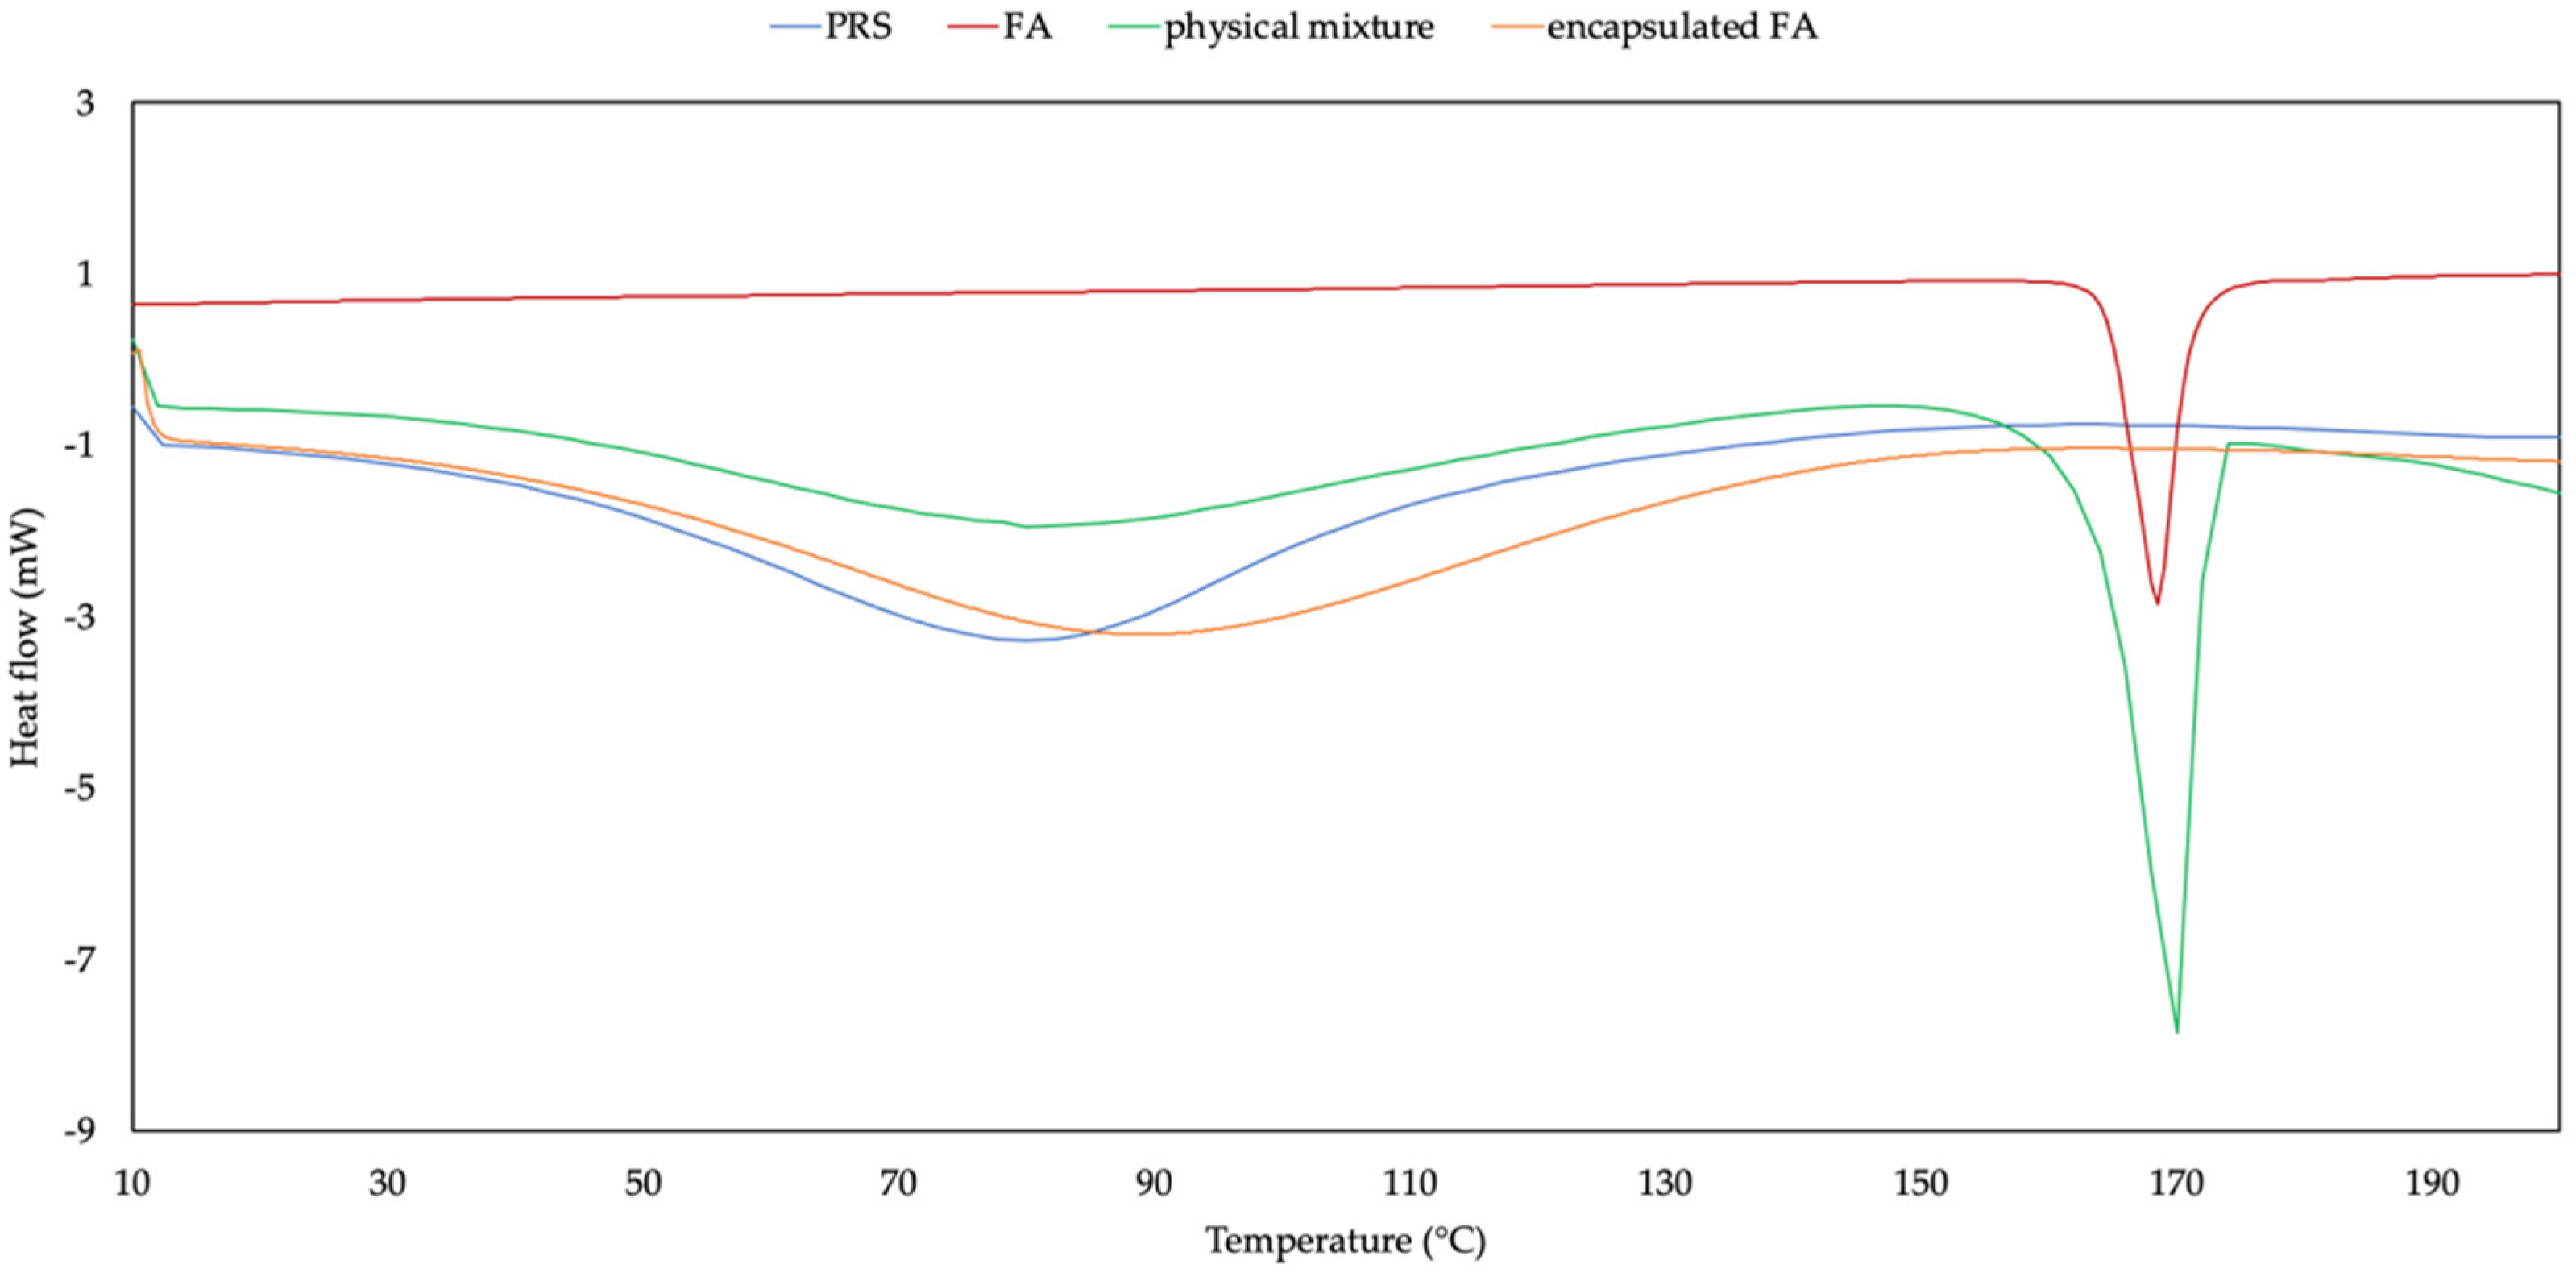
2.5. Differential Scanning Colorimetry (DSC)
2.6. Particle Size and Zeta Potential Measurement
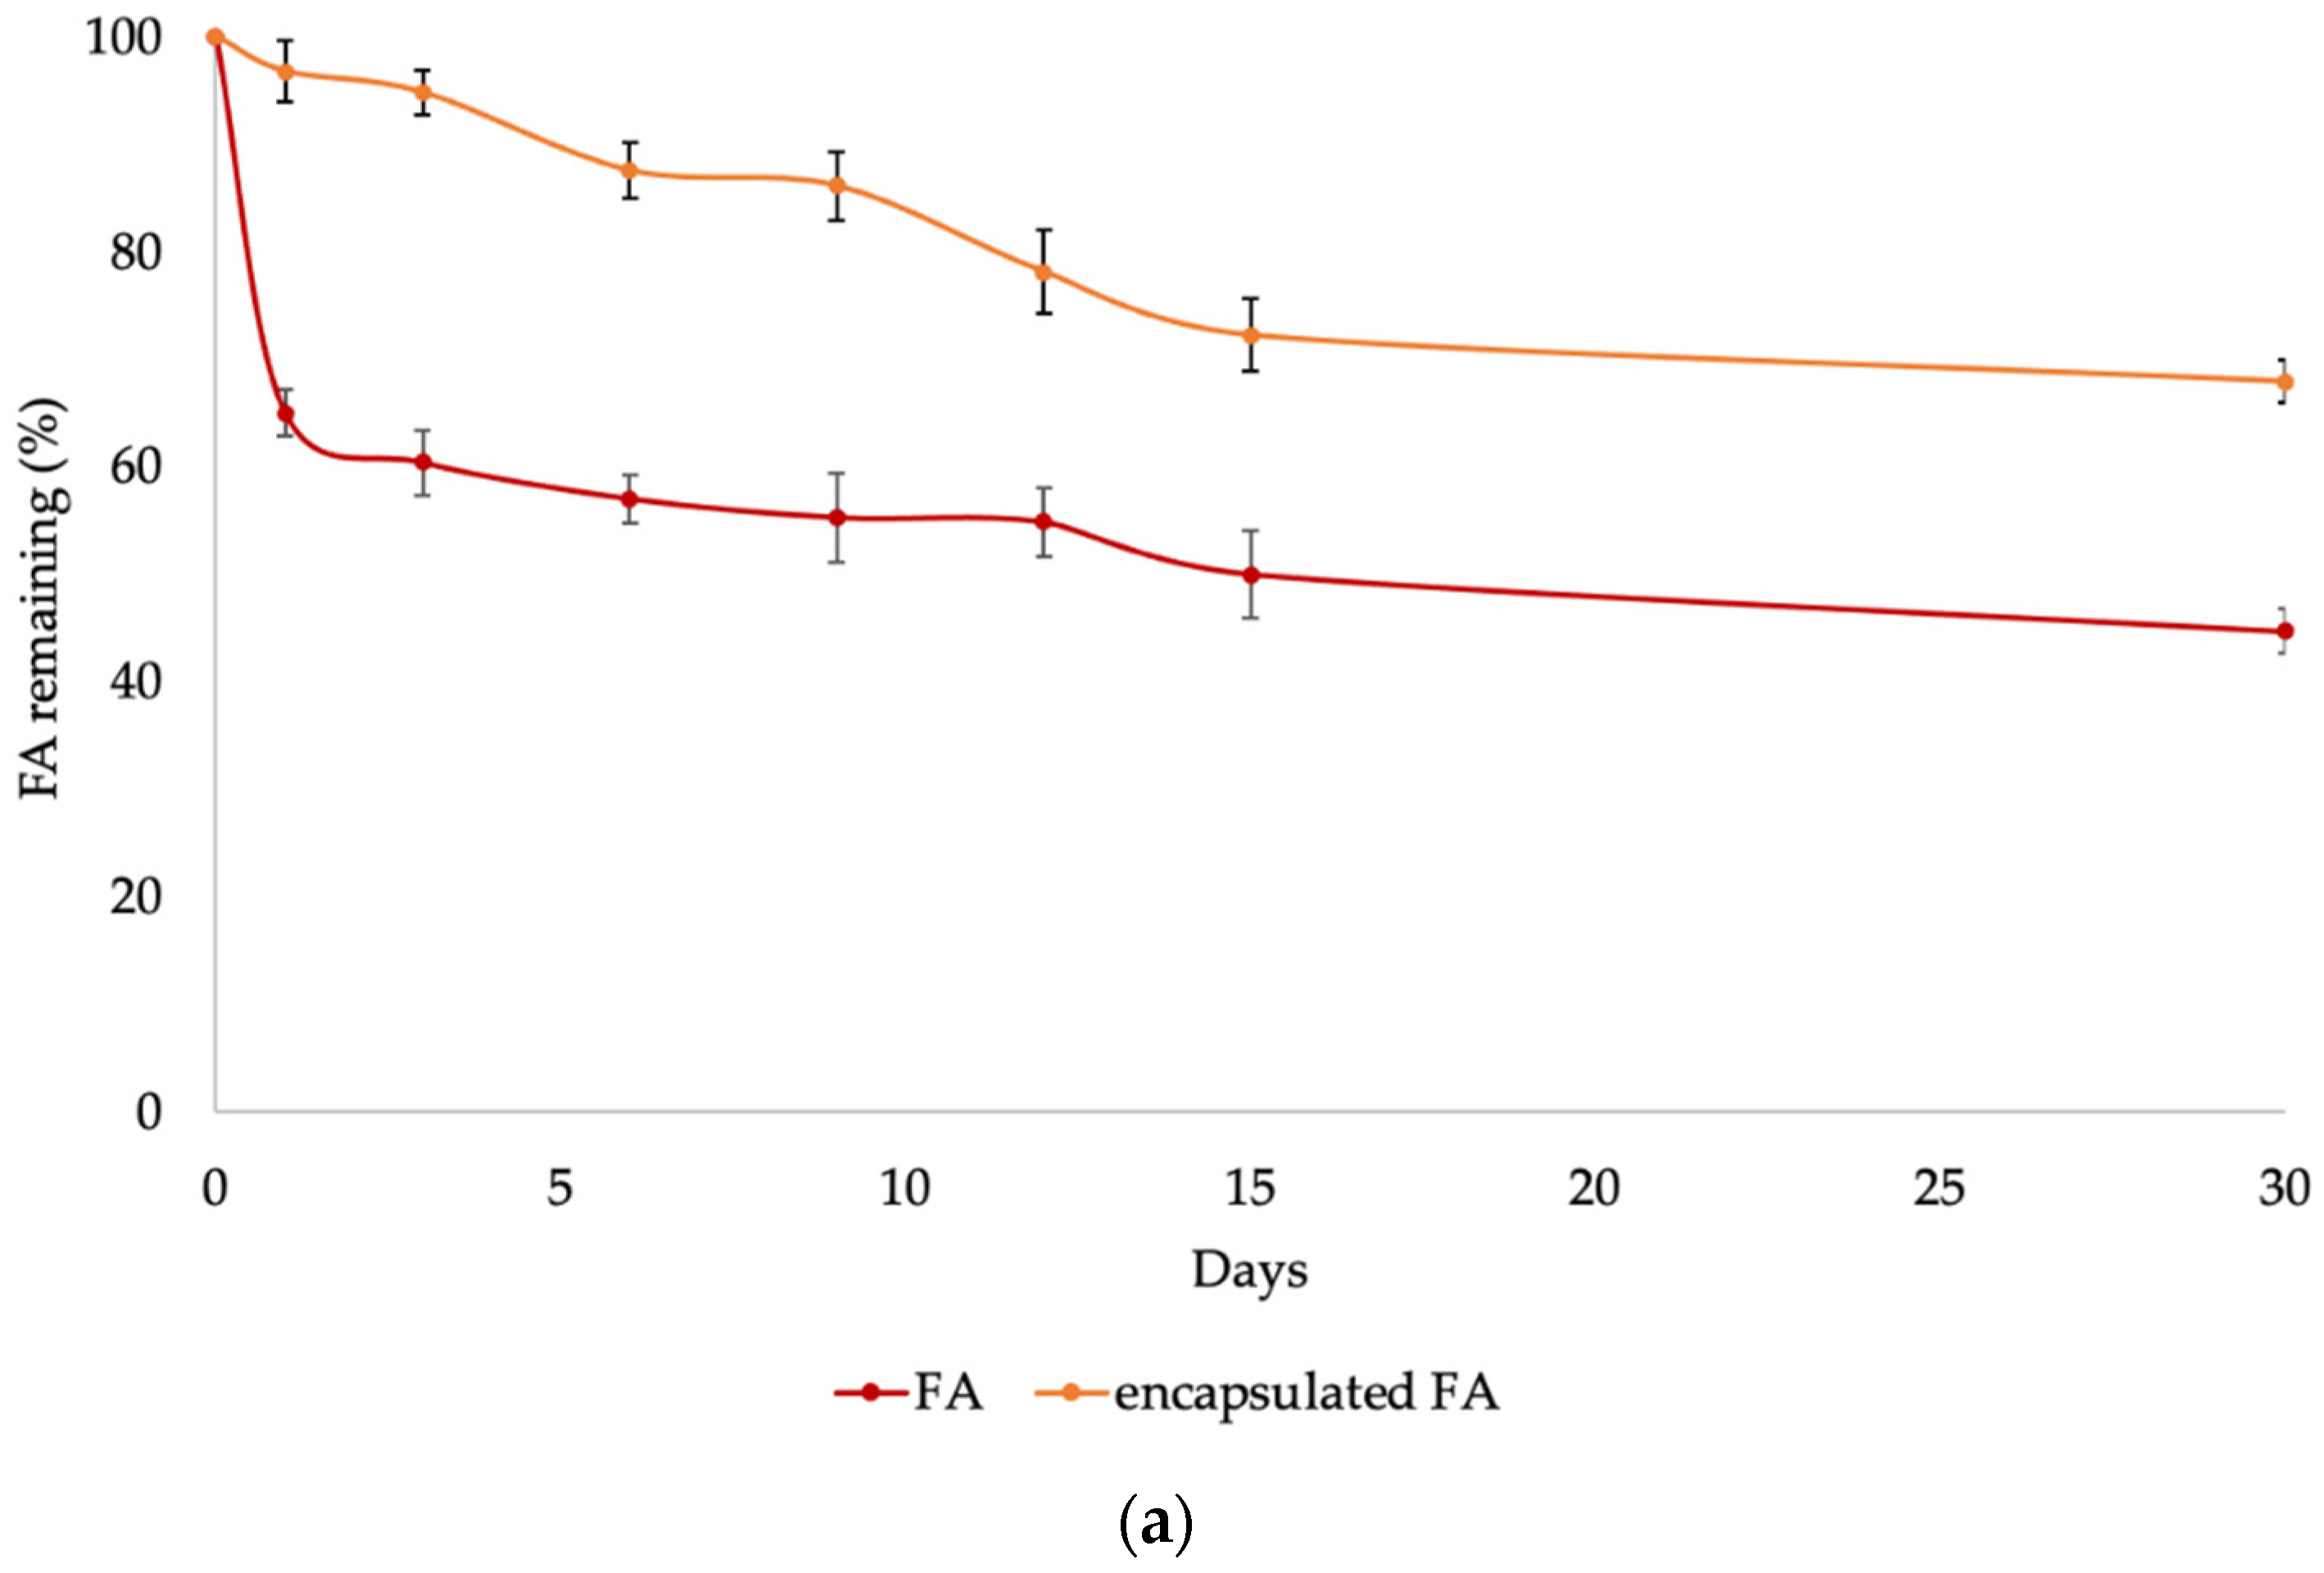
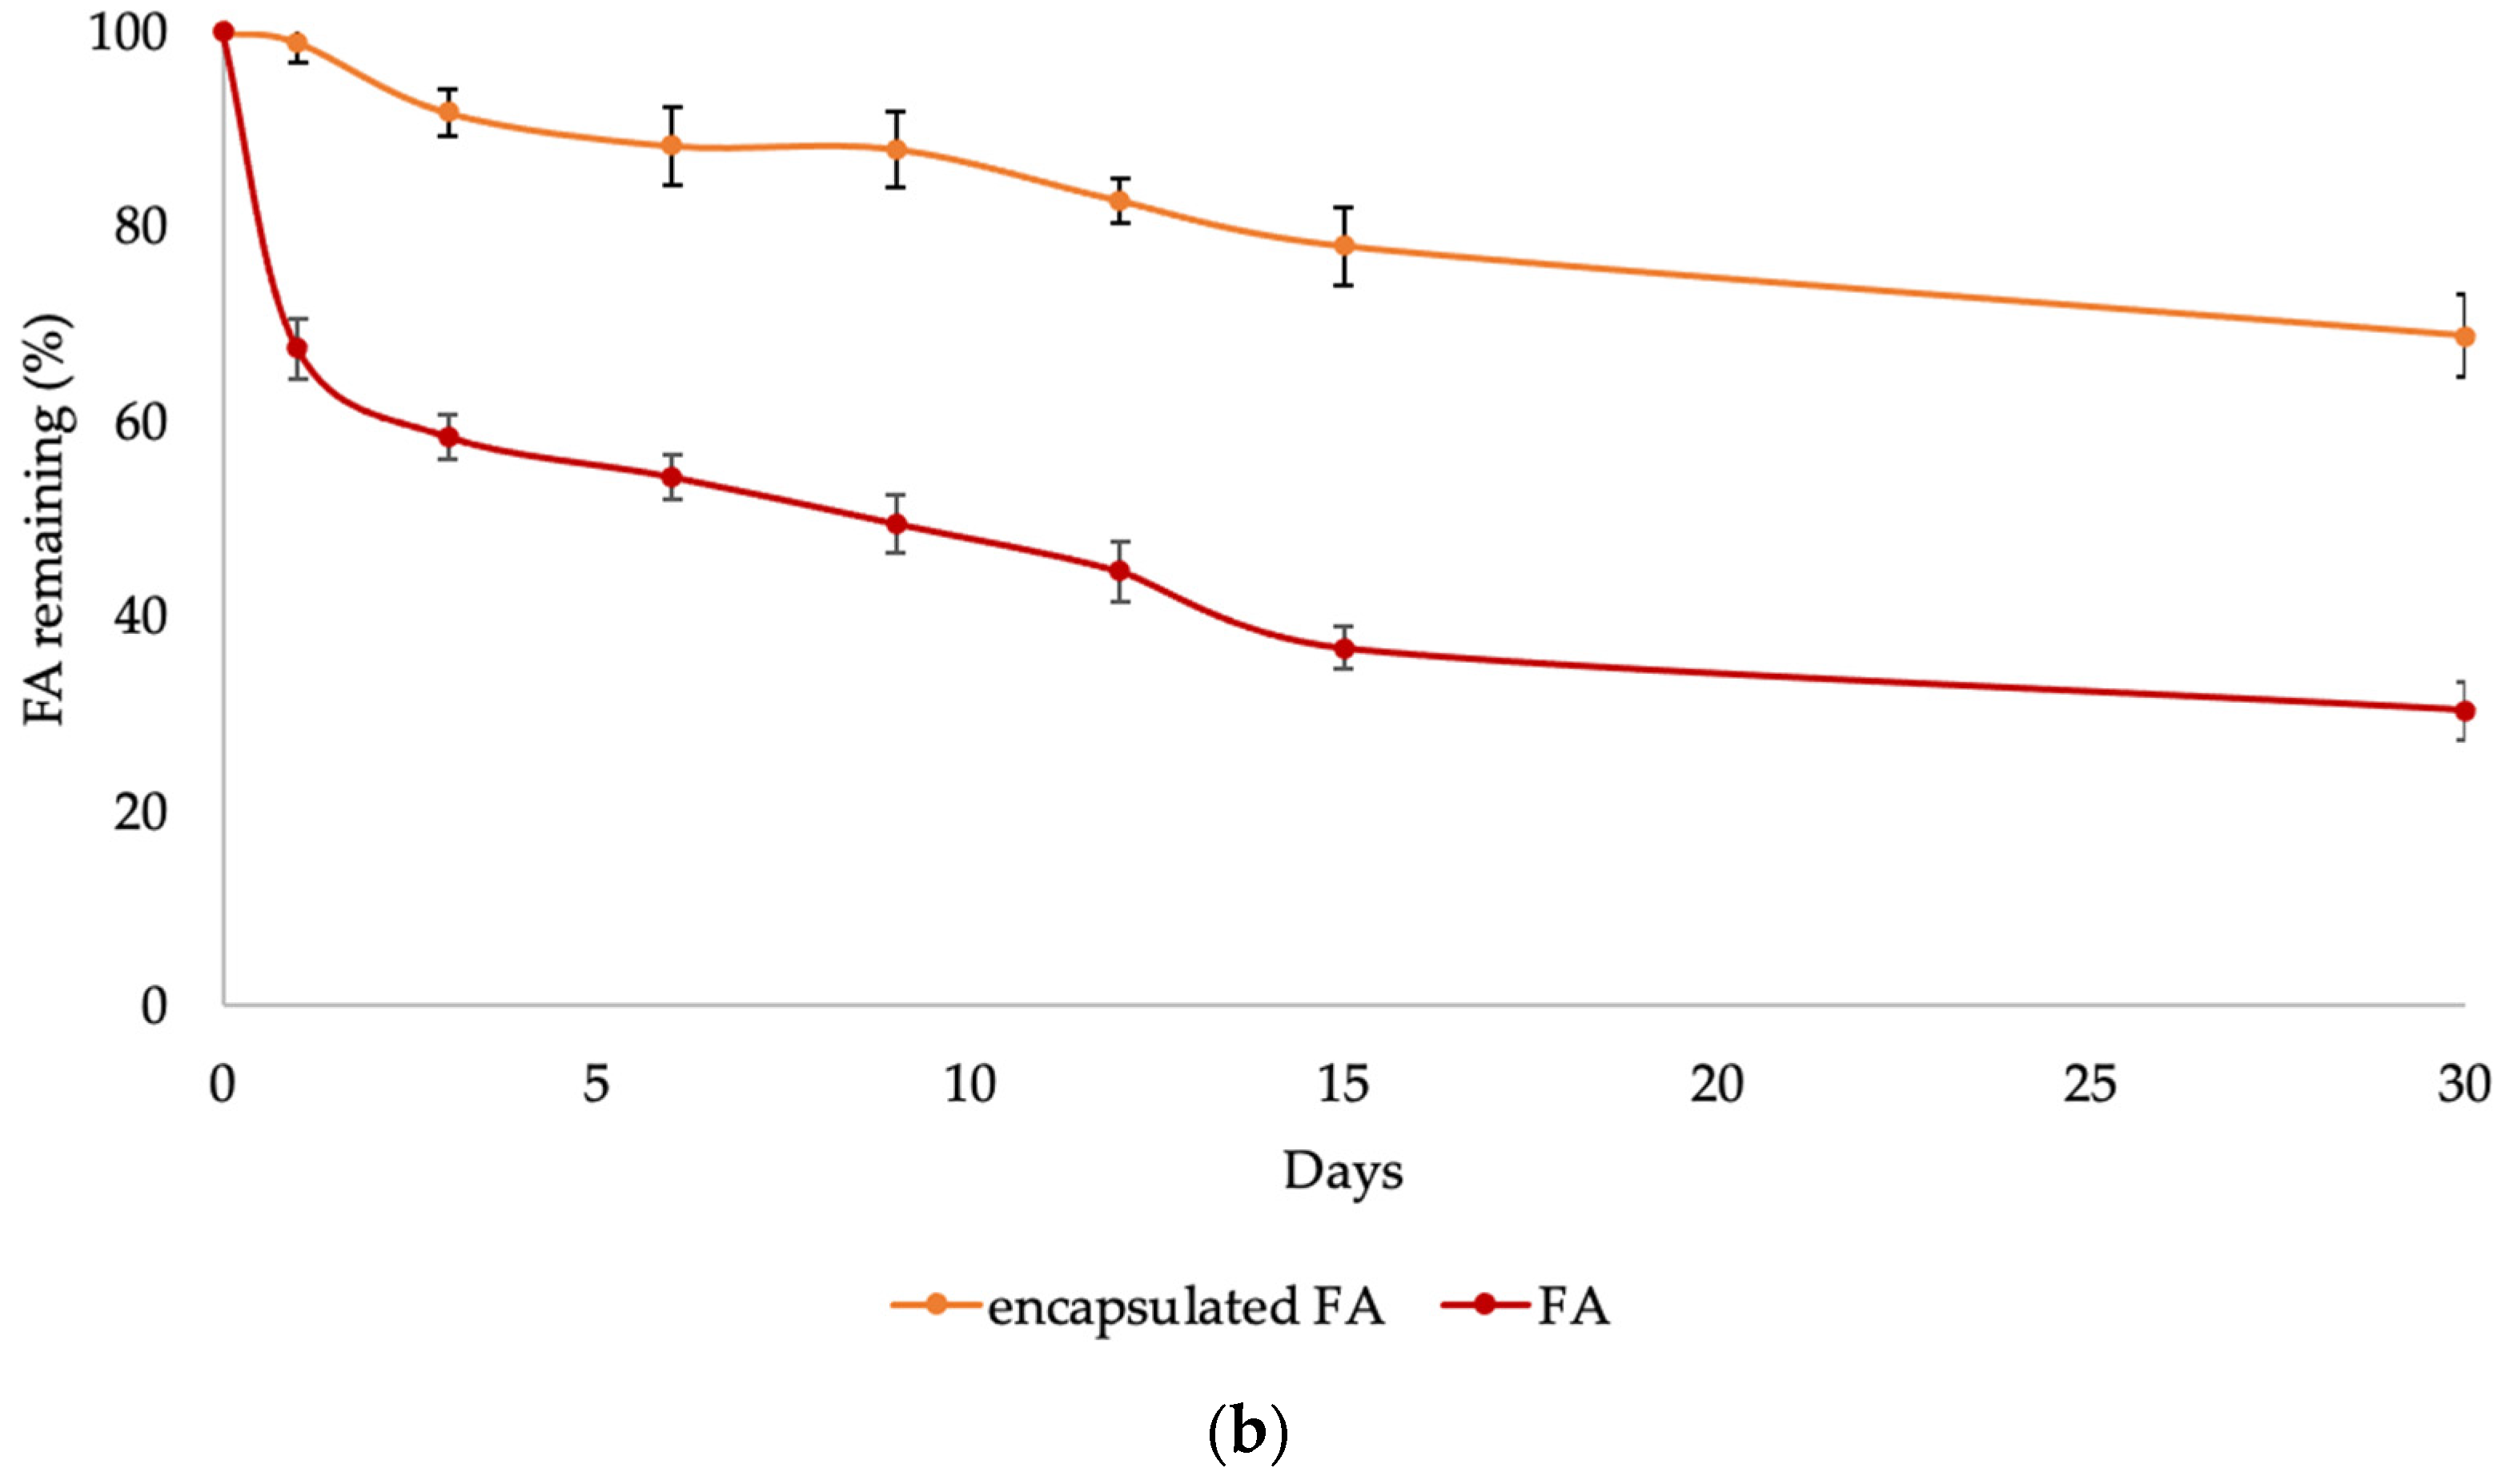
2.7. Accelerated Storage Stability Test
2.8. Penetration Experiment
2.9. Formulation
2.10. Clinical Study
2.10.1. Skin Irritation Testing
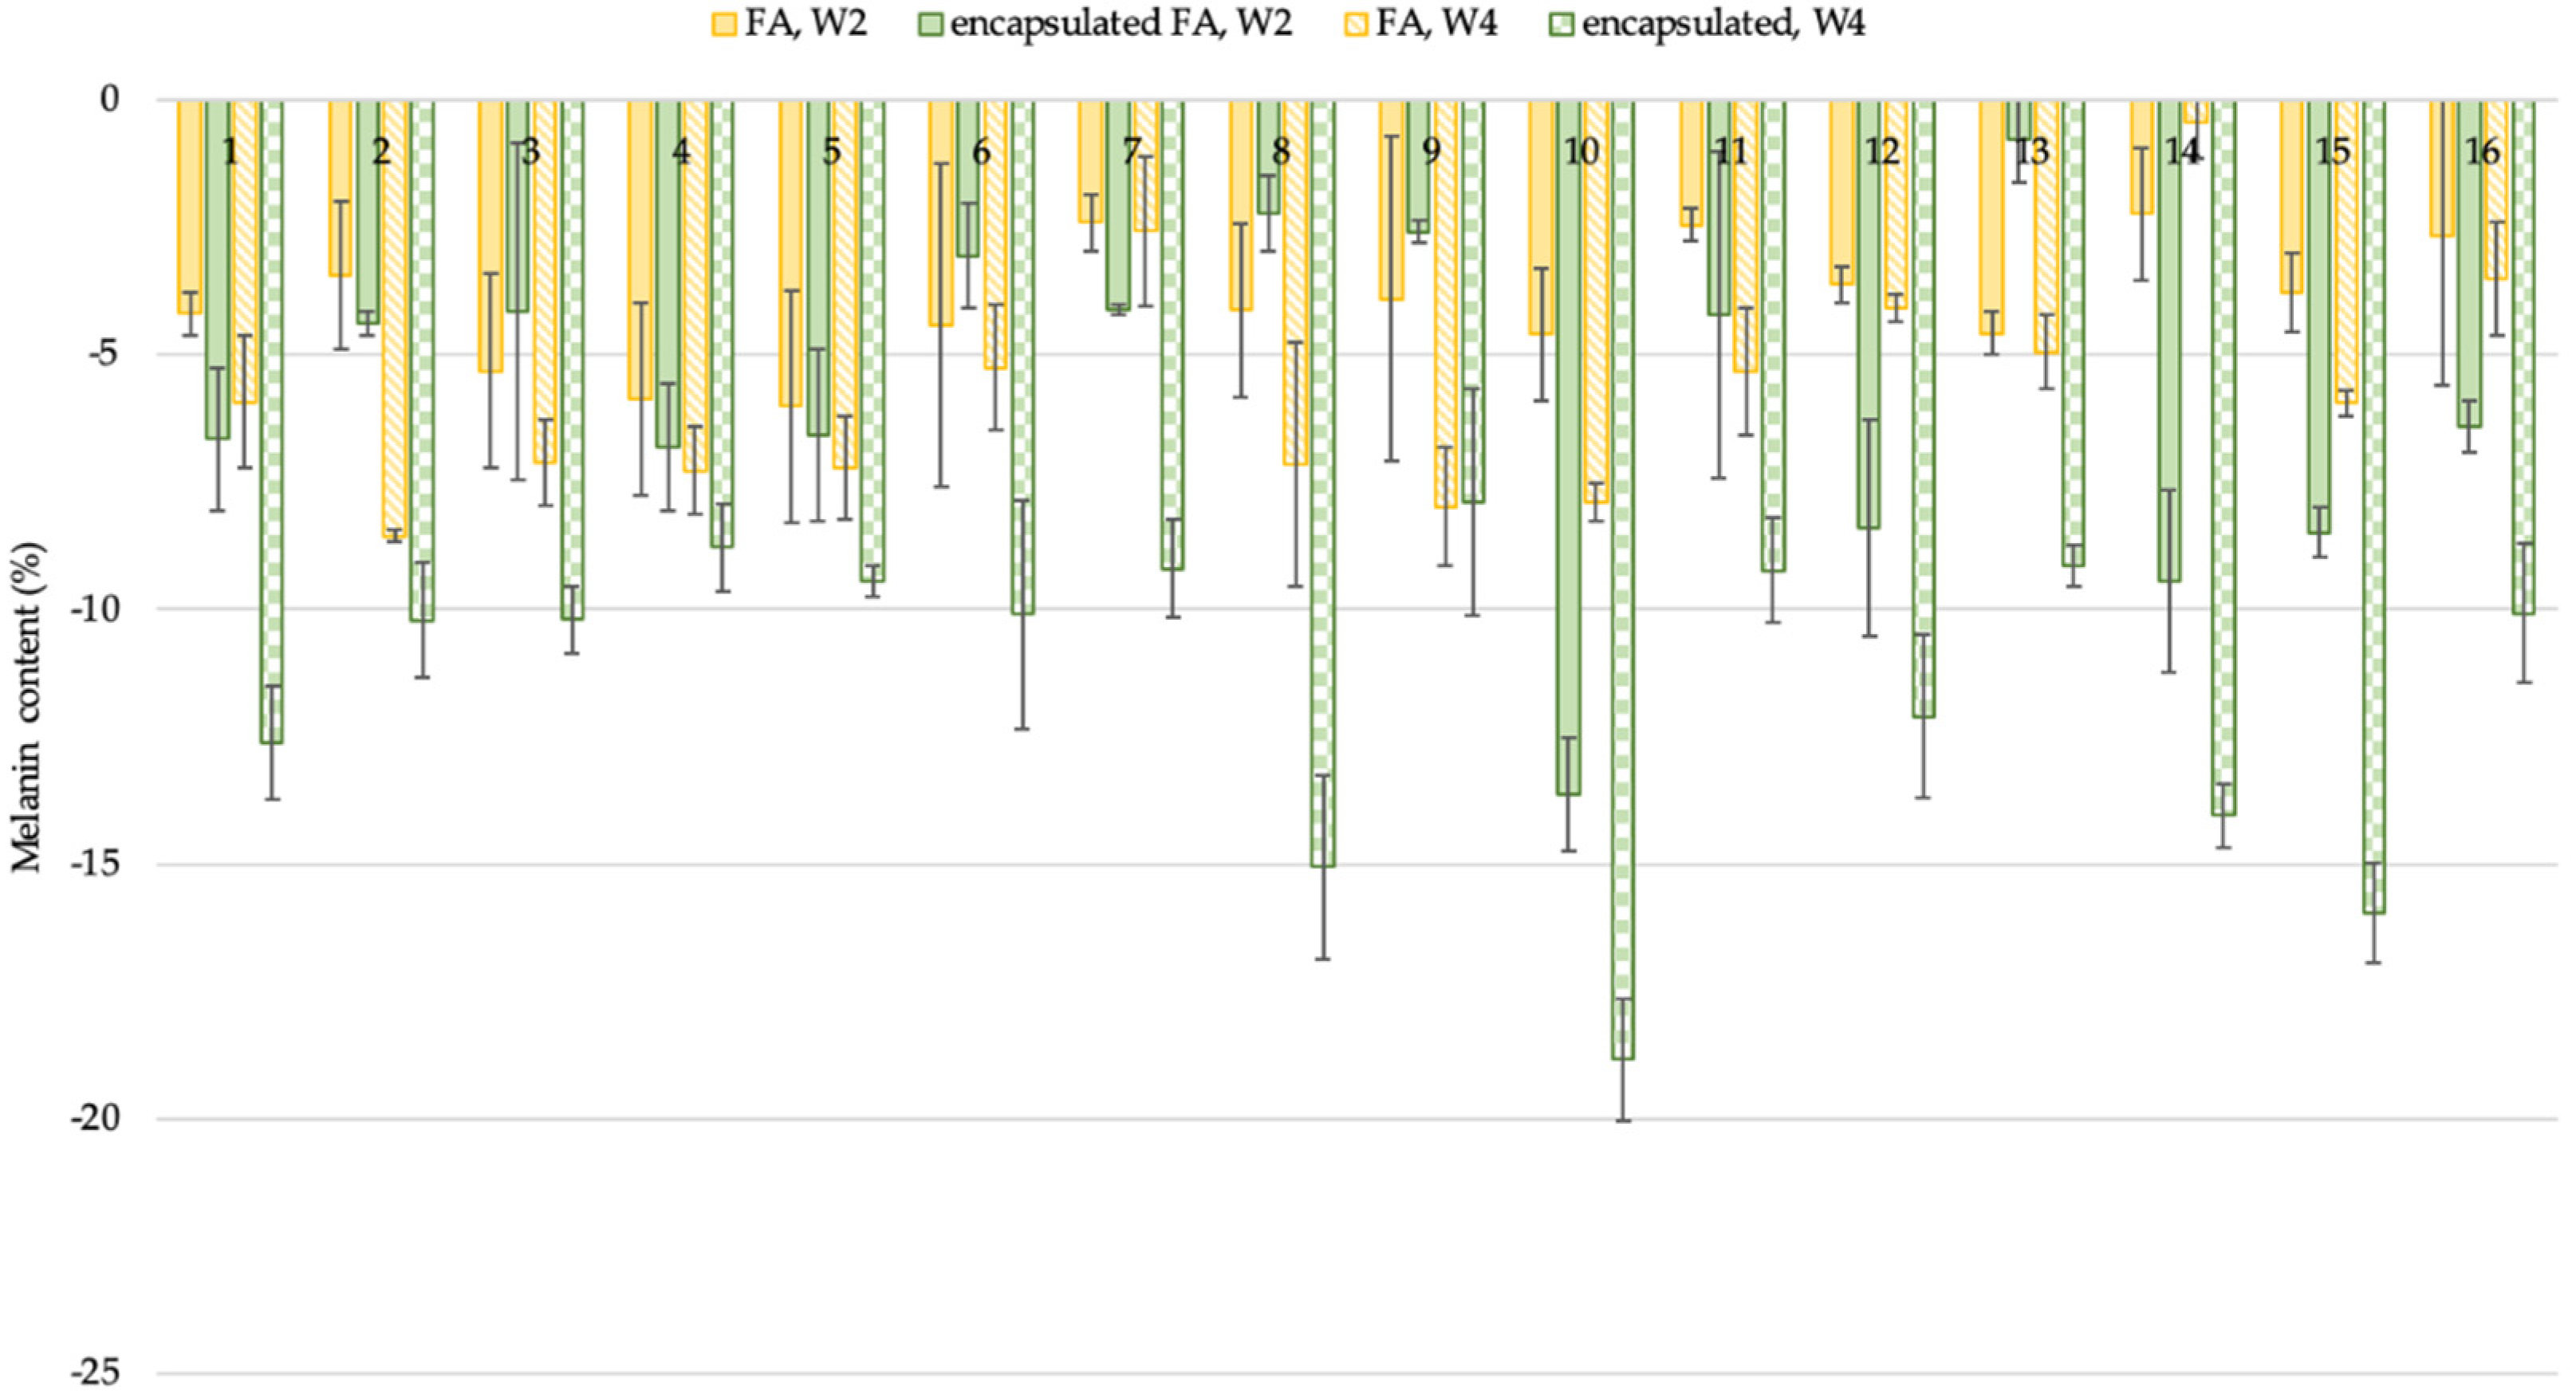
2.10.2. Skin Lightening Effect
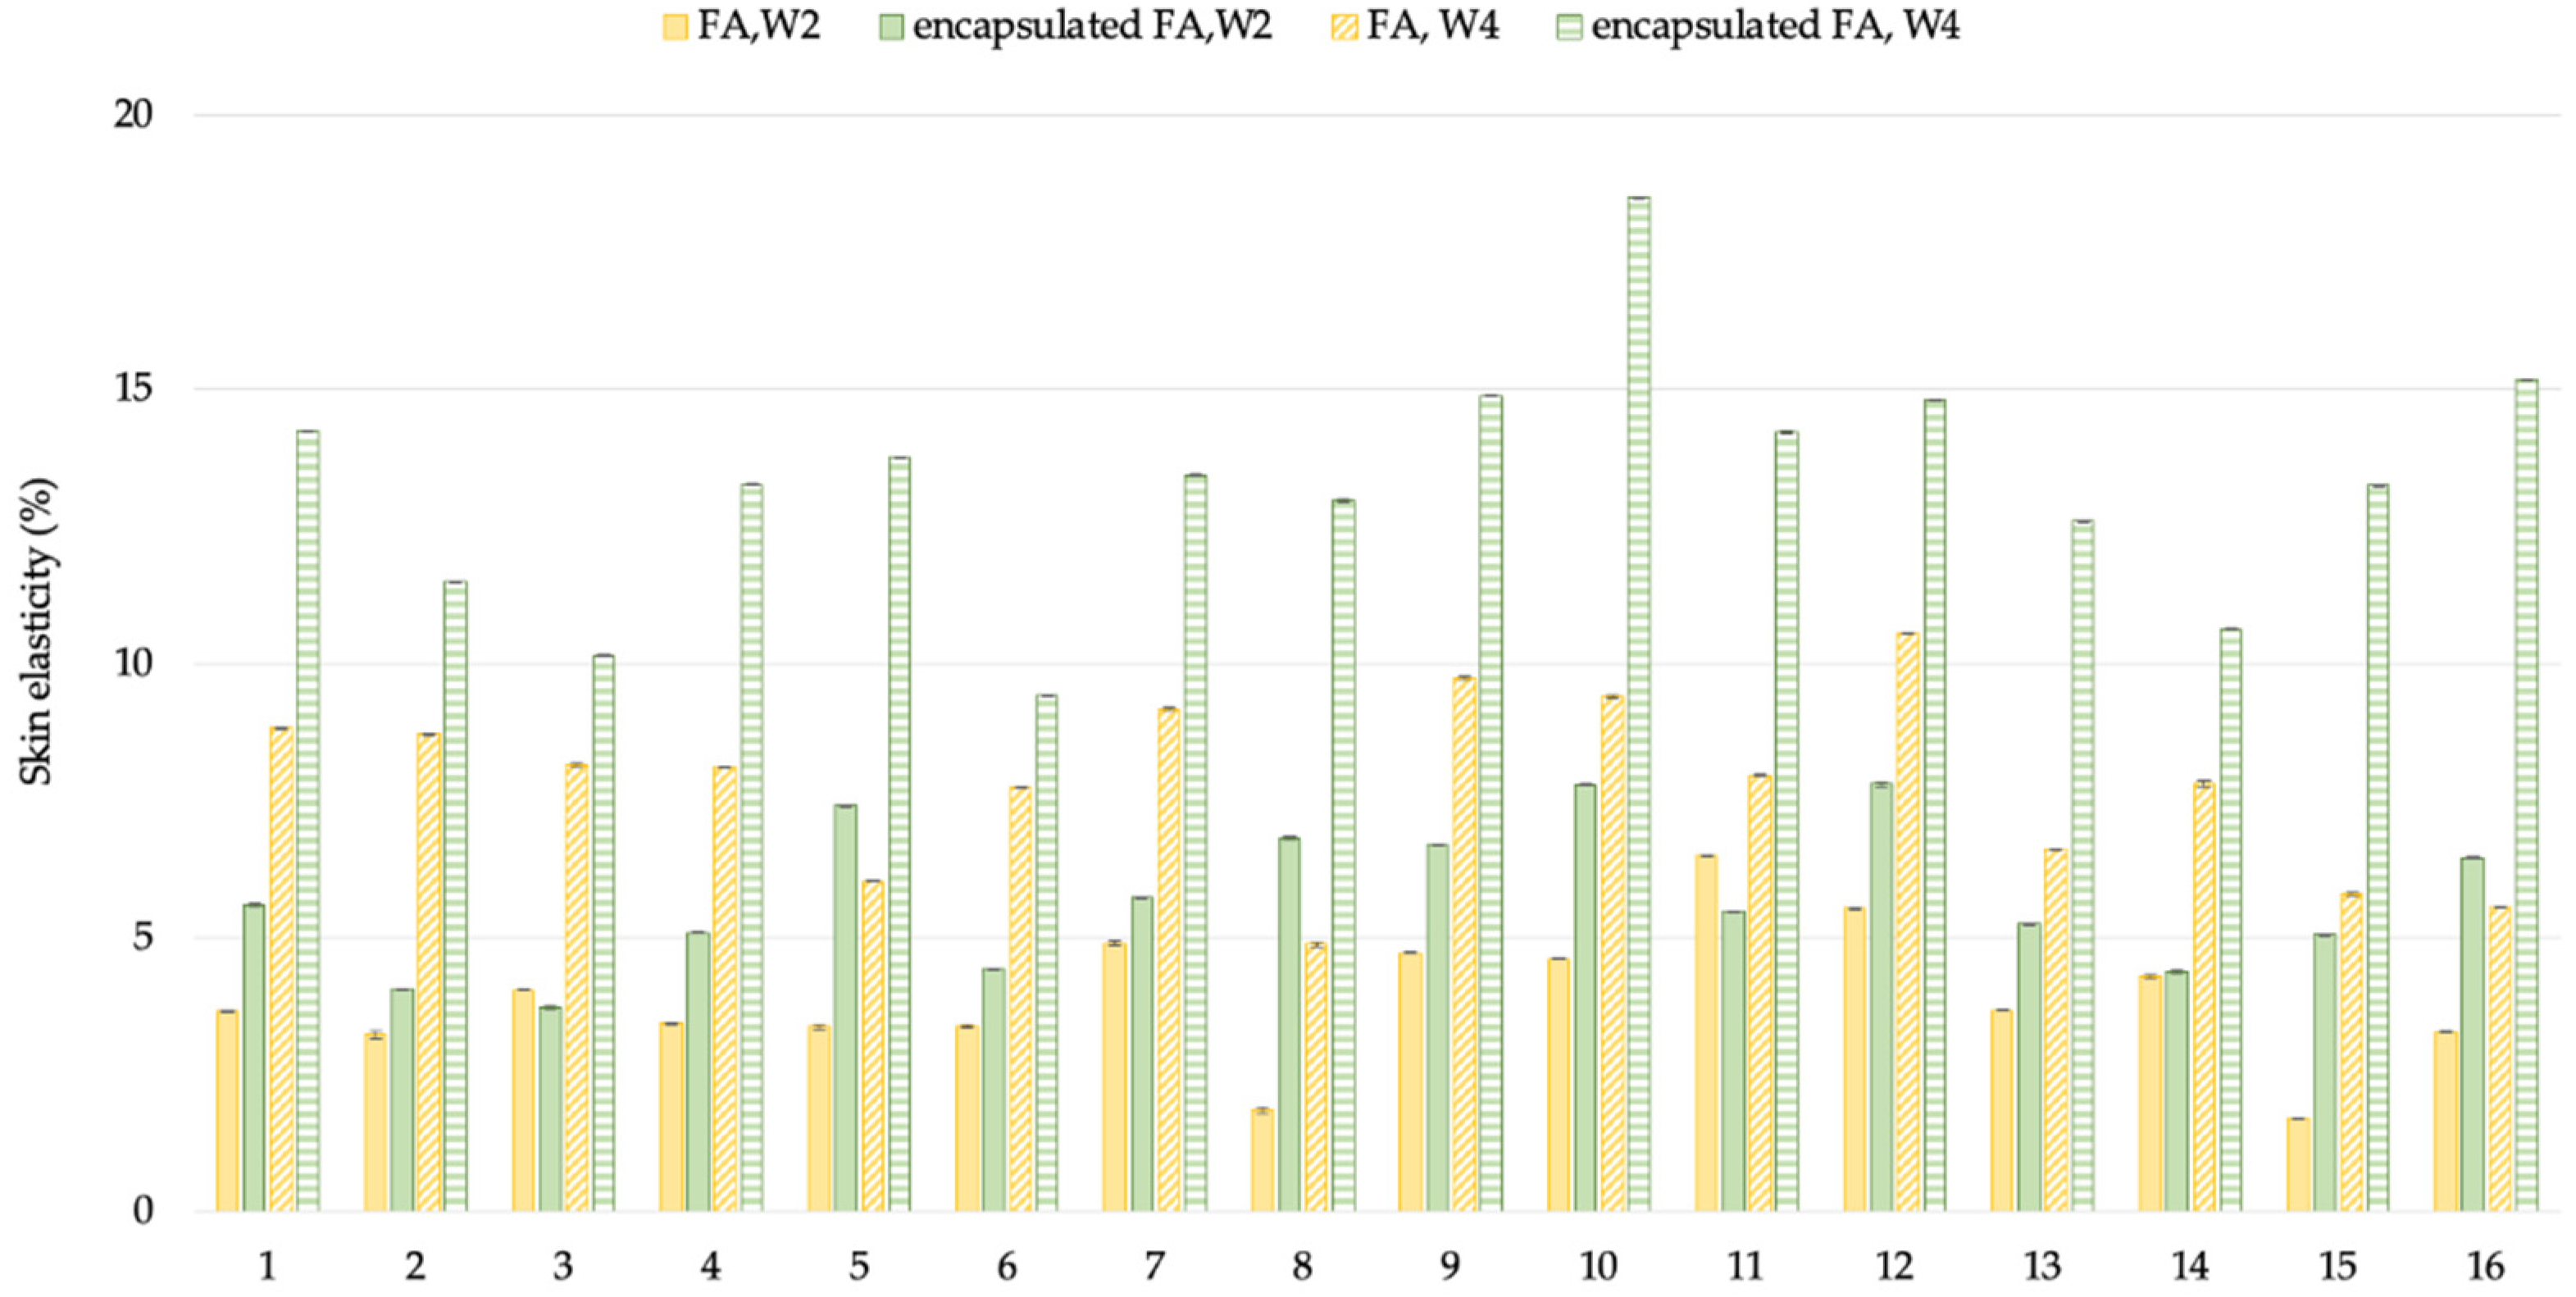
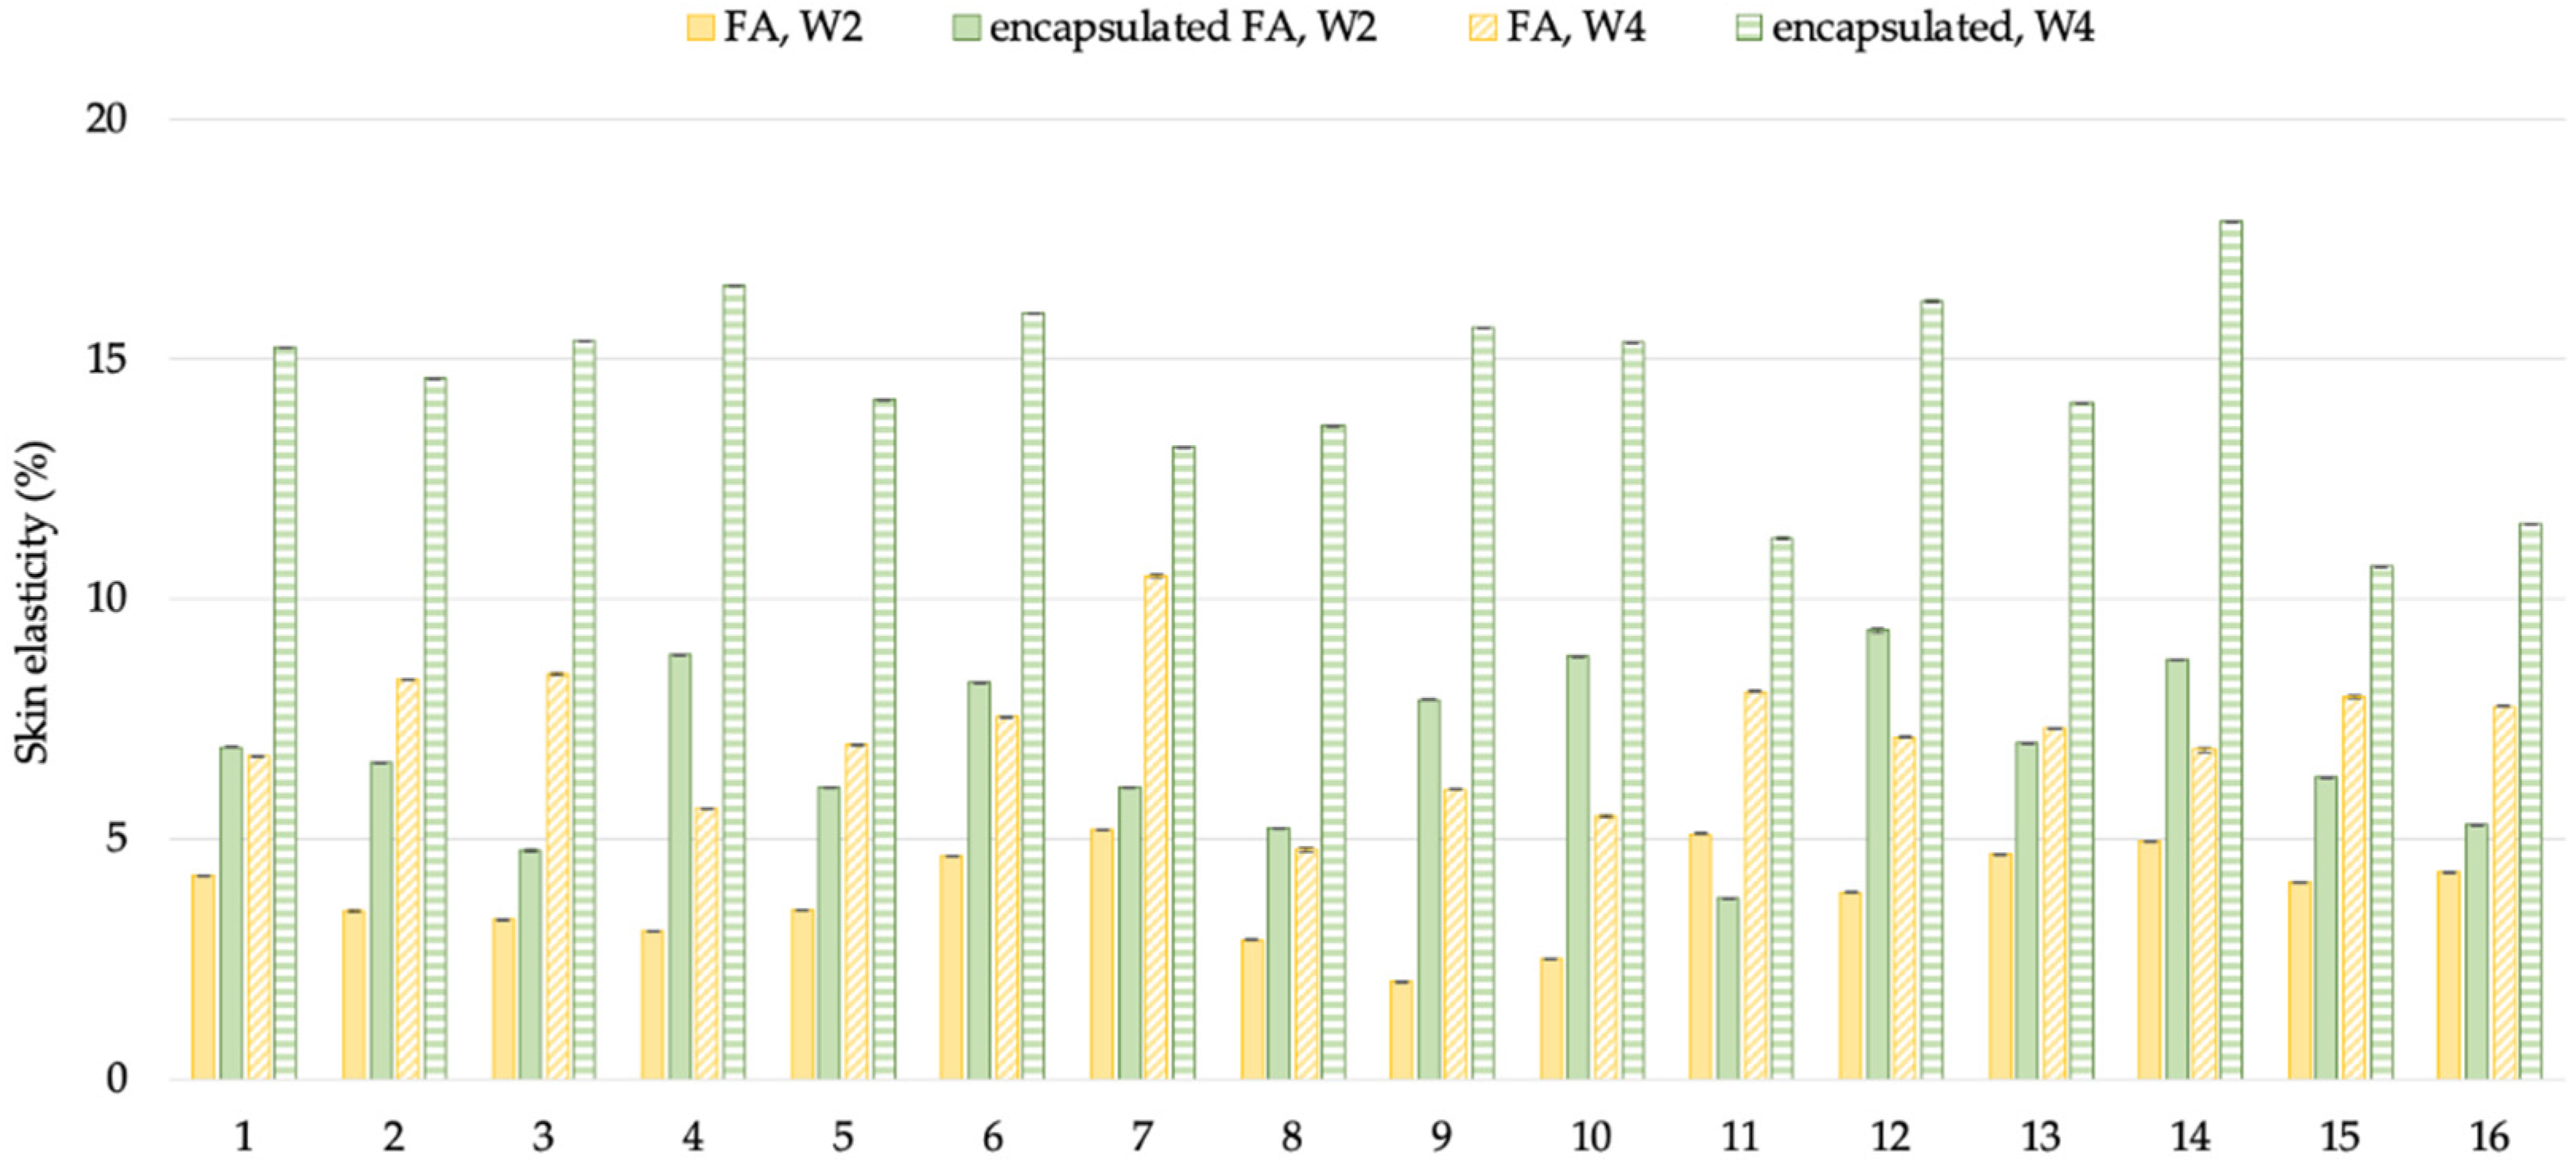
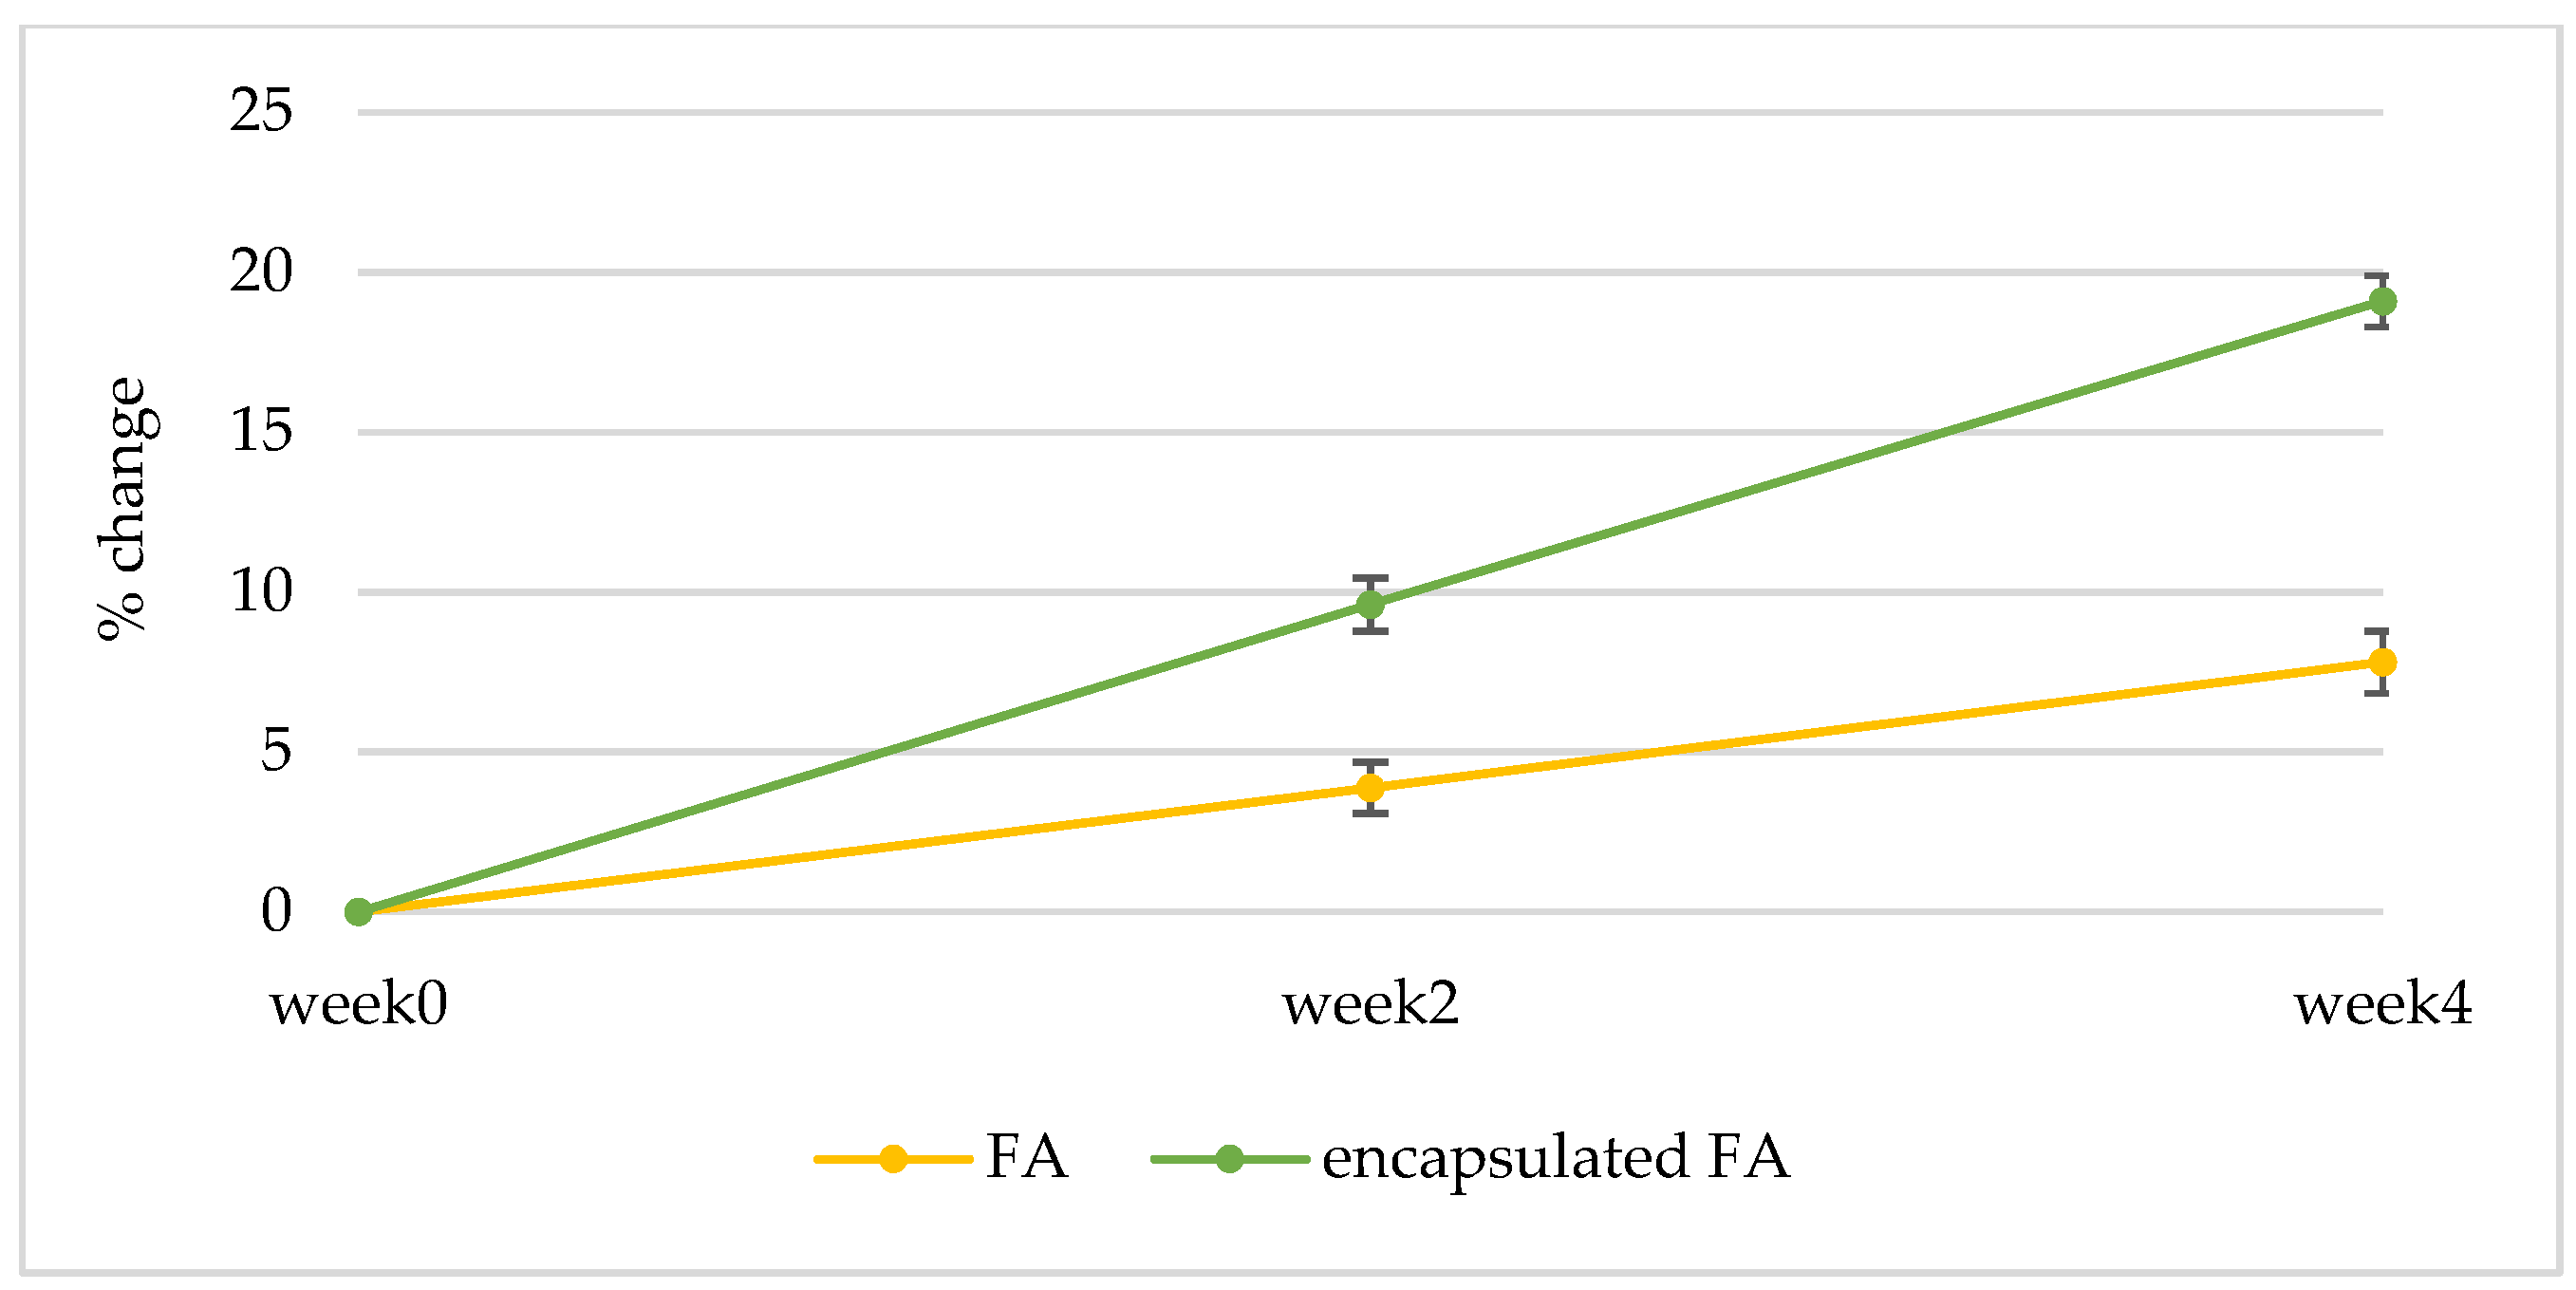
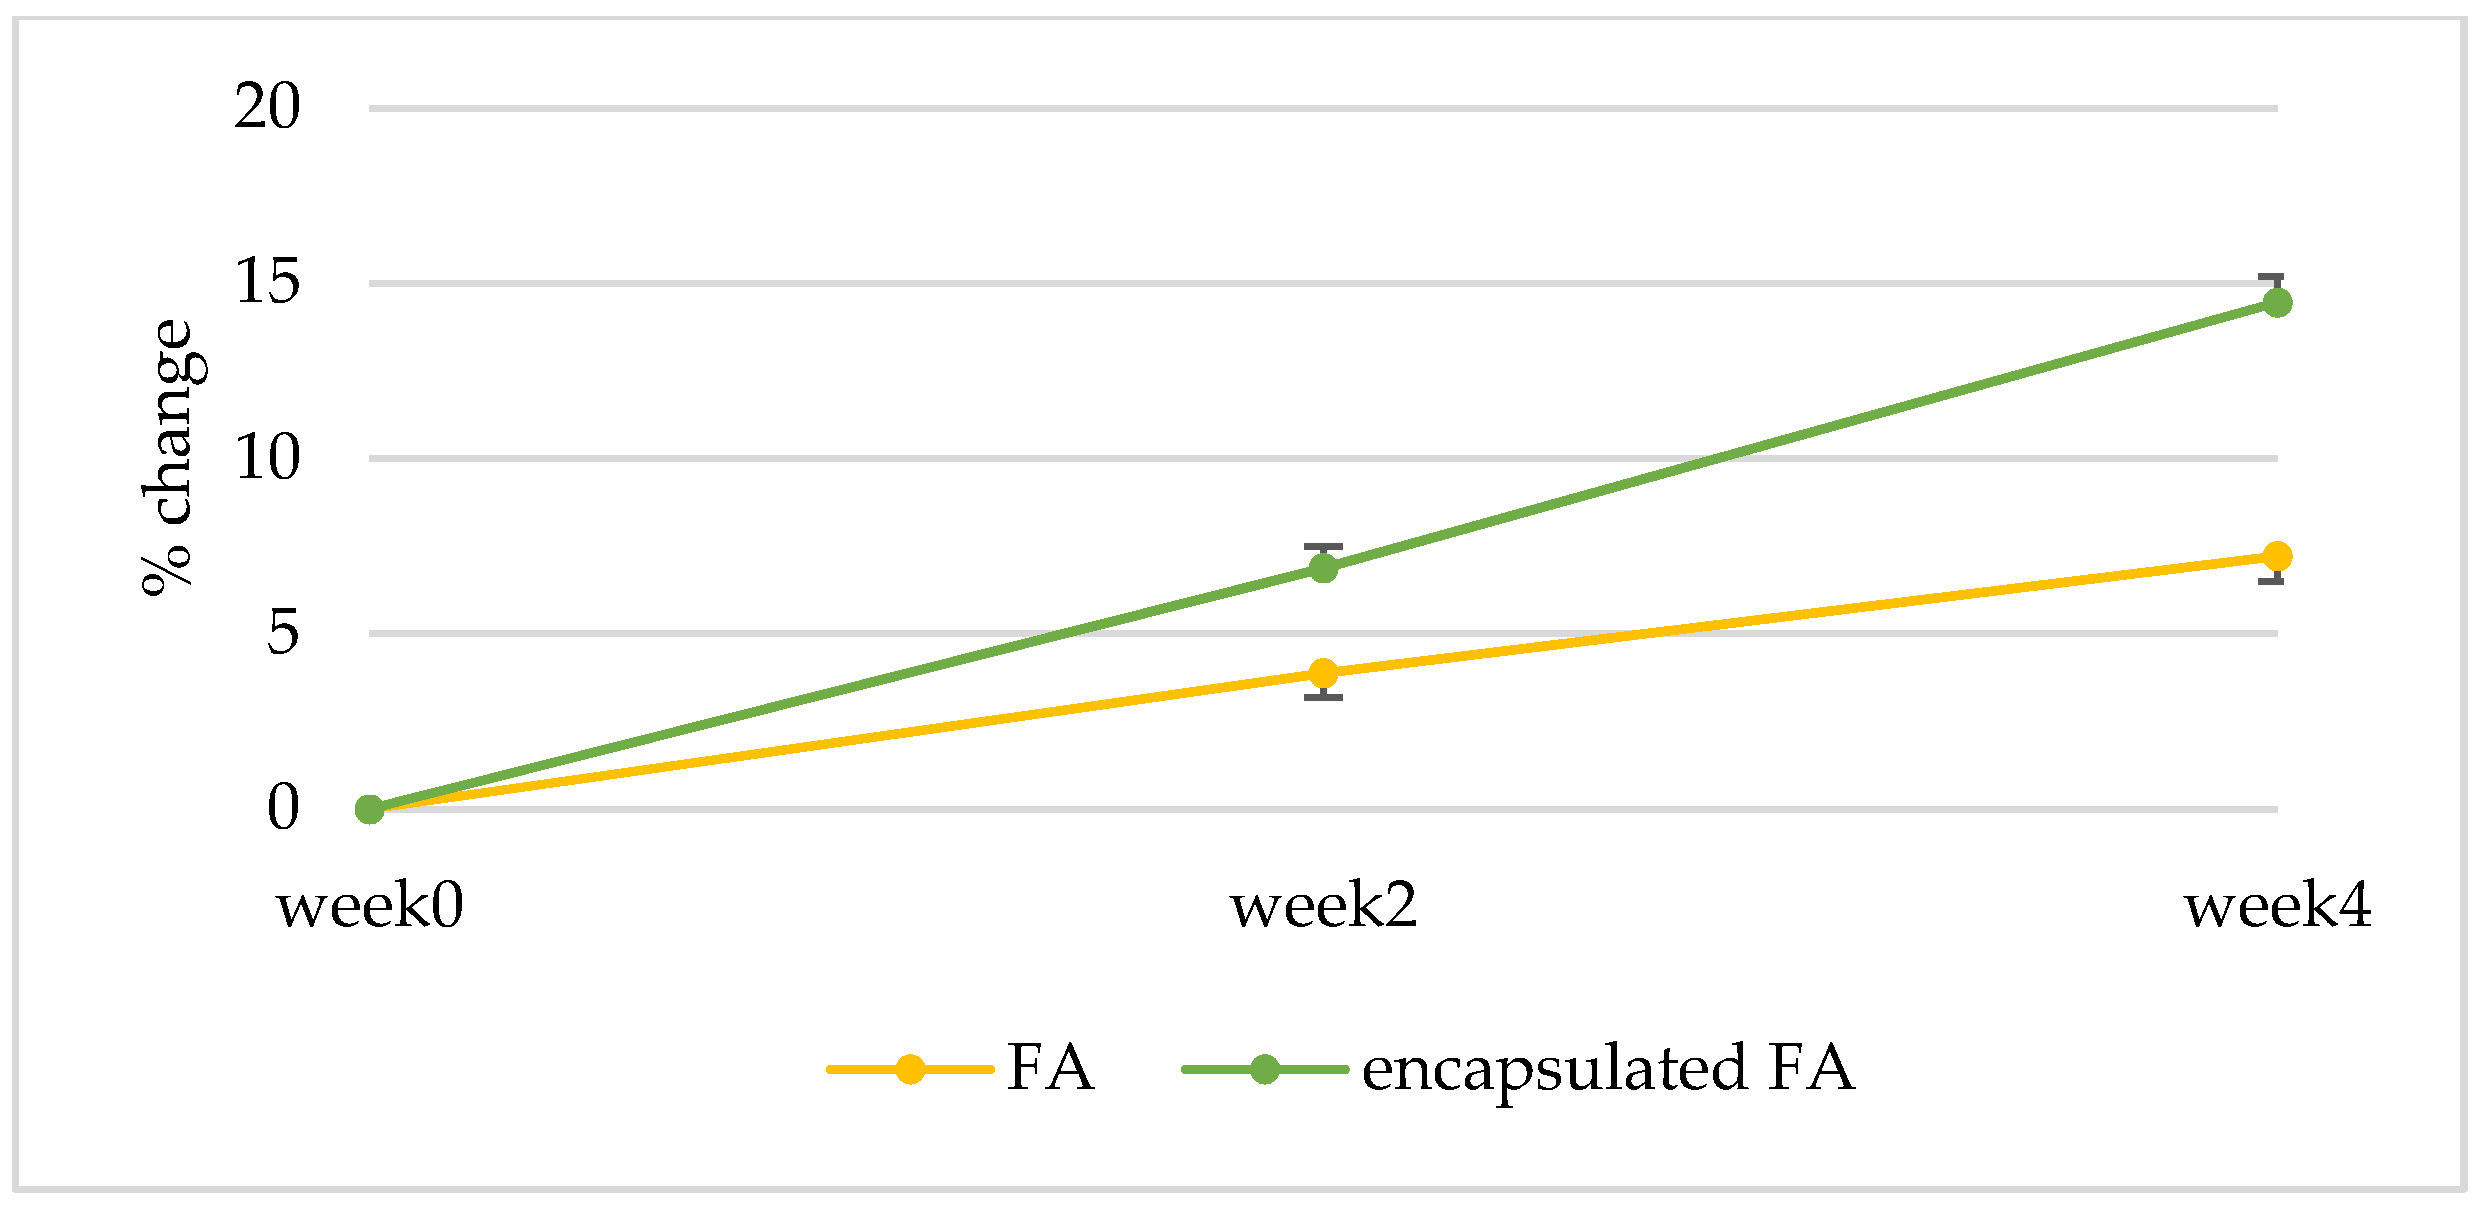
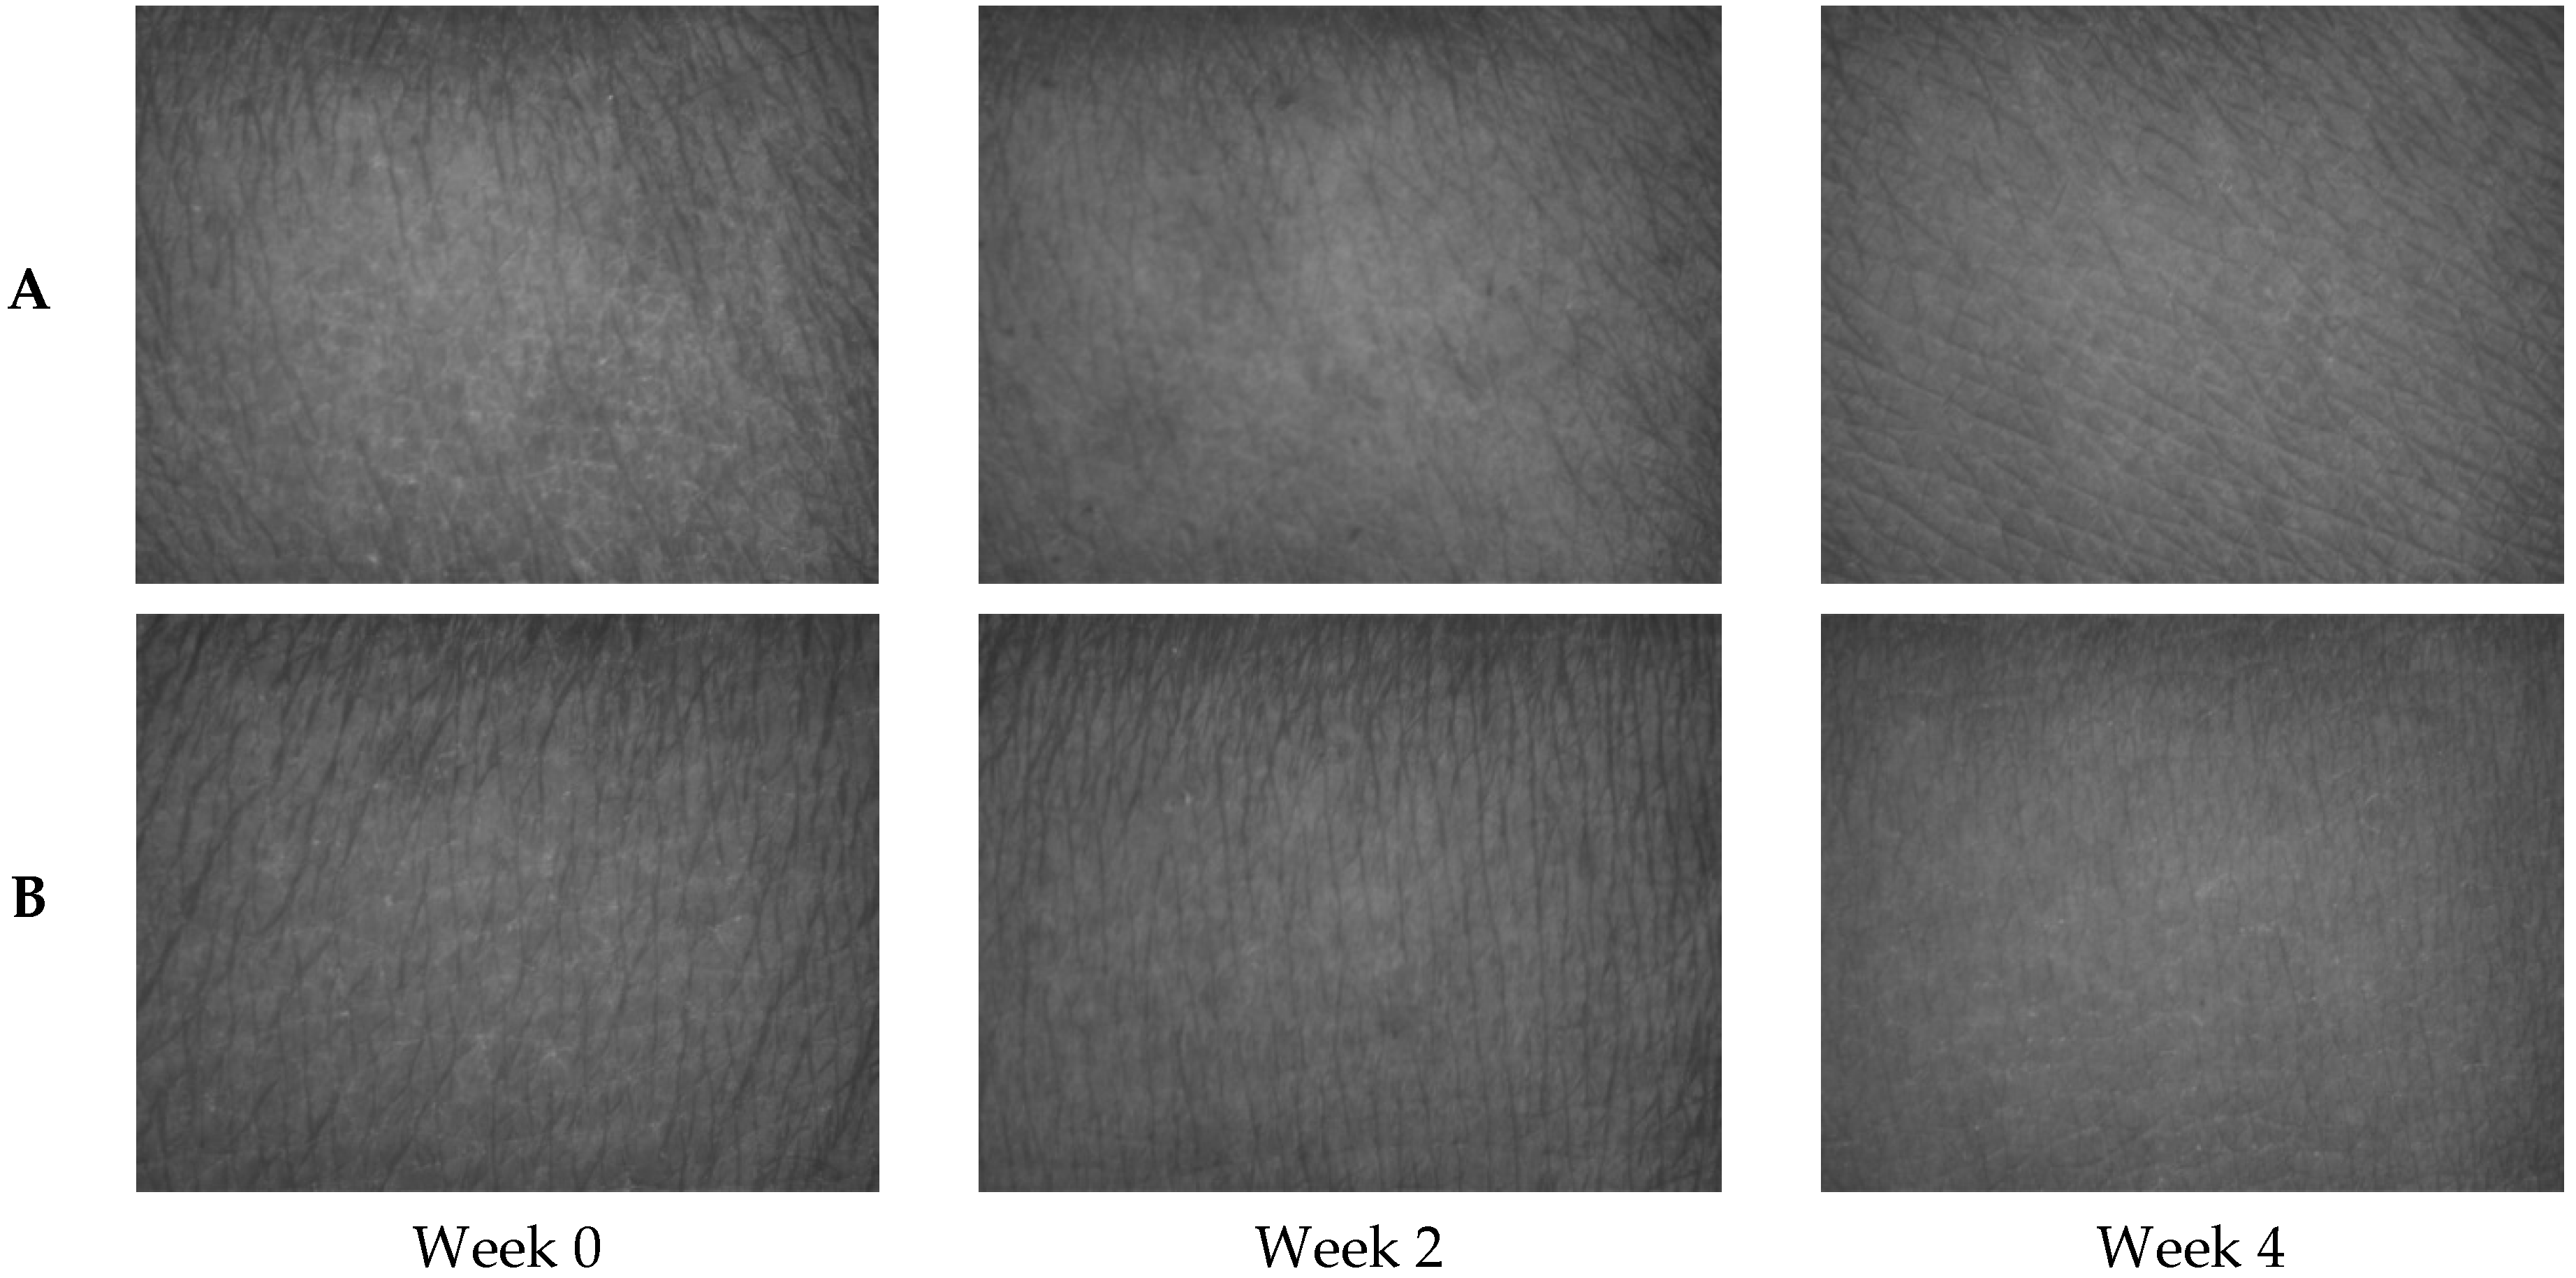
2.10.3. Anti-Aging Effect
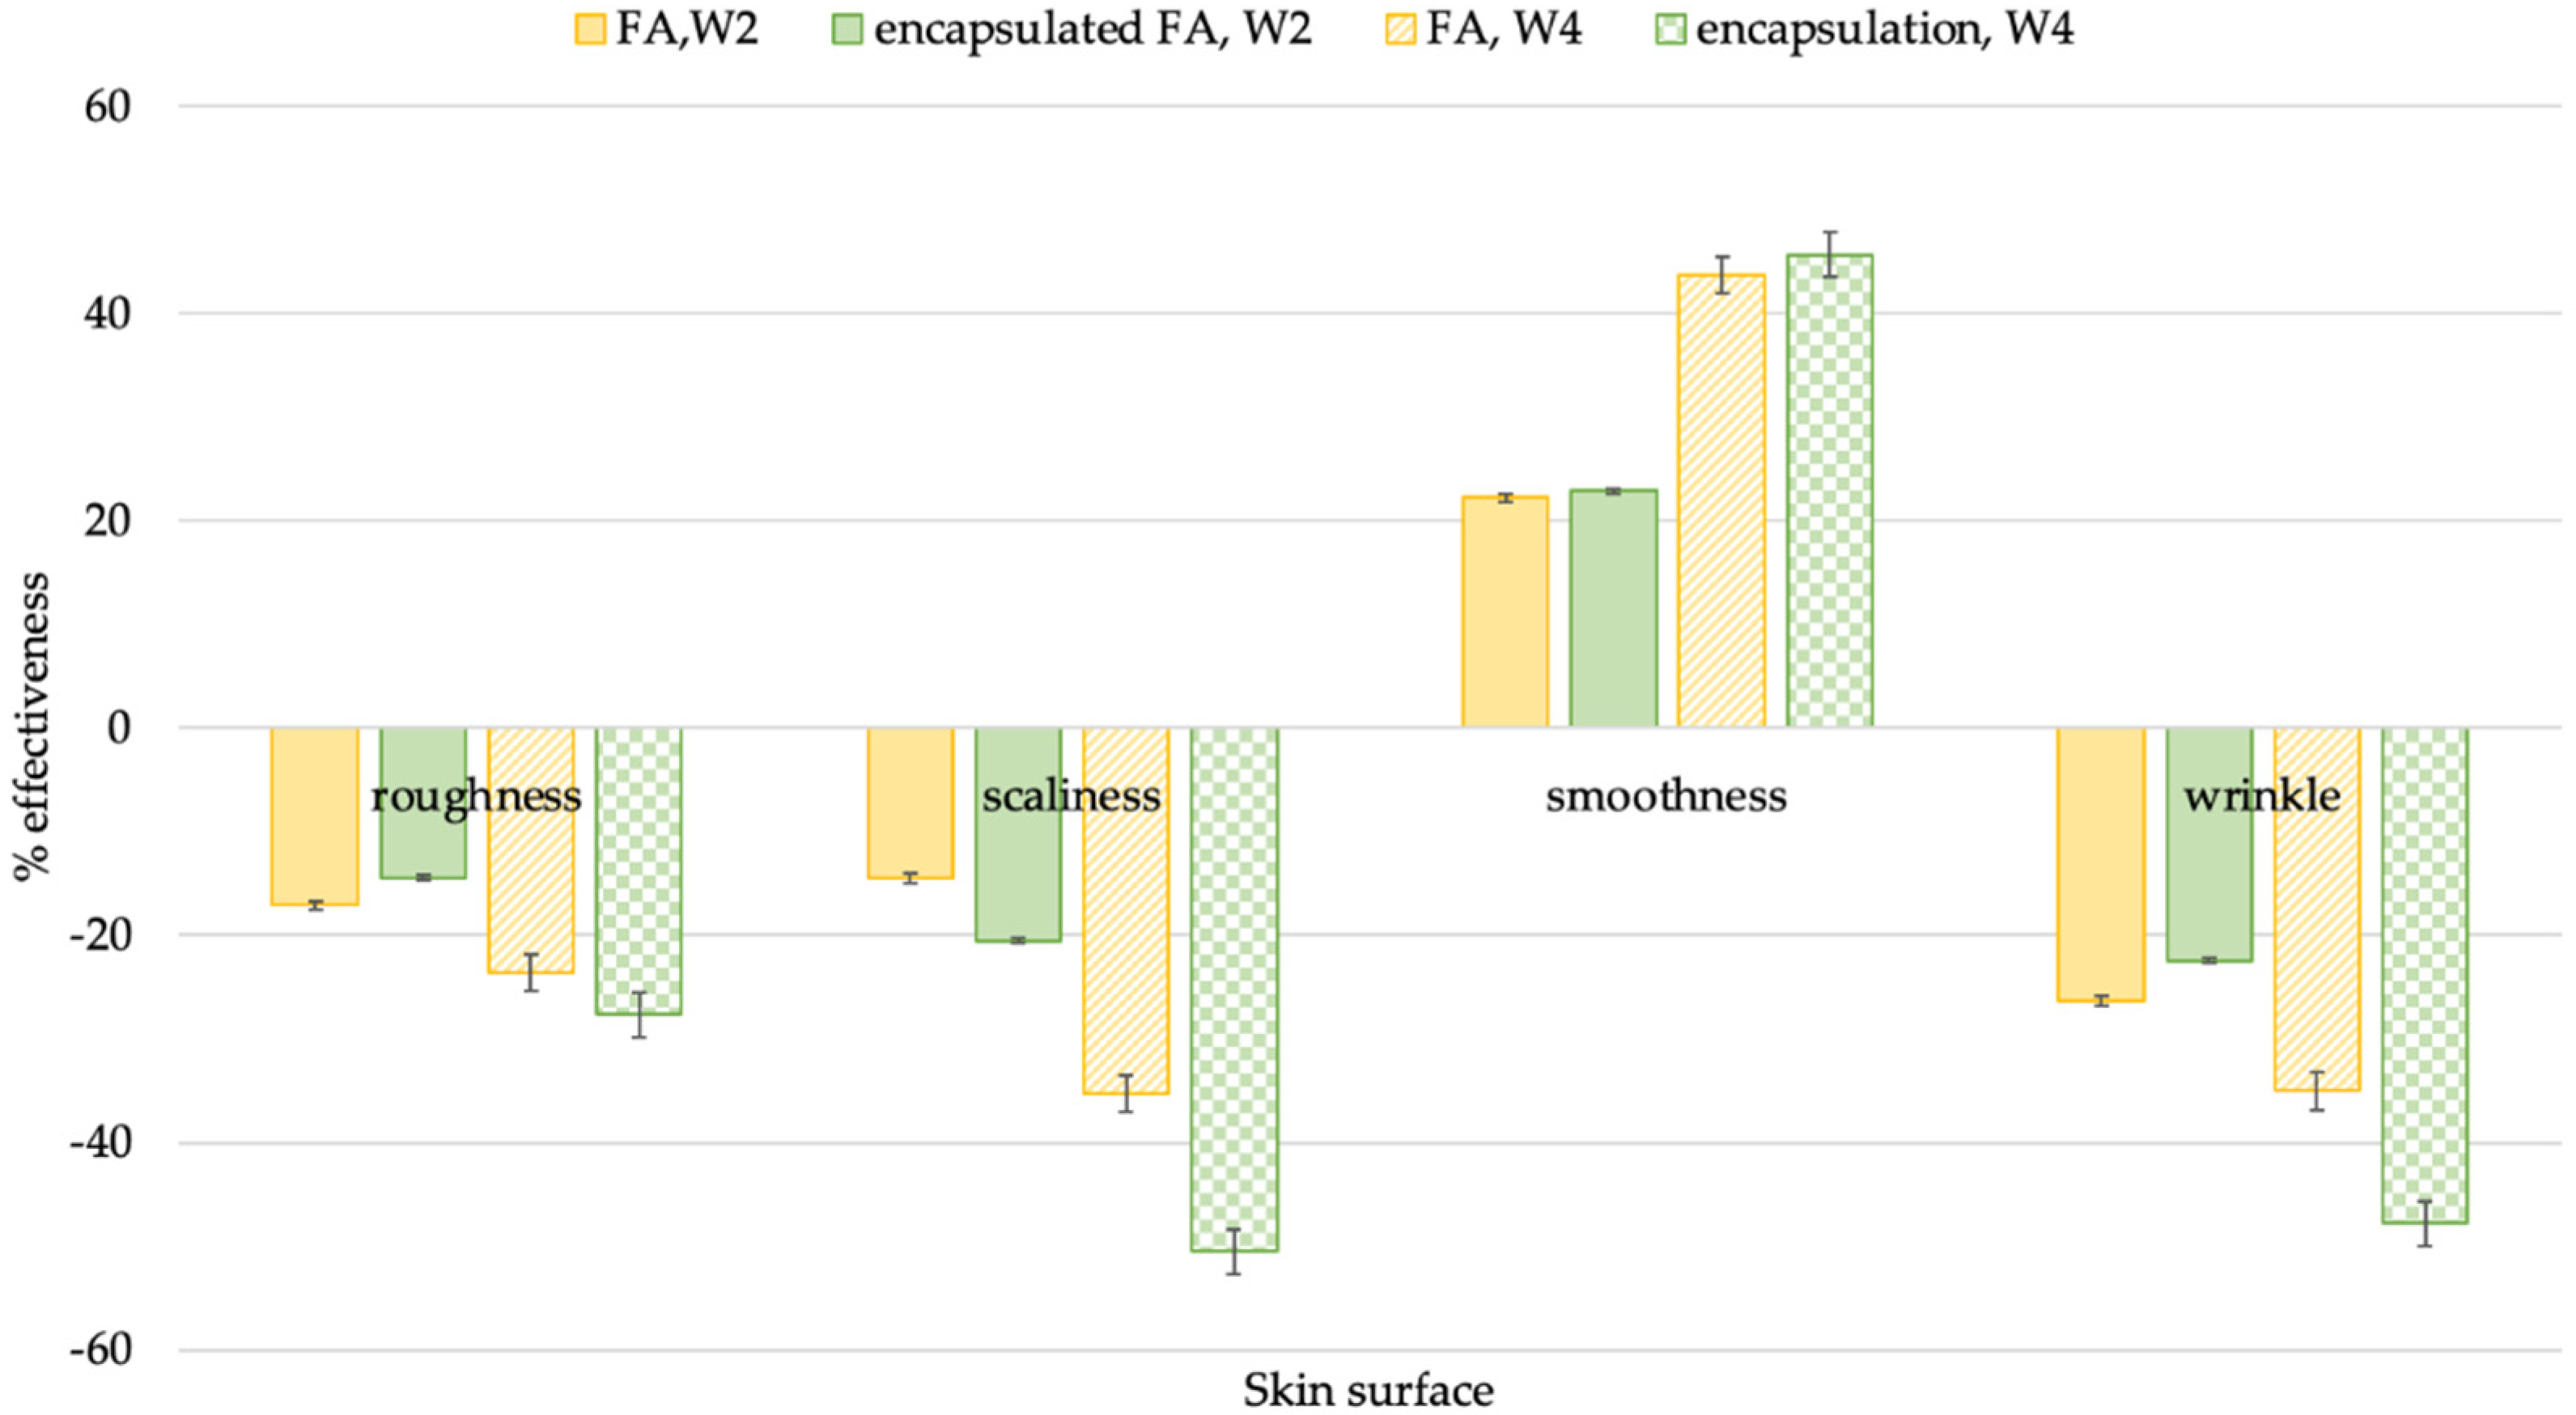
2.10.4. Visioscan
3. Materials and Methods
3.1. Reagents and Chemicals
3.2. Preparation of Encapsulated FA
3.3. Scanning Electron Microscope (SEM)
3.4. Fourier Transform Infrared Spectroscopy (FT-IR)
3.5. X-ray Diffraction (XRD)
3.6. Differential Scanning Colorimetry (DSC)
3.7. Particle Size, PDI, and Zeta Potential Measurement
3.8. Accelerated Storage Stability Test
3.9. Permeation Experiment
3.10. Formulation
3.11. Ethical Aspects
3.12. Subjects
3.13. Skin Irritation Testing
3.14. Application of Encapsulated FA/FA Creams
3.15. Efficacy Test
3.16. Statistical Analysis
4. Conclusions
Author Contributions
Funding
Institutional Review Board Statement
Informed Consent Statement
Data Availability Statement
Acknowledgments
Conflicts of Interest
Sample Availability
References
- Kumar, N.; Pruthi, V. Potential applications of ferulic acid from natural sources. Biotechnol. Rep. 2014, 4, 86–93. [Google Scholar] [CrossRef] [PubMed] [Green Version]
- Harwansh, R.K.; Mukherjee, P.K.; Bahadur, S.; Biswas, R. Enhanced permeability of ferulic acid loaded nanoemulsion based gel through skin against UVA mediated oxidative stress. Life Sci. 2015, 141, 202–211. [Google Scholar] [CrossRef] [PubMed]
- Oresajo, C.; Stephens, T.; Hino, P.D.; Law, R.M.; Yatskayer, M.; Foltis, P.; Pillai, S.; Pinnell, S.R. Protective effects of a topical antioxidant mixture containing vitamin C, ferulic acid, and phloretin against ultraviolet-induced photodamage in human skin. J. Cosmet. Dermatol. 2008, 7, 290–297. [Google Scholar] [CrossRef] [PubMed]
- Commission Directive 2006/257/EC amending Decision 96/335/EC establishing an Inventory and a Common Nomenclature of Ingredients Employed in Cosmetic Products. OJ L97/1–L97/528. 2006, pp. 1–528. Available online: https://eur-lex.europa.eu/eli/dec/2006/257/oj (accessed on 9 February 2006).
- Ouimet, M.A.; Griffin, J.; Carbone-Howell, A.L.; Wu, W.H.; Stebbins, N.D.; Di, R.; Uhrich, K.E. Biodegradable ferulic acid-containing poly (anhydride-ester): Degradation products with controlled release and sustained antioxidant activity. Biomacromolecules 2013, 14, 854–861. [Google Scholar] [CrossRef] [PubMed] [Green Version]
- Anselmi, C.; Centini, M.; Maggiore, M.; Gaggelli, N.; Andreassi, M.; Buonocore, A.; Beretta, G.; Facino, R.M. Non-covalent inclusion of ferulic acid with alpha-cyclodextrin improves photo-stability and delivery: NMR and modeling studies. J. Pharm. Biomed. Anal. 2008, 46, 645–652. [Google Scholar] [CrossRef] [PubMed]
- Panwar, R.; Pemmaraju, S.C.; Sharma, A.K.; Pruthi, V. Efficacy of ferulic acid encapsulated chitosan nanoparticles against Candida albicans biofilm. Microb. Pathog. 2016, 95, 21–31. [Google Scholar] [CrossRef] [PubMed]
- Mathew, S.; Abraham, T.E. Physico-chemical characterization of starch ferulates of different degrees of substitution. Food Chem. 2007, 105, 579–589. [Google Scholar] [CrossRef]
- O’Brien, S.; Wang, Y.J. Effects of shear and pH on starch phosphates prepared by reactive extrusion as a sustained release agent. Carbohydr. Polym. 2009, 77, 464–471. [Google Scholar] [CrossRef]
- Fang, Y.Y.; Wang, L.J.; Li, D.; Li, B.Z.; Bhandari, B.; Chen, X.D.; Mao, Z.H. Preparation of crosslinked starch microspheres and their drug loading and releasing properties. Carbohydr. Polym. 2008, 74, 379–384. [Google Scholar] [CrossRef]
- García-Gurrola, A.; Rincón, S.; Escobar-Puentes, A.A.; Zepeda, A.; Martínez-Bustos, F. Microencapsulation of red sorghum phenolic compounds with esterified sorghum starch as encapsulant materials by spray drying. Food Technol. Biotechnol. 2019, 57, 341. [Google Scholar] [CrossRef] [PubMed]
- Yoneya, T.; Ishibashi, K.; Hironaka, K.; Yamamoto, K. Influence of cross-linked potato starch treated with POCl3 on DSC, rheological properties and granule size. Carbohydr. Polym. 2003, 53, 447–457. [Google Scholar] [CrossRef]
- Beninca, C.; Barboza, R.A.; de Oliveira, C.S.; Bet, C.D.; Bisinella, R.Z.; Schnitzler, E. Corn and Pinhão starches modified with sodium tripolyphosphate: Thermal, pasting, structural and morphological properties. Starch-Stärke 2019, 71, 1800290. [Google Scholar] [CrossRef]
- Li, J.; Shin, G.H.; Lee, I.W.; Chen, X.; Park, H.J. Soluble starch formulated nanocomposite increases water solubility and stability of curcumin. Food Hydrocoll. 2016, 56, 41–49. [Google Scholar] [CrossRef]
- Rezaei, A.; Varshosaz, J.; Fesharaki, M.; Farhang, A.; Jafari, S.M. Improving the solubility and in vitro cytotoxicity (anticancer activity) of ferulic acid by loading it into cyclodextrin nanosponges. Int. J. Nanomed. 2019, 14, 4589. [Google Scholar] [CrossRef] [PubMed] [Green Version]
- Wang, J.; Cao, Y.; Sun, B.; Wang, C. Characterisation of inclusion complex of trans-ferulic acid and hydroxypropyl-β-cyclodextrin. Food Chem. 2011, 124, 1069–1075. [Google Scholar] [CrossRef]
- Das, S.; Wong, A.B.H. Stabilization of ferulic acid in topical gel formulation via nanoencapsulation and pH optimization. Sci. Rep. 2020, 10, 12288. [Google Scholar] [CrossRef] [PubMed]
- Zduńska, K.; Dana, A.; Kolodziejczak, A.; Rotsztejn, H. Antioxidant properties of ferulic acid and its possible application. Skin Pharmacol. Physiol. 2018, 31, 332–336. [Google Scholar] [CrossRef] [PubMed]
- Mattiasson, J. Method Development of an In Vitro Vertical Franz Diffusion Cell System to Assess Permeation of Cosmetic active Ingredients. Master’s Thesis, Uppsala University, Uppsala, Sweden, 23 June 2020. [Google Scholar]
- Schnuch, A.; Aberer, W.; Agathos, M.; Becker, D.; Brasch, J.; Elsner, P.; Frosch, P.J.; Fuchs, T.; Geier, J.; Hillen, U.; et al. German Contact Dermatitis Research Group (DKG). Patch testing with contact allergens. J. Dtsch. Dermatol. Ges. 2008, 6, 770–775. [Google Scholar] [CrossRef] [PubMed]





| Ratio of MPRS a:MFA a | Yield (%) | EE (%) | LE (%) |
|---|---|---|---|
| 1.0:1.0 | 69.14 ± 0.97 | 24.18 ± 0.57 | 21.31 ± 0.65 |
| 1.0:1.5 | 73.20 ± 1.24 | 56.21 ± 0.95 | 38.28 ± 1.53 |
| 1.0:2.0 | 77.66 ± 2.25 | 73.10 ± 2.21 | 65.40 ± 2.07 |
| 1.0:2.5 | 77.51 ± 1.98 | 68.72 ± 1.99 | 65.07 ± 0.91 |
| 1.0:3.0 | 76.78 ± 2.15 | 66.42 ± 2.42 | 64.14 ± 1.34 |
| Sample | To | Tp | Tc | ΔT | ΔH (J/g) |
|---|---|---|---|---|---|
| PRS | 36.30 | 80.17 | 119.43 | 83.13 | 235.67 |
| FA | 174.17 | 177.53 | 180.52 | 6.35 | 92.49 |
| Physical mixture | 164.68 | 169.67 | 172.54 | 7.86 | 71.19 |
| Encapsulated FA | 37.79 | 88.83 | 141.60 | 103.81 | 262.88 |
| Sample | Z Average Size (nm) | PDI Values | Zeta Potential (mV) |
|---|---|---|---|
| PRS | 71.51 ± 7.01 | 0.297 ± 0.007 | −67.72 ± 3.18 |
| Encapsulated FA | 73.90 ± 2.67 | 0.394 ± 0.005 | −14.85 ± 1.90 |
| Sample | M.I.I. Value | Classification of Skin |
|---|---|---|
| SLS | 1.12 | Slight irritation |
| Water | 0.00 | No irritation |
| FA cream | 0.00 | No irritation |
| Encapsulated FA cream | 0.00 | No irritation |
| Phase | Ingredients | %w/w |
|---|---|---|
| A | Water | 86.0 |
| Glycerin | 5.0 | |
| Butylene glycol | 2.0 | |
| Acrylates/Acrylamide Copolymer (and) Mineral oil (and) Polysorbate 85 | 1.5 | |
| B | Glyceryl Stearate SE | 1.2 |
| Cetearyl alcohol | 1.5 | |
| Glyceryl Stearate (and) PEG-100 Stearate | 1.5 | |
| C | Phenoxyethanol | 0.8 |
| Score | Clinical Description |
|---|---|
| 0 | No erythema |
| 1 | Light erythema (hardly visible) |
| 2 | Clearly visible erythema |
| 3 | Moderate erythema |
| 4 | Serious erythema (dark red with possible formation of light scars) |
| 0 | No oedema |
| 1 | Light oedema (hardly visible) |
| 2 | Light oedema |
| 3 | Moderate oedema (about 1 mm raised skin) |
| 4 | Strong oedema (extended swelling even beyond the application area) |
| M.I.I. | Classification |
|---|---|
| <0.5 | Non-irritation |
| 0.5 to 2.0 | Slight sirritation |
| 2.0 to 5.0 | Moderate irritation |
| 5.0 to 8.0 | Strong irritation |
Publisher’s Note: MDPI stays neutral with regard to jurisdictional claims in published maps and institutional affiliations. |
© 2022 by the authors. Licensee MDPI, Basel, Switzerland. This article is an open access article distributed under the terms and conditions of the Creative Commons Attribution (CC BY) license (https://creativecommons.org/licenses/by/4.0/).
Share and Cite
Pueknang, J.; Saewan, N. Stability and Anti-Aging of Encapsulated Ferulic Acid in Phosphorylated Rice Starch. Molecules 2022, 27, 3463. https://doi.org/10.3390/molecules27113463
Pueknang J, Saewan N. Stability and Anti-Aging of Encapsulated Ferulic Acid in Phosphorylated Rice Starch. Molecules. 2022; 27(11):3463. https://doi.org/10.3390/molecules27113463
Chicago/Turabian StylePueknang, Jittraporn, and Nisakorn Saewan. 2022. "Stability and Anti-Aging of Encapsulated Ferulic Acid in Phosphorylated Rice Starch" Molecules 27, no. 11: 3463. https://doi.org/10.3390/molecules27113463
APA StylePueknang, J., & Saewan, N. (2022). Stability and Anti-Aging of Encapsulated Ferulic Acid in Phosphorylated Rice Starch. Molecules, 27(11), 3463. https://doi.org/10.3390/molecules27113463


