
Neutron Total Scattering Investigation of the Dissolution Mechanism of Trehalose in Alkali/Urea Aqueous Solution

 , ,
, , 
Abstract
:1. Introduction
2. Theory and Methods
2.1. Neutron Scattering Method and SANDALS
2.2. EPSR Simulations
2.3. Experiment Samples
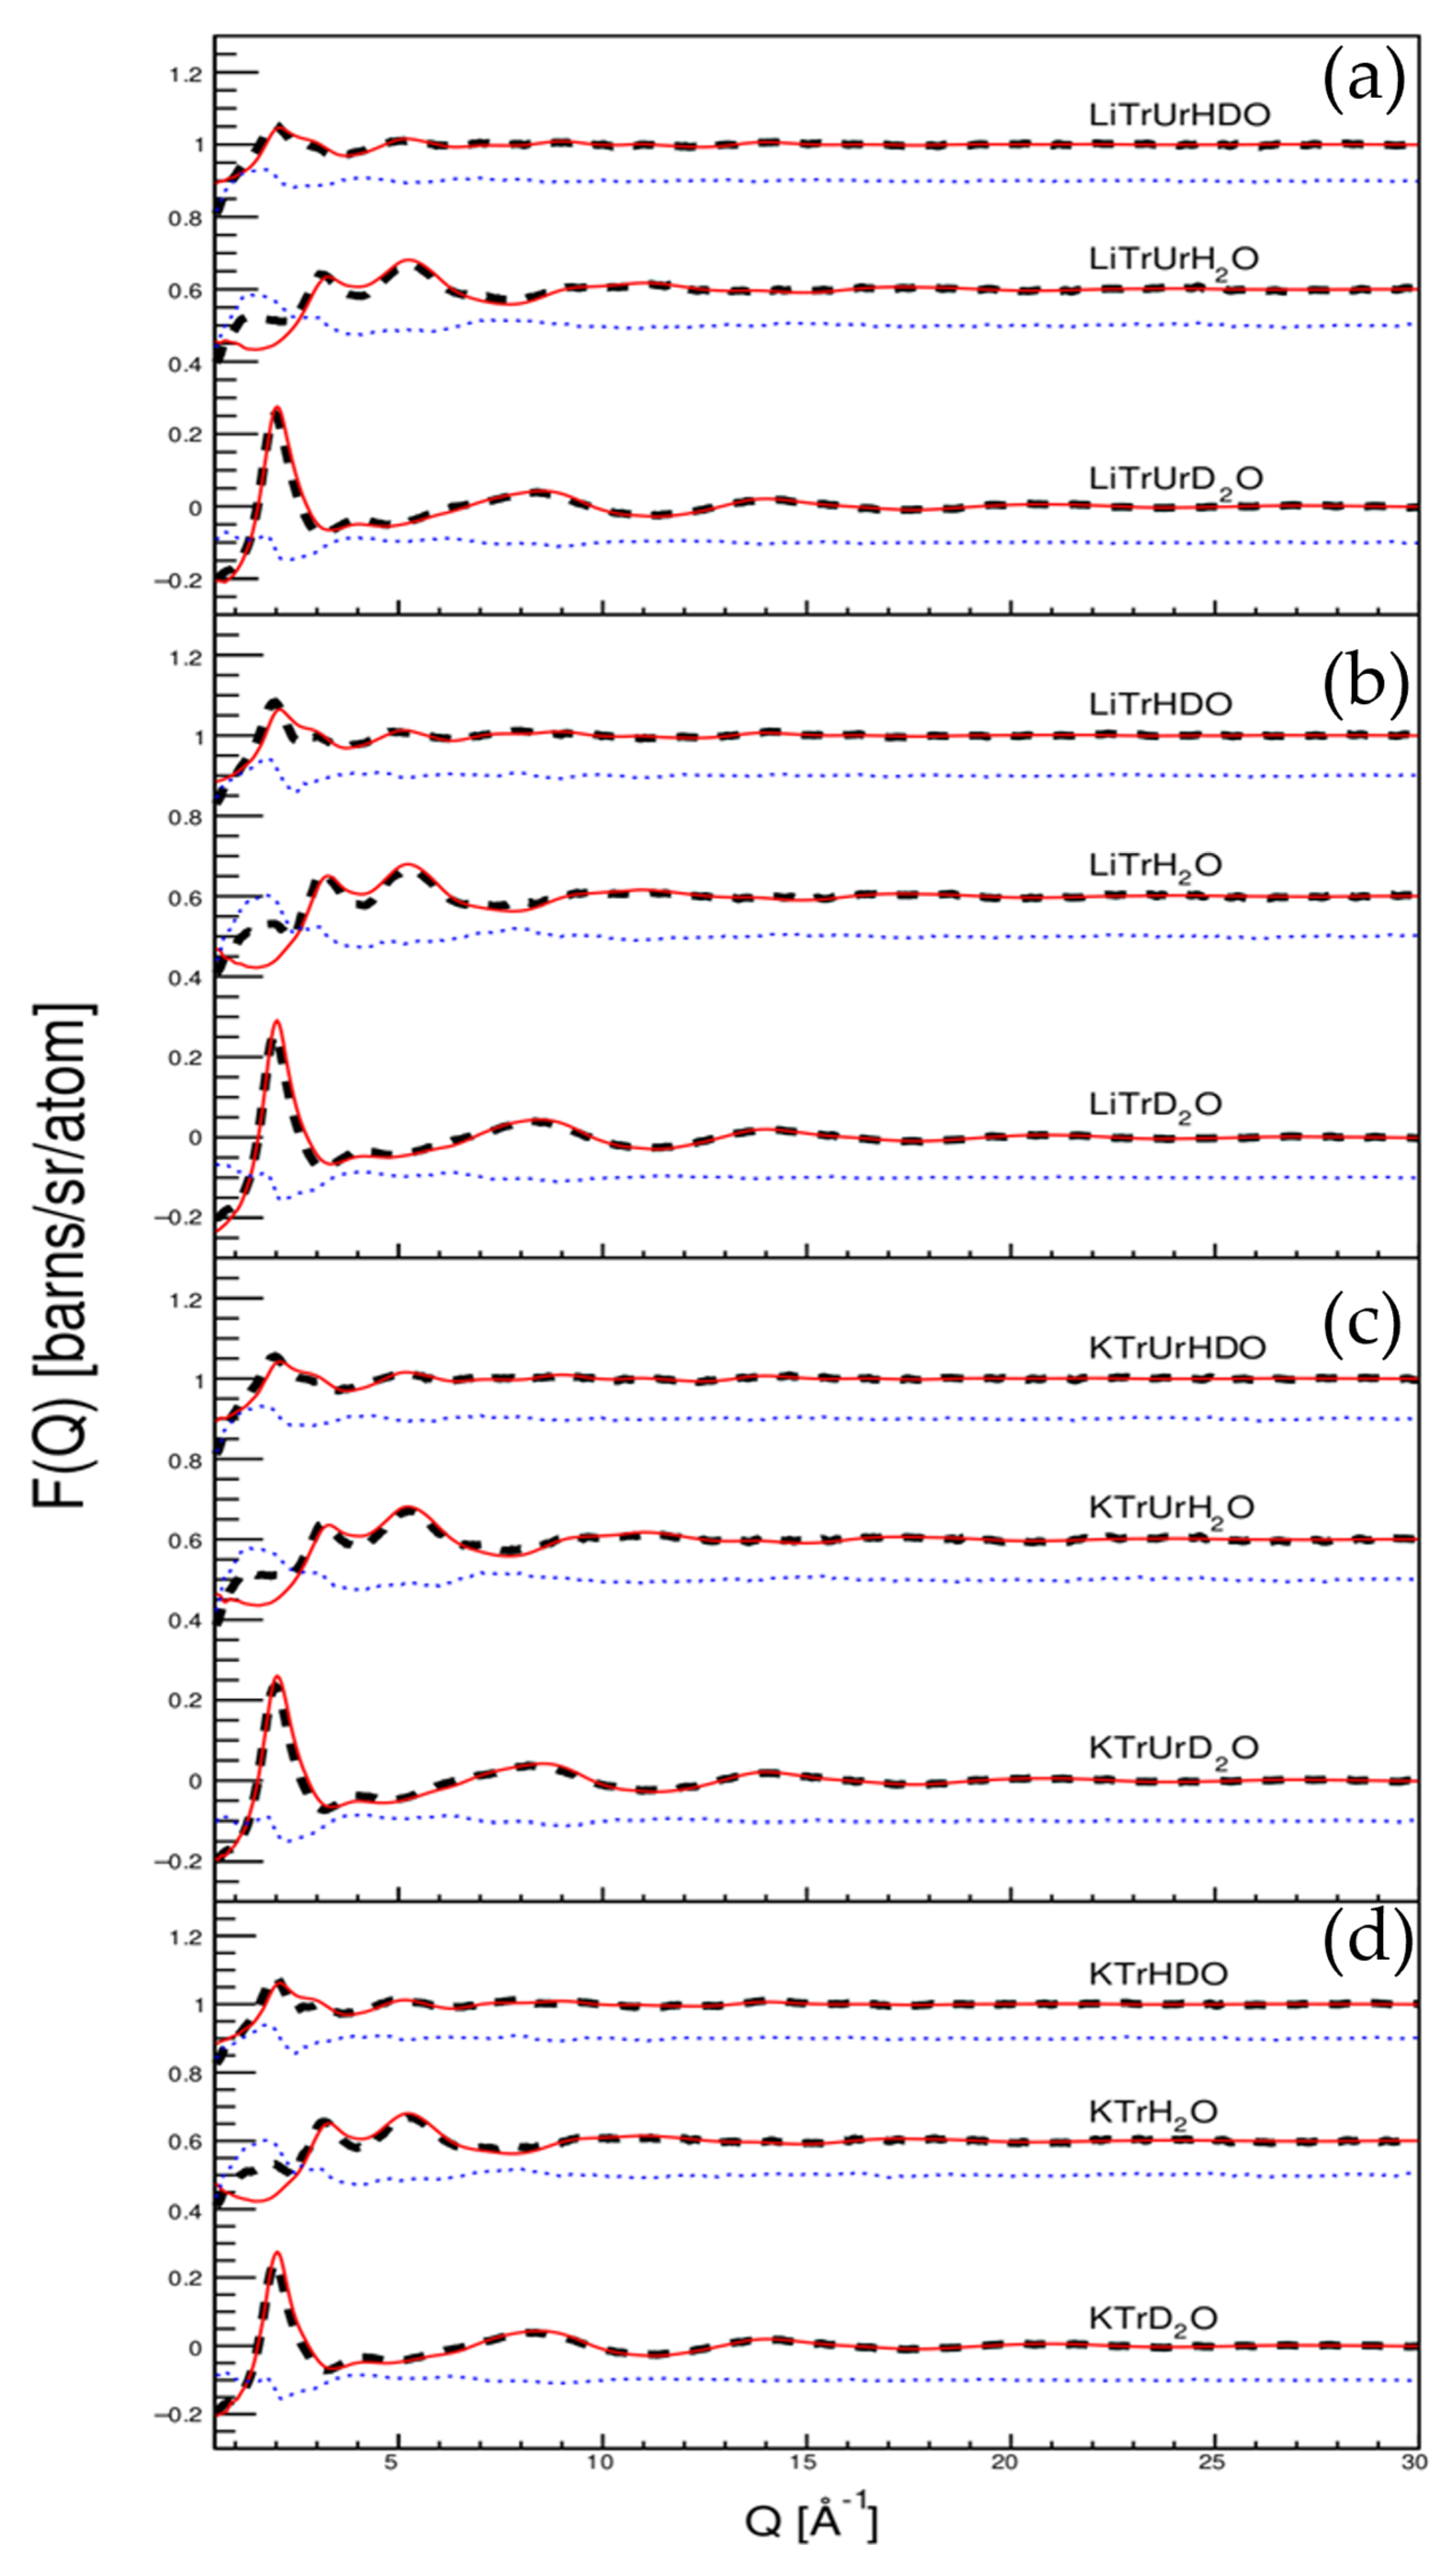
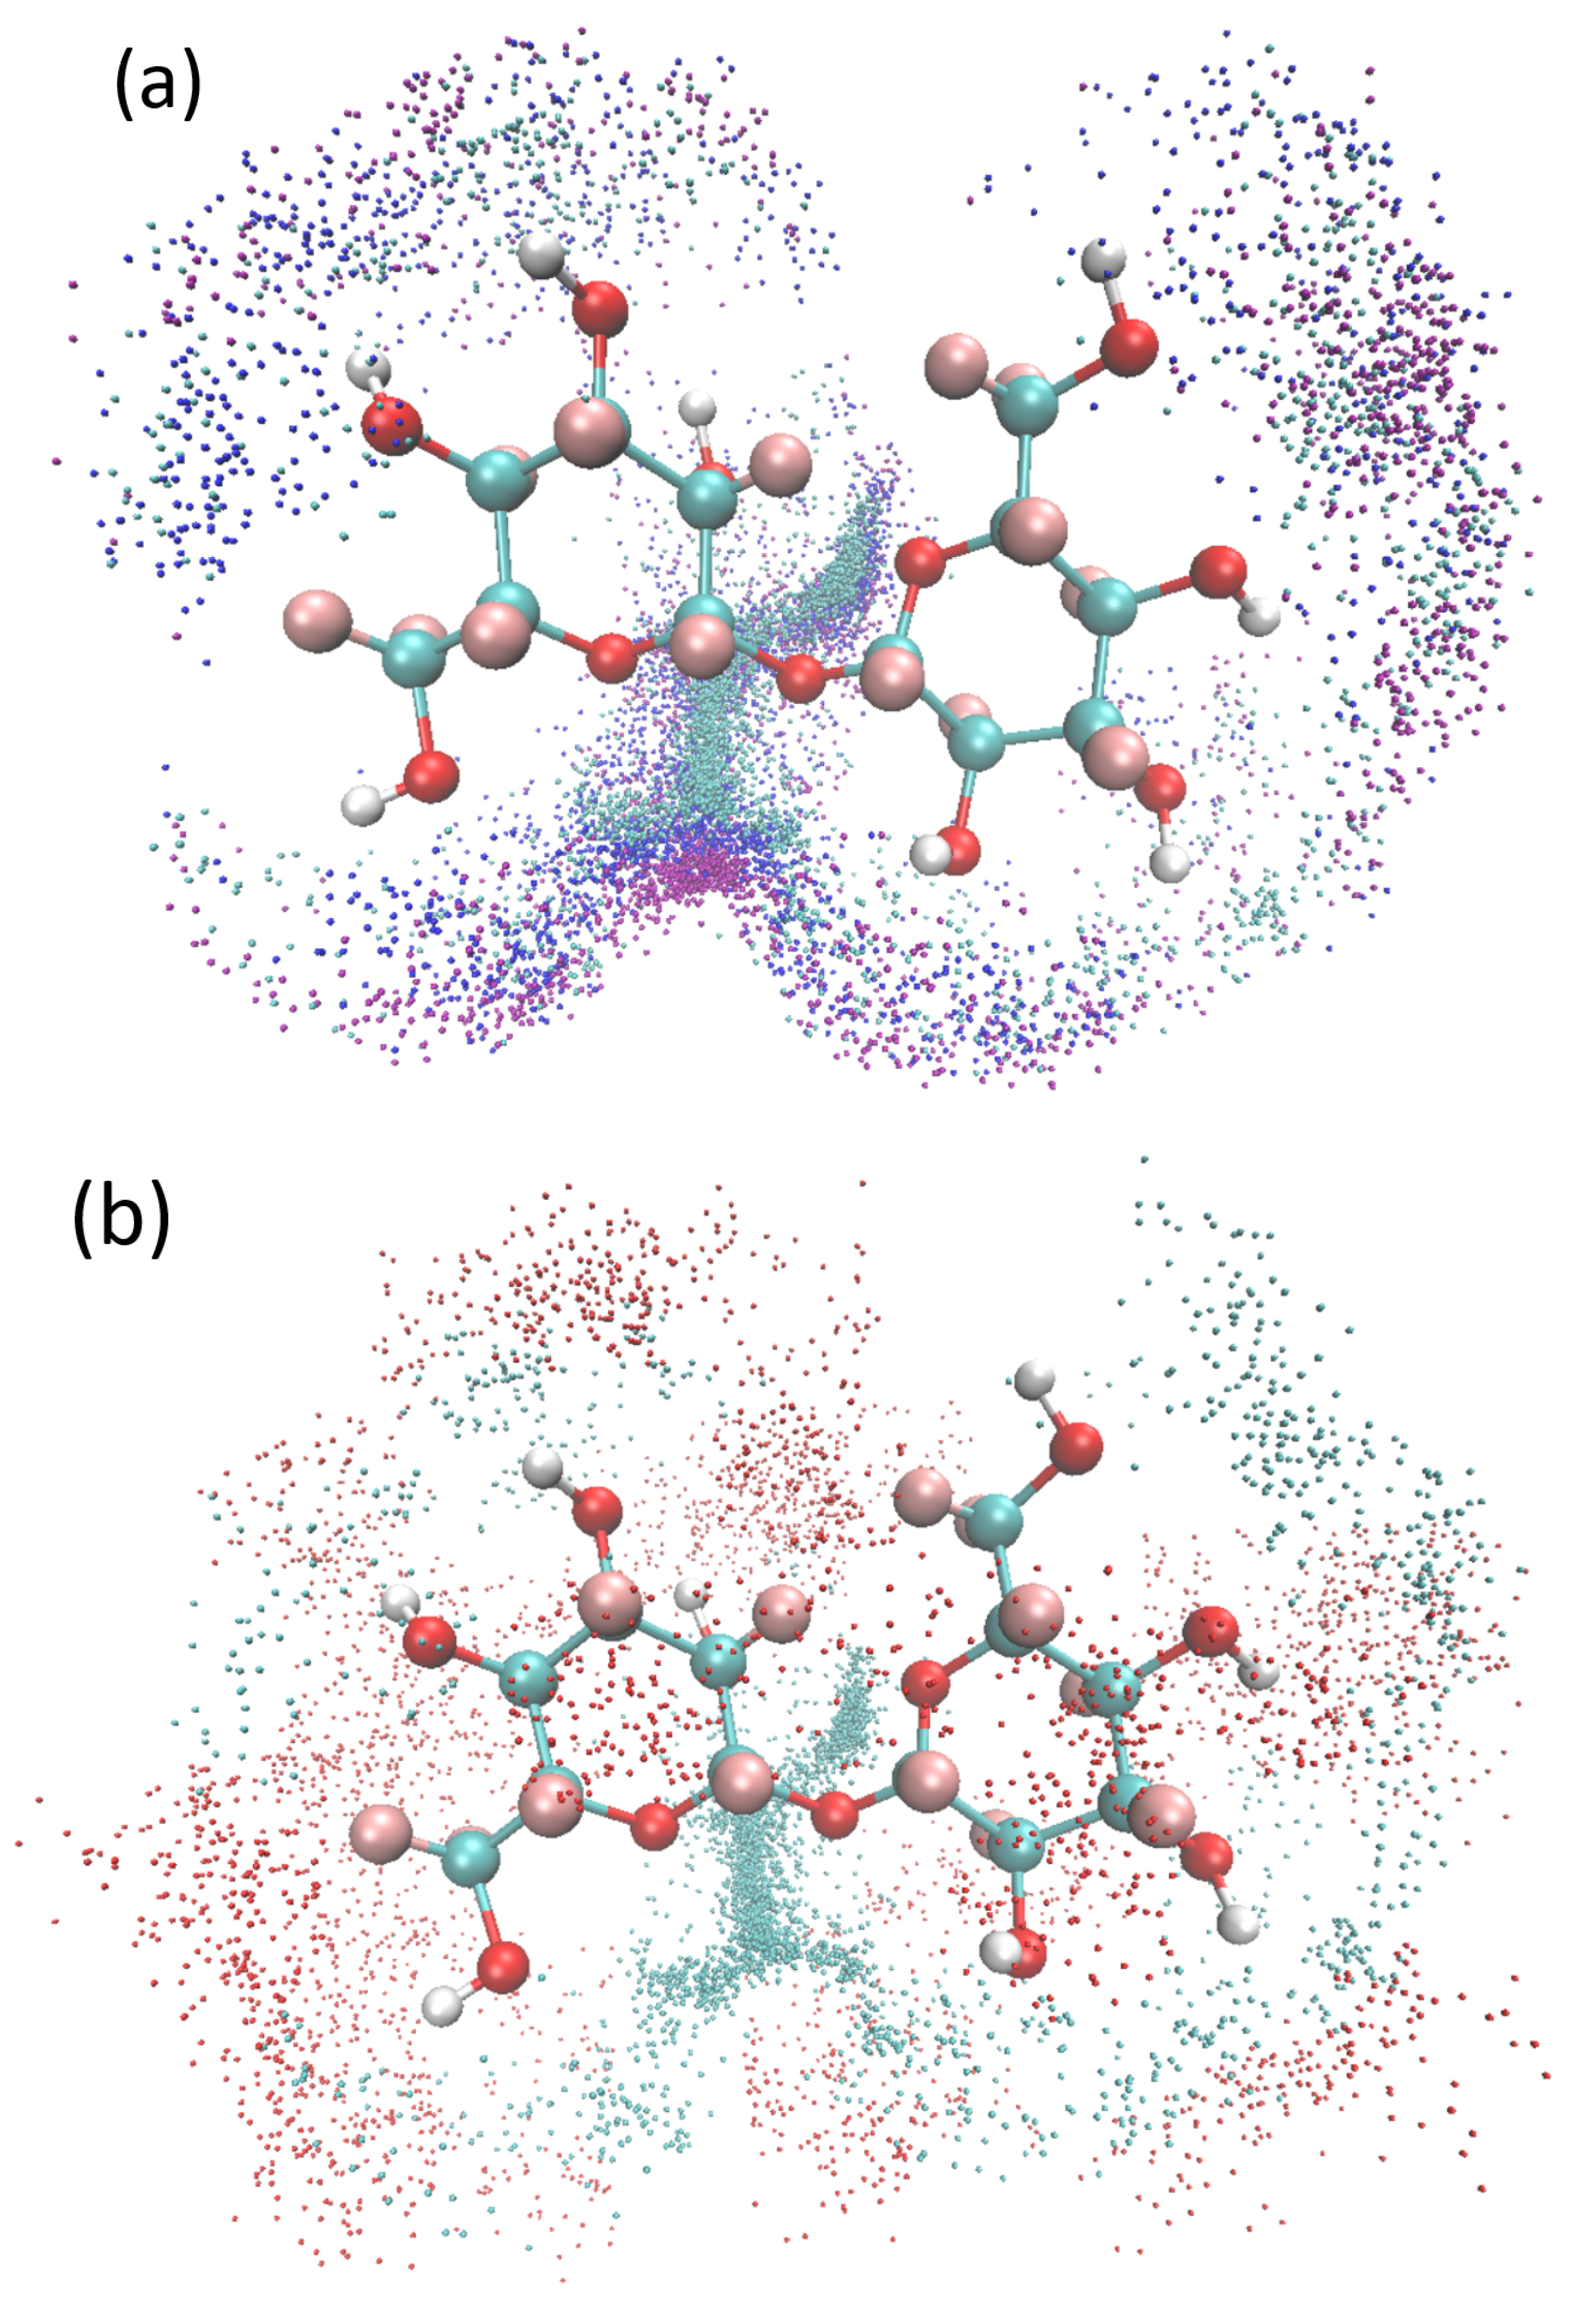
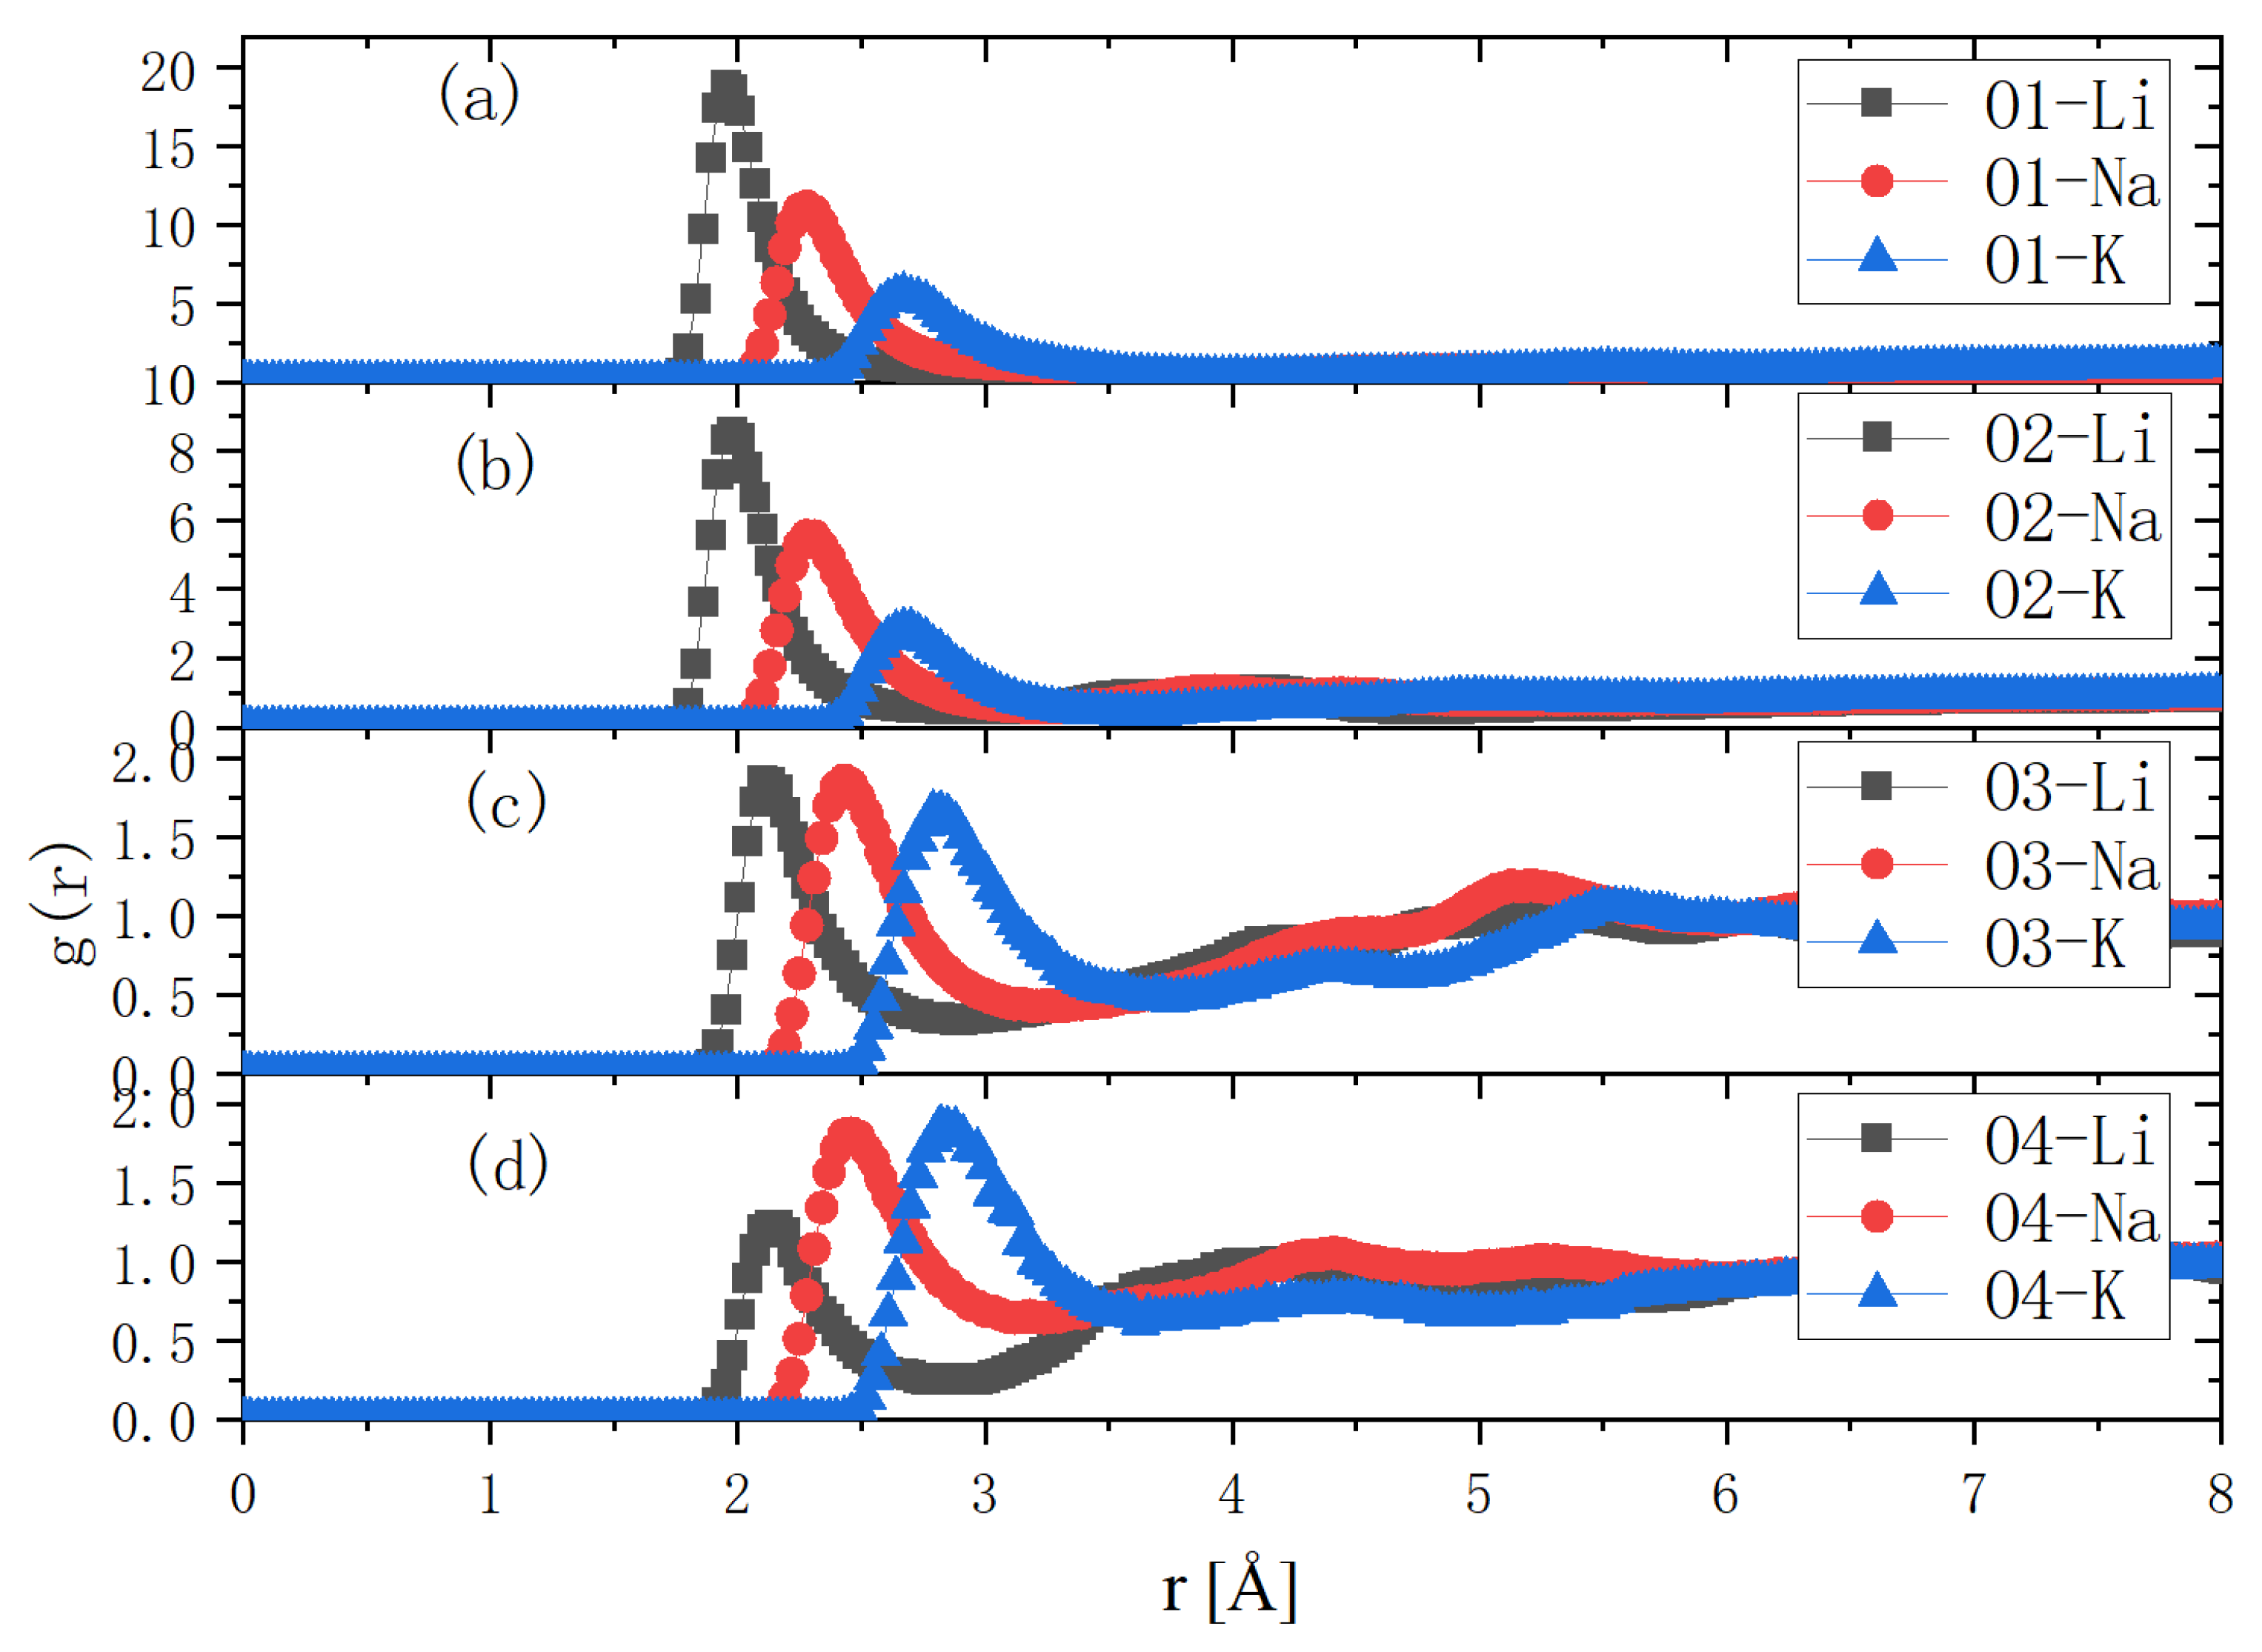
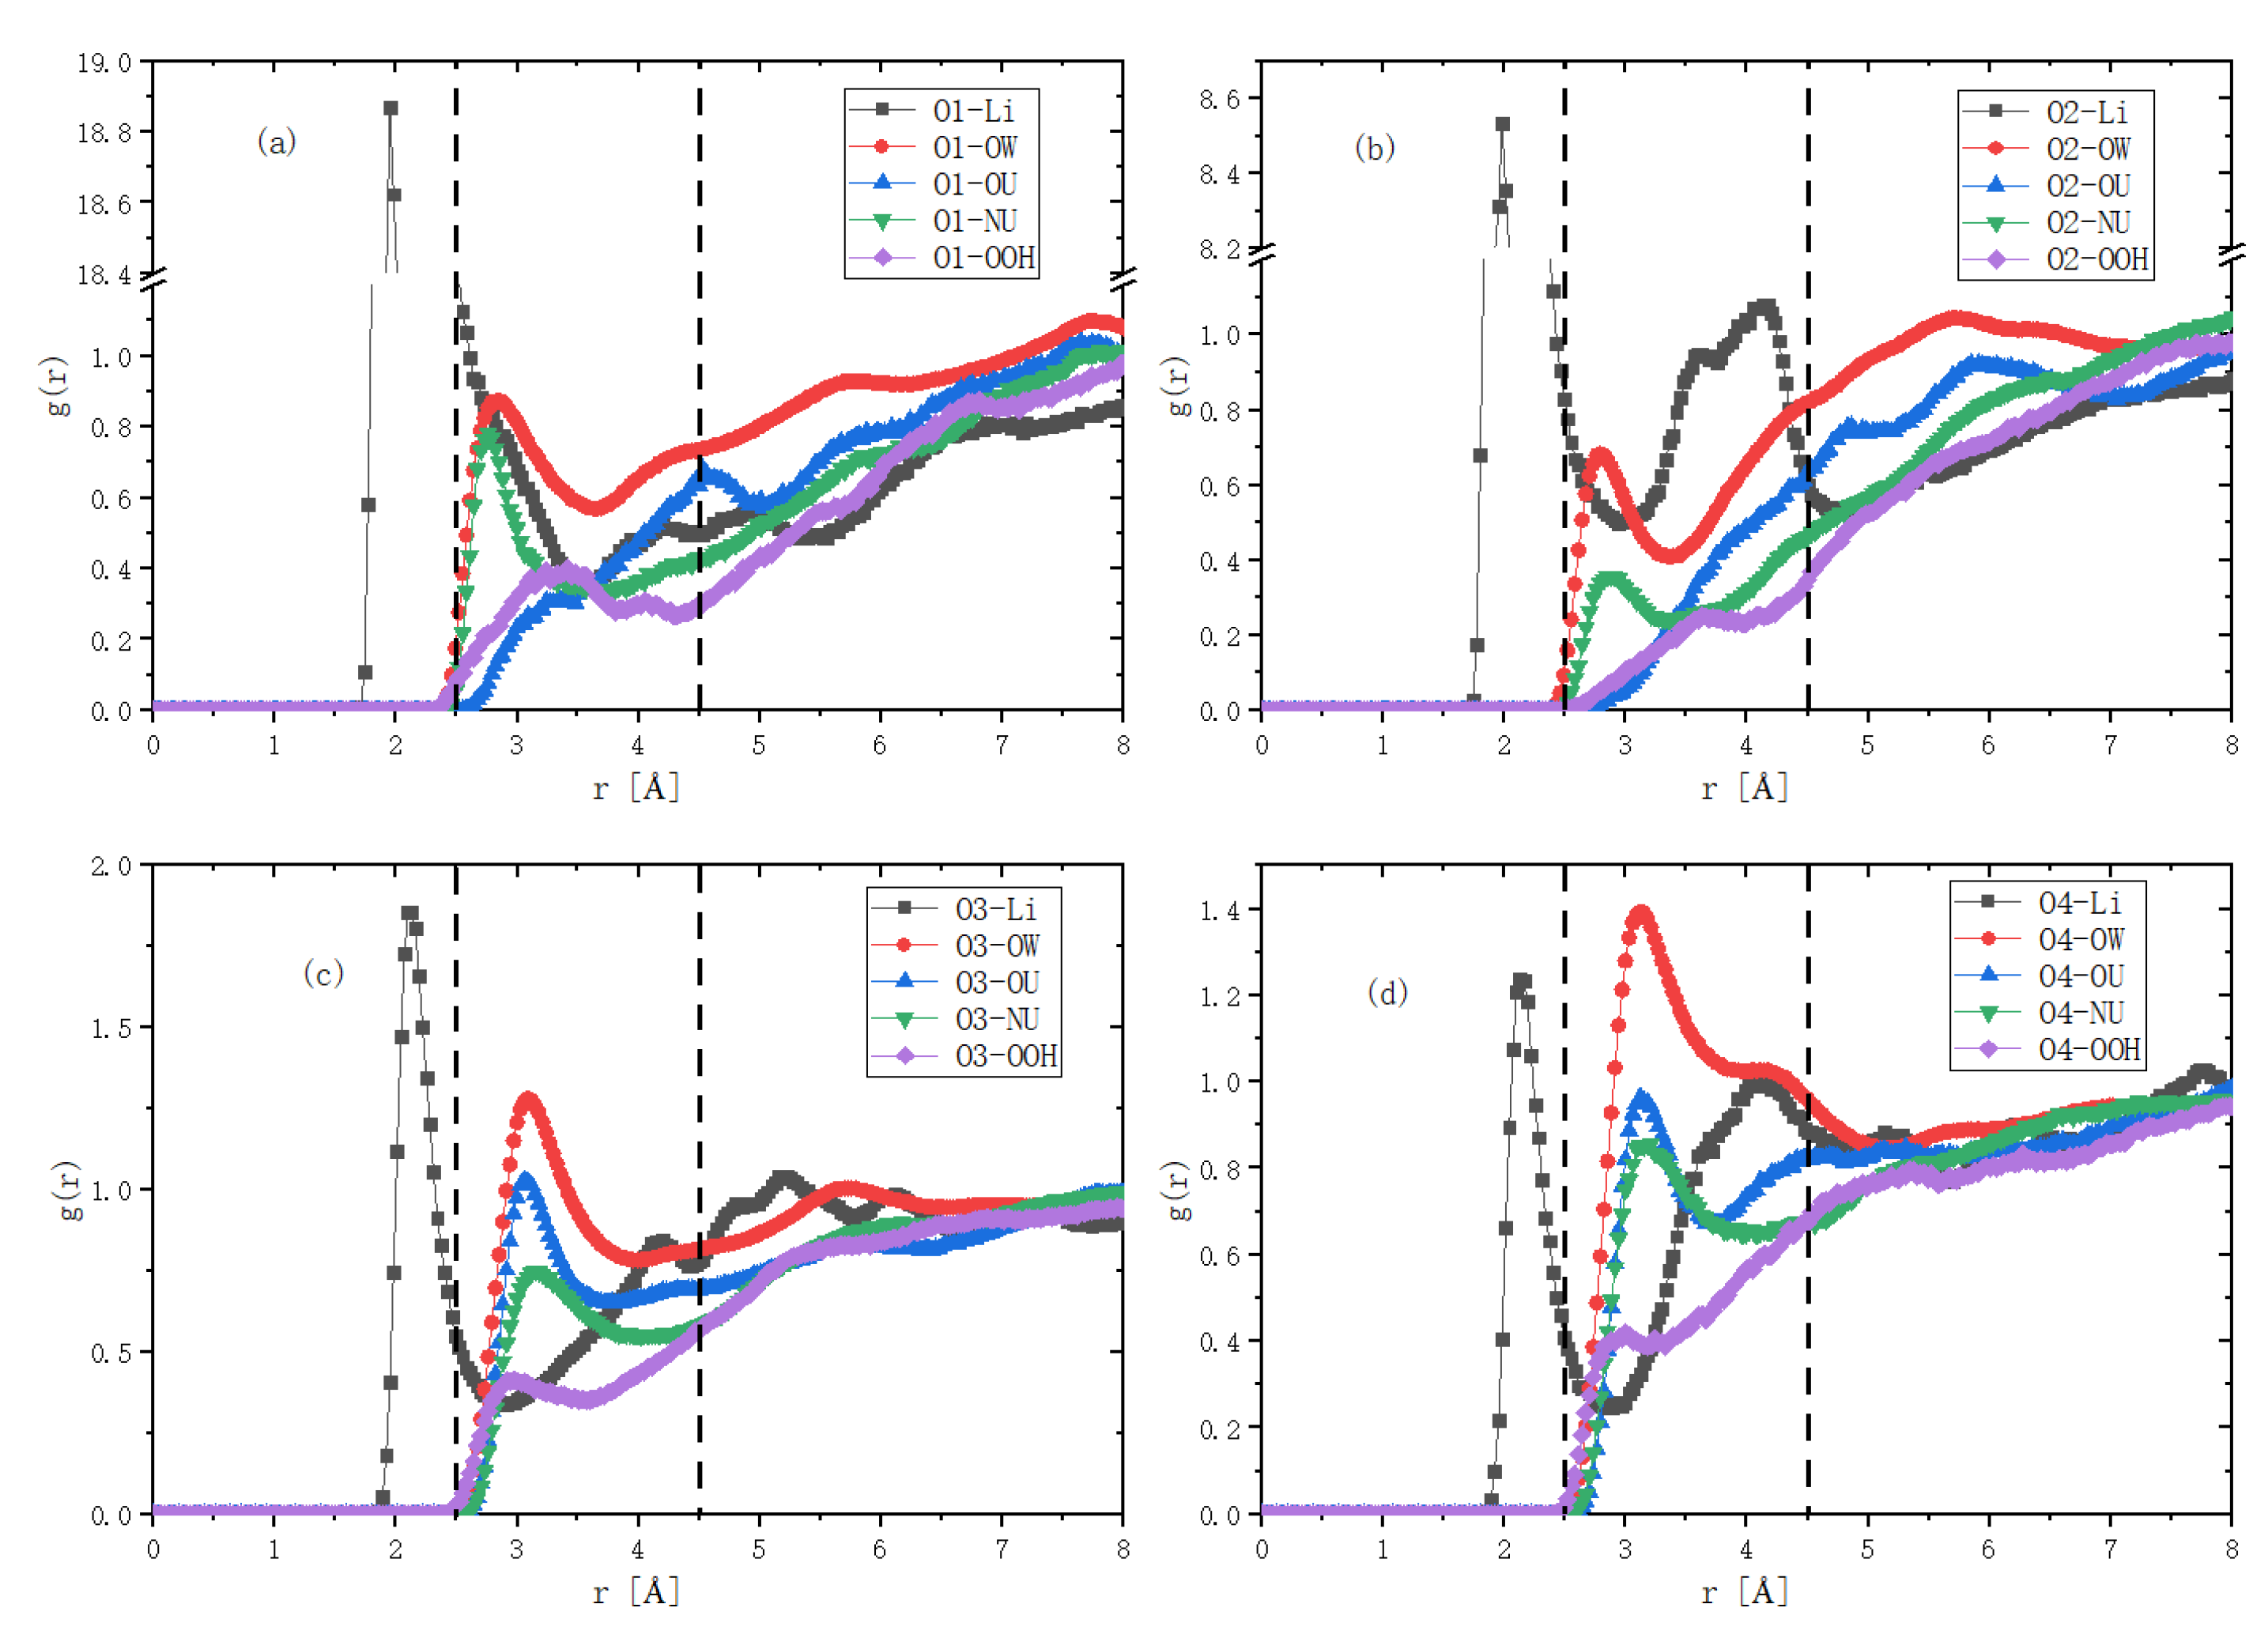
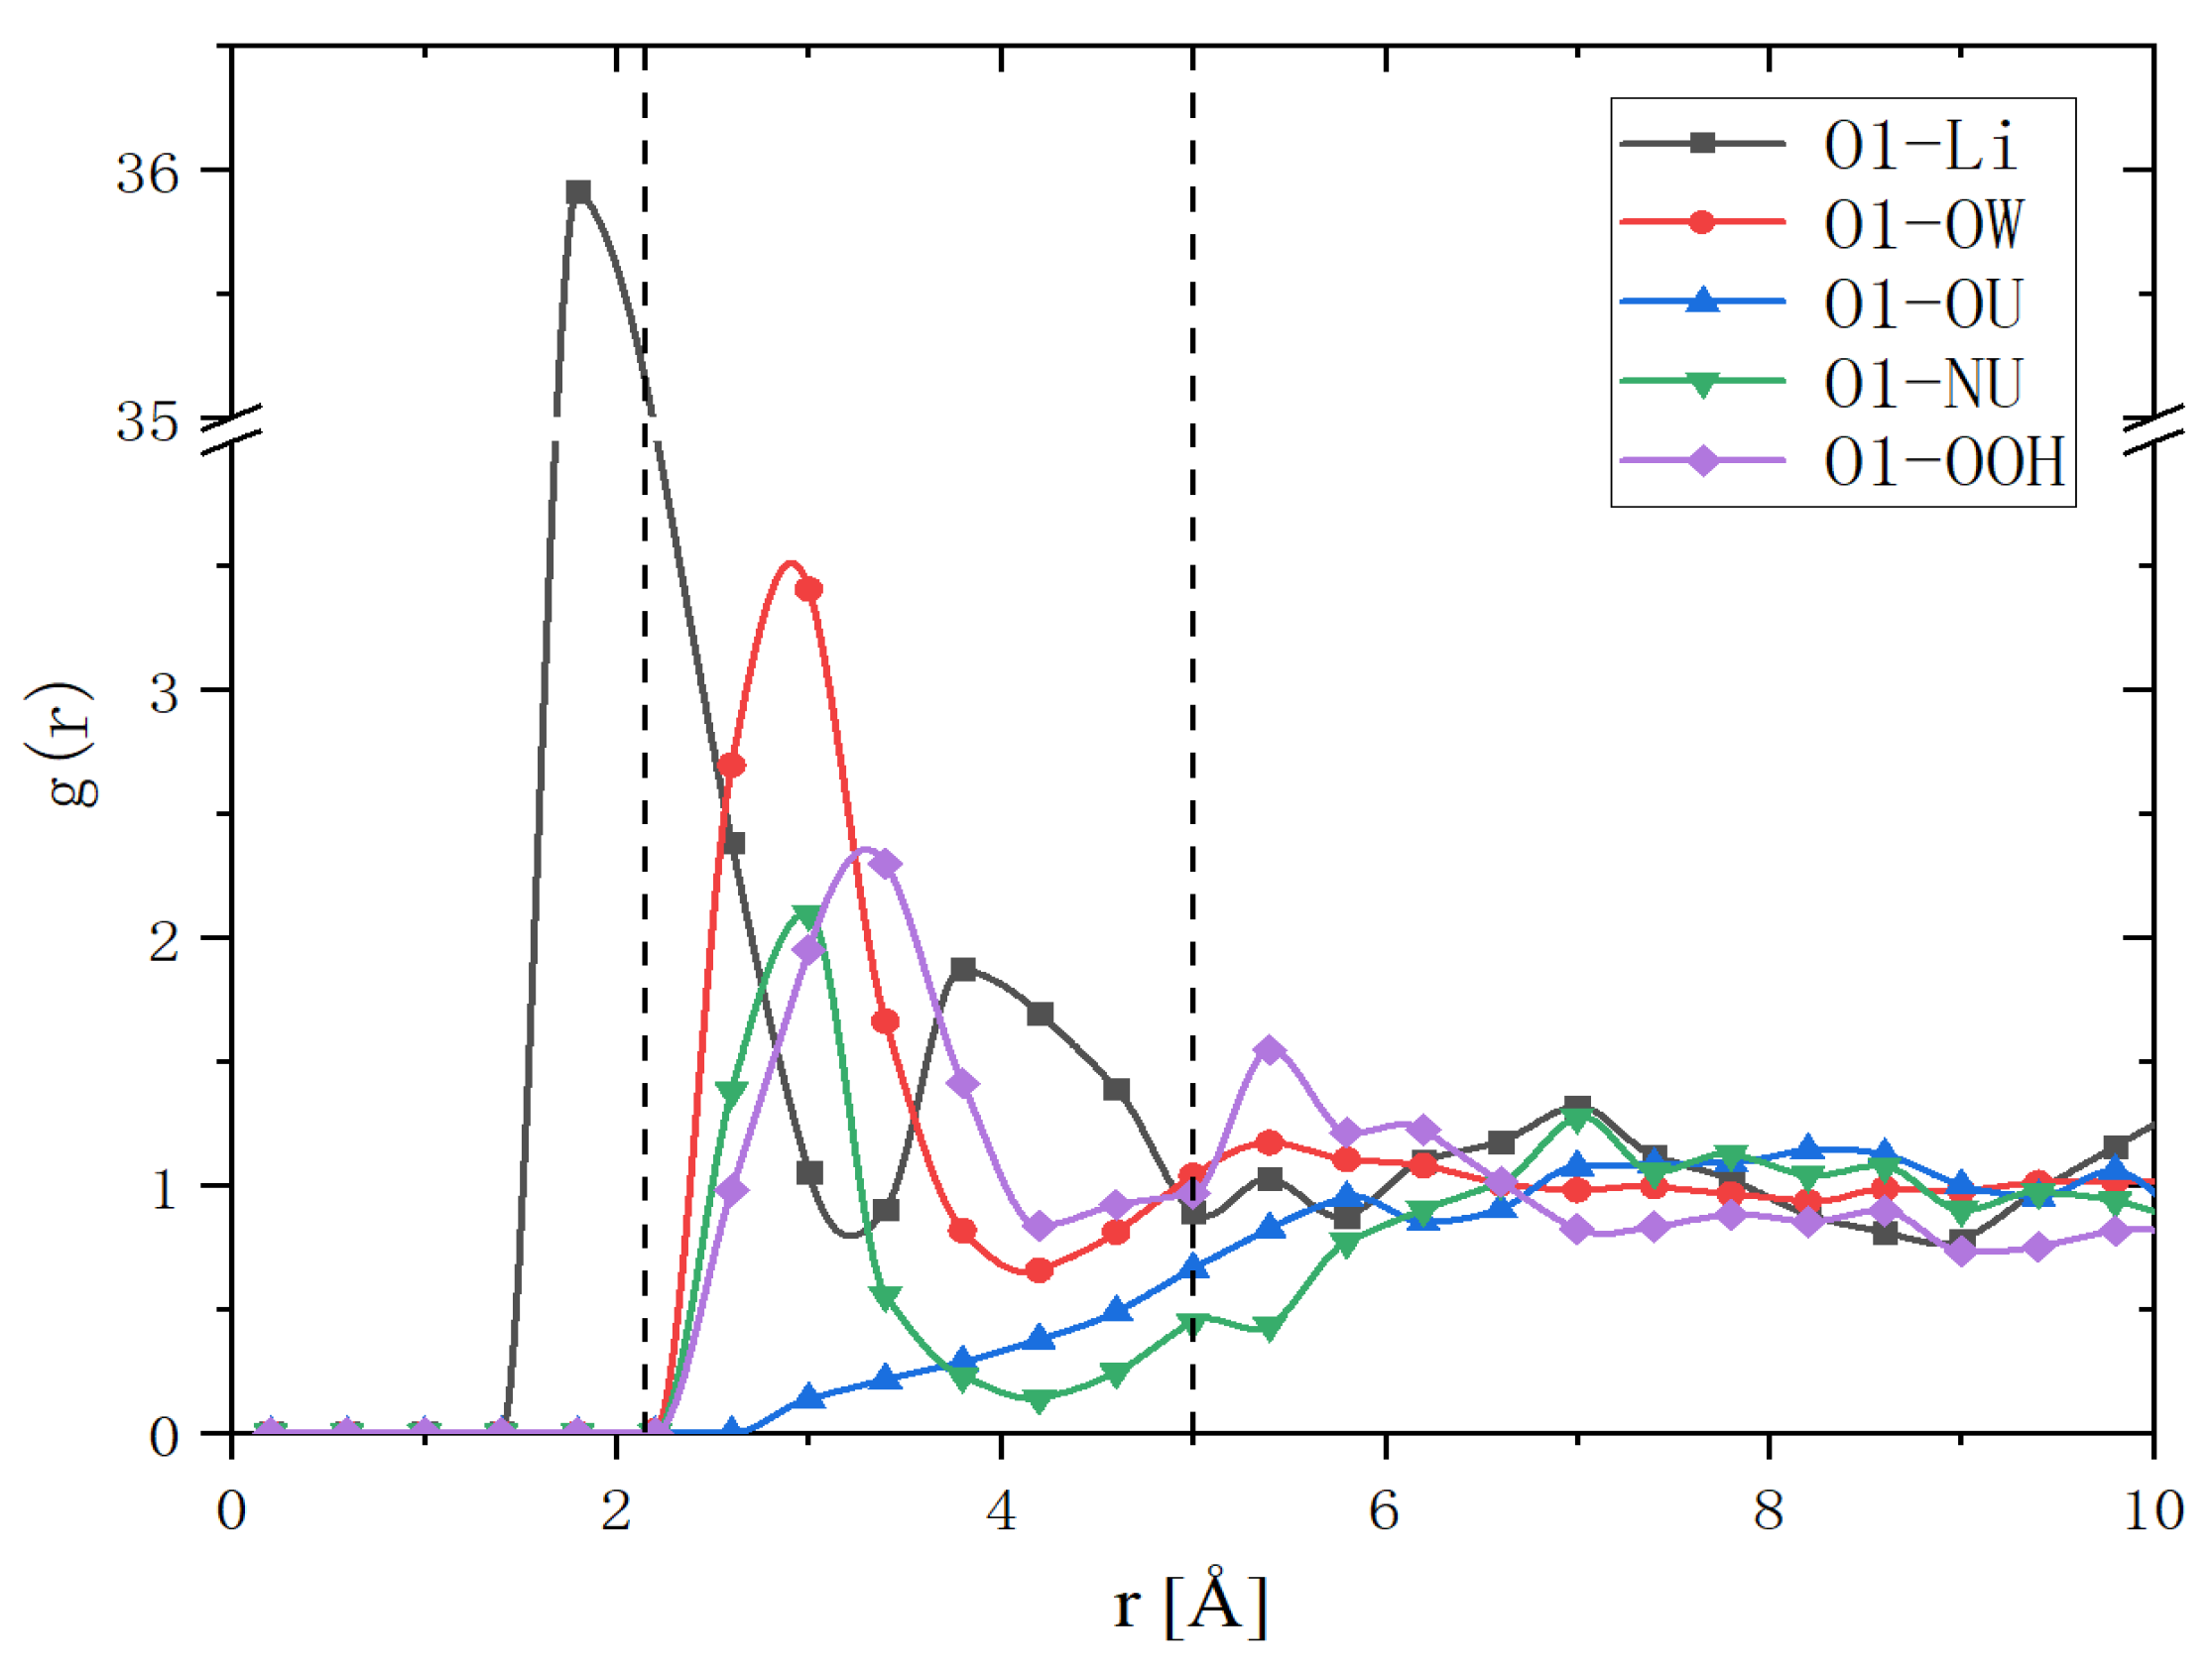
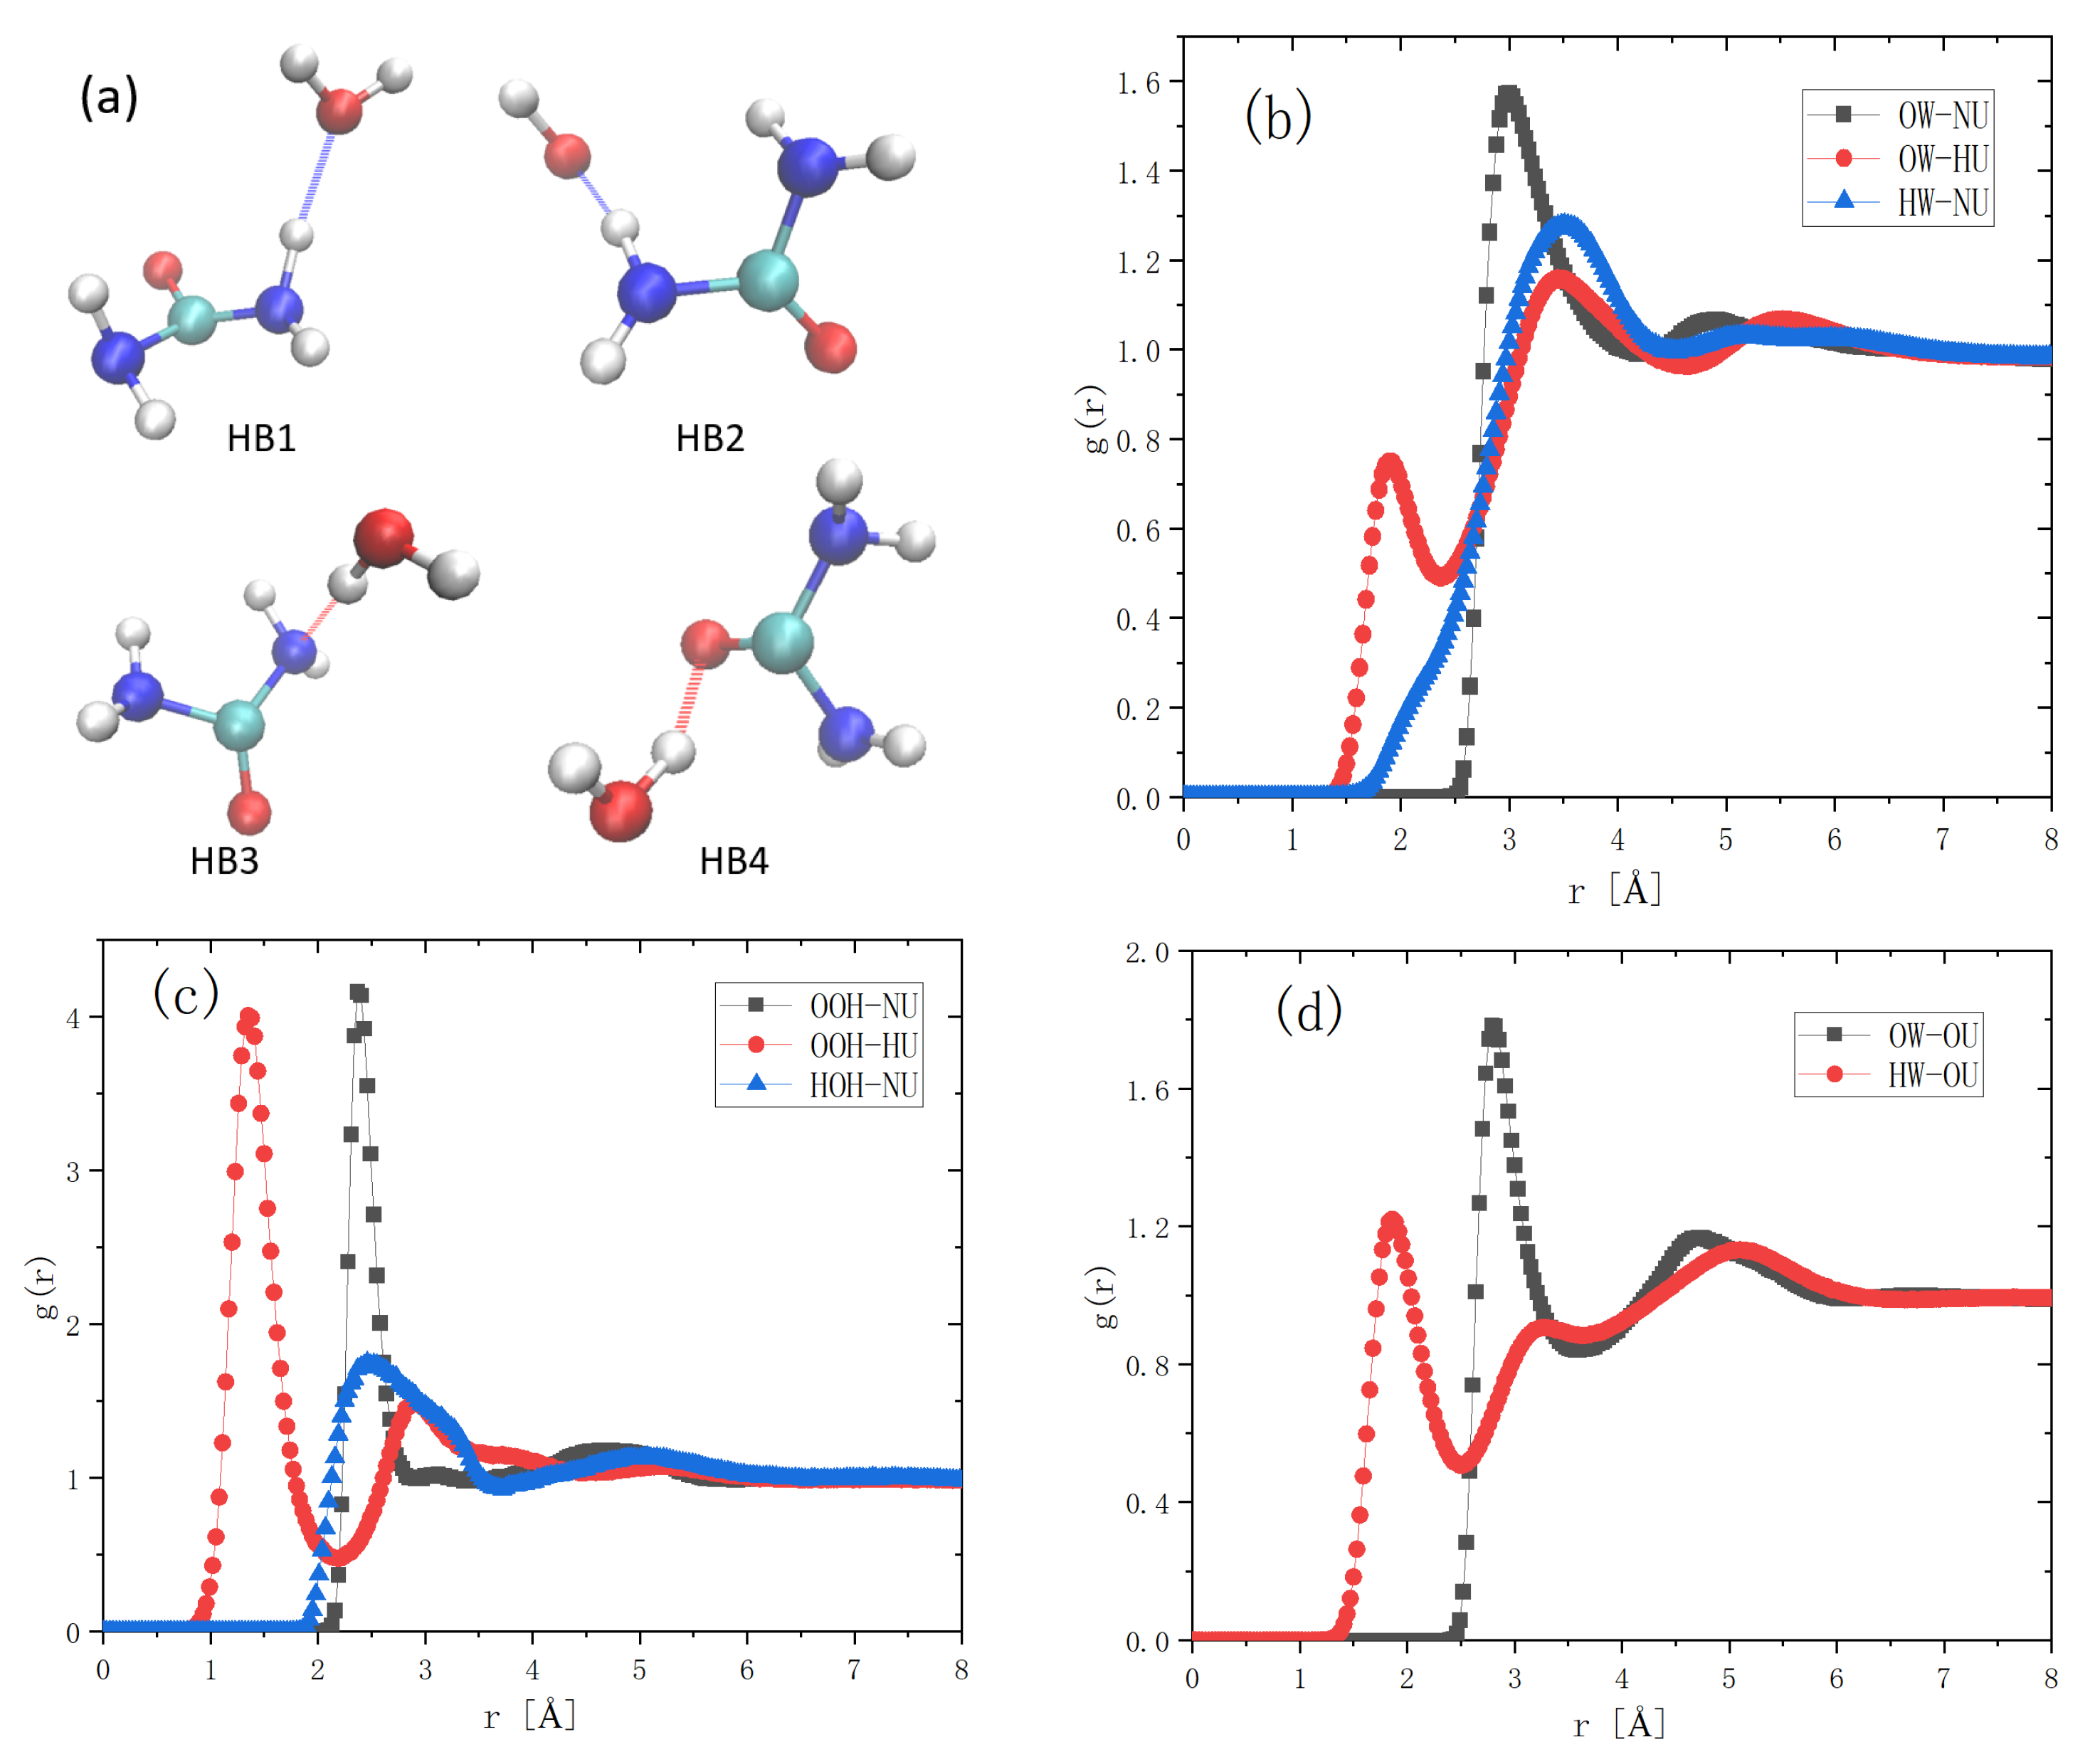
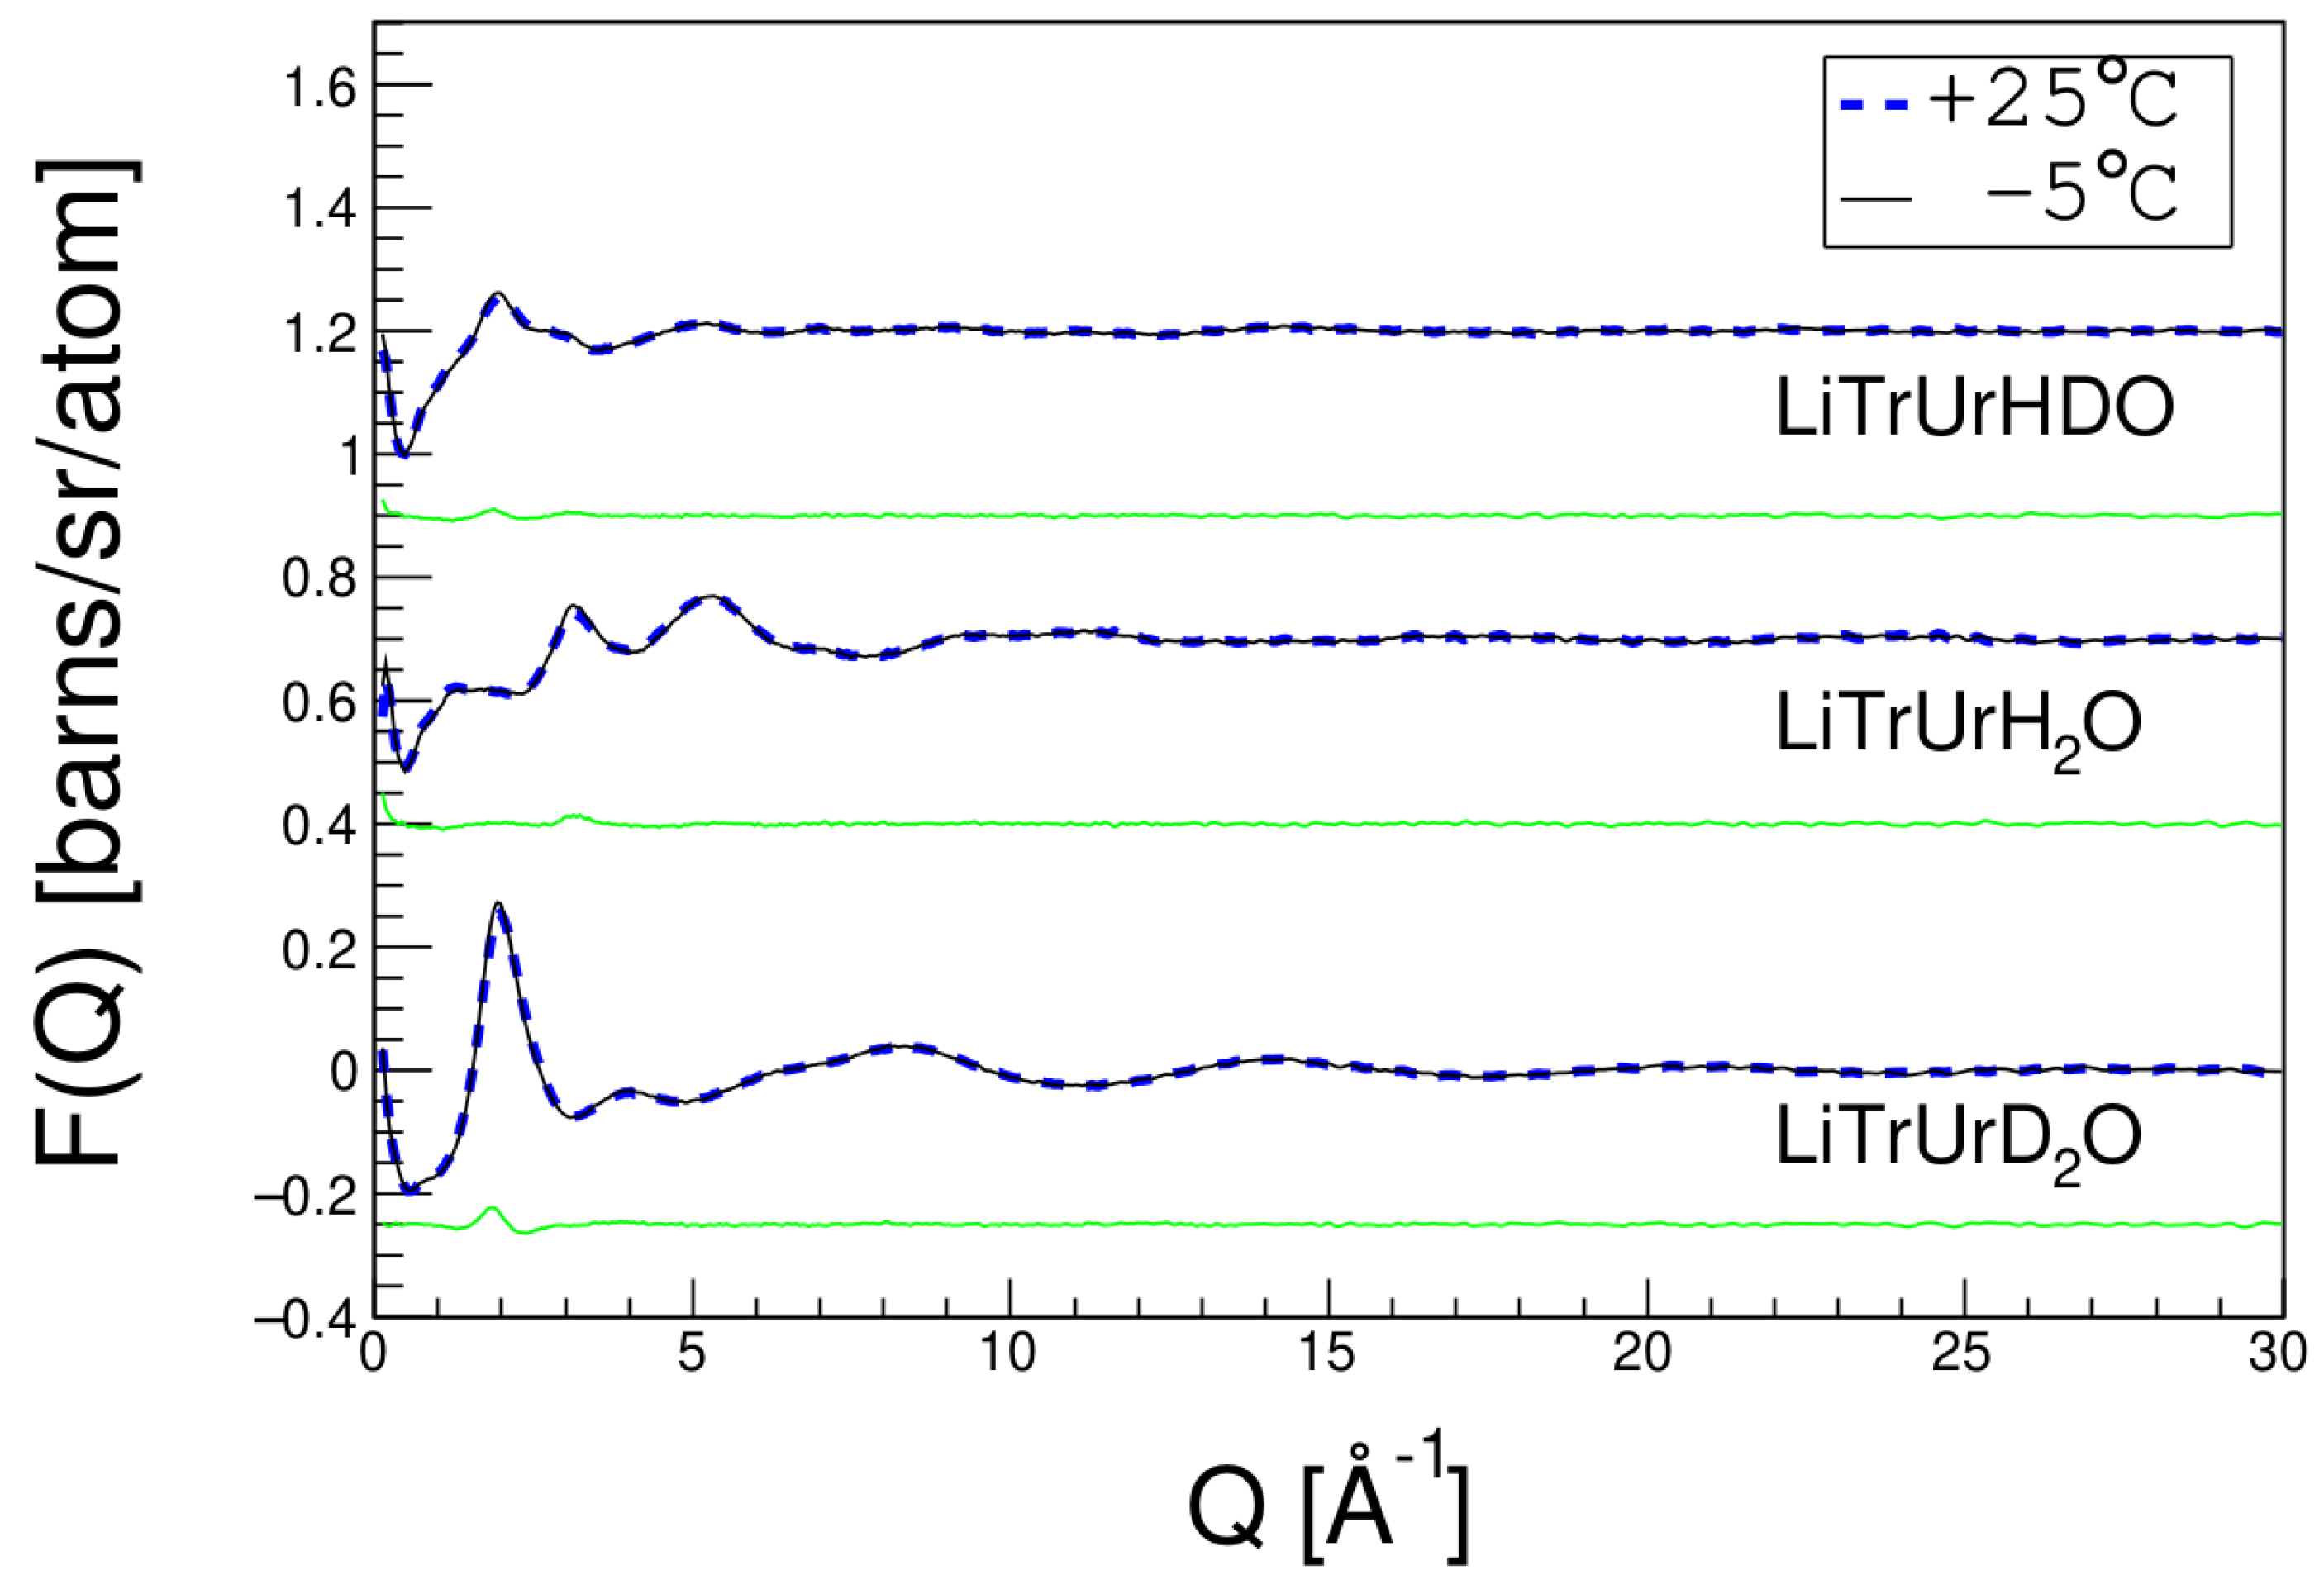
3. Results
4. Conclusions
Author Contributions
Funding
Institutional Review Board Statement
Informed Consent Statement
Data Availability Statement
Acknowledgments
Conflicts of Interest
References
- Wang, S.; Lu, A.; Zhang, L. Recent advances in regenerated cellulose materials. Prog. Polym. Sci. 2016, 53, 169–206. [Google Scholar] [CrossRef]
- Cai, J.; Zhang, L. Rapid Dissolution of Cellulose in LiOH/Urea and NaOH/Urea Aqueous Solutions. Macromol. Biosci. 2005, 5, 539–548. [Google Scholar] [CrossRef] [PubMed]
- Cai, J.; Zhang, L.; Chang, C.; Cheng, G.; Chen, X.; Chu, B. Hydrogen-Bond-Induced Inclusion Complex in Aqueous Cellulose/Lioh/Urea Solution at Low Temperature. ChemPhysChem 2007, 8, 1572–1579. [Google Scholar] [CrossRef] [PubMed]
- Jiang, Z.; Lu, A.; Zhou, J.; Zhang, L. Interaction between –OH groups of methylcellulose and solvent in NaOH/urea aqueous system at low temperature. Cellulose 2012, 19, 671–678. [Google Scholar] [CrossRef]
- Jiang, Z.; Fang, Y.; Xiang, J.; Ma, Y.; Lu, A.; Kang, H.; Huang, Y.; Guo, H.; Liu, R.; Zhang, L. Intermolecular Interactions and 3d Structure in Cellulose-Naoh-Urea Aqueous System. J. Phys. Chem. B 2014, 118, 10250–10257. [Google Scholar] [CrossRef] [PubMed]
- Lindman, B.; Karlström, G.; Stigsson, L. On the mechanism of dissolution of cellulose. J. Mol. Liq. 2010, 156, 76–81. [Google Scholar] [CrossRef]
- Alves, L.; Medronho, B.; Filipe, A.; Antunes, F.E.; Lindman, B.; Topgaard, D.; Davidovich, I.; Talmon, Y. New Insights on the Role of Urea on the Dissolution and Thermally-Induced Gelation of Cellulose in Aqueous Alkali. Gels 2018, 4, 87. [Google Scholar] [CrossRef] [Green Version]
- Lindman, B.; Medronho, B. The Subtleties of Dissolution and Regeneration of Cellulose: Breaking and Making Hydrogen Bonds. BioResources 2015, 10, 3811–3814. [Google Scholar] [CrossRef]
- Medronho, B.; Lindman, B. Brief overview on cellulose dissolution/regeneration interactions and mechanisms. Adv. Colloid Interface Sci. 2015, 222, 502–508. [Google Scholar] [CrossRef] [PubMed]
- Glasser, W.G.; Atalla, R.H.; Blackwell, J.; Brown, R.M.; Burchard, W.; French, A.D.; Klemm, D.O.; Nishiyama, Y. About the Structure of Cellulose: Debating the Lindman Hypothesis. Cellulose 2012, 19, 589–598. [Google Scholar] [CrossRef]
- Soper, A.K. Empirical Potential Monte Carlo Simulation of Fluid Structure. Chem. Phys. 1996, 202, 12. [Google Scholar] [CrossRef]
- Ma, C.L.; Cheng, H.; Zuo, T.S.; Jiao, G.S.; Han, Z.H.; Qin, H. Neudatool: An Open Source Neutron Data Analysis Tools, Supporting Gpu Hardware Acceleration, and across-Computer Cluster Nodes Parallel. Chin. J. Chem. Phys. 2020, 33, 727–732. [Google Scholar] [CrossRef]
- Qin, H.; Ma, C.; Gärtner, S.; Headen, T.F.; Zuo, T.; Jiao, G.; Han, Z.; Imberti, S.; Han, C.C.; Cheng, H. Neutron total scattering investigation on the dissolution mechanism of trehalose in NaOH/urea aqueous solution. Struct. Dyn. 2021, 8, 014901. [Google Scholar] [CrossRef] [PubMed]
- Soper, A.K.; Castner, E.W., Jr.; Luzar, A. Impact of Urea on Water Structure: A Clue to Its Properties as a Denaturant? Biophys. Chem. 2003, 105, 649–666. [Google Scholar] [CrossRef]
- McLain, S.E.; Imberti, S.; Soper, A.K.; Botti, A.; Bruni, F.; Ricci, M.A. Structure of 2 molar NaOH in aqueous solution from neutron diffraction and empirical potential structure refinement. Phys. Rev. B 2006, 74, 094201. [Google Scholar] [CrossRef]
- Imberti, S.; Botti, A.; Bruni, F.; Cappa, G.; Ricci, M.A.; Soper, A.K. Ions in water: The microscopic structure of concentrated hydroxide solutions. J. Chem. Phys. 2005, 122, 194509. [Google Scholar] [CrossRef] [PubMed]
- Soper, A.K.; Ricci, M.A.; Bruni, F.; Rhys, N.H.; McLain, S.E. Trehalose in Water Revisited. J. Phys. Chem. B 2018, 122, 7365–7374. [Google Scholar] [CrossRef] [PubMed]
- Gong, P.; Wang, J.; Liu, B.; Ru, G.; Feng, J. Dissolution of chitin in aqueous KOH. Cellulose 2016, 23, 1705–1711. [Google Scholar] [CrossRef]
- Xiong, B.; Zhao, P.; Hu, K.; Zhang, L.; Cheng, G. Dissolution of Cellulose in Aqueous Naoh/Urea Solution: Role of Urea. Cellulose 2014, 21, 1183–1192. [Google Scholar] [CrossRef]

| Sample Labels | Li(K)TrH2O/HDO/D2O | Li(K)TrUrH2O/HDO/D2O |
|---|---|---|
| Chemical Component | Li(K)OH Trehalose Water | Li(K)OH Urea Trehalose Water |
| Deuterium Ratio | 0.0/0.5/1.0 | 0.0/0.5/1.0 |
| Molar Ratio | Li(K)OH:Urea:Trehalose:Water = 222:254:64:5716 | |
| (1) | |||||||||
| Atom Label | OW | HW | Li | Na | K | OOH | HOH | CU | OU |
| e [KJ/mole] | 0.650 | 0.000 | 0.690 | 0.125 | 0.500 | 0.251 | 0.184 | 0.439 | 0.878 |
| σ [Å] | 3.166 | 0.000 | 1.510 | 2.500 | 3.000 | 2.750 | 1.443 | 0.375 | 2.960 |
| q [e] | −0.848 | 0.424 | 0.679 | 0.679 | 0.679 | −1.103 | 0.424 | 0.142 | −0.390 |
| (2) | |||||||||
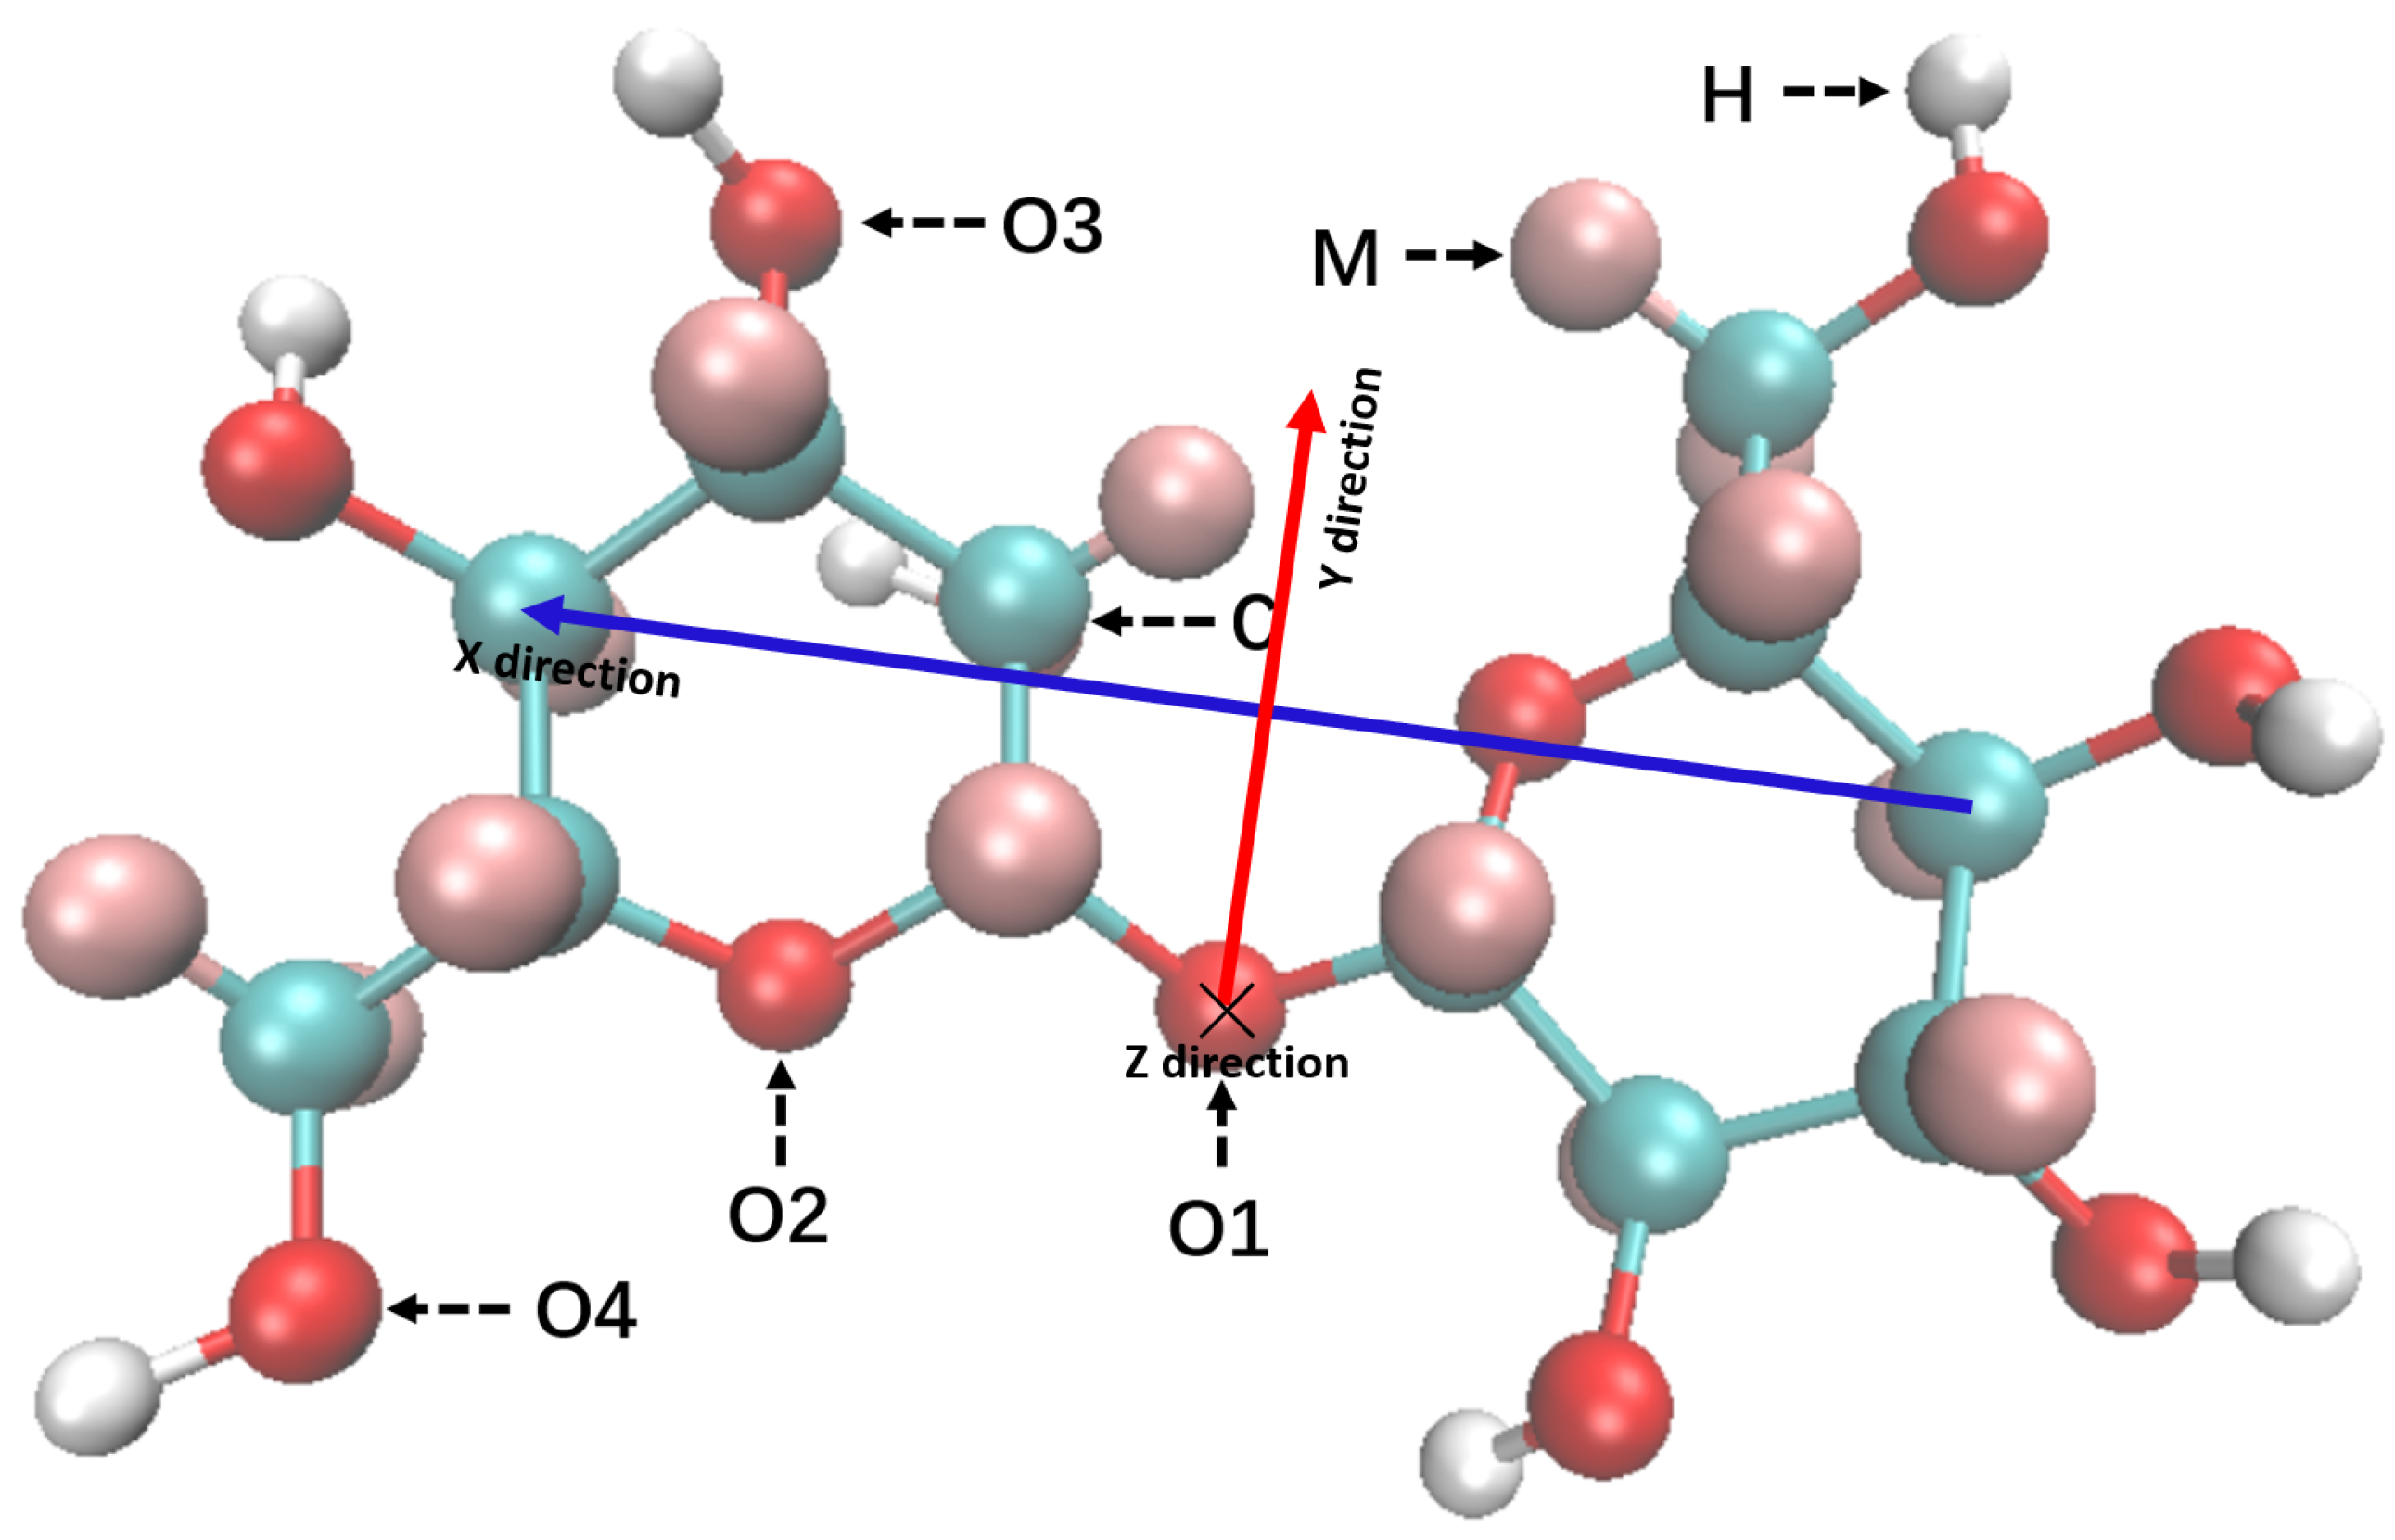
| Atom Label | NU | HU | C | O1 | O2 | O3 | O4 | H | M |
| e [KJ/mole] | 0.711 | 0.000 | 0.276 | 0.586 | 0.586 | 0.711 | 0.711 | 0.050 | 0.121 |
| σ [Å] | 3.250 | 0.000 | 3.500 | 3.100 | 2.900 | 3.100 | 3.100 | 1.700 | 1.700 |
| q [e] | −0.542 | 0.333 | 0.258 | −0.500 | −0.500 | −0.500 | −0.500 | 0.301 | 0.000 |
| Sample Labels | Li(K)OH | Urea | Trehalose | Water | Density (Atoms/Å3) |
|---|---|---|---|---|---|
| Li(K)TrH2O | 222 | 0 | 64 | 5716 | 0.106531 (Li) 0.103323 (K) |
| Li(K)TrUrH2O | 222 | 254 | 64 | 5716 | 0.106405 (Li) 0.103437 (K) |
Publisher’s Note: MDPI stays neutral with regard to jurisdictional claims in published maps and institutional affiliations. |
© 2022 by the authors. Licensee MDPI, Basel, Switzerland. This article is an open access article distributed under the terms and conditions of the Creative Commons Attribution (CC BY) license (https://creativecommons.org/licenses/by/4.0/).
Share and Cite
Ma, C.; Zuo, T.; Han, Z.; Li, Y.; Gärtner, S.; Chen, H.; Yin, W.; Han, C.C.; Cheng, H. Neutron Total Scattering Investigation of the Dissolution Mechanism of Trehalose in Alkali/Urea Aqueous Solution. Molecules 2022, 27, 3395. https://doi.org/10.3390/molecules27113395
Ma C, Zuo T, Han Z, Li Y, Gärtner S, Chen H, Yin W, Han CC, Cheng H. Neutron Total Scattering Investigation of the Dissolution Mechanism of Trehalose in Alkali/Urea Aqueous Solution. Molecules. 2022; 27(11):3395. https://doi.org/10.3390/molecules27113395
Chicago/Turabian StyleMa, Changli, Taisen Zuo, Zehua Han, Yuqing Li, Sabrina Gärtner, Huaican Chen, Wen Yin, Charles C. Han, and He Cheng. 2022. "Neutron Total Scattering Investigation of the Dissolution Mechanism of Trehalose in Alkali/Urea Aqueous Solution" Molecules 27, no. 11: 3395. https://doi.org/10.3390/molecules27113395
APA StyleMa, C., Zuo, T., Han, Z., Li, Y., Gärtner, S., Chen, H., Yin, W., Han, C. C., & Cheng, H. (2022). Neutron Total Scattering Investigation of the Dissolution Mechanism of Trehalose in Alkali/Urea Aqueous Solution. Molecules, 27(11), 3395. https://doi.org/10.3390/molecules27113395