1. Introduction
A number of data collected over the last few decades define the ischemic
penumbra as a critical region identified by magnetic resonance imaging (MRI). This region represents the border between ischemia-induced frank cell loss (ischemic core) and healthy brain tissue. Thus, the
area penumbra corresponds to a peri-infarct region [
1,
2,
3]. Within the
area penumbra, the nervous matter, mainly neurons, are on the edge concerning cell viability. In fact, within this area cells undergo either delayed, post-ischemic cell death or recovery, depending on which ongoing pharmacological and/or physiological event is taking place [
4]. In recent decades, the
area penumbra was intensely studied in an effort to improve post-ischemic maturation phenomena [
4]. At the biochemical level, the
area penumbra carries a defect of mitochondrial oxidative metabolism. In pre-clinical studies, the
area penumbra is routinely identified as a region overexpressing the chaperone Heat Shock Protein 70 (HSP70) [
5,
6,
7]. Within the
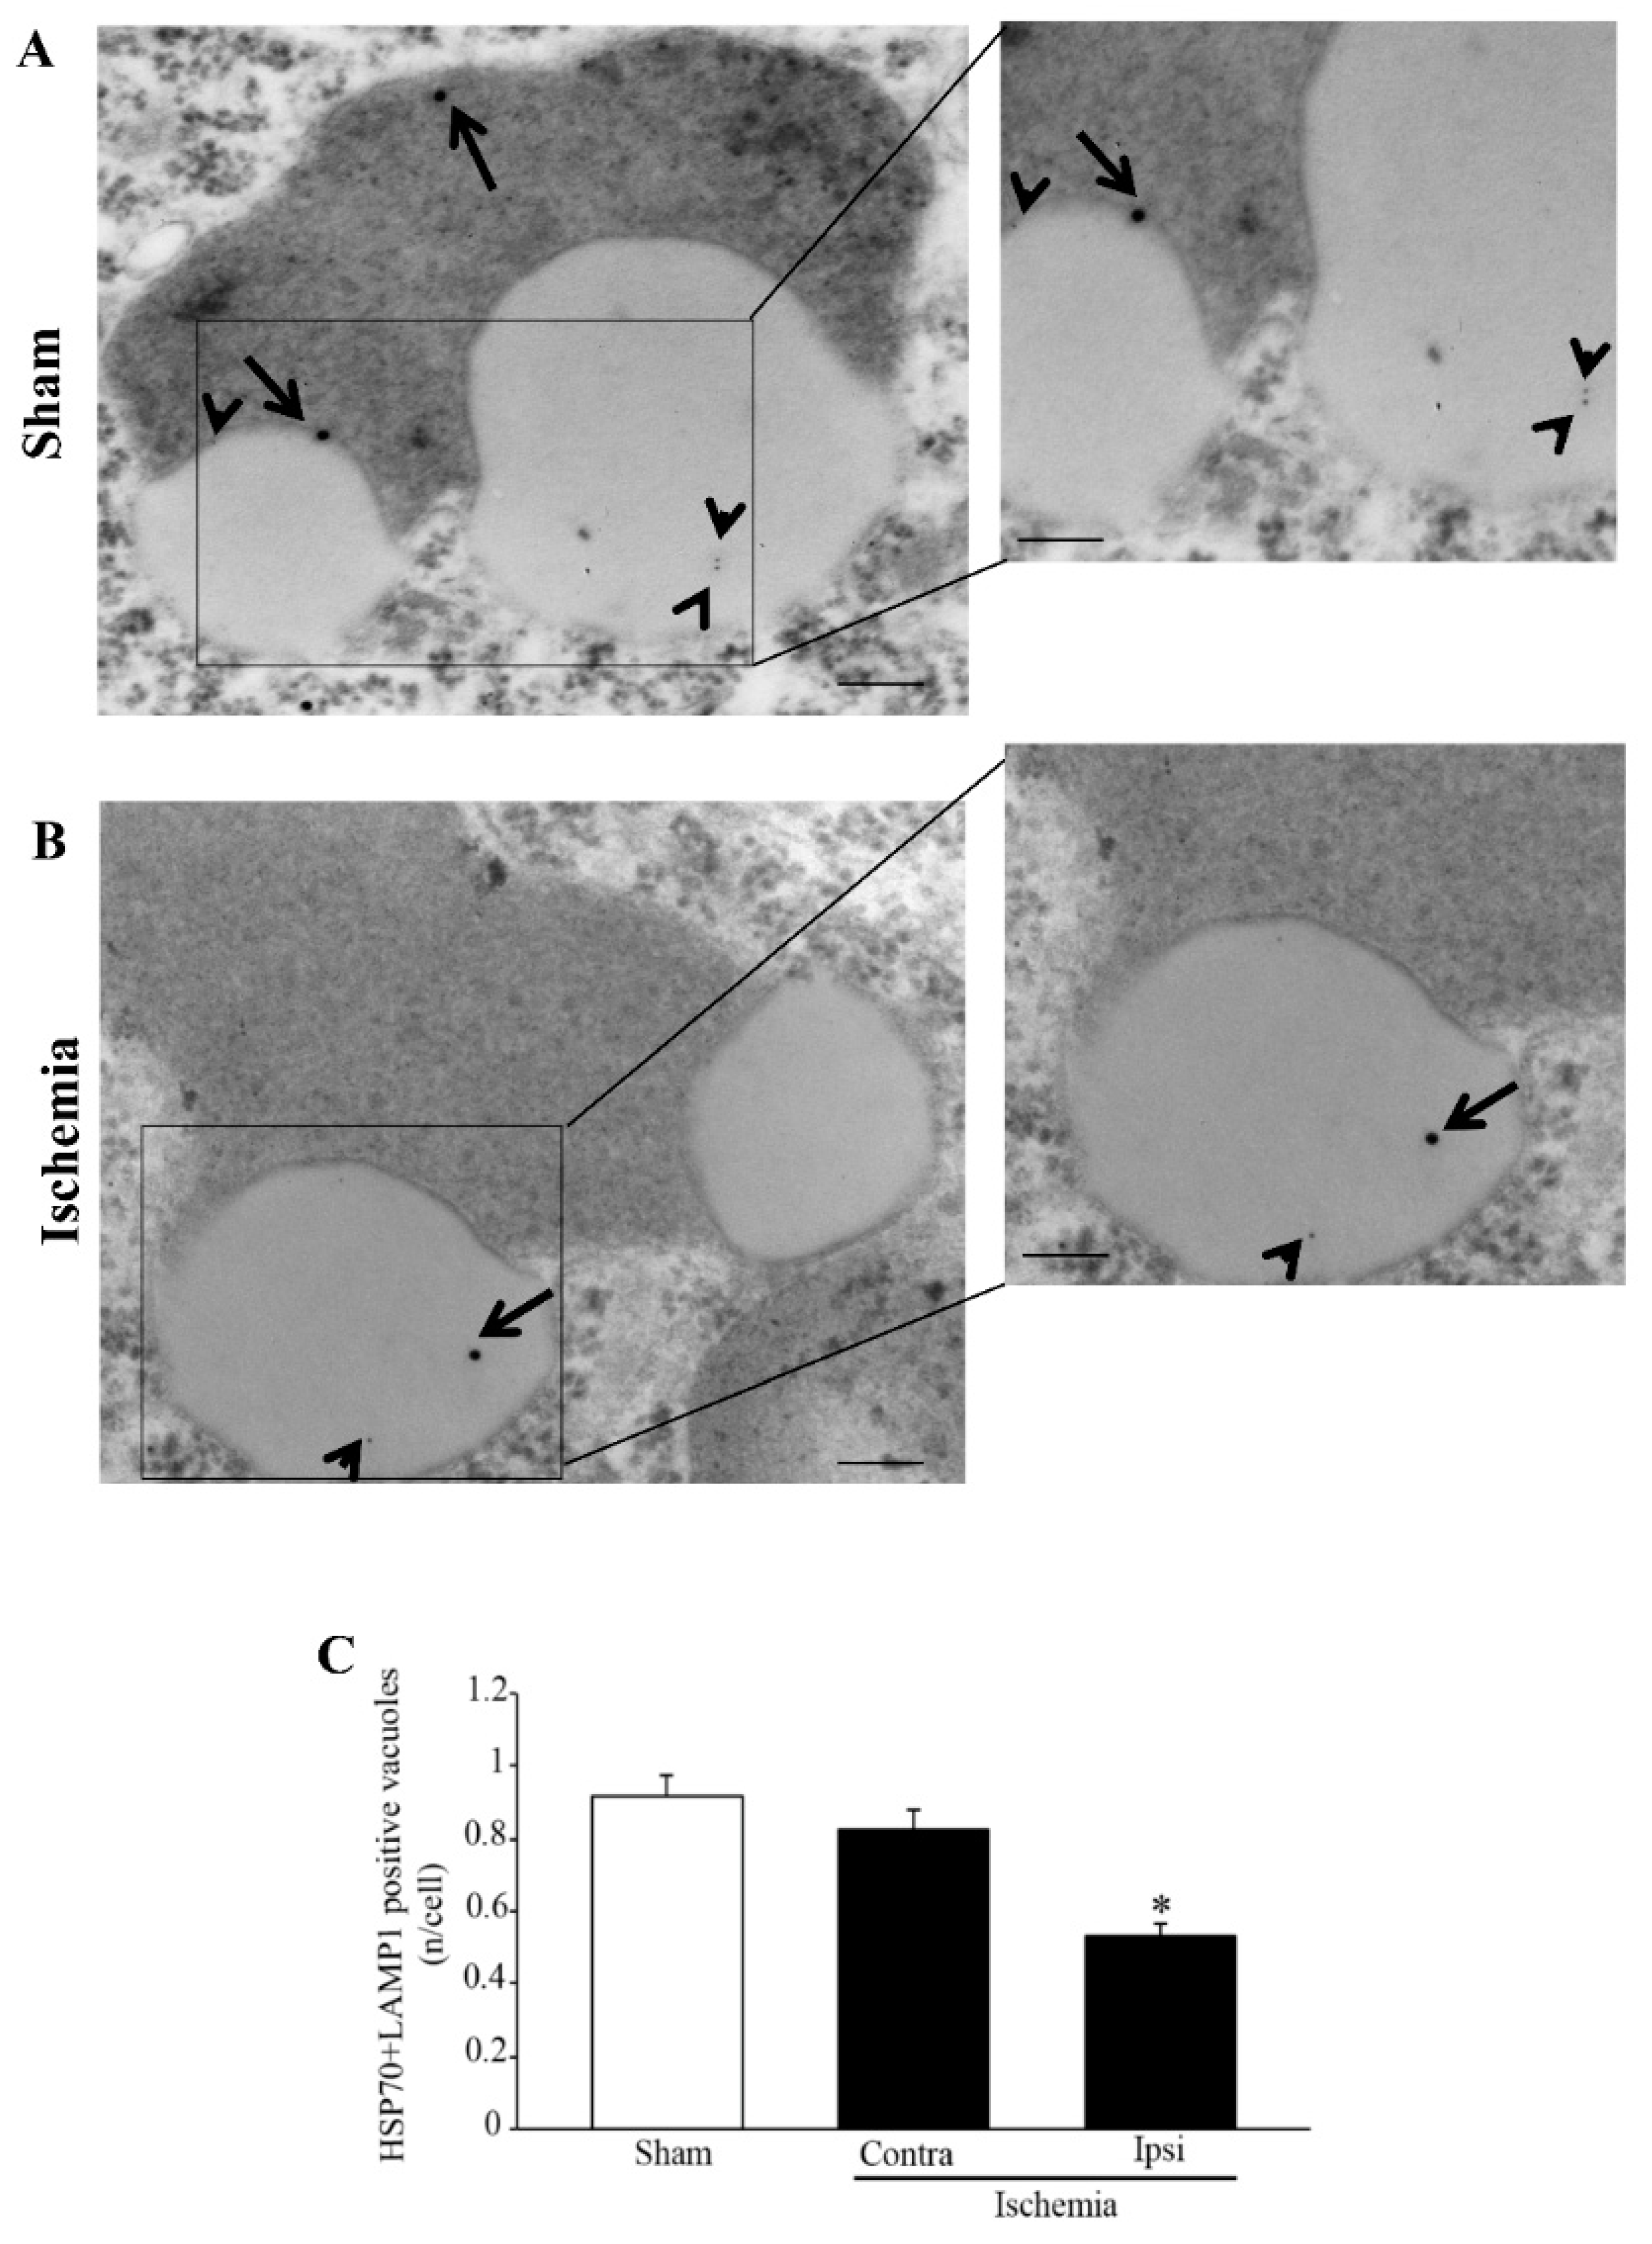
area penumbra neurons, the amount of HSP70 increases in the whole cell, although its presence within vacuoles is reduced (
Figure 1 and
Figure 2) [
3].
Recent studies indicate that, within the
area penumbra, autophagy-related proteins are consistently overexpressed [
2,
8,
9,
10]. This increase is best described for the autophagy protein microtubule-associated protein I/II-Light Chain 3 (LC3). The significance of such an overexpression is reported to be either deleterious [
11] or protective [
12,
13]. In fact, the role of autophagy-related proteins remains under debate [
14]. The increase in the autophagy-related protein LC3 was established in the elegant studies by the Rami’s team [
8,
9,
10]. This indicates that LC3 may be considered as a marker of the
area penumbra as much as HSP70. However, no study so far compared, in the same experimental settings, the increase in LC3 in combination with HSP70.
Therefore, the present study analyzes the co-expression of HSP70 and LC3 within the penumbra region, its cells and its specific cell compartments. This is carried out following persistent ischemia, which was experimentally produced by occluding the distal middle cerebral artery (MCAO). To measure concomitant expression of HSP70 and LC3, immunofluorescence was joined with stoichiometric measurements of each molecule by transmission electron microscopy (TEM). The measurement of sub-cellular placement of LC3 in combination with the marker HSP70 allows us to establish whether these proteins share similar sub-cellular compartments, where they may synergize. In this effort, autophagy vacuoles need to be primarily analyzed. In fact, previous studies show that up-regulation of cytosol LC3 within ischemic penumbra copes with a failure of LC3 to merge with lysosomal compartment [
15]. This was originally attributed to stagnant autophagosomes, which may accumulate in excess compared with the ability of lysosomes to clear these vacuoles [
8]. In the present study, the merging of both HSP70 and LC3 with the lysosomal-associated membrane protein 1 (LAMP1) and cathepsin-D is analyzed (
Figure 1 and
Figure 2). This allows us to establish whether an excess of autophagosomes does occur in the
area penumbra. Similarly, the occurrence of lysosome-specific markers was analyzed. This allows us to establish whether a primary failure of both autophagosome- and lysosome-competent proteins occurs. This is questioned by scoring immunofluorescence at light microscopy and by counting each authentic molecule in situ, within its specific organelle. Again, the merging between markers specific for autophagosomes and lysosomes allows us to answer the question as to whether merging between these compartments is altered. Moreover, assessing the placement of HSP70 within autophagosome and its merging with lysosome extends our vision about specific roles played by HSP70 as a chaperone within specific compartments of ischemic neurons. In fact, the merging of LC3 and HSP70 with LAMP1 and cathepsin-D indicates a potential common fate of these molecules, which mark the
area penumbra.
3. Discussion
The
area penumbra corresponds to the slightly ischemic, peri-infarct area of the nervous matter, which expresses intensely the chaperone protein HSP70. In fact, this molecule is the classic marker of the region and it overlaps reliably with MRI-defined “
area penumbra” [
5]. Thus, HSP70 immuno-staining is routinely employed, in pre-clinical research to identify the
area penumbra.
Recently, the staining of such an ischemic brain region has been implemented with other markers. Among these, proteins belonging to the autophagy machinery [
8,
9,
10,
16,
17,
18,
19,
20]. In fact, autophagy-related proteins increase within the
area penumbra [
8,
9,
10,
14,
21]. In the ischemic region, autophagy proteins appear to be consistently increased in various experimental models, despite the fact that their deleterious [
11] or protective [
12] effects are under debate [
14]. Among these autophagy proteins, LC3 increases within the
area penumbra as much as HSP70. Nonetheless, to our knowledge, no study so far has analyzed the co-expression of the classic marker HSP70 along with LC3 ex vivo or in vivo within the same brain area.
In the present study, such an investigation was carried out by using a model of permanent occlusion of MCA [
22]. Within this
area penumbra, the autophagy protein LC3 was analyzed and quantified concomitantly with HSP70. In the first part of the study, evidence is provided that zonal, neuronal and subcellular placement of LC3 within the
area penumbra mimics that measured for HSP70. This provides the first demonstration that LC3 increases in the very same zones of the ischemic cerebral cortex marked as the
area penumbra by HSP70. The increase in these molecules is very similar, both concerning cortical zones and specific cells. In fact, the cells expressing HSP70 all merge with LC3-positive cells within the
area penumbra. Co-expression of these molecules occurs in the very same neurons as confirmed by immuno-ultrastructural stoichiometry. Again, a remarkable overlapping occurs for LC3 and HSP70 concerning the subcellular compartments. In fact, in the control tissue, HSP70 preferentially localizes within LC3-positive autophagy vacuoles. Within the
area penumbra, ischemia produces a shifting in the compartmentalization of both HSP70 and LC3 from vacuoles to cytosol. Within the same neurons, both HSP70 and LC3 molecules, while decreasing in the vacuoles, increase massively in the cytosol and the whole cell. The powerful vision provided by ultrastructural morphometry indicates that, within the
area penumbra, LC3 (as well as HSP70) does not increase within neuronal vacuoles. It is rather the opposite, since the vacuolar placement of LC3 (as well as HSP70) is drastically reduced. Thus, the increase in LC3 (and HSP70) in the whole cell occurs within cytosol only, where LC3 may aggregate to produce hot fluorescent spots which had been interpreted as big stagnant autophagy vacuoles. The present study rules out an overexpression of LC3-immuno-positive vacuoles within
area penumbra neurons. These findings strongly challenge the hypothesis, based on light microscopy, that within the
area penumbra an excess of stagnant autophagosomes occurs, since here LC3-positive vacuoles are markedly reduced within the
area penumbra.
The increase in LC3-positive hot spots is likely dependent on the clustering of LC3 in the cytosol, which may generate spots of immunofluorescence within ischemic penumbra contrasting with the mild fluorescence of controls. The hypothesis that LC3 fluorescent spots in
area penumbra neurons may not correspond to autophagy vacuoles was already formulated [
8,
10,
15]. In the present manuscript, we provide actual evidence witnessing a decrease in LC3-positive autophagosomes and a decrease in the amount of LC3 molecules within each autophagosome. Based on these findings, it is unlikely that enhanced autophagy may occur in the
area penumbra compared with the control tissue. In fact, LC3 increases in the cell but it is massively reduced in the vacuoles, where it is needed to induce autophagy clearance. Similarly, the present findings lead to the re-interpretation of previous data based on TEM observations of giant autophagy-like vacuoles [
23,
24,
25]. In fact, big vacuoles occur but without LC3 particles. Since LC3-positive autophagy vacuoles are rather decreased within the
area penumbra, the spots of LC3 immunofluorescence may be due to cytosolic non-vacuolar LC3 protein aggregates [
26,
27]. In fact, in the present study, a considerable increase in cytosolic LC3 is confirmed.
A major finding of the present study concerns the merging of LC3 and HSP70 immuno-staining concerning zonal, cellular and sub-cellular compartments. In fact, the very same cortical zones and neurons increase the staining for both antigens. Since the expression of HSP70 within the
area penumbra is considered to be protective [
28,
29], this suggests analogous protective effects of LC3. In fact, despite contradictory findings, a number of studies suggest that promoting LC3 expression and compartmentalization protects neurons of the
area penumbra [
13]. Similarly, it would be important to analyze whether increased protection induced by the overexpression of HSP70 relies on its placement within autophagosomes, rather than whole cell amount. This way, considering that HSP70 is compartmentalized within LC3-positive autophagy vacuoles may lead to the reconsideration of the role of this chaperone protein as key component of the autophagy machinery. In fact, HSP70 exerts powerful protection against oxidative species generated during ischemia. The present data indicate that combining both antigens may provide a more sensitive marker to detect
area penumbra cells. The sole morphological evidence of a remarkable merging between HSP70 and LC3 within the
area penumbra neurons needs to be implemented by functional data to explore whether a synergism takes place.
A key point to interpret the autophagy status in the
area penumbra consists of establishing the fate/progression of LC3-positive autophagy vacuoles. Similarly, due to the co-localization of HSP70, an additional question concerns the fate of HSP70-positive vacuoles. The merging of autophagosomes with lysosomes is key to understand the cell clearance. Zhang et al. (2021) [
15] postulated that increased expression of autophagy markers (believed to be generated by increased autophagosomes) may engulf the lysosomal compartment, thereby producing a paradox defect in autophagolysosomal degradation [
15]. The present study instead indicates a combined failure of both autophagosome and lysosome compartments. In fact, autophagy vacuoles are diminished and their content in LC3 is decreased. Similarly, the lysosome compartment is depleted of LAMP1. Even cathepsin-D, which is increased in the cell, it is suppressed in the vacuoles. The present finding may be in line with further observation of Zhang et al. (2021) [
15], who indeed noticed that, during ischemia, a lysosomal dysfunction is evident by a specific lysosomal alteration.
These findings indicate the lysosomal compartment as a kernel to solve the issue.
In fact, in the second part of the present study, evidence is provided which shows that both LC3 and HSP70 within
area penumbra neurons fail to merge with cathepsin-D- or LAMP1-positive vacuoles, which is consistent with the occurrence of a failure in the occurrence of autophagolysosomes. When specific stoichiometry for LAMP1 and cathepsin-D is carried out, a primary defect of both proteins is detected within vacuoles. These findings lead to the hypothesis that within the peri-infarct region a failure of the whole autophagolysosome machinery takes place. This depends on multiple phenomena which are reported in the scheme of
Figure 2A. At first, a defect of LC3 molecules within autophagosome occurs along with the dissipation of LC3 in the cytosol. This is accompanied by a decrease in LAMP1 and cathepsin-D within the vacuoles. The decrease in the merging between autophagy and lysosome proteins exceeds the defect of the specific proteins and vacuoles. This suggests an additional defect, which may be hypothesized consisting of a defective merging of autophagosomes with lysosomes, as postulated in the scheme of
Figure 2A.
Remarkably, in the present study, evidence emerges which entraps HSP70 in such a dysfunctional cell clearance within area penumbra neurons. In fact, in the area penumbra, the merging of vacuolar HSP70 within LAMP1-positive vacuoles is defective. The loss of such a synergism is likely to induce deleterious effects. In fact, the severe depletion of both lysosome and autophagosome is replicated by a loss of their chaperone (HSP70) component. This loss of compartmentalization may be in need to be rescued to improve neuronal survival following ischemia.
The present data provide direct evidence for a defective compartmentalization of chaperone, autophagy and lysosomal molecules, which could not be detected by using light microscopy alone. In fact, a confounding point, when assessing autophagosomes and lysosomes by light microscopy, is the potential bias of interpreting puncta as a witness of vacuoles. This applies to LC3 spots of immunofluorescence (as discussed above) as well as to the measurement of lysosomal proteins. In fact, this is also the case of the lysosome-associated membrane protein LAMP1 or lysosomal enzymes such as cathepsins. All these proteins may not necessarily occur site-specifically within autophagosome or lysosome compartments.
In fact, we measured that here, in ischemic conditions, the amount of both LC3 compartmentalized within autophagosome and cathepsin-D compartmentalized within lysosomes diminishes, while these proteins dramatically increase in the cytosol. In the case of cathepsin-D, this may lead to non-controlled digestion of cell substrates, which may produce autophagy-dependent cell death. Indeed, it is a loss of enzyme compartmentalization which generates the damage. The issue of preserved autophagosomes and lysosomes include the facet of compartmentalization of specific molecules. The loss of compartmentalization appears a key point. In fact, during ischemia a dissociation may occurs, where the increase in specific proteins does not cope with their placement within appropriate cell compartments. Instead, compartmentalization of molecular pathways is essential in providing appropriate activity. In ischemic cells, the LC3 and cathepsin-D level are increased, but their compartmentalization is suppressed (Schemes of
Figure 1 and
Figure 2A,B). This is also the case of LAMP1, which loses its vacuolar placement. In the present study, evidence is provided which shows that HSP70, which in the control neurons mimics the compartmentalization of LC3, is dissipated from autophagy vacuoles. Within the
area penumbra, HSP70 is no longer able to merge with lysosome proteins. The loss of interaction between these proteins, though selective protein and organelle degradation, is a massive impairment, which is required for cell clearing machinery to be effective. In line with this, specific studies are needed to address whether compounds, such as rapamycin which promotes LC3 vacuolar placement and protects against ischemia [
30], may also shift HSP70 and cathepsin-D within vacuoles and promote the merging of autophagosome and lysosome compartments.
4. Materials and Methods
4.1. Permanent Focal Ischemia in Mice
Adult C57BL/6 male mice (Charles River, Middlesex County, MA, USA) weighing 25 g were housed under controlled conditions (ambient temperature, 22 °C; humidity, 40%) on a 12 h light–dark cycle with food and water ad libitum. The experimental protocol was approved by the Ethical Committee of Neuromed Institute (Pozzilli, Italy) and further supervised by The Italian Ministry of Health (Authorization number 1194/2020-PR). Mice were anaesthetized with chloral hydrate (400 mg/kg, i.p.). An incision was made between the outer canthus of the eye and the external auditory meatus and the temporal muscle was bisected and retracted to expose the external temporal aspect of the skull to produce a small hole (0.5 mm
2) via drill-operated craniotomy; thus, MCA was identified and exposed using stereomicroscopy [
7,
31]. The deepest bone layer was preserved to avoid drill penetration through dura mater leading to the risk of cortical mechanical and/or thermal damage. In fact, such a layer is removed subsequently, through a careful manual procedure to reach out the distal MCA, which was occluded by electro-coagulation. After this procedure, the temporal muscle and overlying skin bands were sutured. Body temperature was monitored during surgery through a rectal probe, which was connected in feed-back to the surgery pad. This allows us to keep the body temperature steady at 37 °C. Sham-operated mice undergo the same procedure, but MCA cauterization. In fact, the terms “sham” or “sham-operated”, refer to those mice which undergo the surgical procedure aimed at producing ischemia. In these mice, all surgical steps were carried out but the occlusion of the middle cerebral artery (MCAO). This indicates that surgery was carried out without producing the occlusion of the middle cerebral artery. The group of sham mice is useful to compare the effects which purely depend on the ischemia (“ischemic mice”) and are not related with other steps in the surgical procedure (“sham” or “sham-operated mice”). Thus, comparisons between MCAO and sham-operated mice allows us to interpret all changes observed in the MCAO group as specifically induced by the occlusion of the middle cerebral artery.
All mice are sacrificed at 24 h following MCAO and brains are dissected for analysis.
4.2. Light Microscopy
Brains were immediately placed into a Carnoy’s fixing solution composed of ethyl alcohol (60%), acetic acid (10%) and chloroform (30%) for histochemistry and immunofluorescence. Twenty-four hours later, brains are placed in 70% ethanol to be wax-embedded. The brains were cut into 10 μm-thick coronal slices at microtome (Leica Microsystem, RM2125, Milan, Italy). Each slice was regularly spaced 550 µm. Slices were used for histochemical and immunofluorescence analysis.
For histochemical analysis, slices were de-waxed and processed for staining with thionin (a kind of Nissl staining) to frankly assess infarct and peri-infarct regions.
As shown in representative
Figure 3, the cortical peri-infarct area is evident following thionin staining as a region, where a sudden chromatic switch from the pale white frankly necrotic area to the blue normal Nissl-stained brain matter takes place. The cortical infarct area is well characterized as the pale region delimited by a dorsal and ventral peri-infarct area. Since the study focuses on the peri-infarct region as the presumed site of
area penumbra, the cortex being analyzed for morphology is restricted to the area delimited by the red squares of
Figure 3. Analogous regions were selected from the contralateral hemisphere and from corresponding cortical regions from sham-operated mice. Within these borderline regions, whole slices were cut for immunofluorescence; small fragments within these red squares were further dissected for electron microscopy and ultrastructural stoichiometry.
4.3. Immunofluorescence
Paraffin-embedded mouse brain sections (10 μm) were used for immunofluorescence, which was quantified by measuring the number of immunofluorescent cells from three slices per mouse (spaced 550 µm apart, N = 4 for each experimental group). Slices were obtained from the peri-infarct cortical regions to encompass the
area penumbra. Three serial coronal slices were selected from the ventral border at the middle of the rostro-caudal extent of the ischemic region (ranging from bregma +1.94 mm back to bregma +0.14 mm). These specimens were used for staining with rabbit polyclonal anti-LC3B (Santa Cruz Biotechnology, Dallas, TX, USA), monoclonal mouse anti-LAMP1 (Genetex, Irvine, CA, USA) and monoclonal rabbit anti-HSP70 or monoclonal mouse anti-HSP70 (Thermo Fisher Scientific, Waltham, MA, USA and Abcam, Cambridge, UK, respectively). Slices were treated with normal sera for 1 h (10% in TBS). Then, they were incubated overnight (4 °C) with primary antibody anti-LAMP1, anti-HSP70 and anti-LC3B (for details see
Table 1) and then for 1 h with secondary AlexaFluor 488/CY3-coupled anti-mouse or anti-rabbit IgG (for detail see
Table 1). Control staining was performed without primary antibodies.
Immunofluorescence was assessed considering the ratio between positive cells and the background fluorescence measured in the corpus callosum by using a Zeiss AxioPhot2 microscope equipped with a digital video camera. Images were acquired at low magnification (10×). Results are given as percentage of the mean ± S.E.M. of 12 values for each group (n = 3 slices × N = 4 mice). Unpaired, two-tailed T-test was used for statistical comparison of collected data. Hypothesis H0 (μ1 = μ2) was rejected when p ≤ 0.05.
4.4. Transmission Electron Microscopy
Blocks from the cerebral cortex (1 mm × 1.3 mm × 1 mm) were dissected from the ipsilateral and contralateral cortex from ischemic mice (N = 6) and from both hemispheres from sham-operated mice (N = 6). From each side of each mouse, both the ventral border (Figures in the body of the text) and the dorsal border (
Supplementary Figures) of the peri-infarct area were analyzed. Therefore, the number of areas in the site of the
area penumbra corresponds to 2 (dorsal and ventral) ipsilateral for each mouse (N = 6) undergoing ischemia for a total of 6 × 2 = 12
area penumbra. Similarly, 12 corresponding regions were analyzed from the contralateral side of the same mice, which brings the number of regions from ischemic mice to 24. In addition, since 6 sham-operated mice were used, each one carrying a bilateral dorsal and ventral region, a total of 24 regions were also examined in sham-operated mice. This corresponds to 48 regions owing the very same placement, which were counted from ischemic and sham-operated mice. Corresponding regions from the two hemispheres of sham-operated mice were overlapping concerning all measurements (pilot experiments). This allowed us to pool left and right specimens from sham-operated mice in a total of 6 ventral and 6 dorsal areas to homogenize the number of specimens from each group.
In fact, the use of sham-operated mice in addition to the contralateral (non-ischemic side) works as an additional control to rule out systemic and widespread compensatory changes altering protein expression (LC3, HSP70, cathepsin-D and LAMP1) all over the brain following focal ischemia. In fact, this may indirectly influence the contralateral hemisphere through systemic effects or widespread subcortical compensatory innervation. When such a phenomenon occurs, even slightly, on the contralateral side, this may reduce the analytical power of measuring ischemia-induced antigen expression compared with the control tissue.
For TEM analysis, tissue samples were fixed in a solution containing paraformaldehyde 2.0%, and glutaraldehyde 0.1%, in 0.1 M PBS, pH 7.4. Then, specimens were dissected and immersed in the same solution overnight at 4 °C. After washing in PBS (0.1 M), samples were post-fixed in 1% osmium tetroxide (OsO4) for 1 h at 4 °C.
Tissue blocks were dehydrated in a serial gradient of ethanol solutions (30%, 50%, 70%, 90% and 95% for 5 min, and 100% for 60 min) to be embedded in epoxy resin. The concentration of the fixing and post-fixing solutions along with the use of the epoxy embedding resin were validated in previous studies using immuno-gold at ultrastructural morphometry [
32,
33]. In fact, the combination of aldehydes, OsO
4, and epoxy resin allows a minimal epitope covering while preserving sub-cellular architecture [
34,
35,
36]. This way, small sub-cellular structures such as vacuoles were still evident, steady and electron dense (
Figure 2).
Ultra-thin slices were used both for plain and post-embedding immuno-gold electron microscopy. Ultra-thin slices were stained with uranyl acetate and lead citrate to be visualized at a Jeol JEM SX100 electron-microscope (Jeol, Tokyo, Japan). Before cutting ultra-thin sections at ultra-microtome, semi-thin slices were carried out from blocks embedded in epoxy resin by using the same ultra-microtome, which was set at a width of 700 nm per slice. This was carried out in order to orient the ultra-structural scanning of the area penumbra and allowing the identification of specific cell types to be analyzed at TEM.
4.5. Post-Embedding Immuno-Gold Microscopy
Ultra-thin sections, width = 90 nm, collected on nickel grids were processed for proteins detection by using primary antibodies detailed in
Table 1. This experimental setting allows us to detect detailed morphometry of organelles, where membranes appear as sharply contrasting, while detecting immuno-gold particles to mark specific proteins. This way, the protein amount within specific cell compartments, such as vacuoles, cytosol and mitochondria, could be counted. When the distribution of LC3 and HSP70 was measured within the same vacuoles, the distance between LC3 and HSP70 molecules was calculated in co-stained vacuoles. The various distances of co-localization were considered and a normal distribution was assessed for 95% of distances. In this context, no specific grouping of different molecules at close or remote distance could be detected. In contrast, the LC3 molecule is placed according to a group pattern, which is compatible with LC3 aggregates.
Ultra-thin slices were layered on droplets of aqueous sodium metaperiodate (NaIO
4) for 30 min at 22 °C to remove OsO
4 for protein unmasking, while keeping optimal preservation of cell ultrastructure [
35]. After rinsing in PBS, grids were exposed to drops of blocking solution (10% goat serum and 0.2% saponin in PBS) for 20 min at 22 °C. Grids were incubated in a humidified chamber overnight at 4 °C with either single or combined primary antibodies (rabbit polyclonal anti-LC3, Abcam; mouse monoclonal anti-HSP70, Abcam; mouse monoclonal anti-cathepsin-D, Sigma Aldrich, Milan, Italy; or mouse monoclonal anti-LAMP1, Abcam) in ice-cold PBS solution containing 1% goat serum and 0.2% saponin. After washing in cold PBS, ultra-thin slices were incubated with gold-conjugated secondary antibodies (both 10 nm and 20 nm immuno-gold particles, when double-staining was carried out). Antibodies were diluted 1:20 within a blocking buffer (containing 1% goat serum and 0.2% saponin in PBS) for 1 h at 22 °C. Counts of immuno-gold particles (10 nm and 20 nm) were carried out by using a low magnification (8000×), still allowing immuno-gold particles to be counted and whole cell organelles to be identified [
37,
38]. To count immuno-gold particles in cortical cells, measurements started from the corner of a grid square to proceed by scanning the whole grid square [
39]. In the present study, the number of immuno-gold particles was counted for each primary antibody within the cytoplasm and within the vacuoles for each neuron (as visualized in
Figure 2).
A total of 20 cortical neurons were counted from each region from each mouse (N = 6), leading to 120 cells for each region per group.
4.6. Statistical Analysis
Immunofluorescent cells (number/mm2) were counted from brain slices stained with LC3 and/or HSP70, LC3 and/or LAMP1 and LAMP1 and/or HPS70. Slices spaced 550 µm apart were calculated for each region (area penumbra or homologous regions from sham-operated mice). Three slices were counted for each animal. Values for neuronal density (number of neurons/mm2) were calculated within an area of 82,500 μm2. Results are given as percentage of positive cells compared with the control (sham-operated mice). Results are given as percentage of the mean ± S.E.M per group. Inferential statistics to compare groups was carried out by using a Student’s t-test (H0, null hypothesis, was rejected when p ≤ 0.05).
For electron microscopy, the assessment of vacuoles and measurement of immuno-gold particles within vacuoles and cytosol was carried out according to Lenzi et al. (2016) [
34]. For ultrastructural stoichiometry, the following items were counted: (i) number of unstained vacuoles within cytosol; (ii) number of LC3, HSP70, cathepsin-D and LAMP1, immuno-gold particles within cytosol; (iii) number of LC3, HSP70, cathepsin-D and LAMP1 immuno-gold particles within each vacuole per cell; and (iv) number of vacuoles where co-localization occurs for: (i) LC3 and HSP70, (ii) LC3 and cathepsin-D, (iii) LC3 and LAMP1 and (iv) HSP70 and LAMP1. Ultrastructural morphometry was also used to calculate the ratio between the measurements reported above. This was expressed as follows: (i) the ratio between LC3 immuno-gold particles within vacuoles and cytosolic LC3 immuno-gold particles; (ii) the ratio between HSP70 immuno-gold particles within vacuoles and HSP70 immuno-gold particles within cytosol; (iii) the ratio between cathepsin-D immuno-gold particles within vacuoles and cathepsin-D immuno-gold particles within cytosol; and (iv) the ratio between LAMP1 immuno-gold particles within vacuoles and LAMP1 immuno-gold particles within cytosol.
Each count was carried out by two blind observers. Data are given as the mean ± S.E.M.
Data were compared by using one-way ANOVA with Fisher’s Test. Null Hypothesis (H0) was rejected when p ≤ 0.05.


 ,
, 


