
Predictive Multi Experiment Approach for the Determination of Conjugated Phenolic Compounds in Vegetal Matrices by Means of LC-MS/MS

 , , ,
, , ,  and
and 
Abstract
:
1. Introduction
2. Results
2.1. Targeted Analysis
2.1.1. Green Coffee Sample
2.1.2. Saffron Sample
2.1.3. Hop Sample
2.2. Semi-Untargeted Analysis
2.2.1. Green Coffee
2.2.2. Saffron
2.2.3. Hop
3. Discussion
3.1. HPLC-MS/MS Method Development
3.2. Polyphenols Identification
4. Materials and Methods
4.1. Chemicals
4.2. Sample Preparation (Extraction)
4.3. SPE Extraction
4.4. HPLC–MS/MS Analysis
5. Conclusions
Author Contributions
Funding
Institutional Review Board Statement
Informed Consent Statement
Data Availability Statement
Conflicts of Interest
Sample Availability
References
- D’Archivio, M.; Filesi, C.; Di Benedetto, R.; Gargiulo, R.; Giovannini, C.; Masella, R. Polyphenols, dietary sources and bioavailability. Ann. Ist. Super. Sanita 2007, 43, 348–361. [Google Scholar] [PubMed]
- Zhang, H.; Tsao, R. Dietary polyphenols, oxidative stress and antioxidant and anti-inflammatory effects. Curr. Opin. Food Sci. 2016, 8, 33–42. [Google Scholar] [CrossRef]
- Basli, A.; Belkacem, N.; Amrani, I. Health benefits of phenolic compounds against cancers. In Phenolic Compounds—Biological Activity; IntechOpen: London, UK, 2017. [Google Scholar]
- Giada, M.D.L.R. Food phenolic compounds: Main classes, sources and their antioxidant power. In Oxidative Stress and Chronic Degenerative Diseases: A Role for Antioxidants; Books on Demand: Norderstedt, Germany, 2013. [Google Scholar] [CrossRef] [Green Version]
- Nakamura, K.; Nakajima, T.; Aoyama, T.; Okitsu, S.; Koyama, M. One-pot esterification and amidation of phenolic acids. Tetrahedron 2014, 70, 8097–8107. [Google Scholar] [CrossRef] [Green Version]
- Del Rio, D.; Rodriguez-Mateos, A.; Spencer, J.P.E.; Tognolini, M.; Borges, G.; Crozier, A. Dietary (Poly)phenolics in human health: Structures, bioavailability, and evidence of protective effects against chronic diseases. Antioxid. Redox Signal. 2013, 18, 1818–1892. [Google Scholar] [CrossRef] [Green Version]
- Kesavan, P.; Banerjee, A.; Banerjee, A.; Murugesan, R.; Marotta, F.; Pathak, S. An Overview of Dietary Polyphenols and Their Therapeutic Effects, 2nd ed.; Elsevier Inc.: Amsterdam, The Netherlands, 2018; ISBN 9780128130063. [Google Scholar]
- Xiao, J.; Muzashvili, T.S.; Georgiev, M. Advances in the biotechnological glycosylation of valuable flavonoids. Biotechnol. Adv. 2014, 32, 1145–1156. [Google Scholar] [CrossRef]
- Qin, Y.; Gao, B.; Shi, H.; Cao, J.; Yin, C.; Lu, W.; Yu, L.; Cheng, Z. Characterization of flavonol mono-, di-, tri- and tetra-O-glycosides by ultra-performance liquid chromatography-electrospray ionization-quadrupole time-of-flight mass spectrometry and its application for identification of flavonol glycosides in Viola tianschanica. J. Pharm. Biomed. Anal. 2017, 142, 113–124. [Google Scholar] [CrossRef]
- Li, A.-N.; Li, S.; Zhang, Y.-J.; Xu, X.-R.; Chen, Y.-M.; Li, H.-B. Resources and biological activities of natural polyphenols. Nutrients 2014, 6, 6020–6047. [Google Scholar] [CrossRef]
- Motilva, M.-J.; Serra, A.; Macià, A. Analysis of food polyphenols by ultra high-performance liquid chromatography coupled to mass spectrometry: An overview. J. Chromatogr. A 2013, 1292, 66–82. [Google Scholar] [CrossRef]
- Tohma, H.; Köksal, E.; Kılıç, Ö.; Alan, Y.; Yılmaz, M.A.; Gülçin, İ.; Bursal, E.; Alwasel, S.H. RP-HPLC/MS/MS analysis of the phenolic compounds, antioxidant and antimicrobial activities of Salvia L. species. Antioxidants 2016, 5, 38. [Google Scholar] [CrossRef] [Green Version]
- Simeoni, M.C.; Pellegrini, M.; Sergi, M.; Pittia, P.; Ricci, A.; Compagnone, D. Analysis of polyphenols in the Lamiaceae family by matrix solid-phase dispersion extraction followed by ultra-high-performance liquid chromatography–tandem mass spectrometry determination. ACS Omega 2018, 3, 17610–17616. [Google Scholar] [CrossRef]
- López-Fernández, O.; Domínguez, R.; Pateiro, M.; Munekata, P.E.; Rocchetti, G.; Lorenzo, J.M. Determination of polyphenols using liquid chromatography–tandem mass spectrometry technique (LC–MS/MS): A review. Antioxidants 2020, 9, 479. [Google Scholar] [CrossRef]
- Santarsiero, A.; Onzo, A.; Pascale, R.; Acquavia, M.A.; Coviello, M.; Convertini, P.; Todisco, S.; Marsico, M.; Pifano, C.; Iannece, P.; et al. Pistacia lentiscus hydrosol: Untargeted metabolomic analysis and anti-inflammatory activity mediated by NF-κB and the citrate pathway. Oxid. Med. Cell. Longev. 2020, 2020, 479. [Google Scholar] [CrossRef]
- Dars, A.G.; Hu, K.; Liu, Q.; Abbas, A.; Xie, B.; Sun, Z. Effect of thermo-sonication and ultra-high pressure on the quality and phenolic profile of mango juice. Foods 2019, 8, 298. [Google Scholar] [CrossRef] [Green Version]
- Vivas, D.B.; Álvarez-Rivera, G.; Ibáñez, E.; Parada-Alfonso, F.; Cifuentes, A. A multi-analytical platform based on pressurized-liquid extraction, in vitro assays and liquid chromatography/gas chromatography coupled to high resolution mass spectrometry for food by-products valorisation. Part 2: Characterization of bioactive compounds from goldenberry (Physalis peruviana L.) calyx extracts using hyphenated techniques. J. Chromatogr. A 2019, 1584, 144–154. [Google Scholar] [CrossRef]
- Lucci, P.; Saurina, J.; Nuñez, O. Trends in LC-MS and LC-HRMS analysis and characterization of polyphenols in food. TrAC Trends Anal. Chem. 2017, 88, 1–24. [Google Scholar] [CrossRef] [Green Version]
- Aydoğan, C. Recent advances and applications in LC-HRMS for food and plant natural products: A critical review. Anal. Bioanal. Chem. 2020, 412, 1973–1991. [Google Scholar] [CrossRef]
- Marinas, M.; Sa, E.; Rojas, M.M.; Moalem, M.; Urbano, F.J.; Guillou, C.; Rallo, L. A Nuclear magnetic resonance (1 H and 13 C) and isotope ratio mass spectrometry (d 13 C, d 2 H and d 18 O) study of Andalusian olive oils. Rapid Commun. Mass Spectrom. 2010, 24, 1457–1466. [Google Scholar] [CrossRef]
- Steimer, S.; Sjöberg, P.J.R. Anthocyanin characterization utilizing liquid chromatography combined with advanced mass spectrometric detection. J. Agric. Food Chem. 2011, 59, 2988–2996. [Google Scholar] [CrossRef]
- Lopes-Lutz, D.; Dettmann, J.; Nimalaratne, C.; Schieber, A. Characterization and quantification of polyphenols in Amazon grape (Pourouma cecropiifolia Martius). Molecules 2010, 15, 8543–8552. [Google Scholar] [CrossRef]
- Sun, L.; Tao, S.; Zhang, S. Characterization and quantification of polyphenols and triterpenoids in thinned young fruits of ten pear varieties by UPLC-Q TRAP-MS/MS. Molecules 2019, 24, 159. [Google Scholar] [CrossRef] [Green Version]
- Gillmeister, M.; Ballert, S.; Raschke, A.; Geistlinger, J.; Kabrodt, K.; Baltruschat, H.; Deising, H.B.; Schellenberg, I. Polyphenols from Rheum roots inhibit growth of fungal and oomycete phytopathogens and induce plant disease resistance. Plant Dis. 2019, 103, 1674–1684. [Google Scholar] [CrossRef]
- Li, M.; Si, D.; Fu, Z.; Sang, M.; Zhang, Z.; Liu, E.; Yang, W.; Gao, X.; Han, L. Enhanced identification of the in vivo metabolites of Ecliptae Herba in rat plasma by integrating untargeted data-dependent MS2 and predictive multiple reaction monitoring-information dependent acquisition-enhanced product ion scan. J. Chromatogr. B Anal. Biomed. Life Sci. 2019, 1109, 99–111. [Google Scholar] [CrossRef]
- Yan, Z.; Lin, G.; Ye, Y.; Wang, Y.; Yan, R. A generic multiple reaction monitoring based approach for plant flavonoids profiling using a triple quadrupole linear ion trap mass spectrometry. J. Am. Soc. Mass Spectrom. 2014, 25, 955–965. [Google Scholar] [CrossRef]
- Jilani, H.; Cilla, A.; Barberá, R.; Hamdi, M. Improved bioaccessibility and antioxidant capacity of olive leaf (Olea europaea L.) polyphenols through biosorption on Saccharomyces cerevisiae. Ind. Crop. Prod. 2016, 84, 131–138. [Google Scholar] [CrossRef]
- Zhao, H.; Cheng, N.; Wang, Q.; Zhou, W.; Liu, C.; Liu, X.; Chen, S.; Fan, D.; Cao, W. Effects of honey-extracted polyphenols on serum antioxidant capacity and metabolic phenotype in rats. Food Funct. 2019, 10, 2347–2358. [Google Scholar] [CrossRef]
- Vallverdu-Queralt, A.; Jáuregui, O.; Di Lecce, G.; Andres-Lacueva, C.; Lamuela-Raventós, R.M. Screening of the polyphenol content of tomato-based products through accurate-mass spectrometry (HPLC–ESI-QTOF). Food Chem. 2011, 129, 877–883. [Google Scholar] [CrossRef]
- Sanlier, N.; Atik, A.; Atik, I. Consumption of green coffee and the risk of chronic diseases. Crit. Rev. Food Sci. Nutr. 2019, 59, 2573–2585. [Google Scholar] [CrossRef]
- Clifford, M.N.; Johnston, K.L.; Knight, S.; Kuhnert, N. Hierarchical scheme for LC-MSn identification of chlorogenic acids. J. Agric. Food Chem. 2003, 51, 2900–2911. [Google Scholar] [CrossRef]
- Shafiee, M.; Arekhi, S.; Omranzadeh, A.; Sahebkar, A. Saffron in the treatment of depression, anxiety and other mental disorders: Current evidence and potential mechanisms of action. J. Affect. Disord. 2018, 227, 330–337. [Google Scholar] [CrossRef]
- Mykhailenko, O.; Kovalyov, V.; Goryacha, O.; Ivanauskas, L.; Georgiyants, V. Biologically active compounds and pharmacological activities of species of the genus Crocus: A review. Phytochemistry 2019, 162, 56–89. [Google Scholar] [CrossRef]
- Lin, M.; Xiang, D.; Chen, X.; Huo, H. Role of characteristic components of Humulus lupulus in promoting human health. J. Agric. Food Chem. 2019, 67, 8291–8302. [Google Scholar] [CrossRef] [PubMed]
- Oliva, E.; Viteritti, E.; Fanti, F.; Eugelio, F.; Pepe, A.; Palmieri, S.; Sergi, M.; Compagnone, D. Targeted and semi-untargeted determination of phenolic compounds in plant matrices by high performance liquid chromatography-tandem mass spectrometry. J. Chromatogr. A 2021, 1651, 462315. [Google Scholar] [CrossRef] [PubMed]
- Food and Drug Administration (FDA). Methods, Method Verification and Validation; FDA: White Oak, MD, USA, 2014.
- De Luca, S.; Ciotoli, E.; Biancolillo, A.; Bucci, R.; Magrì, A.D.; Marini, F. Simultaneous quantification of caffeine and chlorogenic acid in coffee green beans and varietal classification of the samples by HPLC-DAD coupled with chemometrics. Environ. Sci. Pollut. Res. 2018, 25, 28748–28759. [Google Scholar] [CrossRef] [PubMed]
- Alonso-Salces, R.M.; Serra, F.; Reniero, F.; Héberger, K. Botanical and geographical characterization of green coffee (Coffea arabica and Coffea canephora): Chemometric evaluation of phenolic and methylxanthine contents. J. Agric. Food Chem. 2009, 57, 4224–4235. [Google Scholar] [CrossRef]
- Belyagoubi, L.; Loukidi, B.; Belyagoubi-Benhammou, N.; Gismondi, A.; Di Marco, G.; D’Agostino, A.; Canini, A.; Benmahieddine, A.; Rouigueb, K.; Ben Menni, D.; et al. Valorization of Algerian saffron: Stigmas and flowers as source of bioactive compounds. Waste Biomass Valoriz. 2021, 12, 6671–6683. [Google Scholar] [CrossRef]
- Carbone, K.; Macchioni, V.; Petrella, G.; Cicero, D.O. Exploring the potential of microwaves and ultrasounds in the green extraction of bioactive compounds from Humulus lupulus for the food and pharmaceutical industry. Ind. Crop. Prod. 2020, 156, 112888. [Google Scholar] [CrossRef]
- Vázquez Loureiro, P.; Hernández Jiménez, I.; Sendón, R.; Rodriguez-Bernaldo de Quirós, A.; Barbosa-Pereira, L. Determination of xanthohumol in hops, food supplements and beers by HPLC. Foods 2019, 8, 435. [Google Scholar] [CrossRef] [Green Version]
- Kolodziejczyk-Czepas, J.; Kozachok, S.; Pecio, Ł.; Marchyshyn, S.; Oleszek, W. Determination of phenolic profiles of Herniaria polygama and Herniaria incana fractions and their in vitro antioxidant and anti-inflammatory effects. Phytochemistry 2021, 190, 112861. [Google Scholar] [CrossRef]
- Baeza, G.; Sarriá, B.; Bravo, L.; Mateos, R. Exhaustive qualitative LC-DAD-MSn analysis of Arabica green coffee beans: Cinnamoyl-glycosides and cinnamoylshikimic acids as new polyphenols in green coffee. J. Agric. Food Chem. 2016, 64, 9663–9674. [Google Scholar] [CrossRef] [Green Version]
- Esquivel, P.; Viñas, M.; Steingass, C.B.; Gruschwitz, M.; Guevara, E.; Carle, R.; Schweiggert, R.M.; Jiménez, V.M. Coffee (Coffea arabica L.) by-products as a source of carotenoids and phenolic compounds—Evaluation of varieties with different peel color. Front. Sustain. Food Syst. 2020, 4, 187. [Google Scholar] [CrossRef]
- Harbaum, B.; Hubbermann, E.M.; Wolff, C.; Herges, R.; Zhu, Z.; Schwarz, K. Identification of flavonoids and hydroxycinnamic acids in pak choi varieties (Brassica campestris L. ssp. chinensis var. communis) by HPLC–ESI-MS n and NMR and their quantification by HPLC–DAD. J. Agric. Food Chem. 2007, 55, 8251–8260. [Google Scholar] [CrossRef]
- Senizza, B.; Rocchetti, G.; Ghisoni, S.; Busconi, M.; De Los Mozos Pascual, M.; Fernandez, J.A.; Lucini, L.; Trevisan, M. Identification of phenolic markers for saffron authenticity and origin: An untargeted metabolomics approach. Food Res. Int. 2019, 126, 108584. [Google Scholar] [CrossRef]
- Hegazi, N.M.; Khattab, A.R.; Frolov, A.; Wessjohann, L.A.; Farag, M.A. Authentication of saffron spice accessions from its common substitutes via a multiplex approach of UV/VIS fingerprints and UPLC/MS using molecular networking and chemometrics. Food Chem. 2022, 367, 130739. [Google Scholar] [CrossRef]
- Tang, J.; Dunshea, F.R.; Suleria, H.A.R. LC-ESI-QTOF/MS characterization of phenolic compounds from medicinal plants (hops and juniper berries) and their antioxidant activity. Foods 2020, 9, 7. [Google Scholar] [CrossRef] [Green Version]
- Maietti, A.; Brighenti, V.; Bonetti, G.; Tedeschi, P.; Prencipe, F.P.; Benvenuti, S.; Brandolini, V.; Pellati, F. Metabolite profiling of flavonols and in vitro antioxidant activity of young shoots of wild Humulus lupulus L. (hop). J. Pharm. Biomed. Anal. 2017, 142, 28–34. [Google Scholar] [CrossRef]
- Babova, O.; Occhipinti, A.; Maffei, M.E. Chemical partitioning and antioxidant capacity of green coffee (Coffea arabica and Coffea canephora) of different geographical origin. Phytochemistry 2016, 123, 33–39. [Google Scholar] [CrossRef]
- Ali, A.M.A.; Yagi, S.; Qahtan, A.A.; Alatar, A.A.; Angeloni, S.; Maggi, F.; Caprioli, G.; Abdel-Salam, E.M.; Sinan, K.I.; Zengin, G. Evaluation of the chemical constituents, antioxidant and enzyme inhibitory activities of six Yemeni green coffee beans varieties. Food Biosci. 2022, 46, 101552. [Google Scholar] [CrossRef]
- Petals, L.; Farmaceutiche, S.; Salerno, U.; Ponte, V.; Melillo, D. Qualitative profile and quantitative determination of flavonoids from Crocus sativus L. petals by LC-MS/MS. Nat. Prod. Commun. 2008, 3, 2013–2016. [Google Scholar]
- Ferrara, L.; Naviglio, D.; Gallo, M. Compounds of saffron (Crocus sativus L.) by ultrasound assisted extraction (UAE) and by rapid solid-liquid dynamic extraction (RSLDE). Eur. Sci. J. 2014, 10, 1–13. [Google Scholar]
- Stevens, J.F.; Taylor, A.W.; Deinzer, M.L. Quantitative analysis of xanthohumol and related prenylflavonoids in hops and beer by liquid chromatography–tandem mass spectrometry. J. Chromatogr. A 1999, 832, 97–107. [Google Scholar] [CrossRef]
- Mehari, B.; Redi-Abshiro, M.; Chandravanshi, B.S.; Combrinck, S.; Atlabachew, M.; McCrindle, R. Profiling of phenolic compounds using UPLC–MS for determining the geographical origin of green coffee beans from Ethiopia. J. Food Compos. Anal. 2016, 45, 16–25. [Google Scholar] [CrossRef]
- Craig, A.P.; Fields, C.; Liang, N.; Kitts, D.; Erickson, A. Performance review of a fast HPLC-UV method for the quantification of chlorogenic acids in green coffee bean extracts. Talanta 2016, 154, 481–485. [Google Scholar] [CrossRef] [Green Version]
- Tuberoso, C.I.; Rosa, A.; Montoro, P.; Fenu, M.A.; Pizza, C. Antioxidant activity, cytotoxic activity and metabolic profiling of juices obtained from saffron (Crocus sativus L.) floral by-products. Food Chem. 2016, 199, 18–27. [Google Scholar] [CrossRef]
- Carmona, M.; Sánchez, A.M.; Ferreres, F.; Zalacain, A.; Tomas-Barberan, F.; Alonso, G.L. Identification of the flavonoid fraction in saffron spice by LC/DAD/MS/MS: Comparative study of samples from different geographical origins. Food Chem. 2007, 100, 445–450. [Google Scholar] [CrossRef]
- Goupy, P.; Vian, M.A.; Chemat, F.; Caris-Veyrat, C. Identification and quantification of flavonols, anthocyanins and lutein diesters in tepals of Crocus sativus by ultra performance liquid chromatography coupled to diode array and ion trap mass spectrometry detections. Ind. Crop. Prod. 2013, 44, 496–510. [Google Scholar] [CrossRef]
- Sommella, E.; Pagano, F.; Salviati, E.; Chieppa, M.; Bertamino, A.; Manfra, M.; Sala, M.; Novellino, E.; Campiglia, P. Chemical profiling of bioactive constituents in hop cones and pellets extracts by online comprehensive two-dimensional liquid chromatography with tandem mass spectrometry and direct infusion Fourier transform ion cyclotron resonance mass spectrometry. J. Sep. Sci. 2018, 41, 1548–1557. [Google Scholar] [CrossRef]
- Paunoic, D.D.; Mitic, S.S.; Misic, I.D.R.; Mitic, M.N.; Pavlovic, A.N.; Kocic, G.M. Analyses of metals impact on Humulus lupulus strobili antioxidant capacity. Rev. Chim. 2020, 71, 234–247. [Google Scholar] [CrossRef]
- Ramón-Gonçalves, M.; Gomez-Mejia, E.; Rosales-Conrado, N.; León-González, M.E.; Madrid, Y. Extraction, identification and quantification of polyphenols from spent coffee grounds by chromatographic methods and chemometric analyses. Waste Manag. 2019, 96, 15–24. [Google Scholar] [CrossRef]


| Sample Name | Gallic Acid | Chlorogenic Acid | Epicatechin | Catechin | Caffeic Acid | Vanillic Acid | EGCG | Siringic Acid | Protocatechuic Acid | p-Coumaric Acid |
|---|---|---|---|---|---|---|---|---|---|---|
| Green coffee | 41.53 ± 2.5 | 16,990.00 ± 1,868 | 20.20 ± 1.8 | 13.06 ± 1.2 | 702.60 ± 49.2 | 1.77 ± 0.7 | 4.60 ± 1.2 | 15.21 ± 0.9 | 51.25 ± 2.0 | 22.52 ± 7.6 |
| Saffron | 11.93 ± 1.4 | 73.80 ± 5.2 | 15.67 ± 1.3 | <LOQ | 24.40 ± 3.2 | <LOQ | 5.49 ± 1.7 | 27.76 ± 1.7 | <LOQ | 15.23 ± 1.6 |
| Hop | <LOQ | 912.60 ± 82.2 | 805.90 ± 84.6 | 4692.00 ± 516.1 | 46.35 ± 4.2 | 105.50 ± 8.4 | 6.23 ± 0.2 | 684.00 ± 75.3 | 840.00 ± 50.4 | 992.00 ± 89.3 |
| Sample Name | Ferulic Acid | Rosmarinic Acid | Quercetin | Rutin | Ellagic Acid | Sinapic Acid | Luteolin | Quercetin-hexoside | Isoxanthohumol | Xhanthohumol |
| Green coffee | 275.80 ± 69.3 | 10.64 ± 2.6 | 47.89 ± 1.9 | 77.19 ± 3.9 | 4.33 ± 0.9 | 6.71 ± 0.4 | <LOQ | 4.19 ± 0.9 | <LOQ | <LOQ |
| Saffron | 0.60 ± 0.1 | 3.04 ± 0.1 | 52.48 ± 3.7 | 0.90 ± 0.1 | 4.19 ± 0.7 | 4.56 ± 0.9 | 3.84 ± 0.1 | 7.46 ± 1.1 | <LOQ | <LOQ |
| Hop | 168.00 ± 12.4 | <LOQ | 549.00 ± 89.4 | 1146 ± 676.2 | 14.38 ± 1.2 | 307.00 ± 27.6 | 831.00 ± 94.8 | 745.90 ± 82.3 | 468.00 ± 38.8 | 1787.00 ± 496.6 |
| Tr | M/Z | NL | Main Fragments | Compound Identification | ||||
|---|---|---|---|---|---|---|---|---|
| Green coffee | 3.34 | 352.9 | [M − H − 162]− or [M − H − 174]− | 135 | 161 | 179 | 191 | Caffeoylquinic acid (I) |
| 3.76 | 352.9 | [M − H − 162]− or [M − H − 174]− | 135 | 161 | 179 | 191 | Caffeoylquinic acid (II) | |
| 3.77 | 451 | [M – H − 162]− | 109 | 125 | 245 | 289 | Catechin-hexoside | |
| 3.88 | 352.9 | [M − H − 162]− or [M − H − 174]− | 135 | 161 | 179 | 191 | Caffeoylquinic acid (III) | |
| 4.37 | 366.9 | [M − H − 174]− or [M − H − 176]− | 134 | 135 | 173 | 193 | Feruloylquinic acid | |
| 4.58 | 337 | [M − H − 146]− or [M − H − 174]− | 117 | 119 | 163 | 191 | p-Coumaroylquinic acid | |
| 4.9 | 514.9 | [M − H − 162]− or [M − H − 174]− | 161 | 179 | 191 | 353 | Dicaffeoylquinic acid (I) | |
| 5.13 | 514.9 | [M − H − 162]− or [M − H − 174]− | 161 | 179 | 191 | 353 | Dicaffeoylquinic acid (II) | |
| 5.39 | 529 | [M − H − 162]− or [M − H − 174]− or [M – H − 176]− | 179 | 193 | 353 | 367 | Feruloyl-5-caffeoylquinic acid (I) | |
| 5.56 | 529 | [M − H − 162]− or [M − H − 174]− or [M – H − 176]− | 179 | 193 | 353 | 367 | Feruloyl-5-caffeoylquinic acid (II) | |
| 5.67 | 529 | [M − H − 162]− or [M − H − 174]− or [M – H − 176]− | 179 | 193 | 353 | 367 | Feruloyl-5-caffeoylquinic acid (III) | |
| 5.92 | 542.9 | [M − H − 174]− or [M − H − 176]− | 134 | 173 | 193 | 367 | Diferuloylquinic acid (I) | |
| 6.13 | 542.9 | [M − H − 174]− or [M − H − 176]− | 134 | 173 | 193 | 367 | Diferuloylquinic acid (II) | |
| 6.3 | 542.9 | [M − H − 174]− or [M − H − 176]− | 134 | 173 | 193 | 367 | Diferuloylquinic acid (III) | |
| Hop | 3.34 | 352.9 | [M − H − 162]− or [M − H − 174]− | 135 | 161 | 179 | 191 | Caffeoylquinic acid (I) |
| 3.76 | 352.9 | [M − H − 162]− or [M − H − 174]− | 135 | 161 | 179 | 191 | Caffeoylquinic acid (II) | |
| 3.88 | 352.9 | [M − H − 162]− or [M − H − 174]− | 135 | 161 | 179 | 191 | Caffeoylquinic acid (III) | |
| 4.6 | 609 | [M − H − 162]− or [M − H − 308]− | 151 | 179 | 271 | 301 | Quercetin-rutinoside | |
| 4.77 | 592.8 | [M − H − 162]− or [M − H − 308]− | 133 | 159 | 229 | 285 | Kaempferol-rutinoside | |
| 5.31 | 463 | [M − H − 174]− | 151 | 179 | 271 | 301 | Quercetin-hexoside | |
| 7.16 | 396.8 | [M − H − 174]− | 173 | 207 | 281 | 353 | Sinapoylquinic acid (I) | |
| 7.44 | 396.8 | [M − H − 174]− | 173 | 207 | 281 | 353 | Sinapoylquinic acid (II) | |
| 7.65 | 396.8 | [M − H − 174]− | 173 | 207 | 281 | 353 | Sinapoylquinic acid (III) | |
| 8.49 | 433,2 | [M − H − 132]− | 151 | 179 | 271 | 301 | Quercetin-xyloside | |
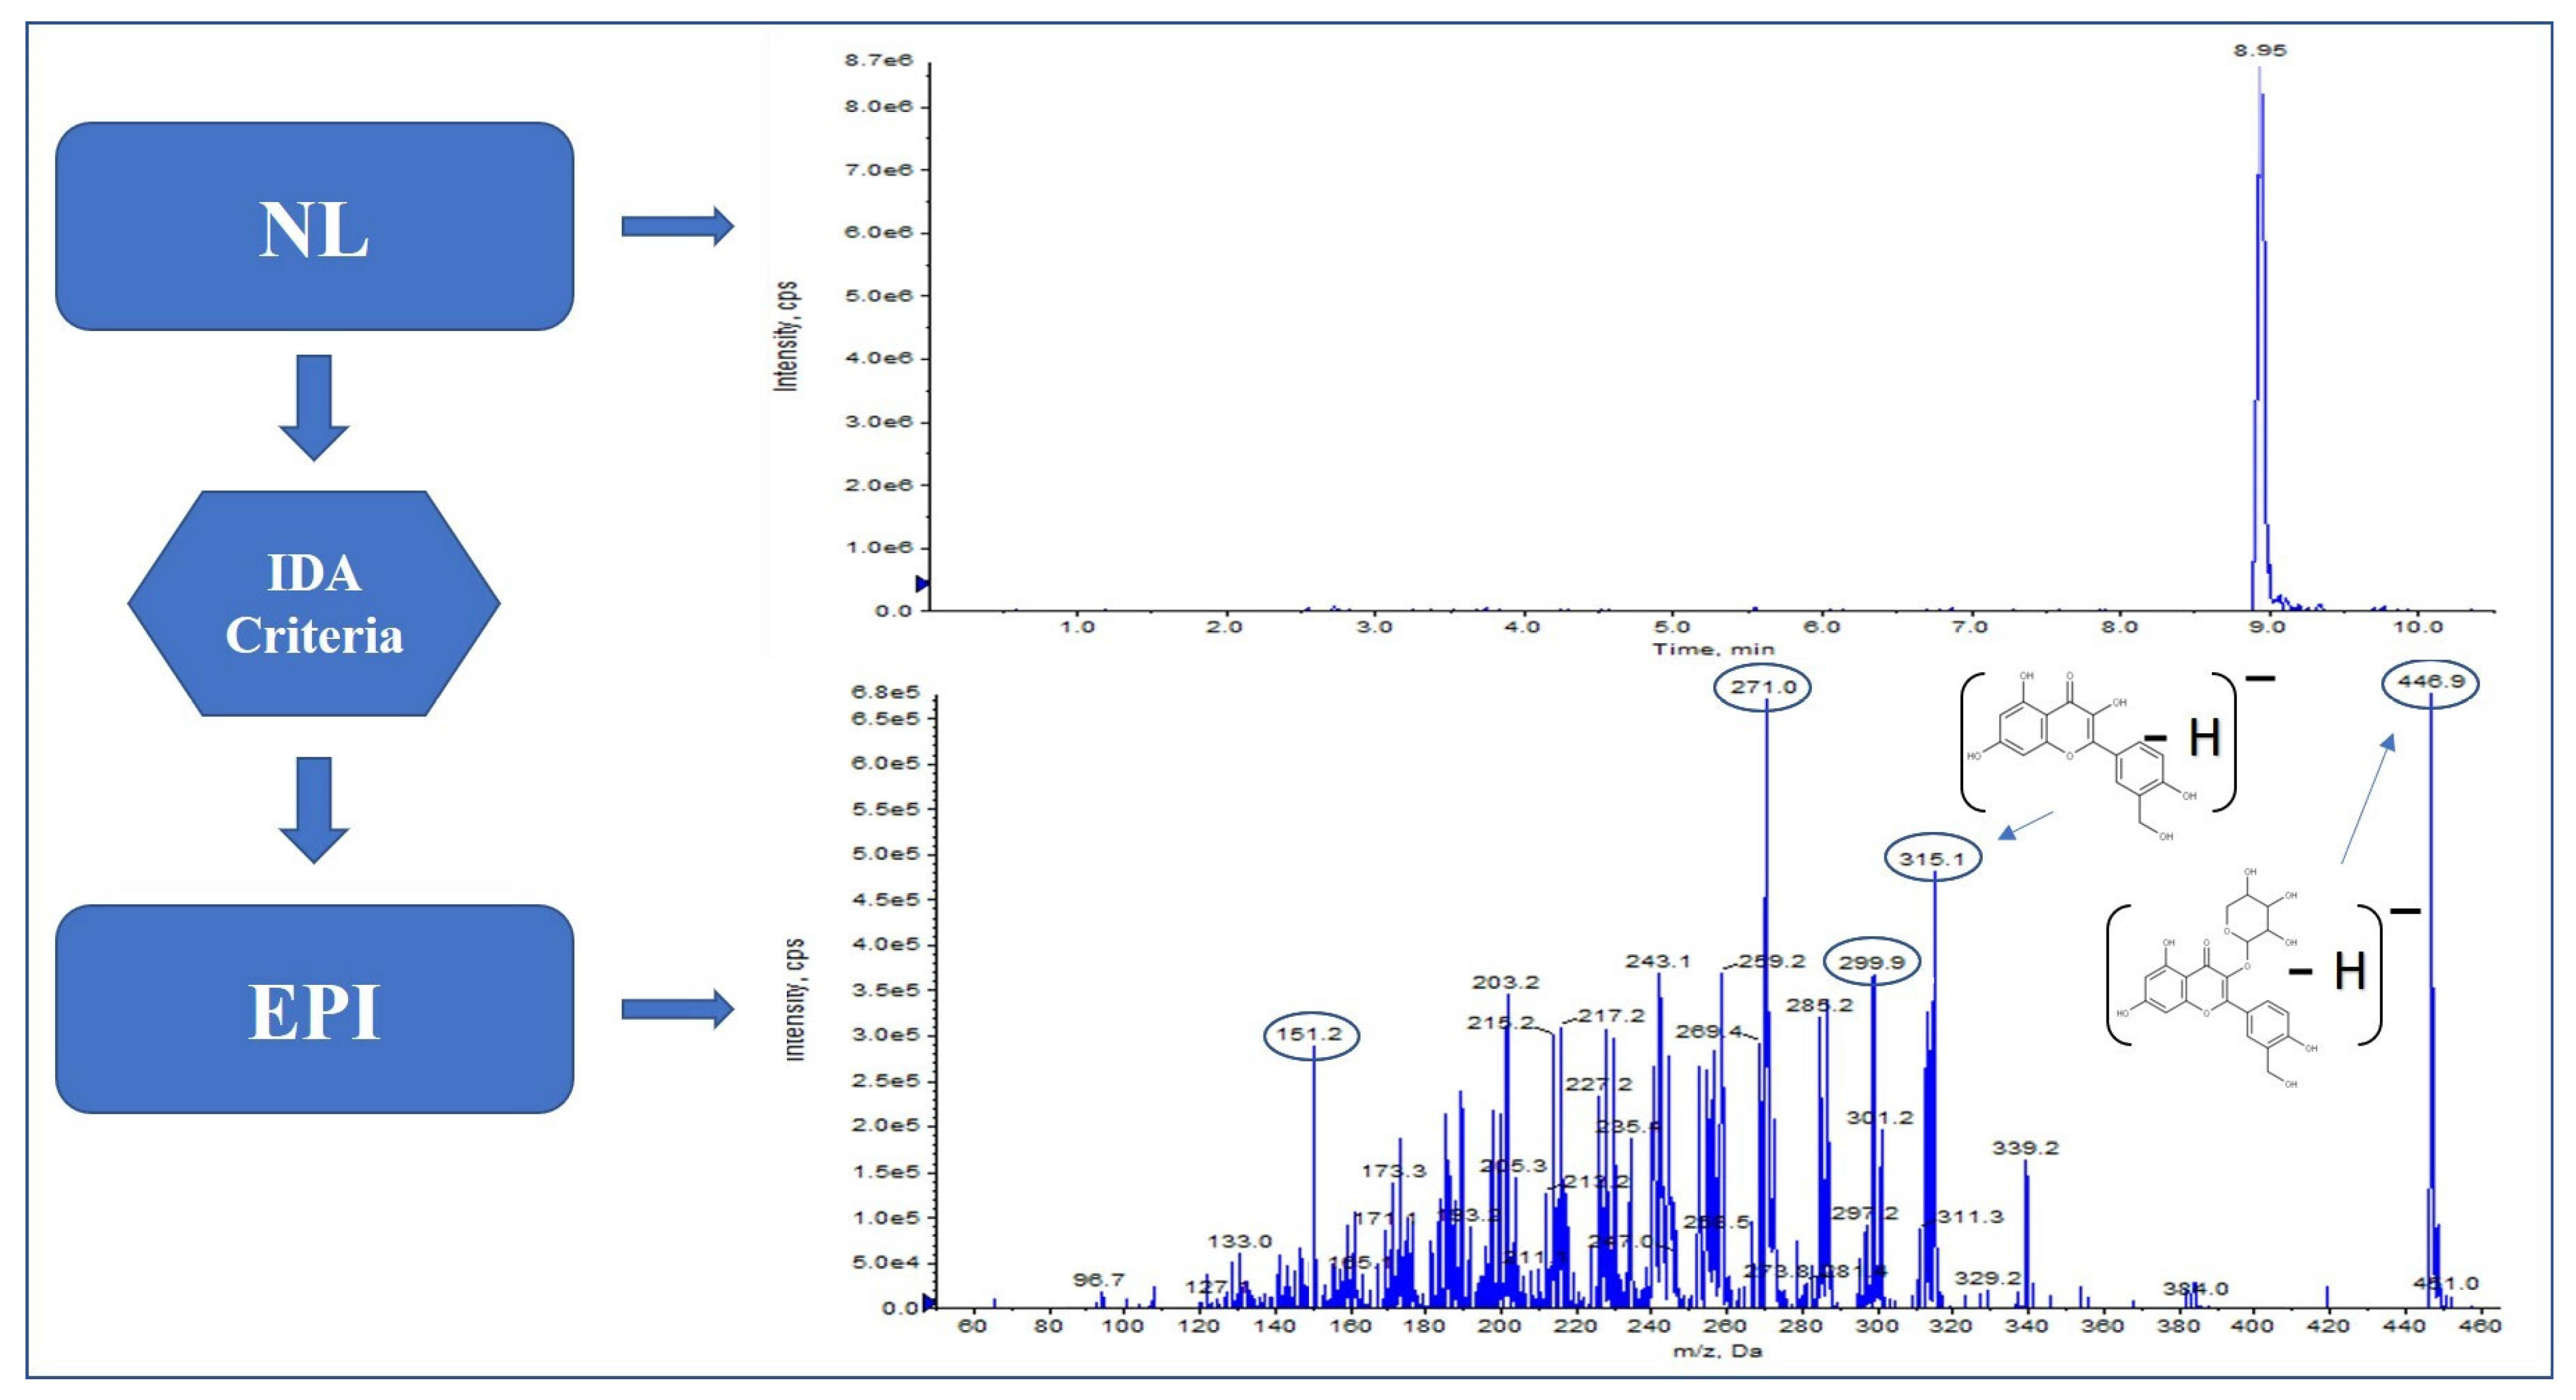
| 8.95 | 446.9 | [M − H − 132]− | 151 | 271 | 300 | 315 | Isorhamnetin-xyloside | |
| 9.84 | 311 | [M − H − 162]− | 103 | 135 | 179 | 249 | Caffeoyltartaric acid | |
| Saffron | 3.27 | 787 | [M − H − 146]− or [M − H − 162]− or [M − H − 308]− | 317 | 463 | 479 | 625 | Myricetin-rutinoside-hexoside |
| 3.38 | 771 | [M − H − 162]− | 255 | 285 | 446 | 609 | Kaempferol-sophoroside-hexoside | |
| 3.47 | 755 | [M − H − 146]− or [M − H − 162]− or [M − H − 308]− | 255 | 285 | 446 | 593 | Kaempferol-rutinoside-hexoside | |
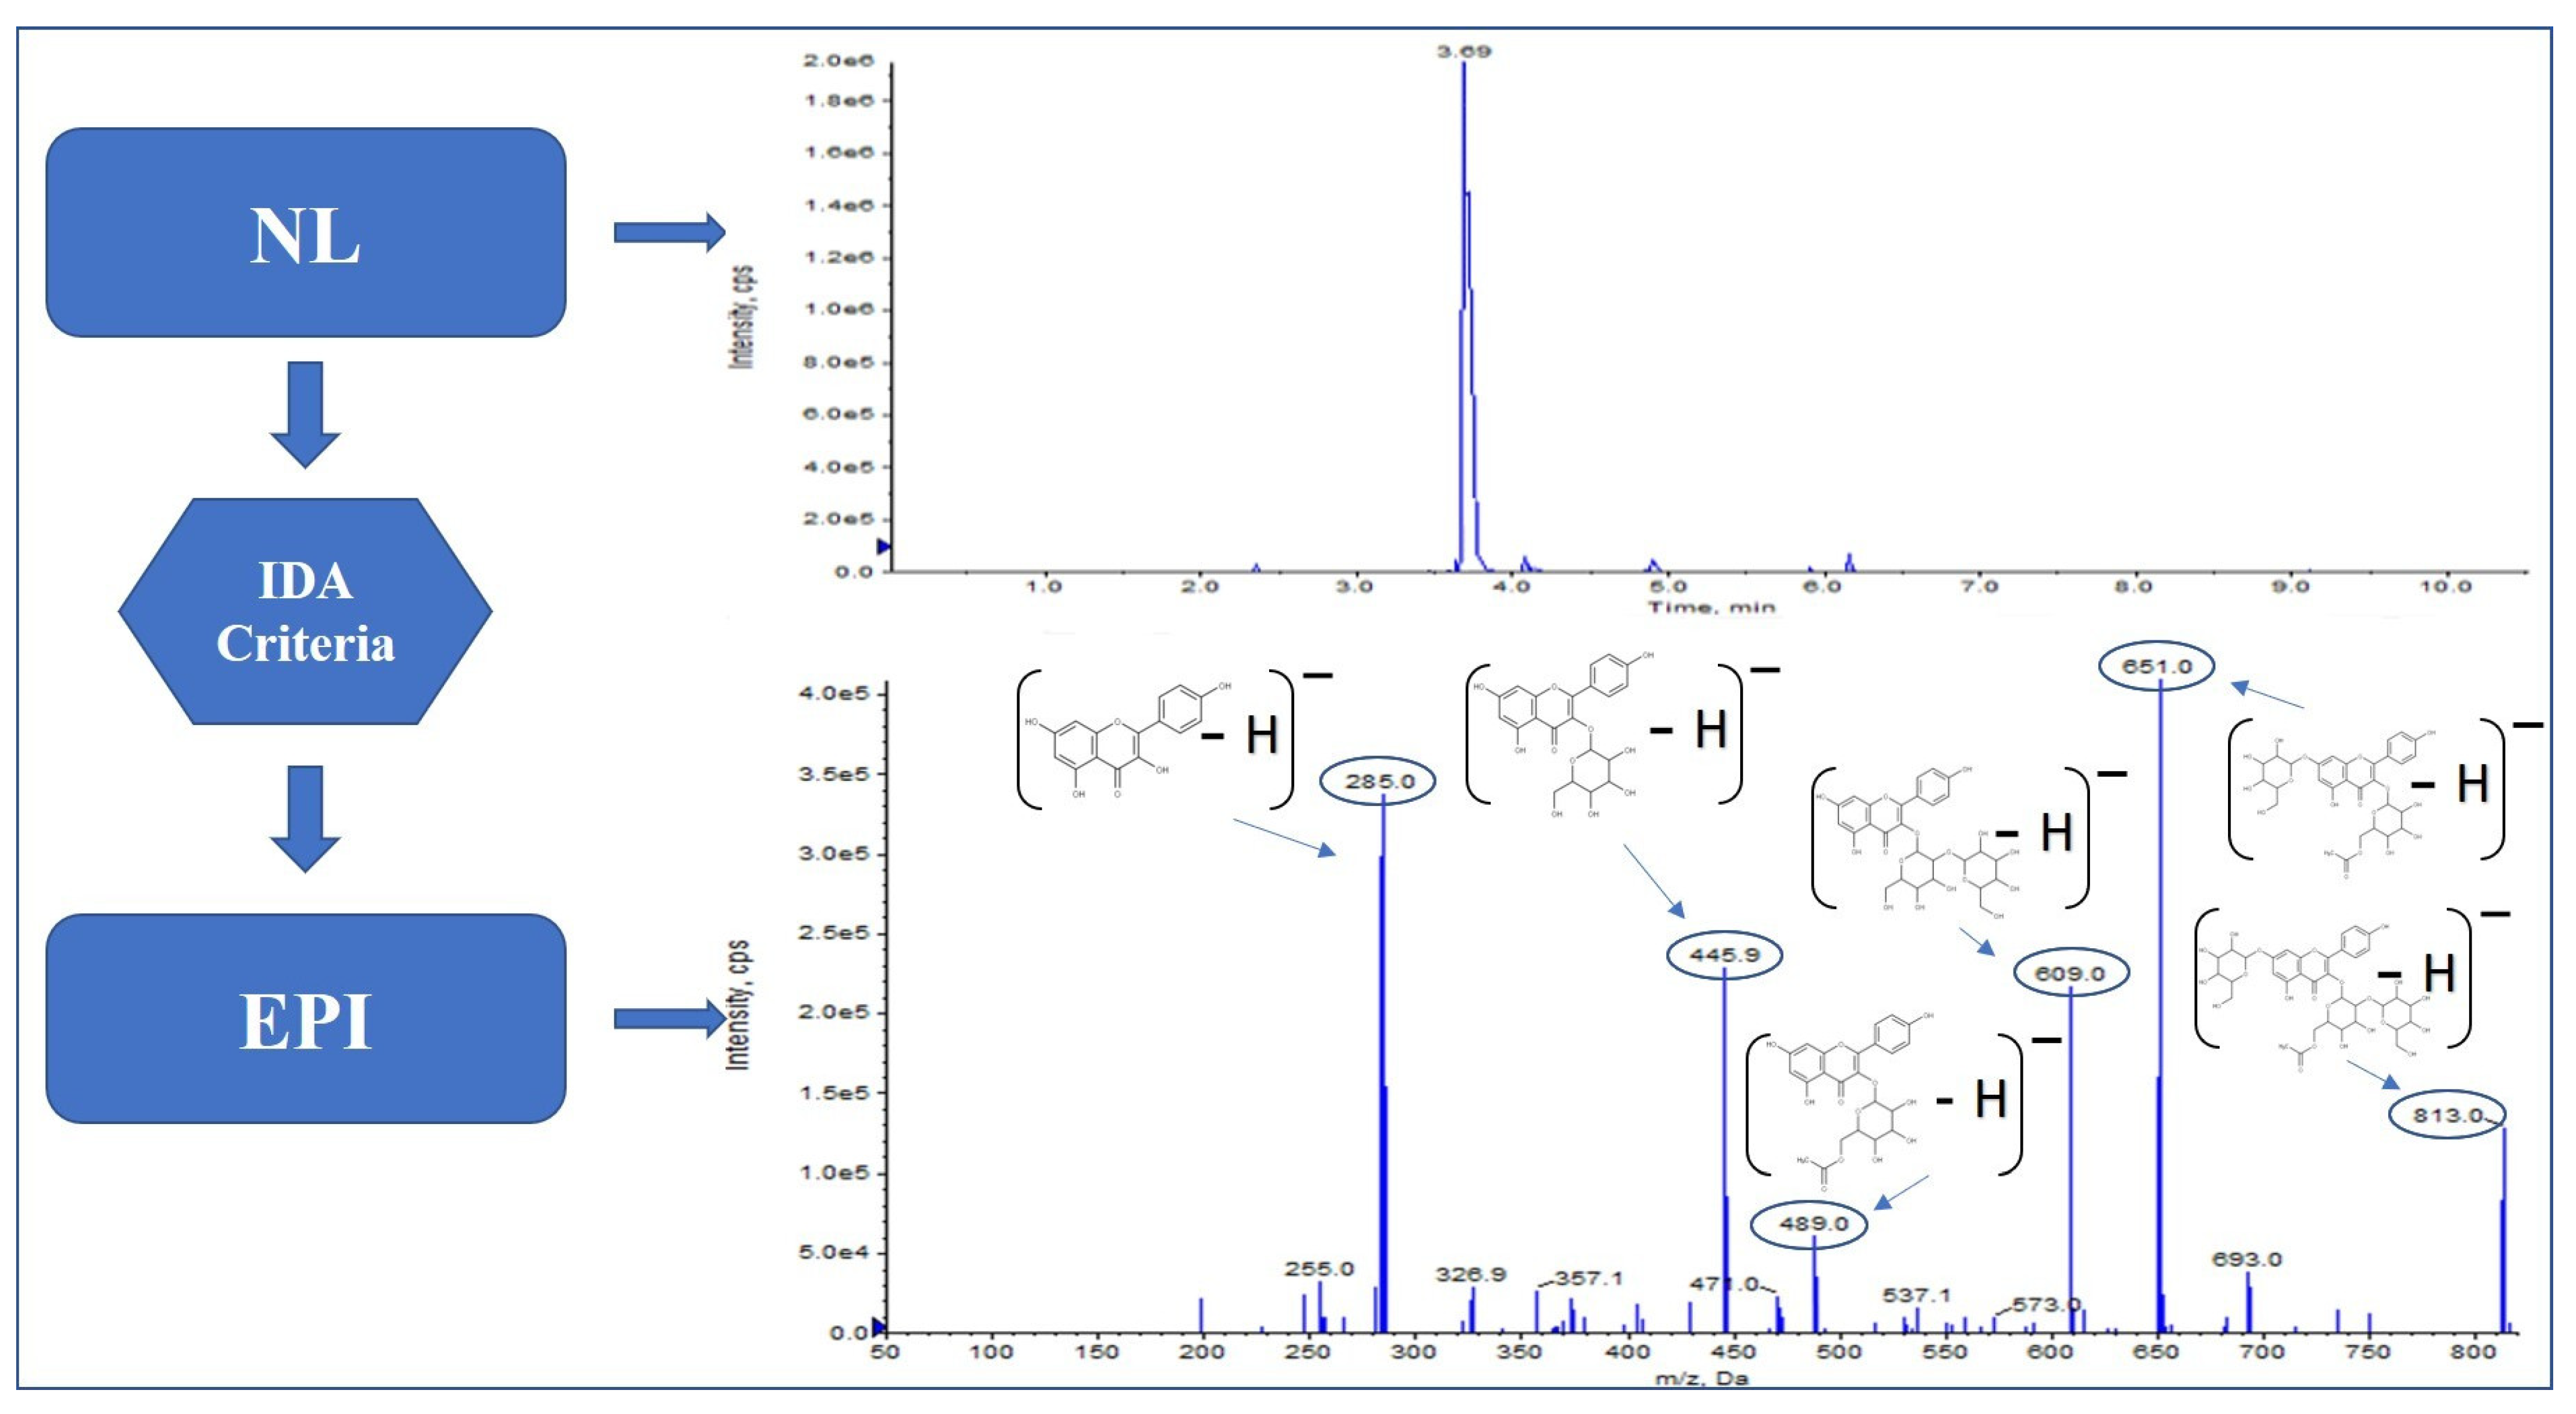
| 3.69 | 813 | [M − H − 162]− or [M − H − 308]− | 446 | 489 | 609 | 651 | Kaempferol-glucosyl-(6″-acetylgalactoside)-hexoside | |
| 3.77 | 314.6 | [M − H − 162]− | 53 | 109 | 135 | 153 | Protocatechuic acid-hexoside | |
| 3.77 | 609 | [M − H − 162]− | 159 | 255 | 285 | 446 | Kaempferol-sophoroside | |
| 4.12 | 651 | [M − H − 146]− or [M − H − 162]− or [M − H − 308]− | 151 | 179 | 447 | 489 | Quercetin-O-(6″-acetyl-galactoside)-O-rhamnoside | |
| 4.21 | 448.5 | [M − H − 162]− | 213 | 231 | 259 | 287 | Cyanidin-hexoside | |
| 4.21 | 624.8 | [M − H − 162]− | 151 | 179 | 301 | 463 | Quercetin-sophoroside | |
| 4.29 | 639 | [M − H − 162]− | 151 | 271 | 315 | 477 | Isorhamnetin-sophoroside | |
| 4.41 | 609 | [M − H − 146]− or [M − H − 162]− or [M − H − 308]− | 151 | 179 | 271 | 301 | Quercetin-rutinoside | |
| 4.64 | 623 | [M − H − 146]− or [M − H − 162]− or [M − H − 308]− | 151 | 271 | 300 | 315 | Isorhamnetin-rutinoside | |
| 4.89 | 651 | [M − H − 162]− | 255 | 285 | 446 | 489 | Kaempferol-(6″-acetyl-glucoside)-glucoside | |
| 5.02 | 447 | [M − H − 162]− | 133 | 159 | 229 | 285 | Kaempferol-hexoside | |
| 5.1 | 478 | [M − H − 162]− | 257 | 274 | 302 | 316 | Petunidin-hexoside | |
| 5.1 | 785 | [M − H − 146]− or [M − H − 162]− or [M − H − 308]− | 300 | 315 | 477 | 639 | Isorhamnetin-sophoroside-rhamnoside | |
| 5.31 | 463 | [M − H − 162]− | 151 | 179 | 271 | 301 | Quercetin-hexoside | |
| 5.33 | 432.7 | [M − H − 162]− | 141 | 188 | 225 | 270 | Pelargonidin-hexoside | |
| 5,81 | 562 | [M − H − 132]− or [M − H − 162]− | 117 | 151 | 269 | 431 | Apigenin-apiosyl-hexoside | |
| 5.95 | 593 | [M − H − 146]− or [M − H − 162]− or [M − H − 308]− | 133 | 159 | 229 | 285 | Kaempferol-rutinoside | |
| 6.52 | 329 | [M − H − 162]− | 151 | 179 | 271 | 301 | Dimethylquercetin | |
| 7.58 | 430.8 | [M − H − 146]− | 133 | 159 | 229 | 285 | Kaempferol-rhamnoside | |
| 9.84 | 311 | [M − H − 162]− | 103 | 135 | 179 | 249 | Caffeoyl tartaric acid | |
Publisher’s Note: MDPI stays neutral with regard to jurisdictional claims in published maps and institutional affiliations. |
© 2022 by the authors. Licensee MDPI, Basel, Switzerland. This article is an open access article distributed under the terms and conditions of the Creative Commons Attribution (CC BY) license (https://creativecommons.org/licenses/by/4.0/).
Share and Cite
Oliva, E.; Fanti, F.; Palmieri, S.; Viteritti, E.; Eugelio, F.; Pepe, A.; Compagnone, D.; Sergi, M. Predictive Multi Experiment Approach for the Determination of Conjugated Phenolic Compounds in Vegetal Matrices by Means of LC-MS/MS. Molecules 2022, 27, 3089. https://doi.org/10.3390/molecules27103089
Oliva E, Fanti F, Palmieri S, Viteritti E, Eugelio F, Pepe A, Compagnone D, Sergi M. Predictive Multi Experiment Approach for the Determination of Conjugated Phenolic Compounds in Vegetal Matrices by Means of LC-MS/MS. Molecules. 2022; 27(10):3089. https://doi.org/10.3390/molecules27103089
Chicago/Turabian StyleOliva, Eleonora, Federico Fanti, Sara Palmieri, Eduardo Viteritti, Fabiola Eugelio, Alessia Pepe, Dario Compagnone, and Manuel Sergi. 2022. "Predictive Multi Experiment Approach for the Determination of Conjugated Phenolic Compounds in Vegetal Matrices by Means of LC-MS/MS" Molecules 27, no. 10: 3089. https://doi.org/10.3390/molecules27103089
APA StyleOliva, E., Fanti, F., Palmieri, S., Viteritti, E., Eugelio, F., Pepe, A., Compagnone, D., & Sergi, M. (2022). Predictive Multi Experiment Approach for the Determination of Conjugated Phenolic Compounds in Vegetal Matrices by Means of LC-MS/MS. Molecules, 27(10), 3089. https://doi.org/10.3390/molecules27103089