Article

Monte Carlo Simulation and Experimental Studies of CO2, CH4 and Their Mixture Capture in Porous Carbons

by
Pakamas Kohmuean
,
Worapoj Inthomya
,
Atichat Wongkoblap
* and
Chaiyot Tangsathitkulchai
School of Chemical Engineering, Suranaree University of Technology, Nakhon Ratchasima 30000, Thailand
*
Author to whom correspondence should be addressed.
Molecules 2021, 26(9), 2413; https://doi.org/10.3390/molecules26092413
Submission received: 15 March 2021 / Revised: 12 April 2021 / Accepted: 14 April 2021 / Published: 21 April 2021
(This article belongs to the Special Issue Porous Carbon Materials and Their Applications)

Abstract

:
Adsorption of carbon dioxide and methane in porous activated carbon and carbon nanotube was studied experimentally and by Grand Canonical Monte Carlo (GCMC) simulation. A gravimetric analyzer was used to obtain the experimental data, while in the simulation we used graphitic slit pores of various pore size to model activated carbon and a bundle of graphitic cylinders arranged hexagonally to model carbon nanotube. Carbon dioxide was modeled as a 3-center-Lennard-Jones (LJ) molecule with three fixed partial charges, while methane was modeled as a single LJ molecule. We have shown that the behavior of adsorption for both activated carbon and carbon nanotube is sensitive to pore width and the crossing of isotherms is observed because of the molecular packing, which favors commensurate packing for some pore sizes. Using the adsorption data of pure methane or carbon dioxide on activated carbon, we derived its pore size distribution (PSD), which was found to be in good agreement with the PSD obtained from the analysis of nitrogen adsorption data at 77 K. This derived PSD was used to describe isotherms at other temperatures as well as isotherms of mixture of carbon dioxide and methane in activated carbon and carbon nanotube at 273 and 300 K. Good agreement between the computed and experimental isotherm data was observed, thus justifying the use of a simple adsorption model.

1. Introduction

Adsorption of carbon dioxide and methane has been of significant interest to adsorption science and engineering because carbon dioxide is a potential molecular probe for characterizing narrow micropores at experimentally measurable pressures [1] while the study of methane adsorption helps to synthesize potential porous solid absorbents for methane storage in transportation vehicles as well as the promotion of researches in fuel cell technology [2,3]. In addition, carbon dioxide and methane are implicated as greenhouse gases that can cause global warming due to greenhouse effects; therefore, the reduction of greenhouse gases has become increasingly important [4,5,6]. The adsorption process is one of the technologies used to control CO2 emission to atmospheric environment by the removal of CO2 from gas mixtures [7,8]. Furthermore, mixtures of CO2 and CH4 are major constituents in fermented-biogas while mixtures of CO2 and hydrocarbons are normally found in natural gas. The removal of CO2 from these gas mixtures is of utmost importance for in enhanced energy utilization [9,10]. Adsorption techniques such as temperature-swing and pressure-swing adsorption together with using porous adsorbents, especially porous carbons, are among the most promising candidates for these carbon dioxide capture [7]. Therefore, the characterization of porous carbon (for example, pore size distribution (PSD)) is necessary for the utilization and design of promising porous solids for a variety of applications. However, the evaluation of activated carbons for a given separation is still a difficult task; this is due to the difficulty in predicting their adsorption behaviors for a suitable model representing the structure of carbon [7].
On the other hand, agricultural production can generate a huge amount of agricultural waste and biomass such as coconut shells, corn cops and longan seeds, and it translates into a great impact on the environment [3,11]. Therefore, the recycling process and utilization of such abundant waste materials are an urgent issue nowadays. However, the collection, processing and transportation costs of those waste materials are higher than their economic value for beneficial use [11]. The longan fruit is one of the most valuable consumable fruits and is widely growth in Thailand. Its seeds are considered as agricultural waste produced from many processing plants. The longan seeds have a fixed carbon content of 19.6% with relatively low ash content and high volatile content [12]. The fixed carbon composition of longan seed compared with other carbonaceous materials can promote its use as a precursor for activated carbon synthesis. Activated carbon is one of the most widely used commercial adsorbents in the area of in adsorption because of its large micropore and mesopore volumes and high surface area, while single wall carbon nanotube (SWCN) has been increasingly used in a number of applications because of its strong fluid-solid interaction and electronic properties [13,14]. Therefore, porous carbons become the promising and sustainable alternative materials for energy storage such as natural gas (NG) and hydrogen [15,16]. Methane is the major composition contained in NG and can be stored in porous materials as an adsorbed phase called ANG. The maximum theoretical methane uptake and delivery for activated carbon at 3.5 MPa and 25 °C are 213 v/v and 120 v/v, respectively [17]. The activated carbon fibers, powered activated carbons and activated carbon monoliths have been found to be suitable materials for methane storage and the volumetric CH4 uptake and delivery for these materials were about 163 v/v and 143 v/v, respectively [15]. The methane storage capacity at 7 °C and 8.5 MPa on activated carbon with surface area of 1060 m2/g was 113.5 v/v [16]. The activated carbon derived from peanut shell has the adsorption capacities of CH4 at 1 bar and 40 °C of 1.38 mmol/g [3]. Therefore, the activated carbon derived from longan seed may be considered in this study.
Molecular simulations have been introduced to study the adsorption of fluids in nanoporous carbons and compared with the experimental data. Generally, activated carbon is modeled as a collection of pores of different widths. The pores are assumed to be either infinite carbon slit pores [1,18,19,20] or infinite carbon cylindrical pores [21,22]. However, the infinite pore model is too ideal to reflect the adsorption behavior of activated carbon whose length is finite [23] and it contains chemical impurities, functional groups and defects on the basal graphene layers [24]. While the isolated SWCN have been commonly used in many simulations, this simplistic model does not truly represent real carbon nanotubes because these tubes are usually found in tangled or partly aligned bundles due to the strong Van der Waals interactions [25,26]. Therefore, in this study, real carbon pores of finite length and carbon surfaces as graphene layers comprising carbon atoms arranged in a hexagonal pattern proposed in our previous studies [27,28] are used to model the structure of activated carbon for studying the adsorption behavior of carbon dioxide and methane in porous carbons. The detail of solid models are described in Section 2.2.
In this study, adsorption isotherms of CO2 and CH4 at 273 and 300 K were obtained for graphitic slit pores having widths of 6.3 to 30 Å by using a Grand Canonical Monte Carlo (GCMC) simulation, and they were used as a kernel to characterize the experimental data obtained for commercial activated carbon (CAC) derived from coconut shells and longan seed activated carbon (LAC). The homogeneous nanotubes bundles were also used to investigate the adsorption of CO2 and CH4 in carbon nanotubes by using the GCMC ensemble. The tube diameters of 9.5, 10.8, 13.6 and 16.3 Å were selected for investigation the effect of tube diameter on adsorption isotherm. The simulation results were applied to characterize the pore size distribution (PSD) of commercial single walled carbon nanotubes (SWCNs) and compared with the experimental data. The reconstructed adsorption isotherm obtained from the PSD of CO2 and CH4 in finite-length pores are used to predict the adsorption isotherm obtained for the binary mixtures and compare with the experimental data. In this paper, we investigate the abilities of Pore Size Distribution (PSD) obtained for finite-length pore model to predict pure and binary adsorption of carbon dioxide and methane in activated carbon and carbon nanotubes.

2. Methodology

2.1. Fluid-Fluid Potential Models

In this study, methane is modeled with a single Lennard-Jones (LJ) site while carbon dioxide is modeled as a 3-center LJ molecule with fixed partial charges to account for the quadrupole moment [29]. Nitrogen is represented as a non-spherical model with two LJ sites located at the center of nitrogen atoms separated by 1.1 Å, a positive charge (12.98 × 10⁻²⁰ C) at the center of the molecule and two negative charges (−6.49 × 10⁻²⁰ C) at the centers of the two nitrogen atoms [30,31]. The molecular parameters are listed in Table 1 for methane and nitrogen and Table 2 for carbon dioxide.
A cut-off radius in the calculation of interaction energy of five times the collision diameter of fluid (5 σ f f or 5σC-C in the case of CO2) is used in this study.

2.2. Solid Models

A simple graphitic slit pore of finite length was used to model activated carbon [27]. The pore wall consists of three graphene layers with an interlayer spacing of 3.354 Å. Each graphene layer is composed of carbon atoms arranged in a hexagonal pattern with C-C bond length of 1.42 Å, and we chose square graphene layers with linear dimension of 60 Å [23] in our simulation. A range of pore width from 6.3 to 50 Å was used in the simulation of local isotherms for the subsequent derivation of pore size distribution of activated carbon.
Single wall carbon nanotube (SWCN) was modeled as an ensemble of bundles of seven graphitic cylinders arranged in a hexagonal pattern, as shown in Figure 1. Each cylinder has the following characteristics: (1) its diameter is defined as the diameter of a circle passing through the centers of carbon atoms, and (2) the C-C separation distances is 1.42 Å, which is the same as that in the flat graphene. The minimum separation spacing of carbon atoms on the external surface of two adjacent nanotubes is denoted as s, which is treated as a variable in this study (chosen between 4 and 10 Å). For this model of SWCN, two different types of interstices were identified: (i) the space between the individual nanotubes, i.e., the cusp interstices, and (ii) the space at the corner of simulation box which formed the square interstices. The cylindrical pores used in this study are (7:7), (8:8), (10:10) and (12:12) SWCNs, which correspond to the diameters of 9.5, 10.8, 13.6 and 16.3 Å, respectively [27].
The LJ parameters for a carbon atom in a graphene layer, σss and εss/k, are 3.4 Å and 28 K, respectively [1]. The interaction energy between a site of a fluid molecule and a carbon atom on the graphene layer was calculated with the LJ 12-6 equation. The cross molecular parameters were calculated from the Lorentz-Berthelot rule [32].

2.3. Monte Carlo Simulation

We adopted the Metropolis algorithm in the Monte Carlo (MC) simulation [32] and the GCMC ensemble was used to obtain the adsorption isotherms. In the case of slit pore, the simulation box for this ensemble is a finite length carbon slit pore, and has a linear dimension of about 60 Å in the x and y directions. We assumed that the top and the bottom of the simulation box are two walls of the slit pore, and each wall consists of three graphene layers. We specified the volume of the box (i.e., pore volume), the chemical potential and the temperature of the system to obtain the adsorption equilibrium. One GCMC cycle consists of one thousand displacement moves and attempts of either insertion or deletion with equal probability. In each displacement move, the particle is also rotated randomly around x, y or z axis with equal probability in the case of nitrogen with 2 LJ centers and carbon dioxide with 3 LJ centers. For an adsorption branch of the isotherm 20,000 cycles for the calculation are typically needed for the system to reach equilibrium. For each point on the adsorption branch, we used an empty box as the initial configuration, and the simulation was carried out until the number of particles in the box does not change in statistical sense. The displacement step length was initially chosen as 0.5 times the collision diameter of fluid, and it is decreased by 5% when the acceptance ratio is less than 0.5 and increased by 5% when this ratio is greater than 0.5. In the finite length pores, the usual periodic boundary conditions are not applied. Instead, the reflecting boundary conditions are applied in x, y and z directions as described in the literature [33], where the particle move is rejected if the attempted displacement puts the selected particle outside the simulation box. This boundary condition is applied to prevent particles from going outside of the simulation box. The pressure of the bulk gas corresponding to a given chemical potential are calculated from the equation of state proposed by Johnson et al. [34]. This is because the densities of coexisting liquid and vapor phases and saturation pressures for bulk CO2 obtained from experimental data agreed well with the Gibbs ensemble Monte Carlo (MC) simulation for three-center model of Harris and Yung [29] and the MC simulation results calculated with equation of state of Johnson et al. [35]. However, the computation time is shorter in the case of Johnson et al.’s equation of state [35].
The simulation box for carbon nanotubes bundle is a rectangular box with the z-dimension being the same as the tube length, while the dimensions in the x- and y-directions depend on the tube diameter and spacing to produce a replica of seven tubes in the neighboring boxes. A tube length of 50 Å was chosen in this study. The diameters of SWCN (D) are 9.5, 10.8, 13.6 and 16.3 Å, and the separation spacing between tube walls is 4, 7 and 10 Å. The length in x and y directions can be calculated from these equations [28].
L x = 3 ( D + s ) ;   L y = 2 { ( 3 D 2 + s ) × s i n ( π 3 ) } + s
Similar to the slit pore model, the GCMC method is also used to obtain the adsorption isotherm of fluid in a bundle of seven tubes. However, in the case of tube bundle, periodic boundary conditions (PBCs) [32,33] are applied in x and y directions. The average pore density (ρav) can be defined as the ratio of the number of particles inside the pores to the pore volume [28]:
ρ a v = N i n s i d e V p o r e
where Vpore = 7πR2L, where R is the subtraction of half a collision diameter of carbon atom from the pore radius, L is the pore length and Ninside is the number of particles inside nanotubes. While the average outside density, volume is defined as LxLyLz − (7π(R + σss)2L), where Lx, Ly and Lz are linear dimensions of the box, and Noutside is defined as N-Ninside, where N is total number of particles. In the case of slit pore, Vpore = LxLy(H − σss), where H is the pore width.

2.4. Experiments

The experimental isotherms of CO2 and CH4 at 273 and 300 K, and mixtures of CO2 and CH4 for various activated carbon and SWCN were obtained by using an Intelligent Gravimetric Analyzer (IGA) model IGA-002 supplied by Hiden Analytical Ltd. (Worrington, England). Prior to each adsorption run, the carbon sample (0.12 g) was outgassed at 200 °C for 10 h and then allowed to cool down to the adsorption temperature. Due to the limitation of our equipment (IGA), the same sample was used to measure the adsorption uptake obtained for single component in both mmol/g and mg. While the total adsorbed amount obtained for gas mixture was measured in mg, we cannot measure the adsorption uptake for each gas separately. Adsorbents used in this study are longan seed derived activated carbons (LAC): LAC1 and LAC2, and carbon nanotubes supplied by Chengdu Organic Chemicals, Chengdu, China. The porous properties of the derived activated carbons and carbon nanotube are measured by nitrogen adsorption at 77 K using an Accelerated Surface Area and Porosimetry Analyzer (ASAP2010, Micromeritics Instrument Corporation, Norcross, GA, USA). Brunauer-Emmet-Teller (BET) method was utilized to determine the specific surface area and micropore volumes calculated from the Dubinin-Astakhov equation. The Density Functional Theory (DFT) was applied to obtain the Pore Size Distribution (PSD).

3. Results and Discussions

We start our discussion with the experimental isotherm data for pure component and mixture. Next, we analyze the GCMC simulated isotherms to study the effects of curvature on adsorption. Using these simulated isotherms in the analysis of pure component isotherms we derived pore size distributions (PSD) of activated carbon and carbon nanotube. Finally, these PSDs were used to describe adsorption data of carbon dioxide and methane mixtures.

3.1. Experimental Isotherms

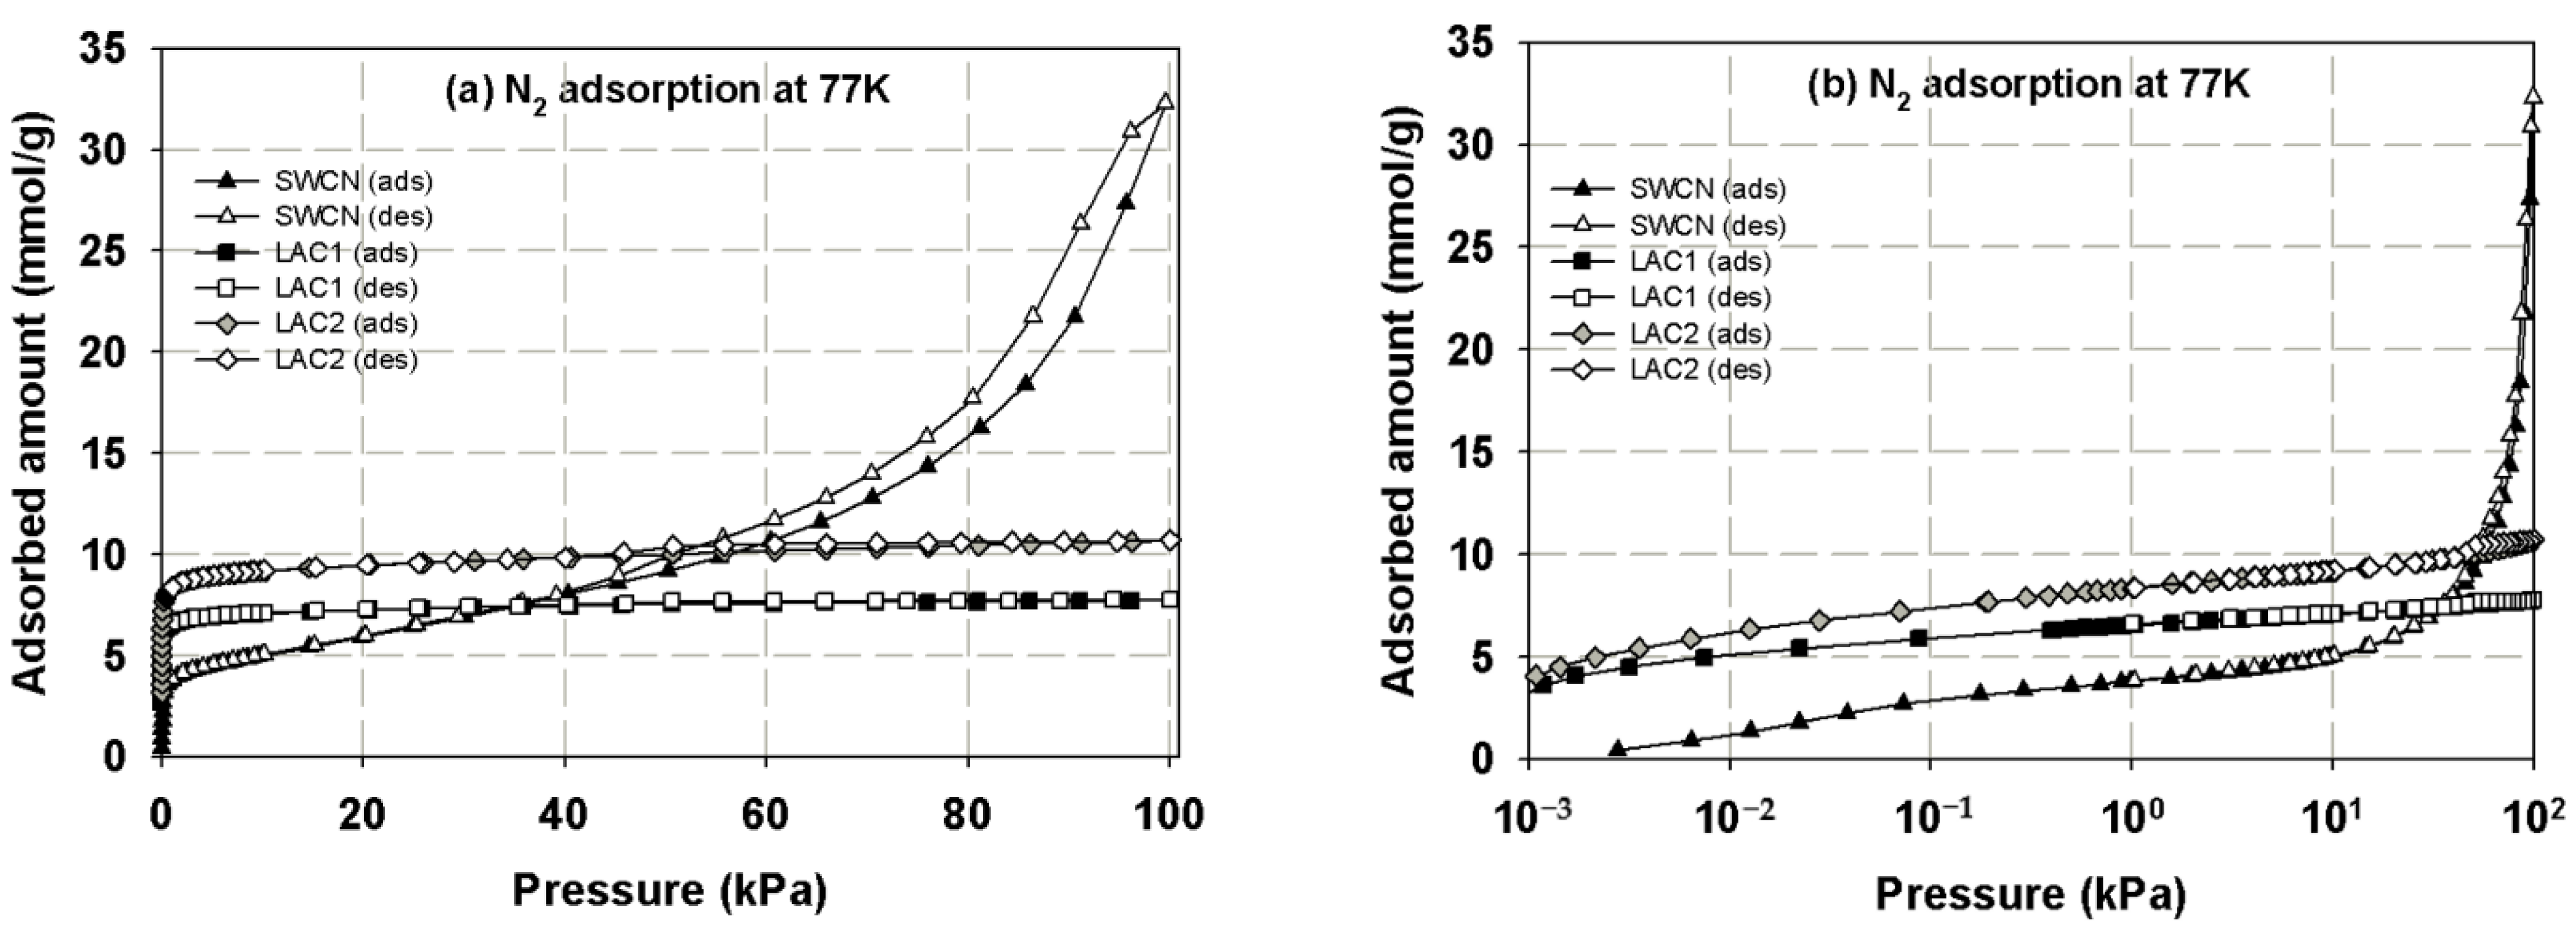
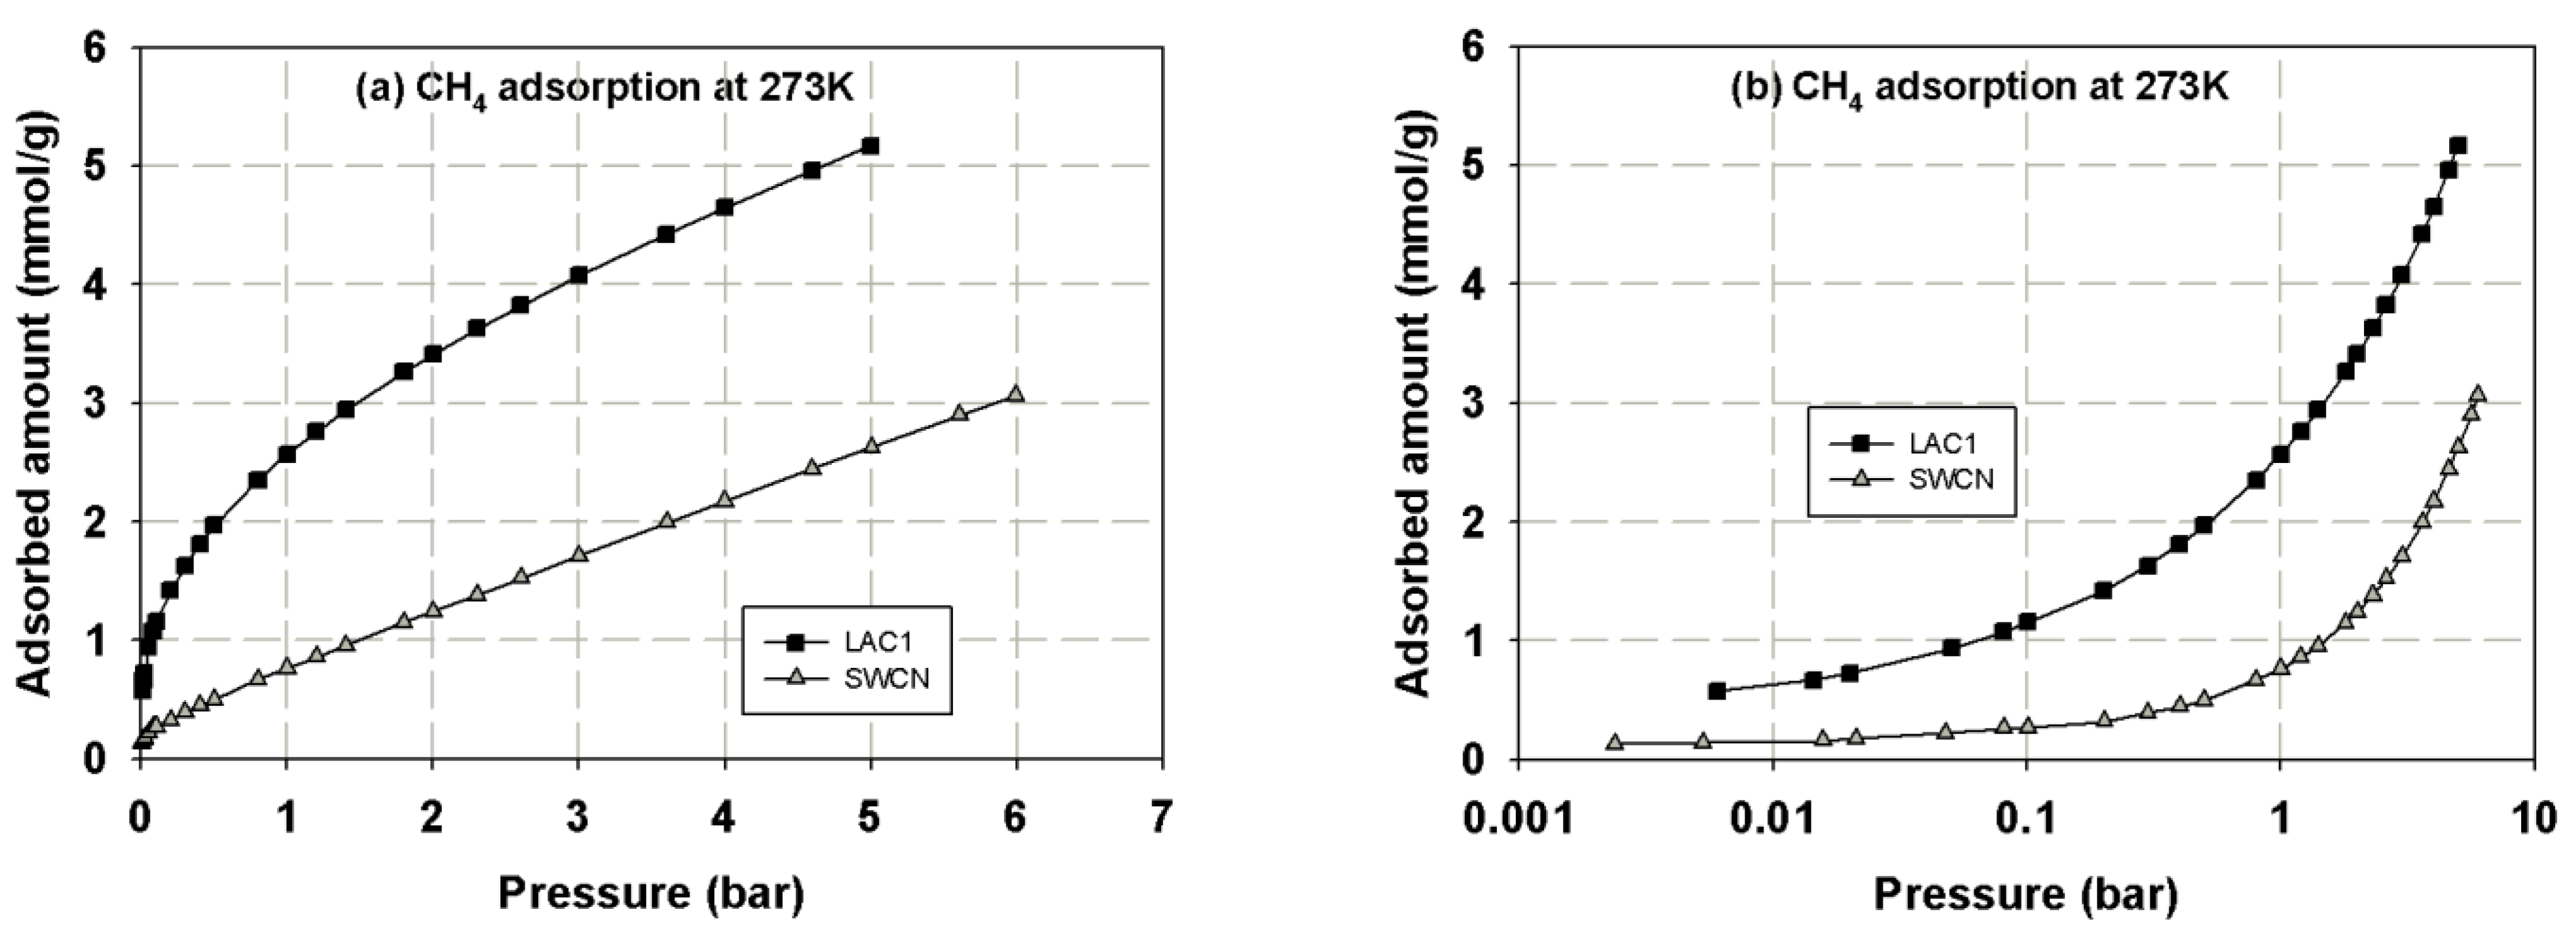
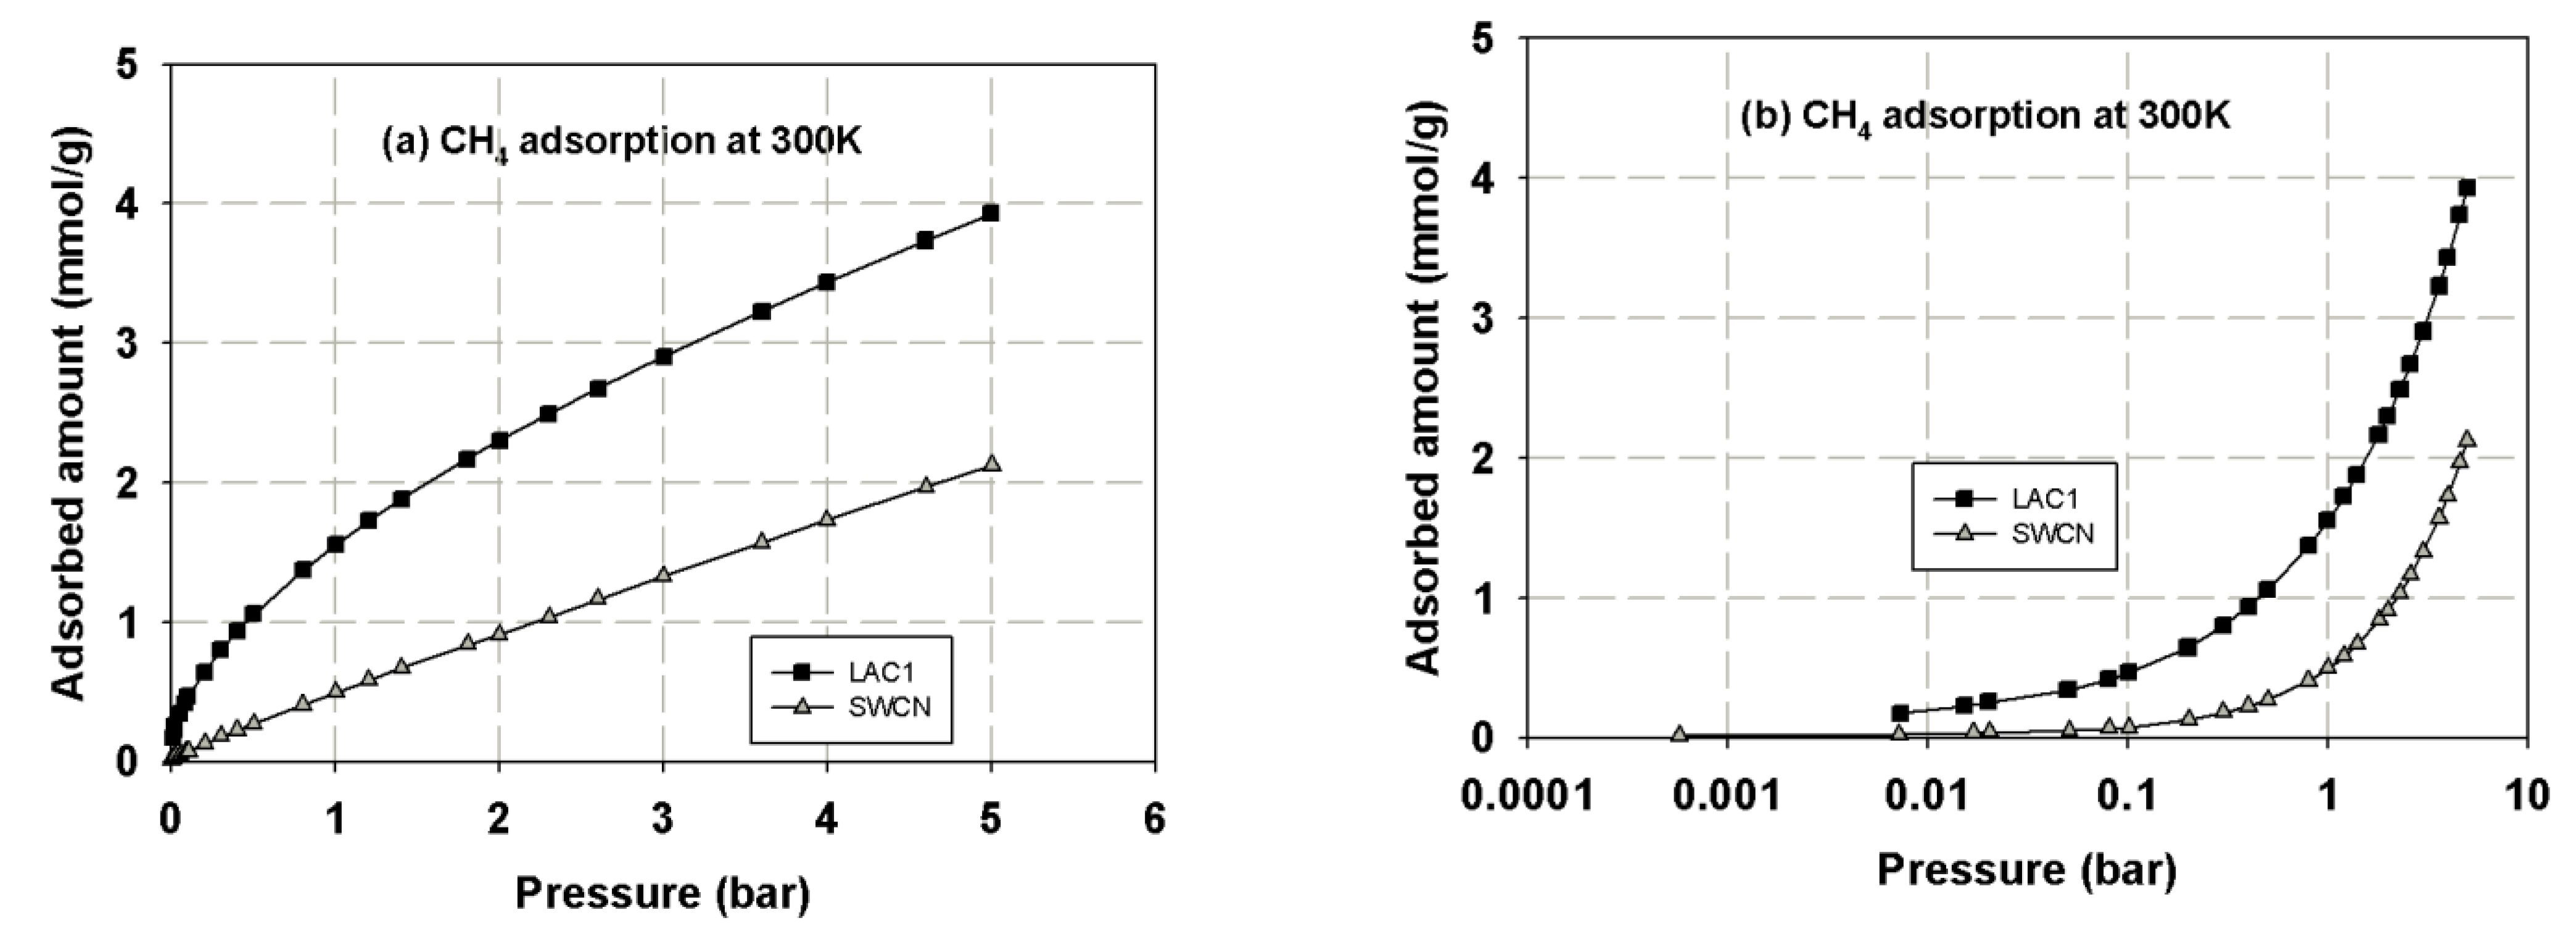
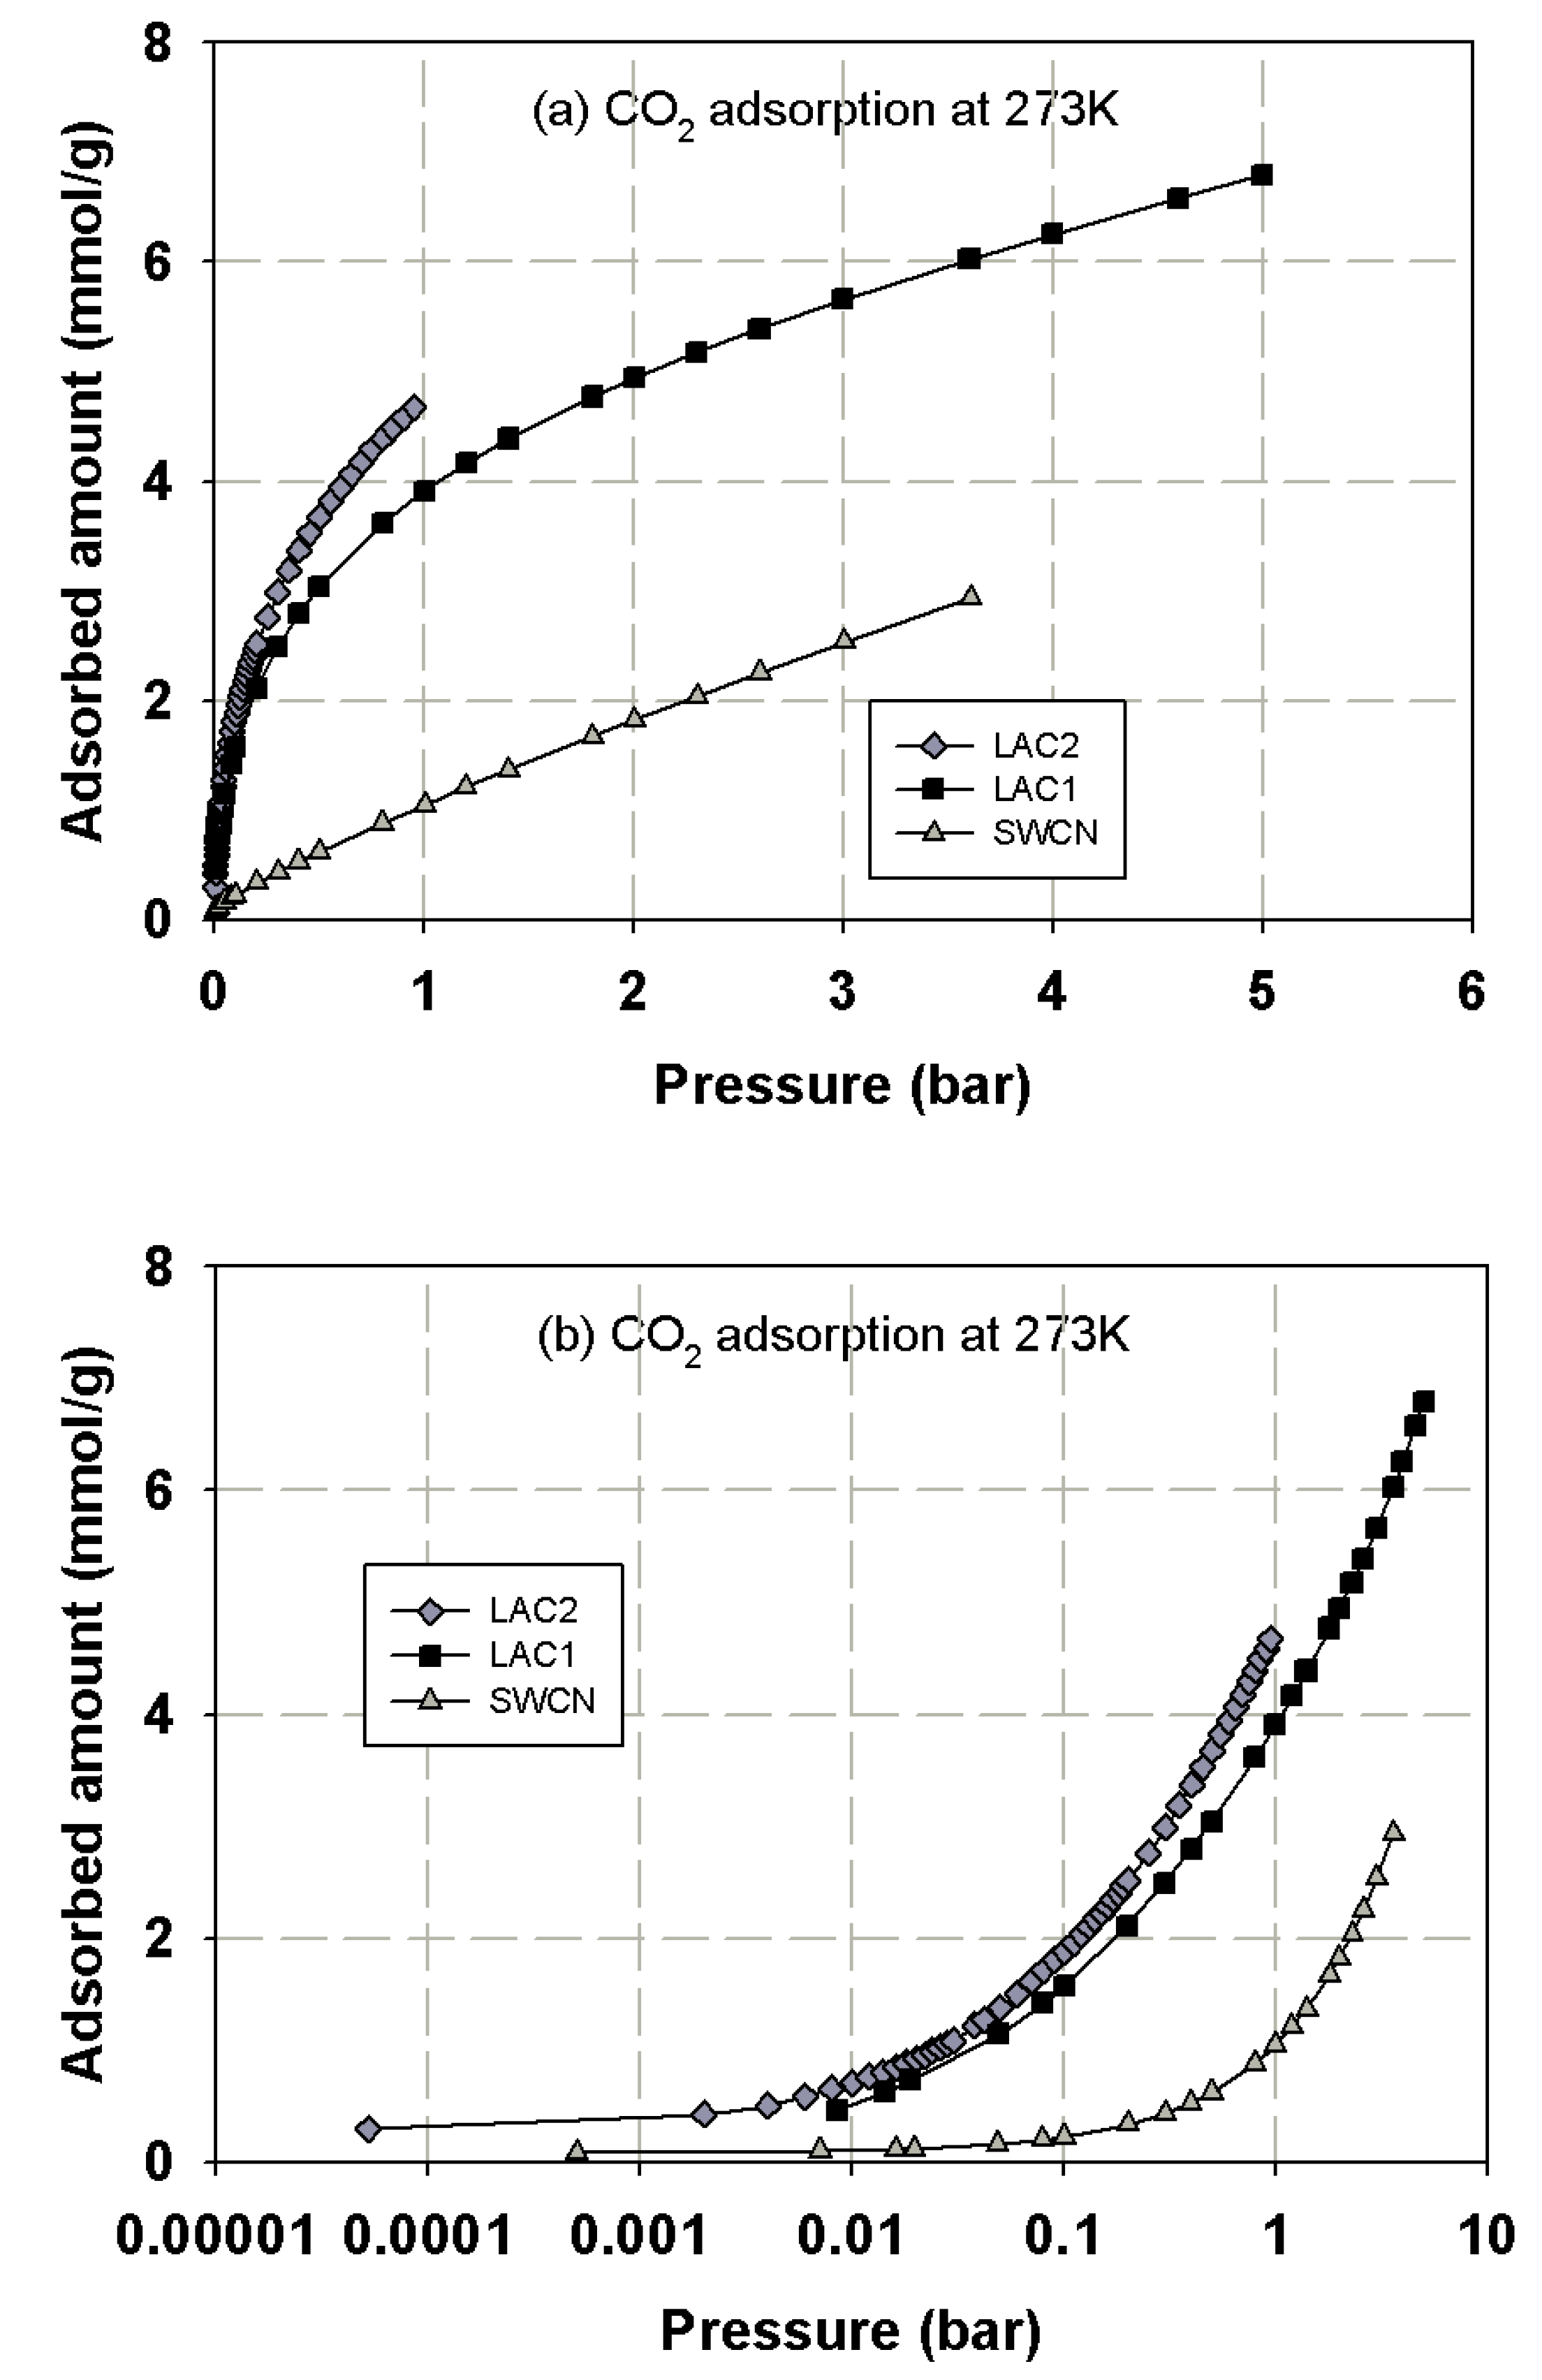
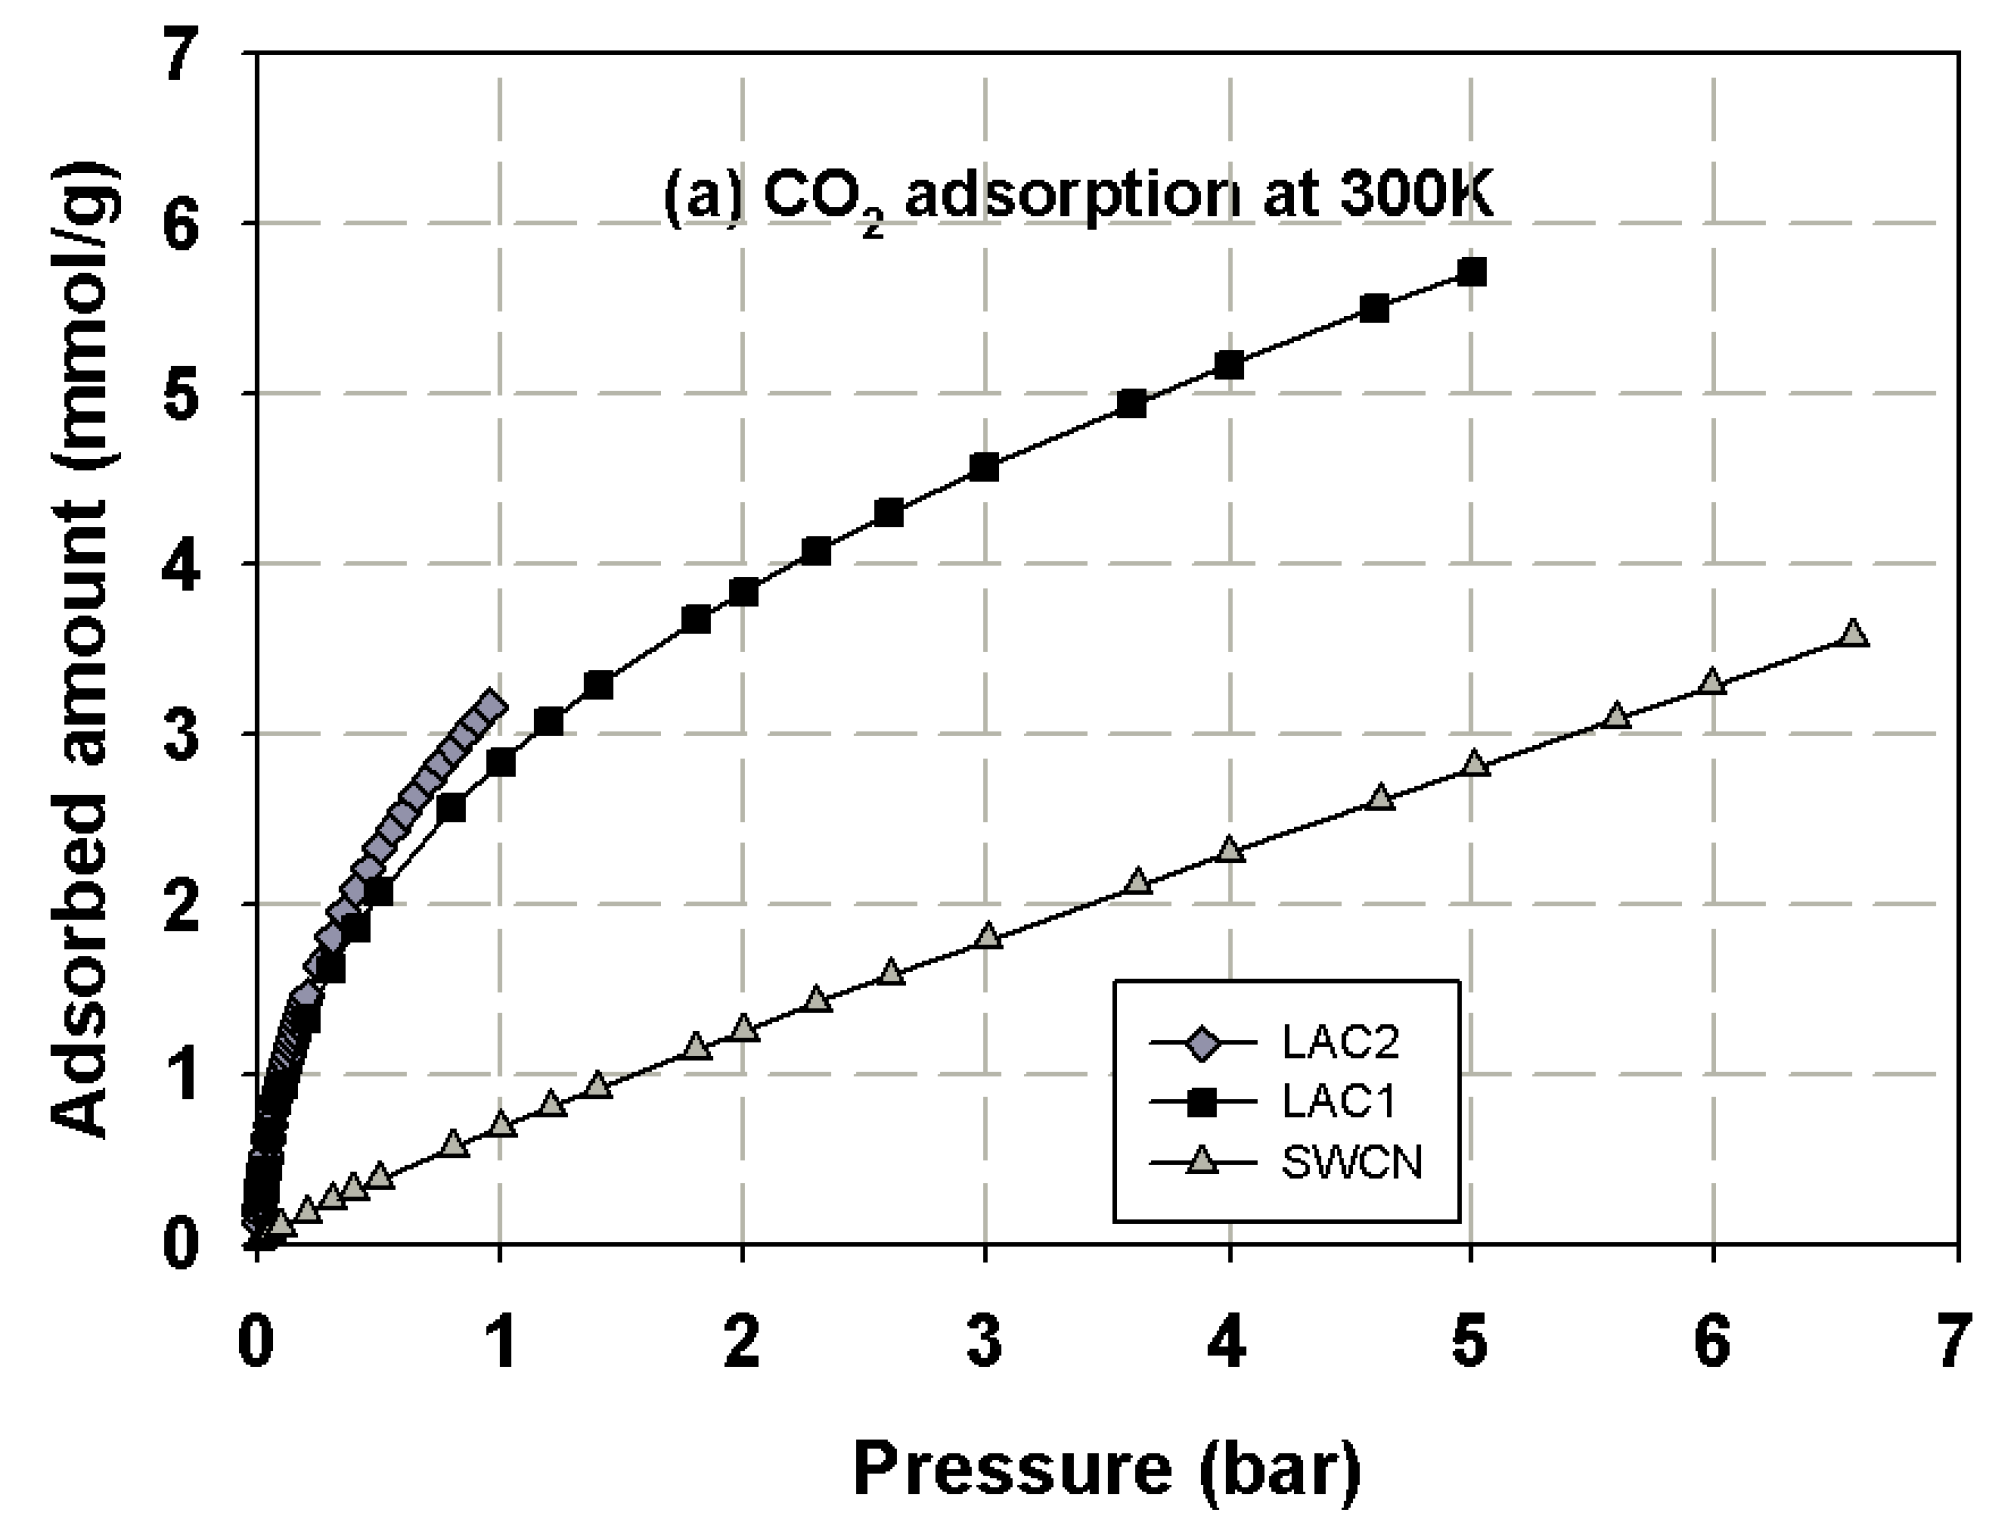
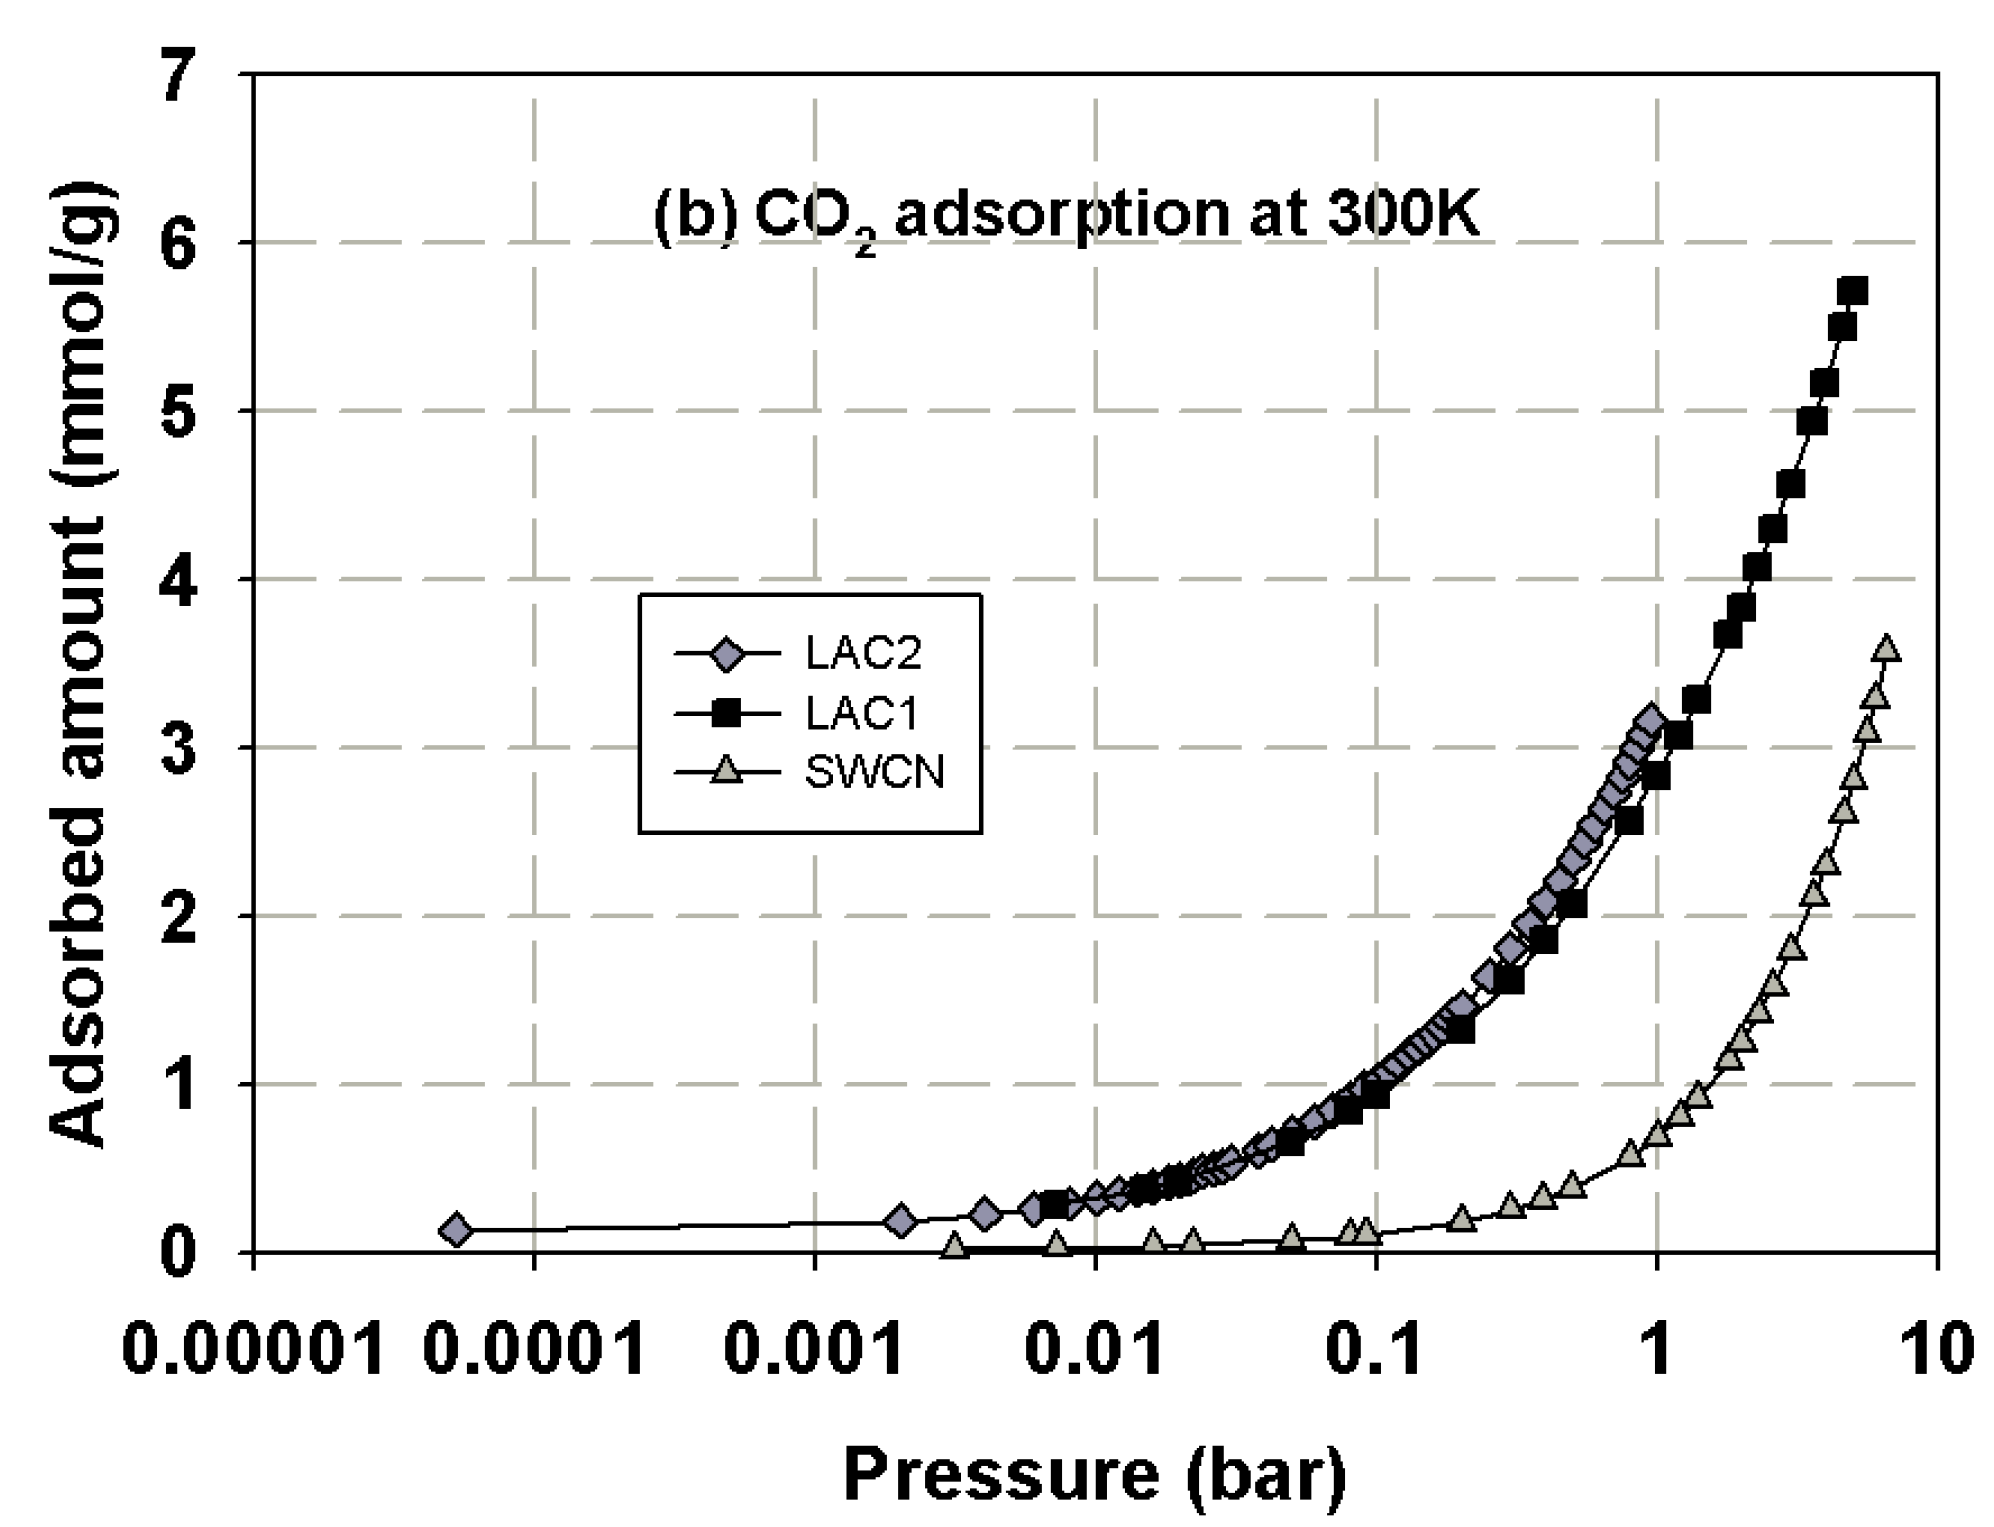
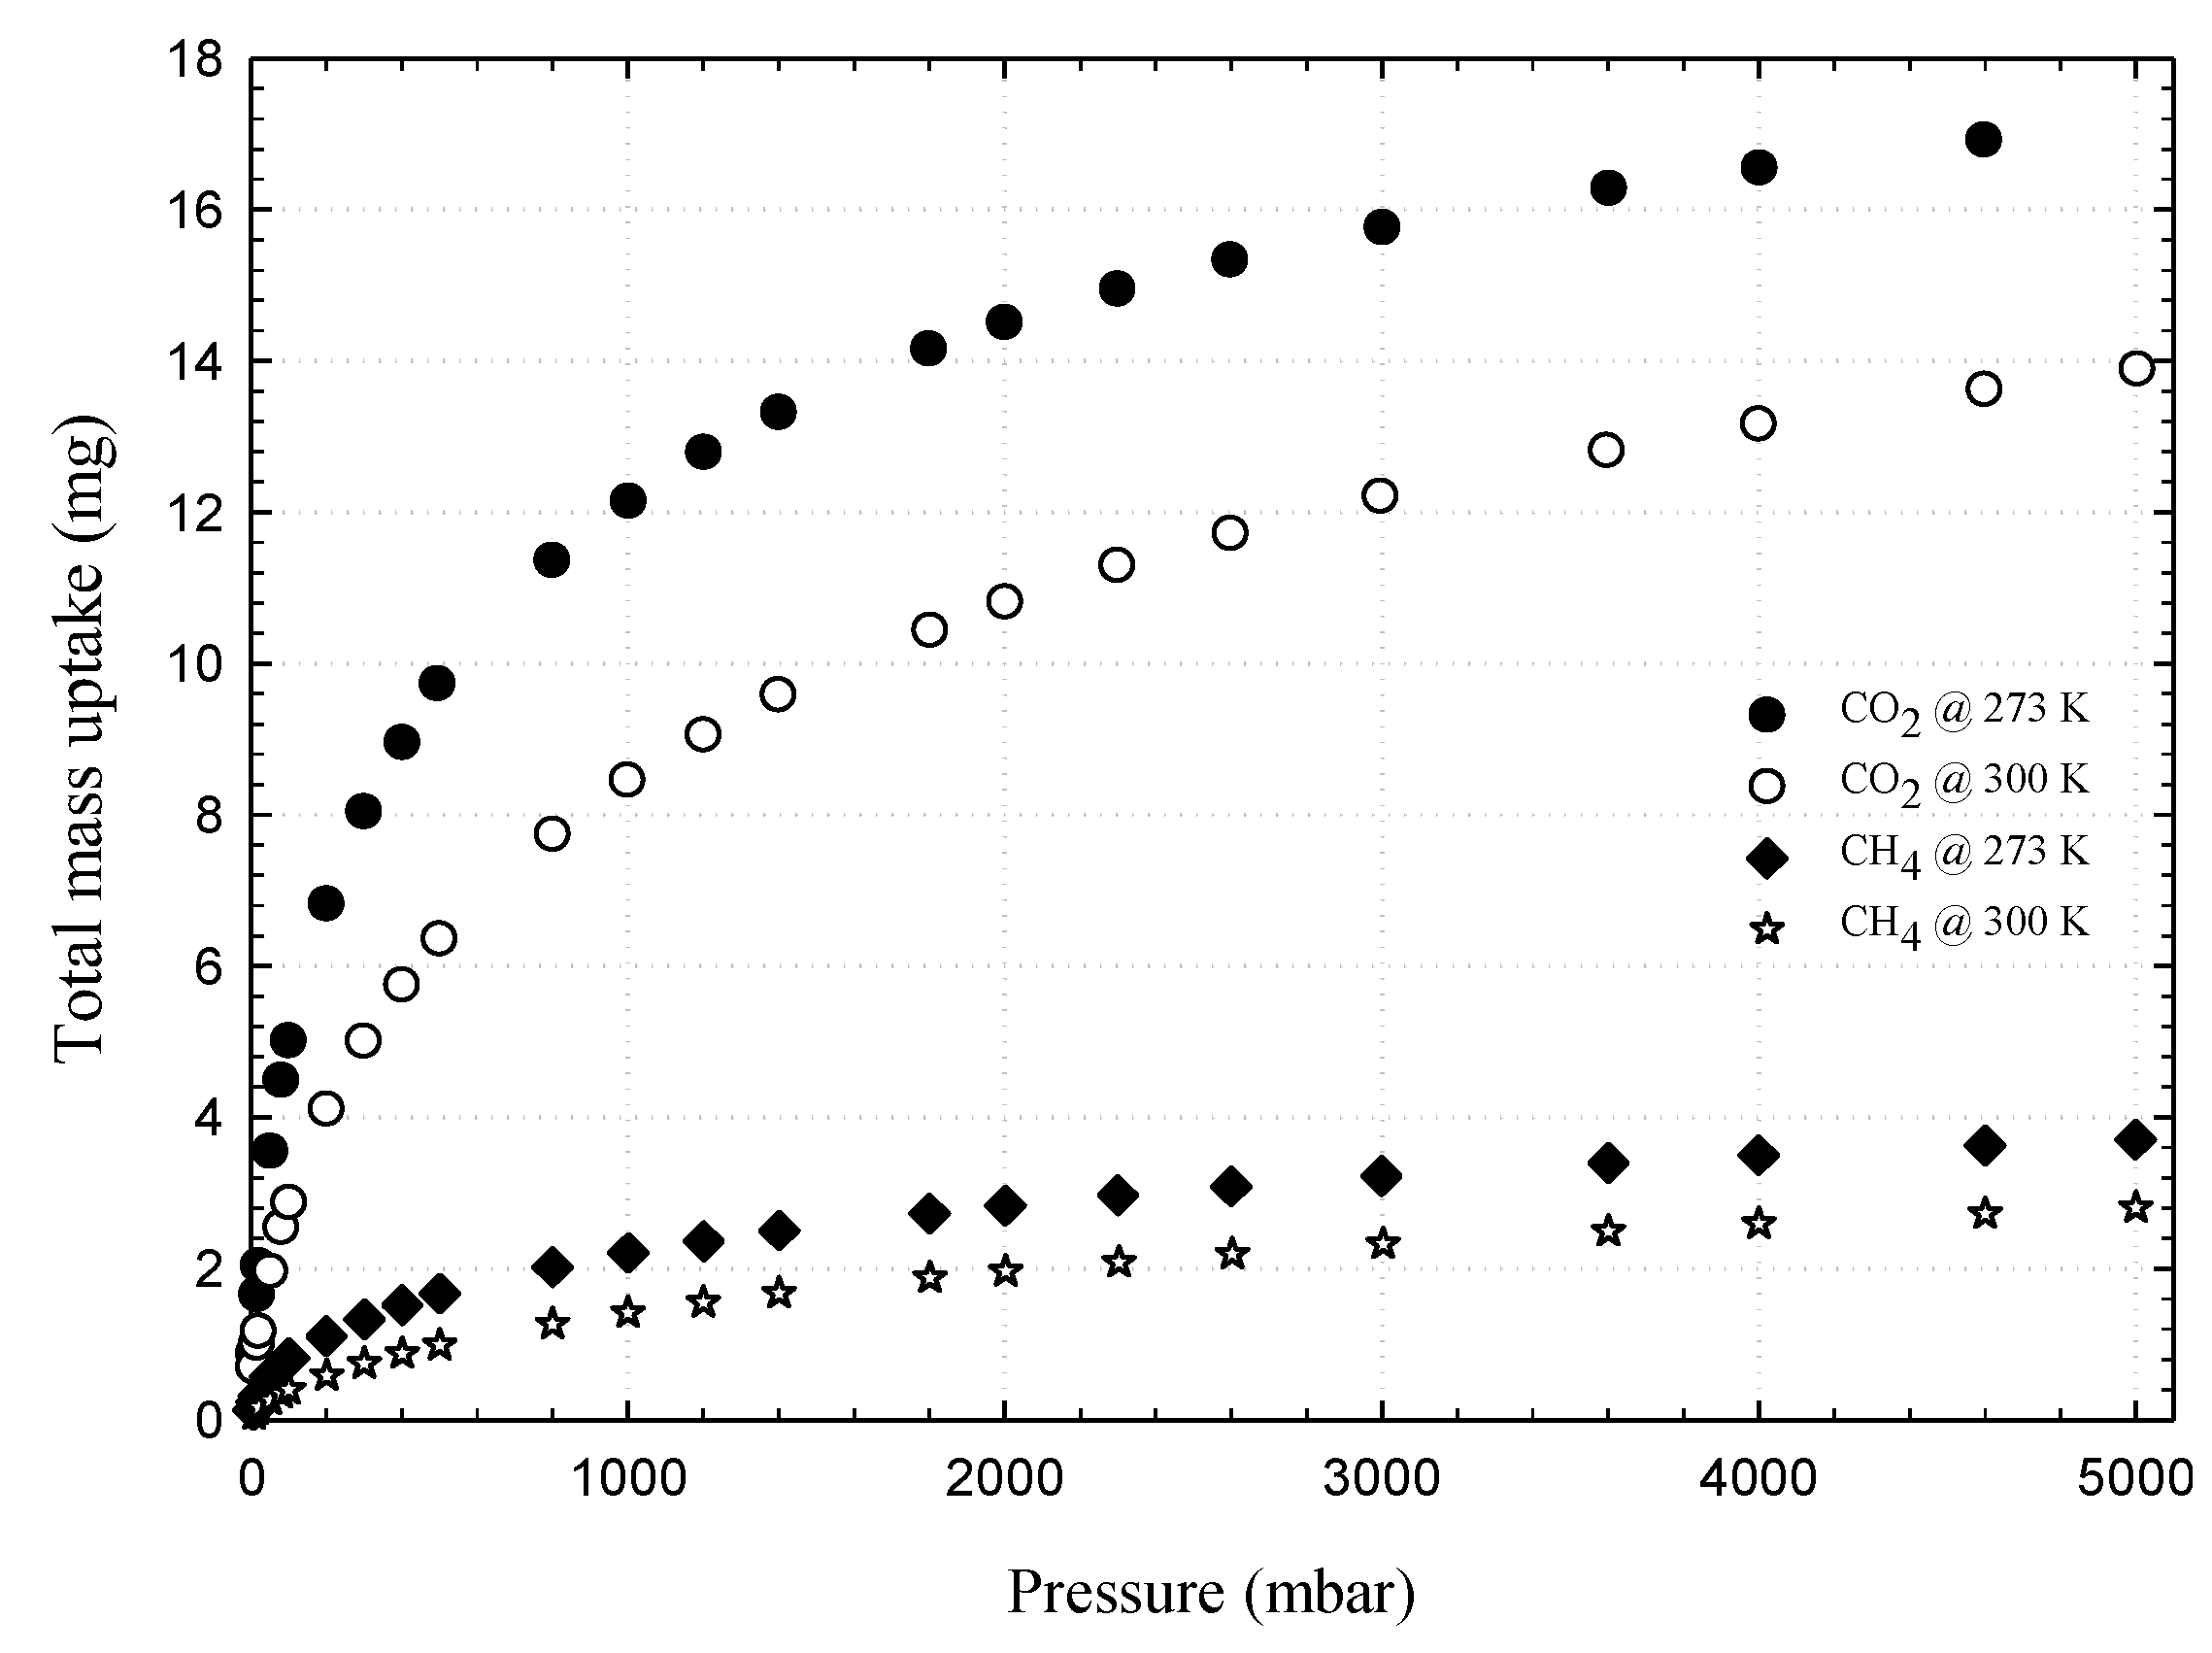
First, we present the adsorption isotherms of nitrogen at 77 K obtained for activated carbons and single wall carbon nanotubes, as presented in Figure 2 and these isotherms are used to determine the porous properties of tested carbons such as BET surface area, micropore volume and total pore volume as shown in Table 3. The adsorption isotherms of methane and carbon dioxide presented as adsorbed amount in mmol/g against pressures at 273 and 300 K for various carbons are presented in Figure 3, Figure 4, Figure 5 and Figure 6, in linear (a) and semi-log (b) scales. We also plot the total mass uptake of both species in LAC1 against pressures at different temperatures as shown in Figure 7 and use these plots to compare with the adsorption of their mixture as shown in Figure 8.
The experimental isotherms for nitrogen adsorption in SWCN, LAC1 and LAC2 at 77 K versus pressure in linear (a) and semi-log (b) scales are shown as upward-triangle, square and diamond symbols, respectively, in Figure 2, and the filled symbols are those for adsorption and unfilled symbols are those for desorption. In the case of SWCN, the experimental data show a negligible adsorption at pressures lower 0.01 bar, and then increase gradually to about 0.2 bar, after which the slope of the isotherm increases steeply. It increases gradually due to the formation of monolayer inside and outside the tubes, and is followed by the dramatic increase in adsorption isotherm which is the result of multilayer adsorption outside the tubes [28]. Unlike SWCN, in the case of activated carbons, the experimental data show a continuous increase of adsorption with pressure at a low pressure range and approaches a constant value at higher pressures, indicating the type I adsorption isotherm. This type I isotherm indicates that the activated carbon used in this study is dominated by microporosity, and a small hysteresis loop is also observed. The porous properties of SWCN and activated carbons used in this study shown in Table 3 are derived by using the Density Functional Theory (DFT) and Dubinin-Astakhov equation which was supplied by Micrometrics together with the experimental data of nitrogen at 77 K. It was found that the specific surface area of SWCN is 853 m2/g and the total pore volume is 1.29 cm3/g, which are higher than LACs. The SWCN seems to be composed of mesopores and macropores, which is different from those of activated carbon, which contained mostly micropores.
The same behavior can be observed for carbon dioxide and methane; the experimental data show a continuous pore filling mechanism which is a typical isotherm observed for many micropore adsorbents. However, there is no sharp change of phase transition observed under this temperature conditions. It is noted that this adsorption behavior of the studied fluids occurs at pressure lower than the saturated pressure. The adsorption of CO2 and CH4 in activated carbon is greater than that in SWCN. This is due to the smaller average pore size of activated carbon, which leads to the stronger interaction between fluid and pore wall, hence giving the increase in the adsorbed amounts of CH4 and CO2 for activated carbons. Therefore, the pore size of porous carbon is one of the deciding factors to be considered for the adsorption of CH4 and CO2. The effects of pore size on adsorption isotherm of fluid are presented in the next section.
Figure 7 shows the experimental adsorption isotherms obtained from IGA for carbon dioxide and methane in Longan seed activated carbon (LAC1) at 273 and 300 K. The adsorbed amount is presented in mass uptake (mg) as a function of pressure that varied from 5 mbar to 5000 mbar (0.5 MPa). For the adsorption of carbon dioxide, the mass uptake curves for the adsorption at 273 and 300 K and the pressure up to 5000 mbar resemble the initial part of the Type I isotherm, thus indicating the adsorption by micropore filling in LAC1 activated carbon [24,36,37,38]. It is further noted that the adsorbed amount at 273 K is higher than 300 K, showing the characteristic of physical adsorption with the liberation of heat and that the adsorbed molecules acquire the greater energy to evaporate [24,39]. For methane adsorption, the behavior of these isotherms is similar to carbon dioxide but their mass uptakes are much less because of the different in molecular structure. Methane molecules do not possess quadrupole moment from electrical charge as do the carbon dioxide molecules [29]. Therefore, the intermolecular force between solid surface and fluid molecule of methane are weaker than those of carbon dioxide, resulting in the differences of adsorption behavior of these two gases [40,41].
It has been reported in the literature that the adsorbed amount of methane in the carbon fiber obtained from petroleum pitch activated with CO2 and 73% burn-off degree (having surface area of 2400 m2/g) were 163 v/v and 143 v/v for CH4 uptake and delivered at 25° and 3.5 MPa), respectively [15]. The volumetric methane uptake and delivery values for the activated carbon fibers prepared from a commercial carbon fiber activated with CO2 and 74% burn-off degree (having surface area of 2862 m2/g) were 166 v/v and 150 v/v., respectively [15]. The storage capacities of CO2 and CH4 on activated carbons derived from agricultural wastes such as peanut shell were 3.63 and 1.38 mmol/g, respectively, while those derived from metasequoia leaf were 2.26 and 0.89 mmol/g, respectively, at 1 bar and 40 °C [3]. In this study, the activated carbons derived from longan seed, LAC1 and LAC2, have the CO2 capture capacities of 4.0 and 4.7 mmol/g at 1 bar and 273 K (0 °C), respectively, and those of 2.9 and 3.2 mmol/g at 1 bar and 300 K (27 °C). The CH4 storage capacities of LAC1 at 1 bar were 2.6 and 1.7 mmol/g at temperature of 273 and 300 K, respectively. When pressure increased to 5 bar (0.5 MPa), the CH4 capacities on LAC1 increased to 5.2 and 3.9 mmol/g at 273 and 300 K, respectively. The surface area obtained for AC derived from peanut shell and metasequoia leaf were 790 and 496 m2/g, respectively [3], while those of LAC1 and LAC2 were 538 and 705 m2/g, respectively. As one can see, the activated carbons derived from agricultural waste have less surface area compared with those obtained from petroleum pitch and commercial carbons; therefore, the surface area and micropore size distribution are the key factors to prepare the carbon materials for energy storage [15,16]. Preparation of activated carbons derived from agricultural wastes to achieve the US Department of Energy (US DOE) standard for methane storage will be investigated in our next study.
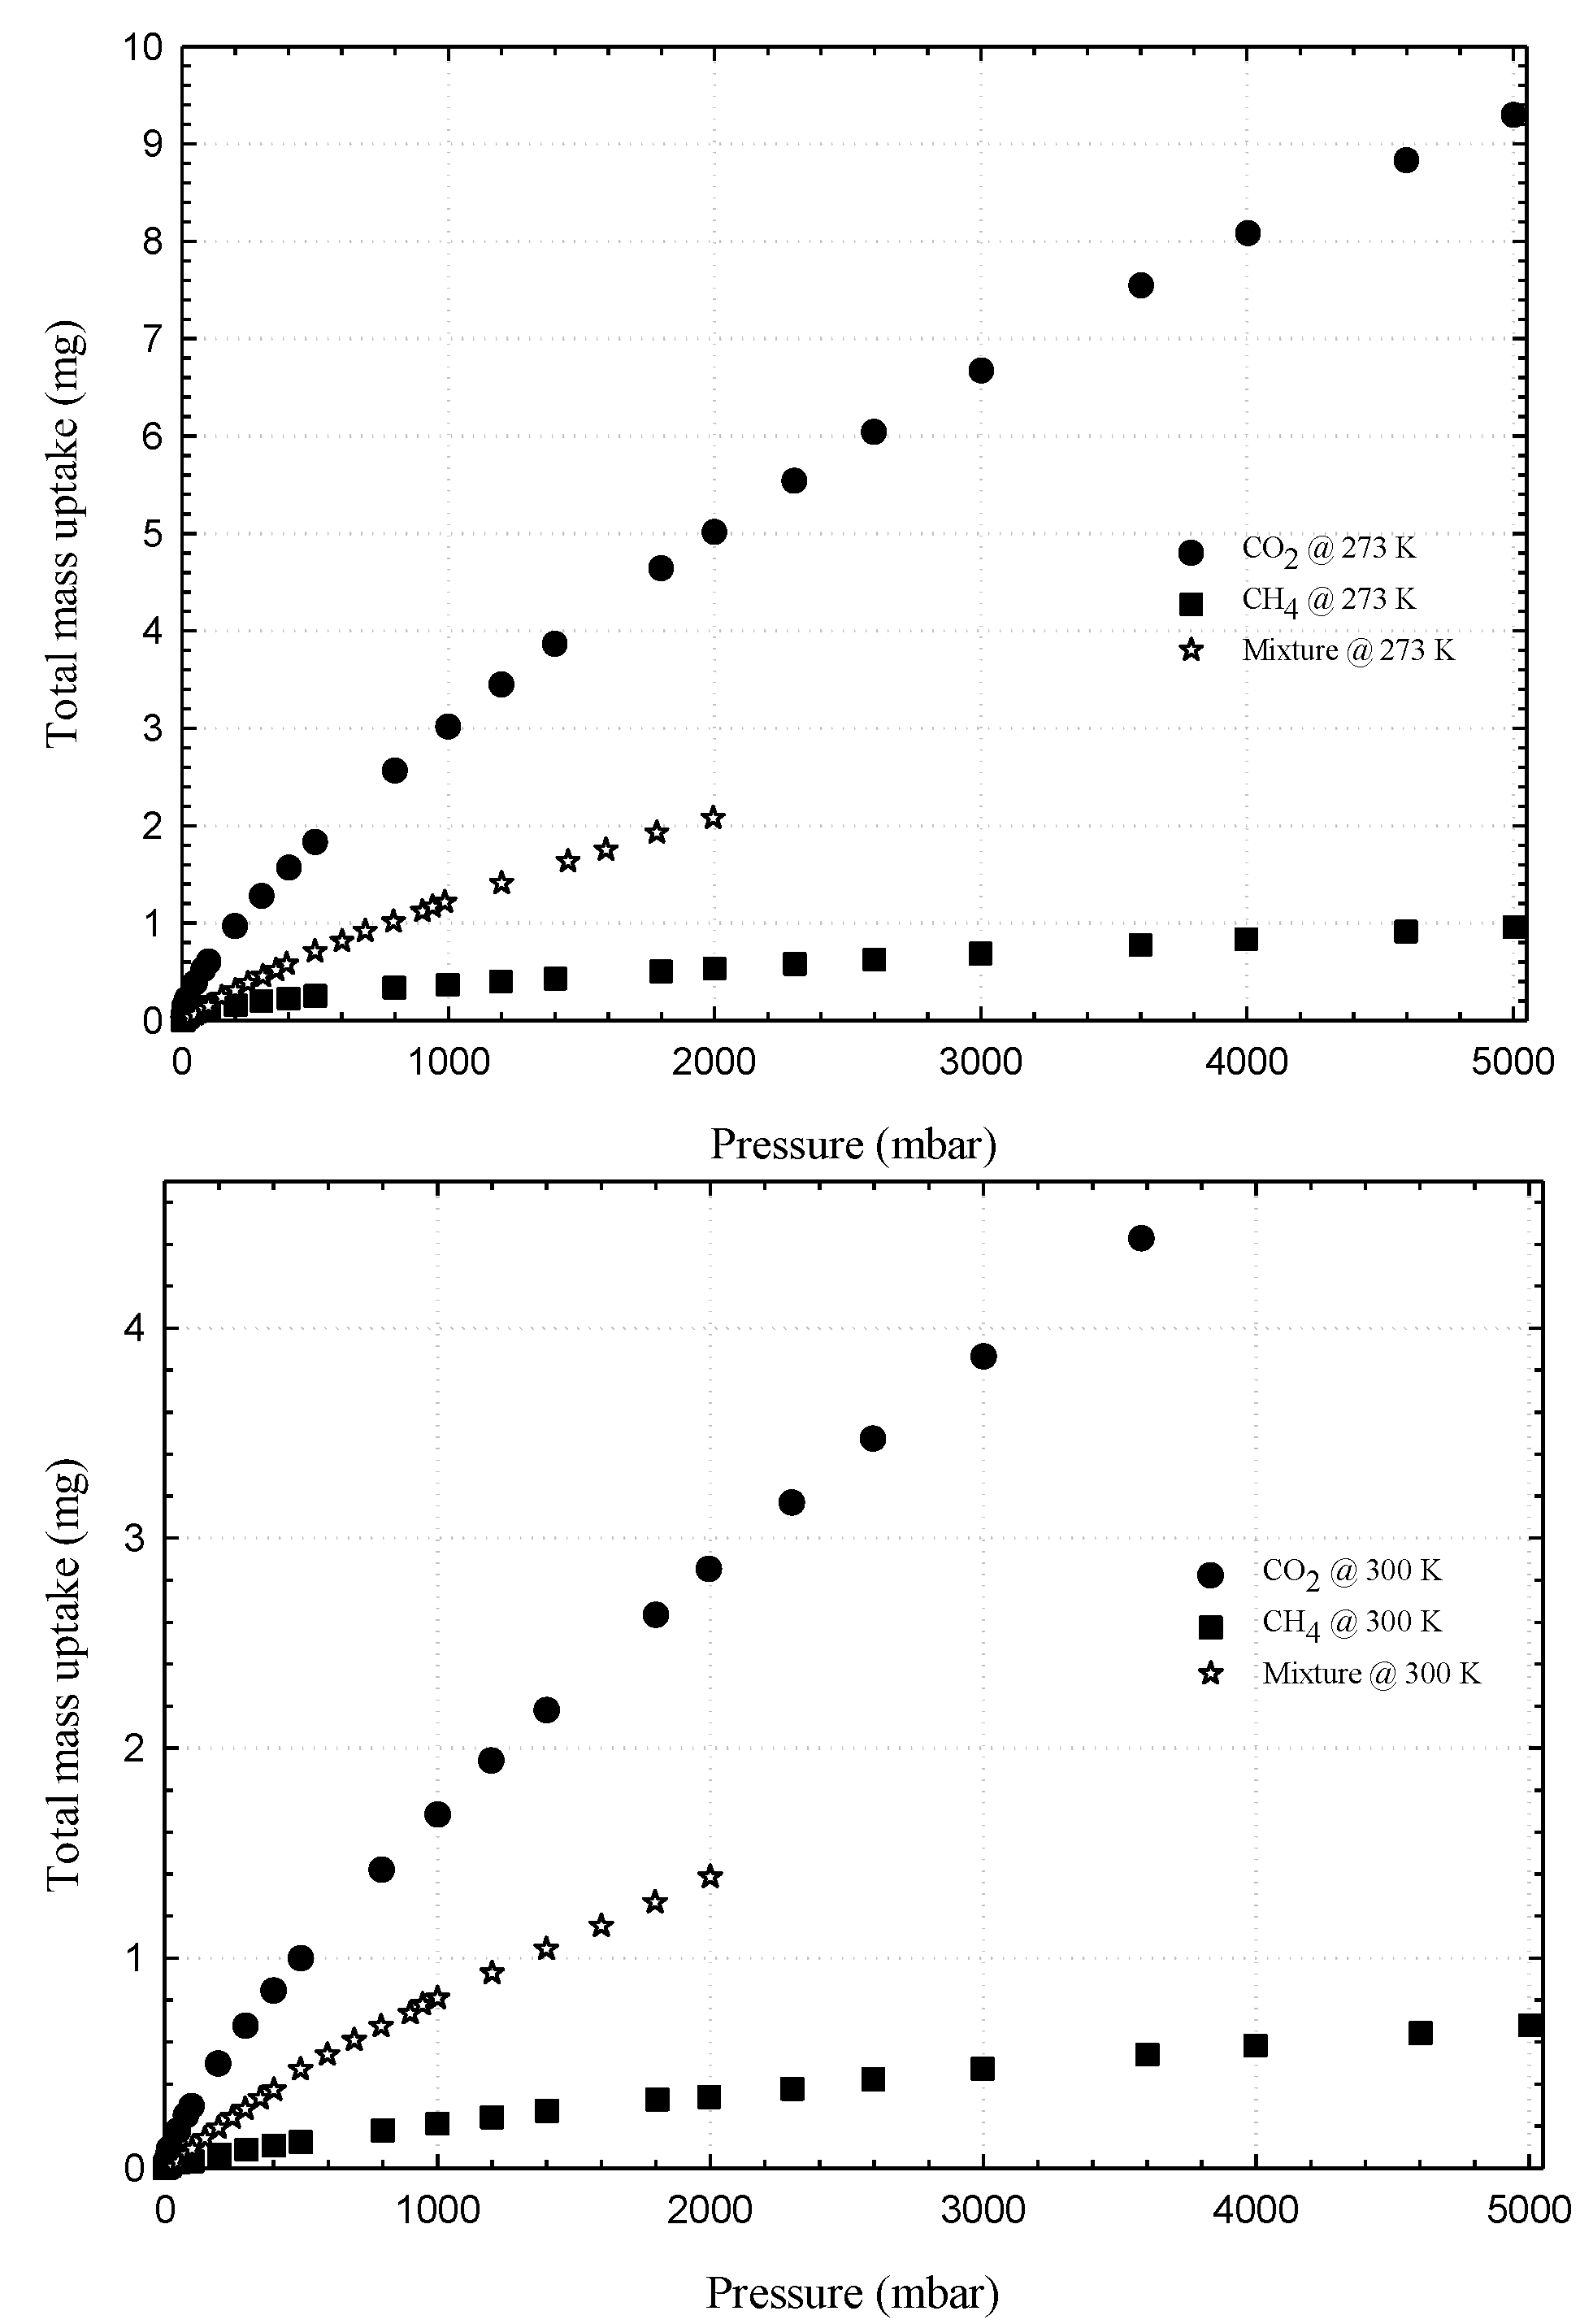
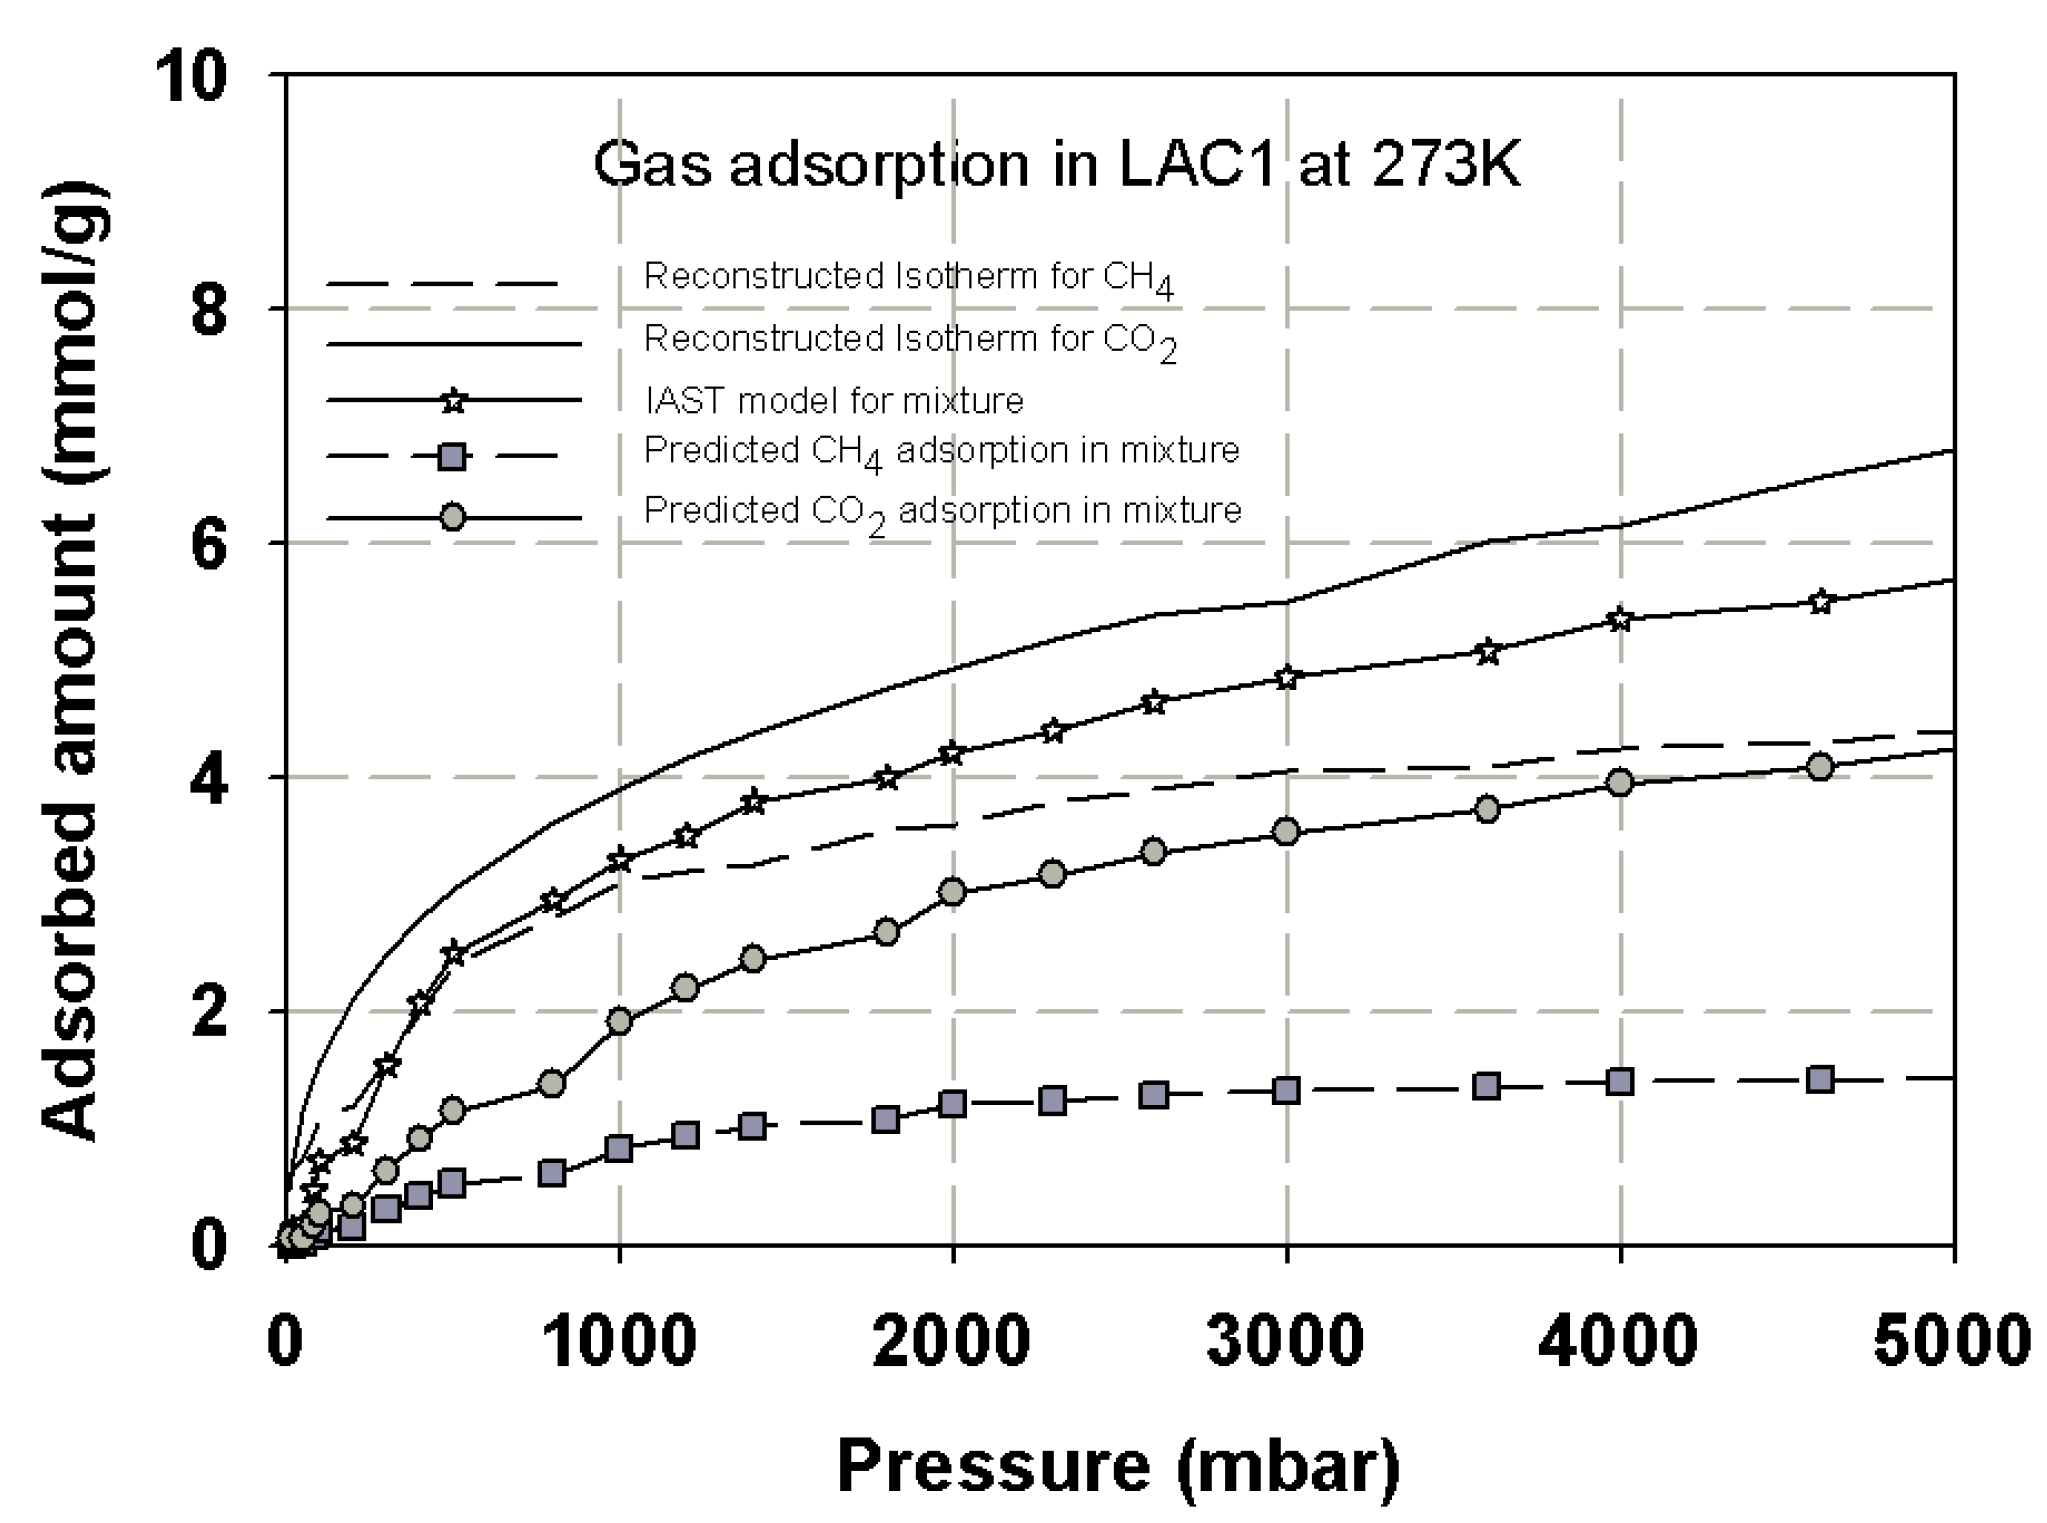
Coadsorption equilibria of CO2/CH4 gas mixture with equi-molar feed composition on LAC1 and SWCN were measured at temperature of 273, and the results are presented in Figure 8 and Figure 9, respectively. These figures show the plot between total mass adsorbed of mixture and pressure; for comparison, the adsorption isotherm of pure components are also plotted in the same figure. In the case of gas mixture adsorption, the isotherm takes the same shape as that of the pure component adsorption and lies between the pure component adsorption of carbon dioxide and methane as shown in the figure. Due to the limitation of our instrument, the adsorption uptake of each component could not be separately measured; thus, only the total mass adsorbed of the mixed gases could be registered. However, the isotherm of gas mixture does indicate that carbon dioxide is more strongly adsorbed than methane due to its higher boiling point and the possession of a quadrupole moment [7,42,43]. It has been reported in the literature that, if concentrations of this binary gas mixture are varied, the total adsorbed amount will decrease with a decreasing of carbon dioxide concentration in the mixture [42,43,44,45]. CO2 and CO2/CH4 mixture adsorption in SWCN at high pressures behave as Langmuir isotherm, and this is due to the formation of monolayer inside the tubes [37]. In Figure 9, the isotherm of carbon dioxide, methane and their binary mixture adsorption tend to show similar behavior; the adsorbed amount at 273 K is larger than 300 K from reason of exothermic process as described in previous section.

3.2. Simulation Isotherm for Gas Adsorption in Finite-Length Slit Pore

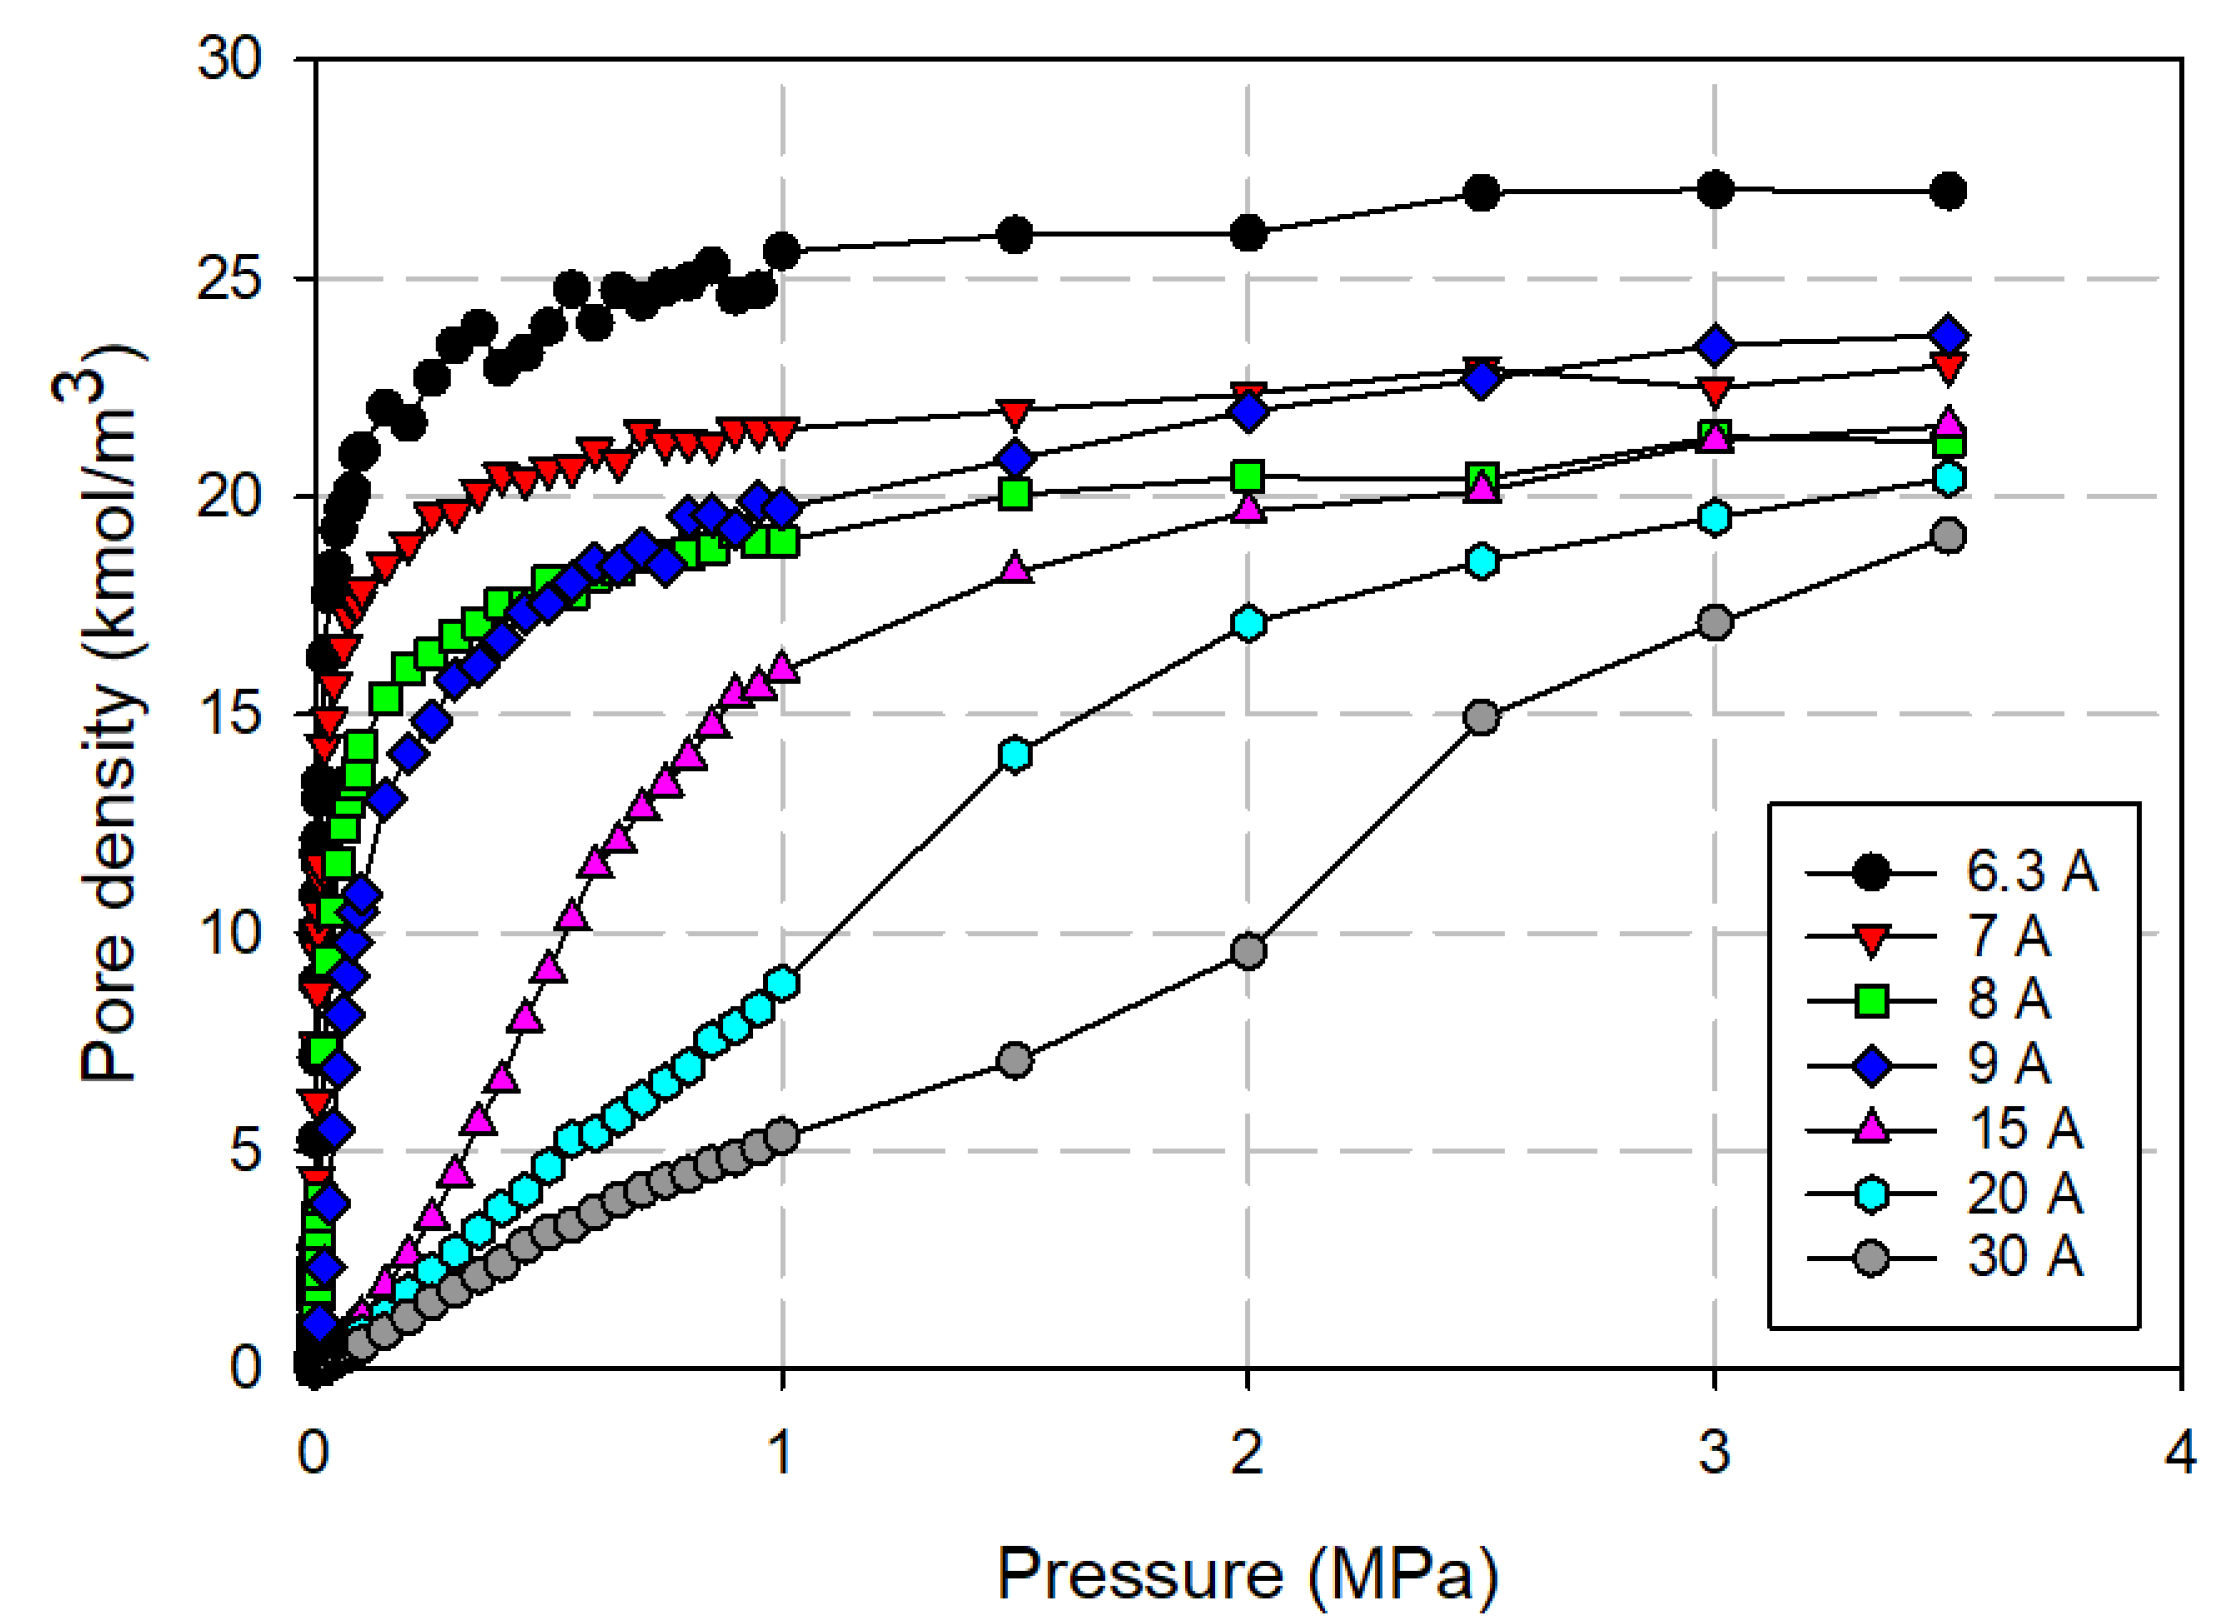
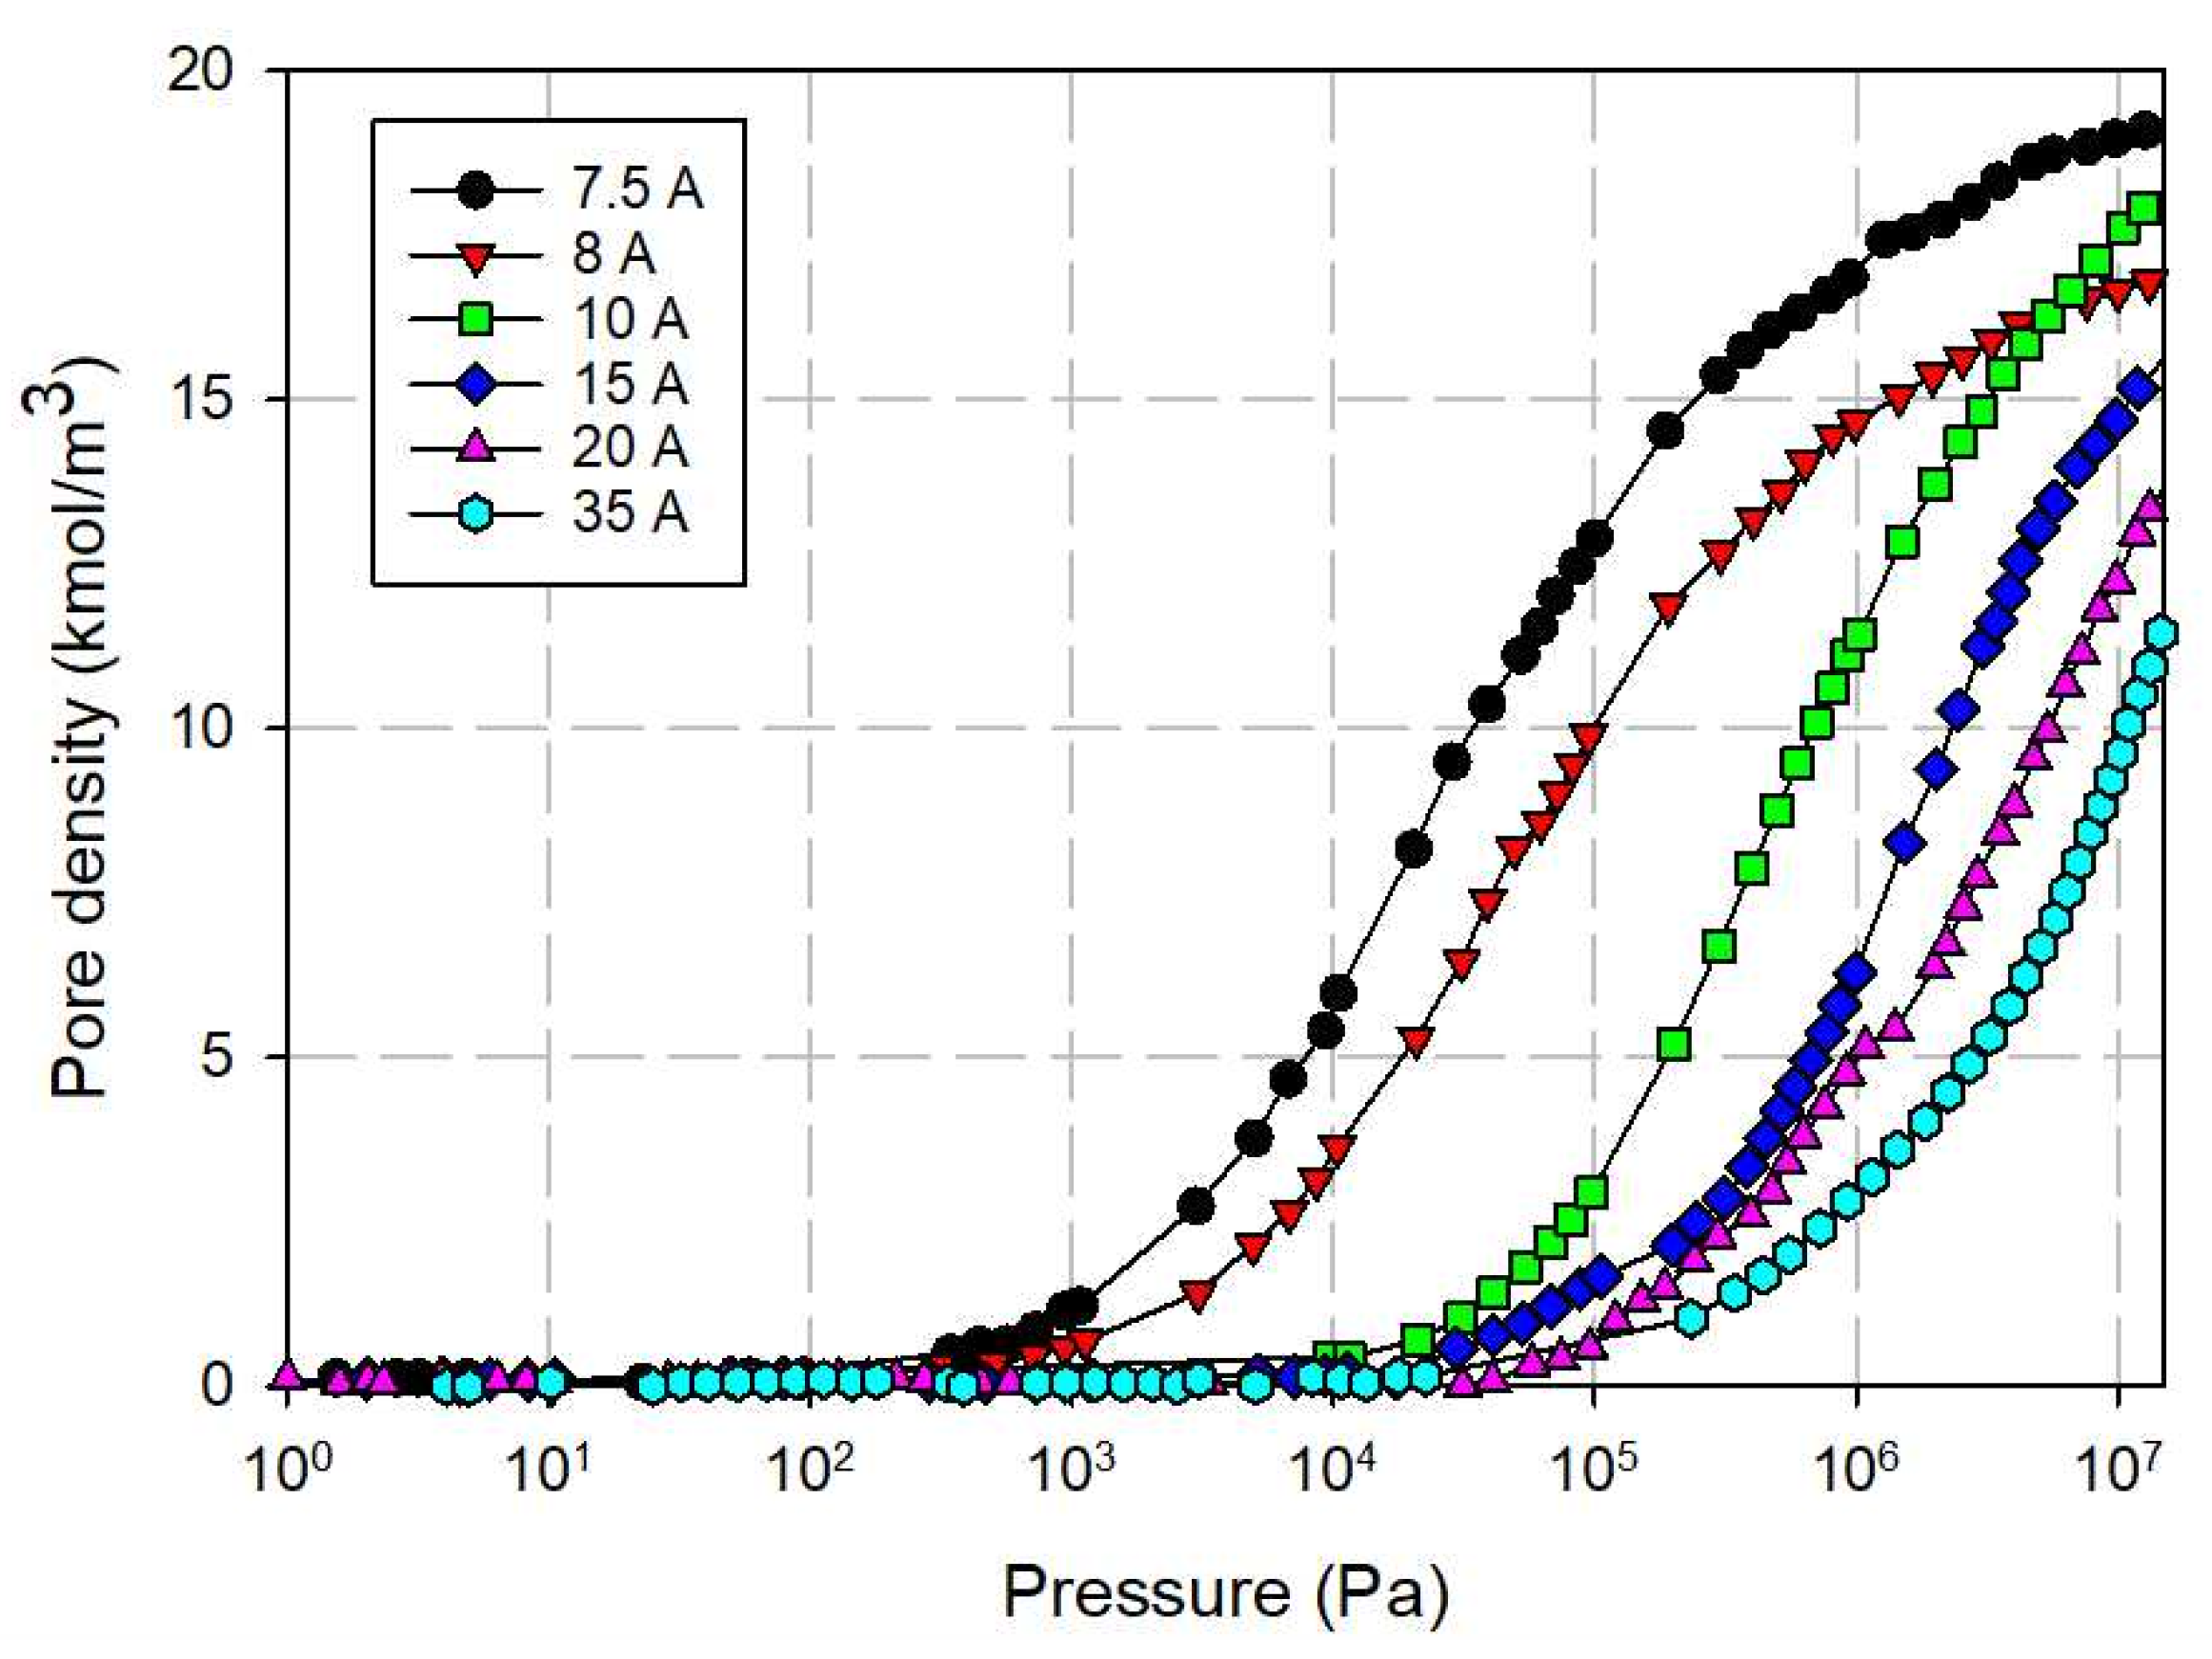
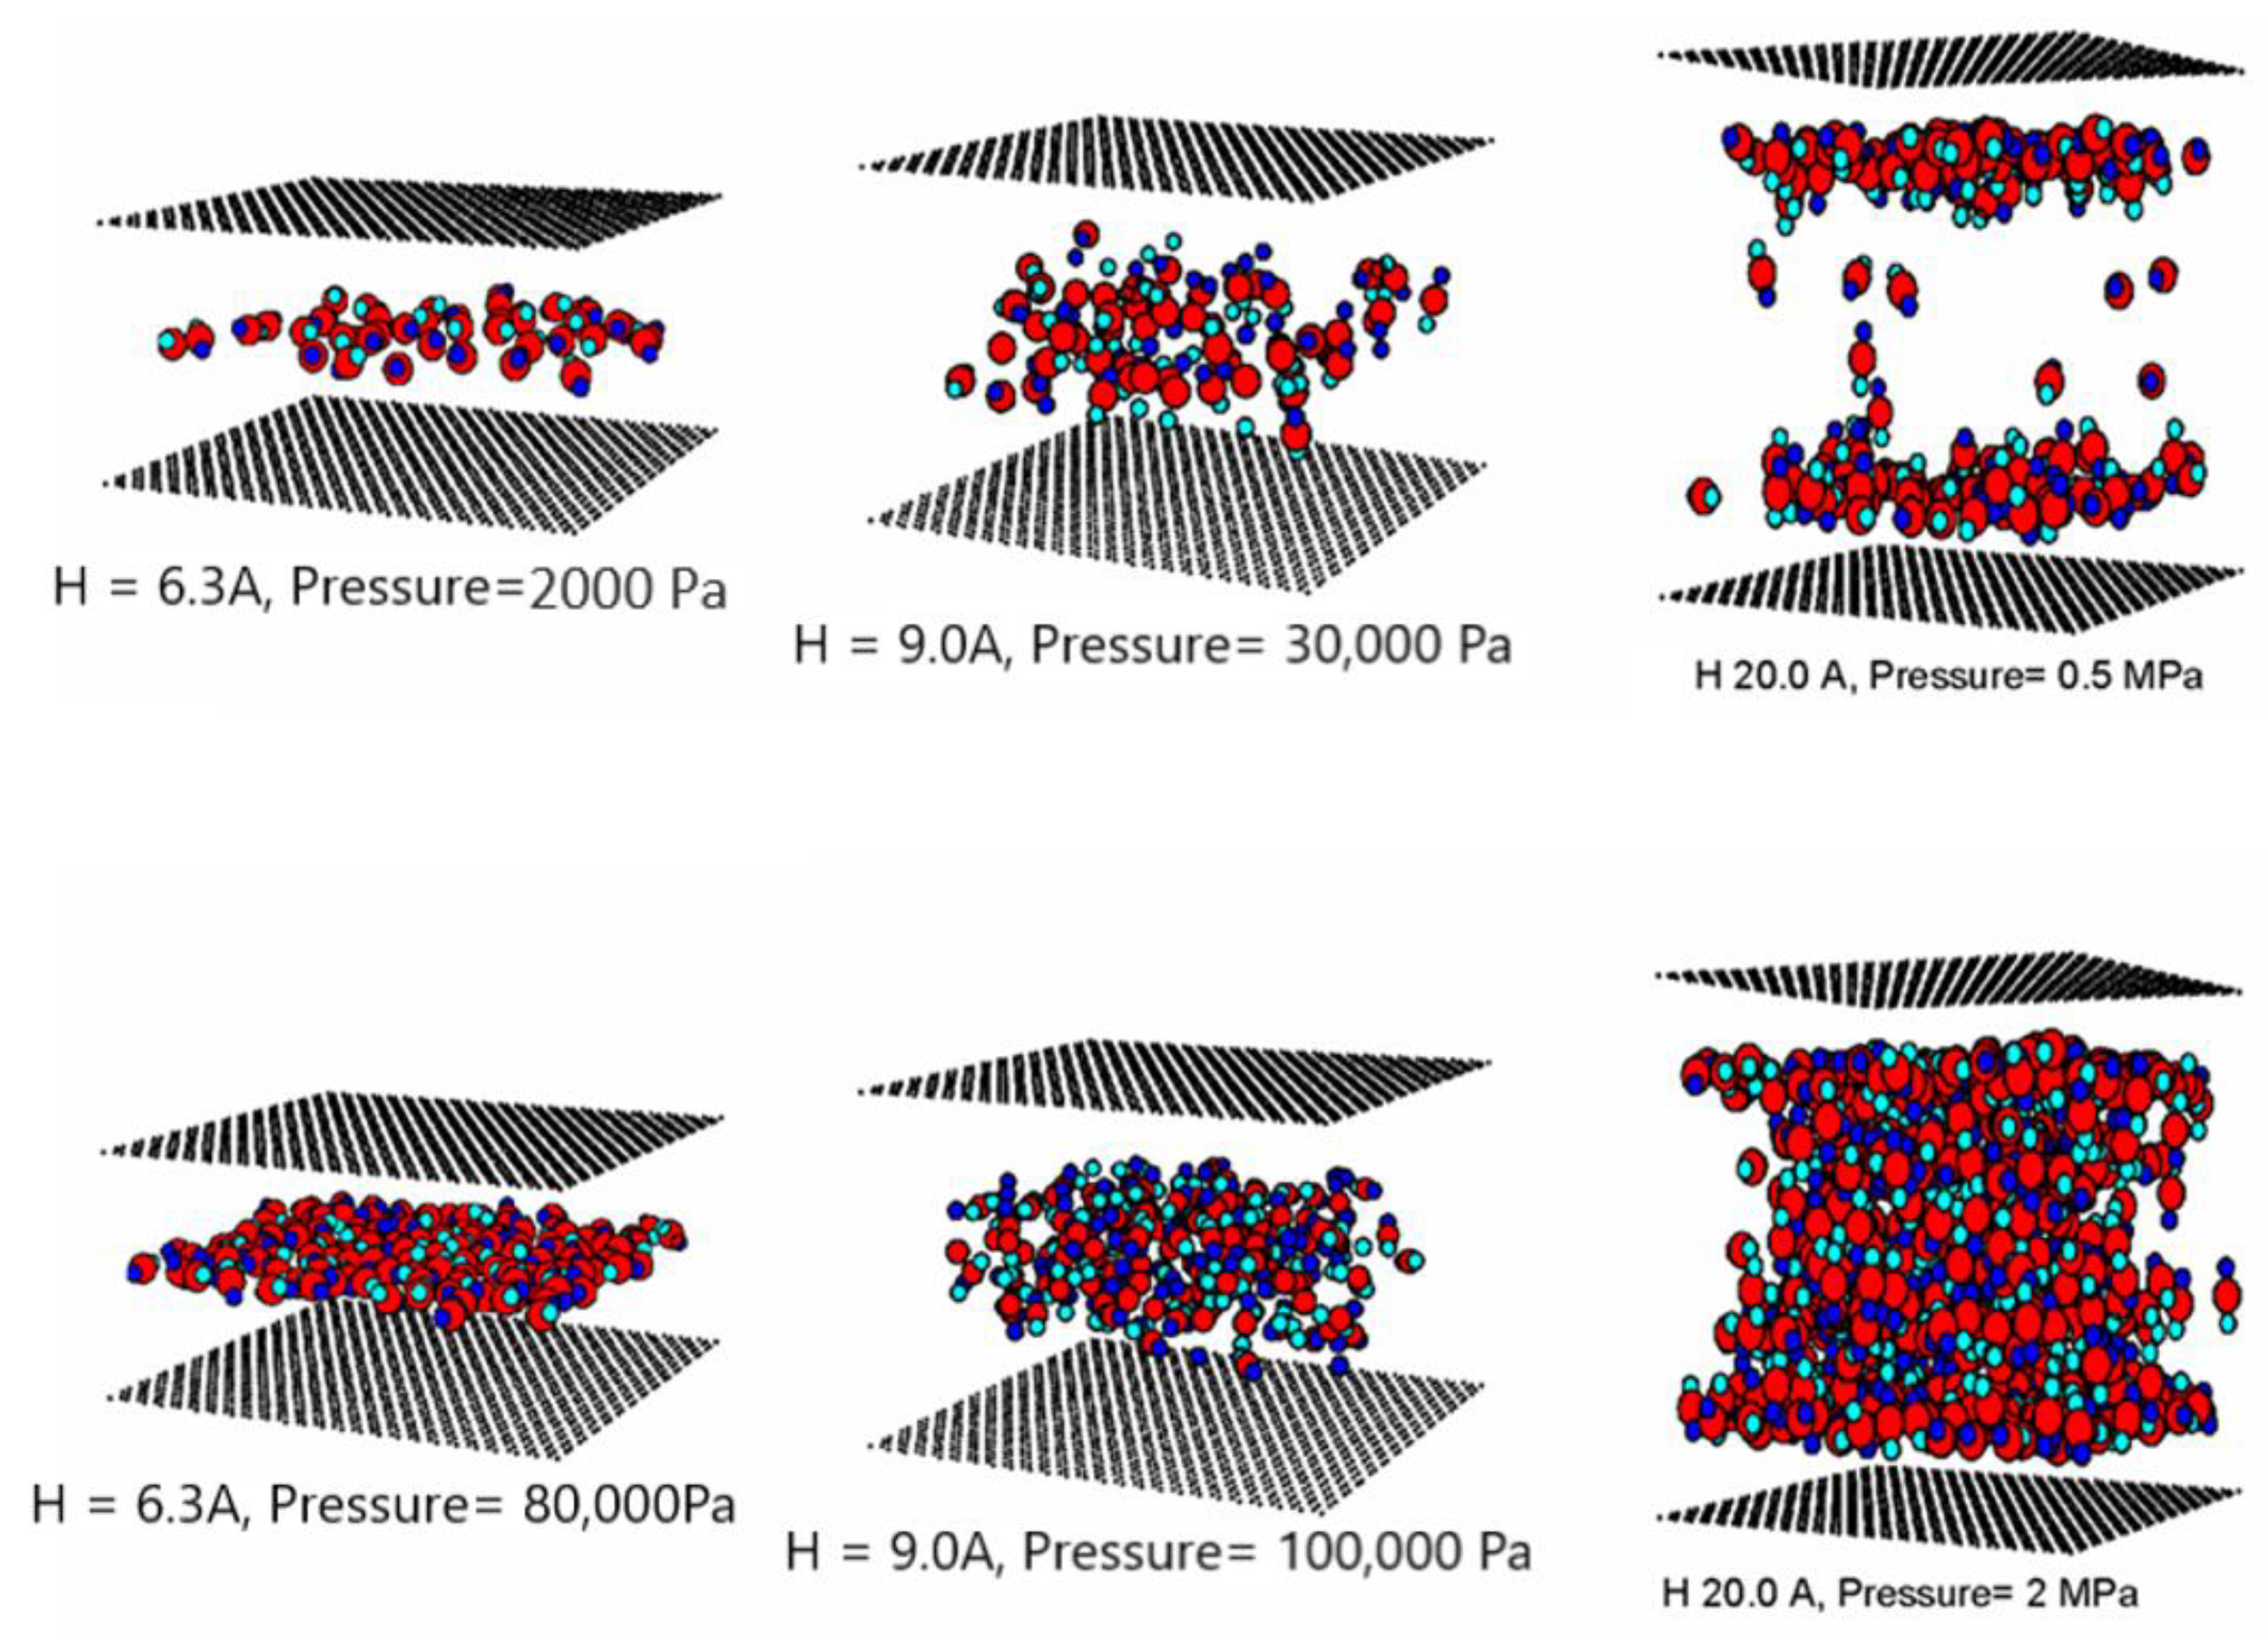
The simulated isotherms versus pressures for pure CO2 and CH4 at 273 K in single carbon slit pores of various pore widths (from 6.3 to 40 Å) are obtained by using the GCMC method; for clarity, only selected isotherms are shown in Figure 10 and Figure 11, respectively. The snapshots of pure CO2 molecules inside the pores at various pressures are also shown in Figure 12 to study the adsorption behaviour of gas in different pore widths.
The simulation isotherms of pure CO2 and CH4 in the slit pore model show the continuous pore filling of a single layer for the width less than 9.5 Å. The isotherm drops with increasing of pore widths. This is due to the weaker interaction between fluid and solid as the pore width increases. However, the number of molecules adsorbed in the larger micropores increases with pore width and leads to the higher extent of adsorption [7]. We also observed the crossing in adsorption isotherms and this is due to the packing effect that leads to the difference in maximum density in each pore [46]. The high maximum density of 6.3 Å pore for CO2 and that of 7.5 Å pore for CH4 is due to the reason that fluid particles can tightly fit inside the pore as a single layer. For pores larger than 9 Å, molecules can form a monolayer along the pore wall and then the additional layers next to the monolayer. The monolayer and pore filling mechanism can be observed for the larger pore widths of 20 Å, as one can see the slope of isotherms increases gradually due to the formation of monolayer and then it shows a small jump in adsorption isotherm at high pressures due to the pore filling behavior. The additional capillary condensation can be observed in the case of adsorption in the larger mesopores.
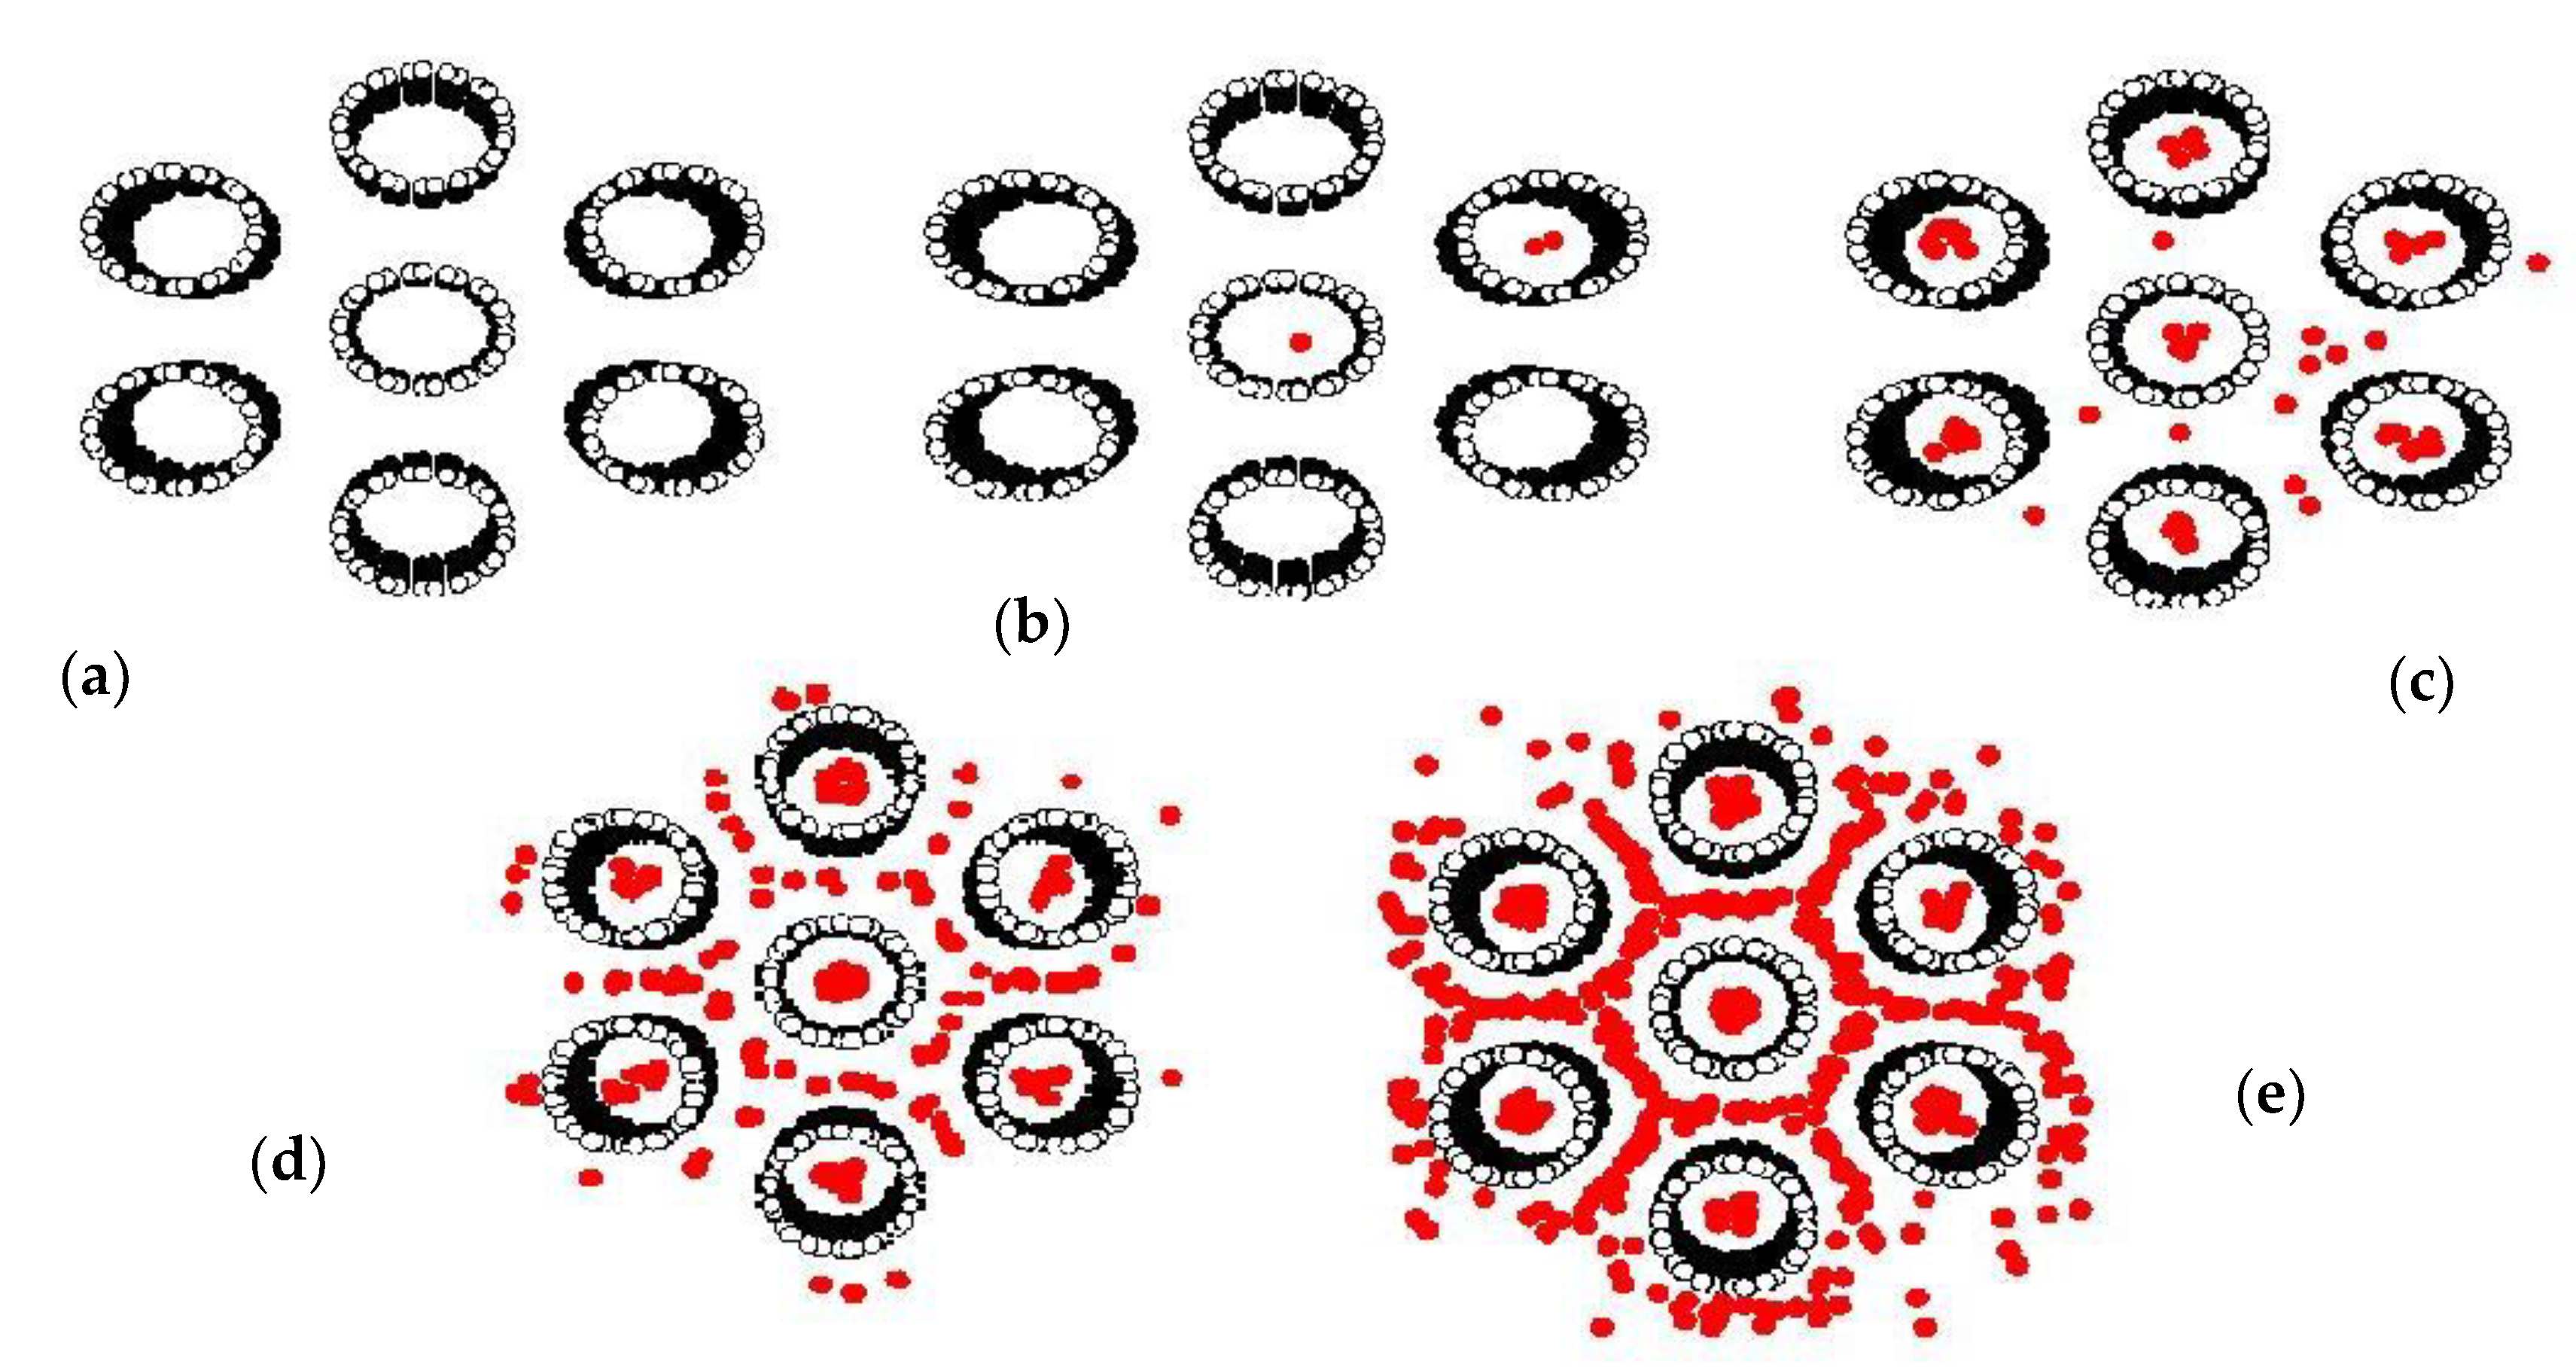
The snapshots of CO2 molecules in the finite pores of 6.3, 9 and 20 Å widths at 273 K are shown in Figure 12 at various pressure values. In these figures, the black spheres represent carbon atoms of graphene layers, and for clarity we show only one graphene layer for each wall, while the big red and small blue spheres represent carbon and oxygen atoms of carbon dioxide molecule. The number of layers in the 6.3, 9 and 20 Å width is 1, 2 and 6, respectively; however, for the larger pores, the higher layers are not quite clear due to the fact that CO2 molecules can rotate in any direction. It is noted that the behavior in each pore is similar irrespective of its width, that is, the adsorbed phase starts at low pressure by forming the two contact layers adjacent to the two walls due to the stronger solid-fluid interaction near the pore wall (except the 6.3 Å width that has a single layer). When the pressure is increased, these contact layers are complete and the inner cores are then filled up. In the larger pores, we can observe the presence of meniscus; the shape of meniscus is cylindrical and becomes flat at pressures close to the vapor pressure. It is noted that a study of meniscus is not possible with the simulation of infinite pores [27].

3.3. Simulation Isotherm for Gas Adsorption in Finite Length Tube Bundle Model

3.3.1. Effects of Tube Diameter on Adsorption Isotherm

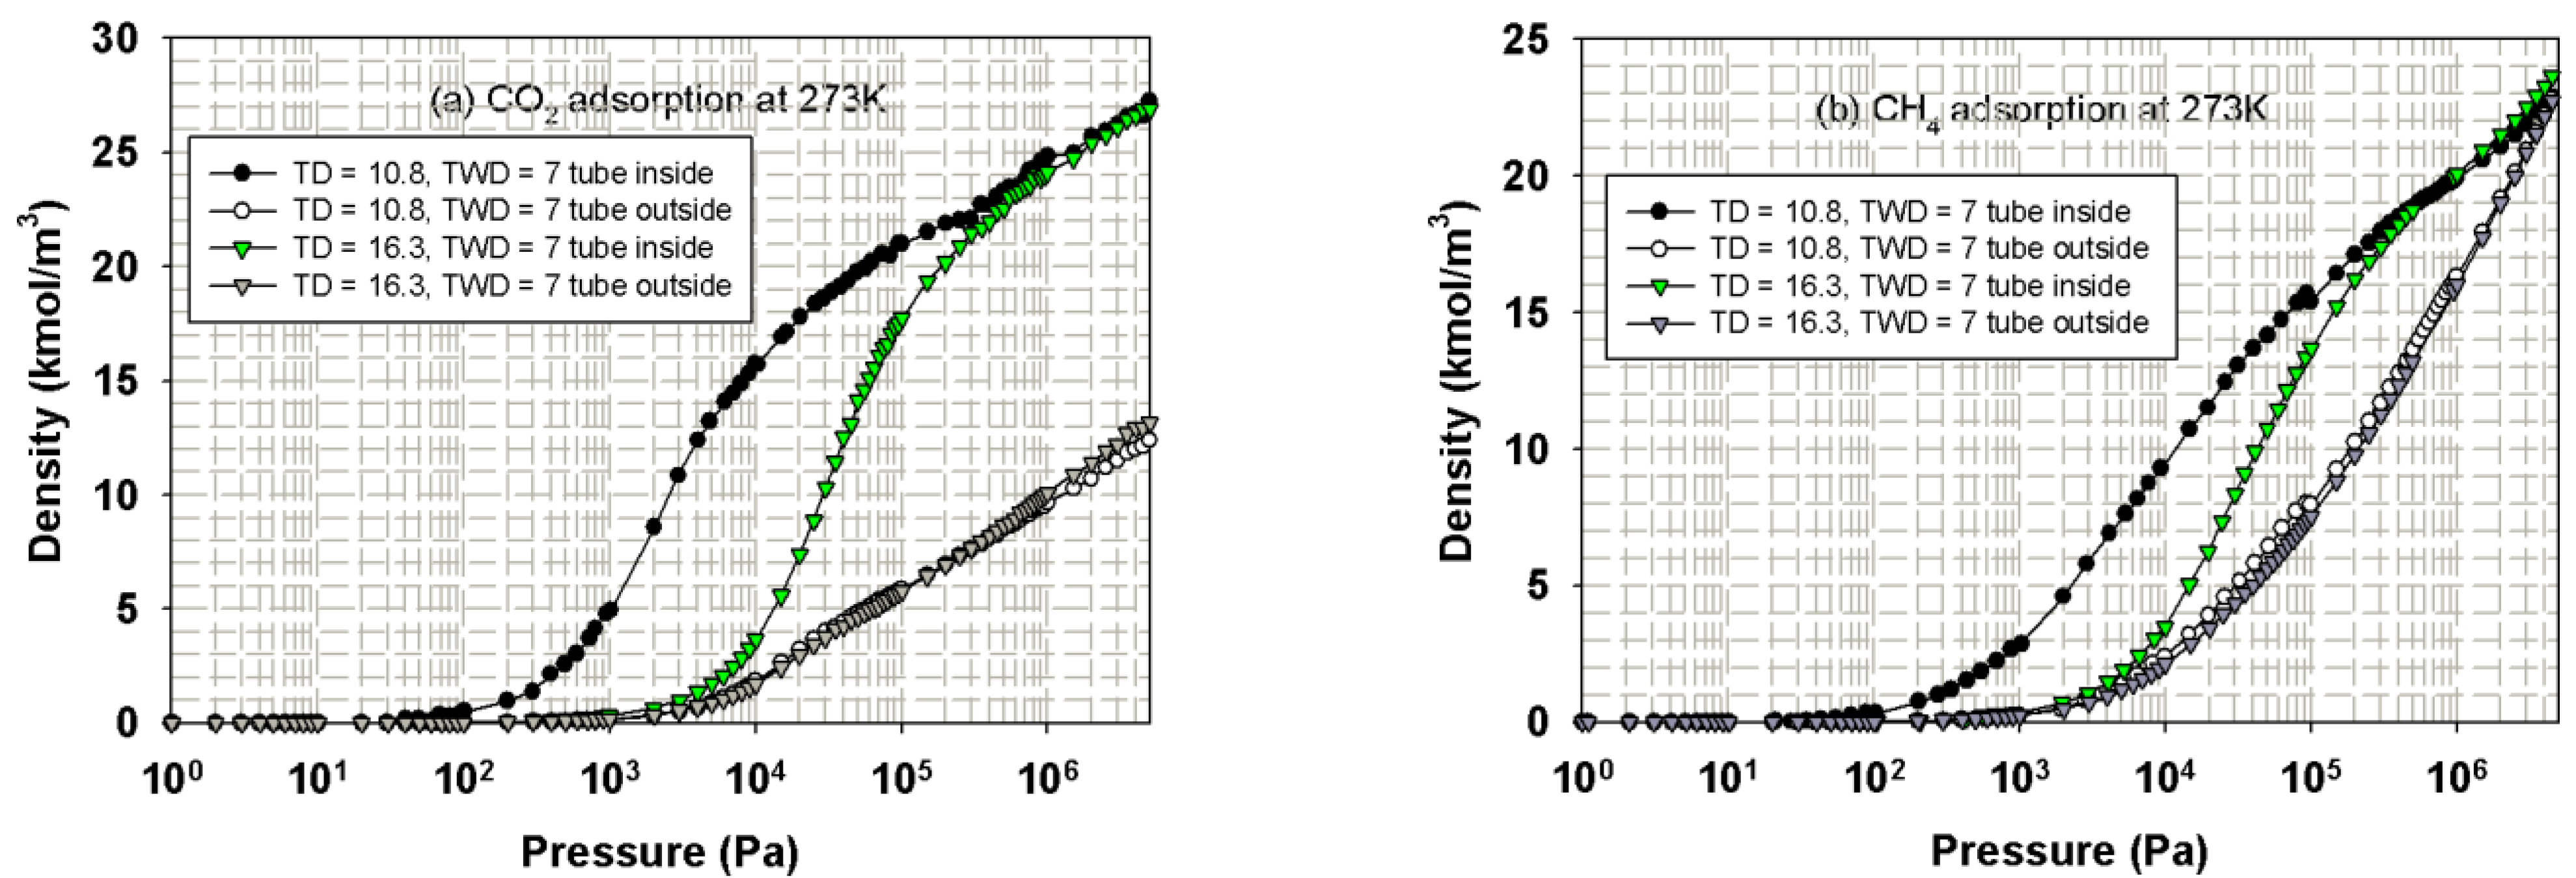
The simulated isotherms versus pressure for CH4 and CO2 in bundle of SWCNs with a tube wall distance of 7 Ǻ at 273 K for 10.8 and 16.3 Ǻ tubes are shown in Figure 13. The snapshots of CO2 and CH4 in tube diameter of 10.8 Ǻ are shown in Figure 14 and Figure 15, respectively, to show the preferential adsorption at low loadings. First, we discuss the effect of tube diameter on CH4 and CO2 adsorption and then compare the adsorption mechanism between both adsorbates.
Adsorption isotherms of CH4 and CO2 in bundles of carbon nanotubes of different sizes are shown in Figure 13a,b, respectively; the similar behavior for the bundles of smallest tubes (10.8 Å) and those of larger tubes (16.3 Å) can be observed. At low pressures, fluid molecules are initially adsorbed in the interior of the tubes to form a monolayer because of the stronger solid-fluid potential inside the tube. The snapshots in Figure 14a,b for CO2 adsorption and Figure 15a–c for CH4 adsorption show this preferential adsorption inside the tube. As pressure is increased, adsorption continues to occur inside the tube and adsorption in the various interstices outside the tubes can be noticed, as shown in Figure 14c–e and Figure 15d,e. The initial adsorption pressure for the bundles of larger tubes is greater than that for those of smaller tubes. This is due to the stronger interaction between fluid and solid in the case of smaller tubes. The following features are also observed: (i) the adsorption density inside the tube increases gradually with pressure due to the molecular layering and the pore-filling mechanisms, and (ii) the density outside the tube also increases gradually. When pressure is high enough, the capillary condensation can be observed in interstices between the bundles. The adsorption isotherm outside the tube for larger and smaller tubes with narrow tube wall distance (TWD) are not much different; this is because the interstices between tubes can be packed with one layer as one can see from Figure 14c and Figure 15d for CO2 and CH4, respectively. The simulation isotherm outside the tube of CO2 is less than that of CH4 at high pressures. This may be due to the difference in molecular structure between CH4 and CO2; a non-spherical molecule of CO2 which is similar to the linear model of N2 is used in this study. It is reported in the literature that the non-spherical molecule of N2 can lie flat on the graphene wall, but it is difficult to occur in the multilayer [47]. Therefore, the molecular shape is important in the explanation of adsorption in confined space with curvature This is because it may affect the structure of adsorbed phase and packing density.
We now turn to the discussion of adsorption behavior between CH4 and CO2 in bundles of tubes. CO2 molecules initially adsorb at lower pressures than those of CH4 for the same tube diameter. At the same pressure and tube diameter, adsorption density inside the tube for CO2 is greater than that for CH4, which is similar to those observed in the experimental data and simulation results for the slit pore model. This is due to the quadrupole effect in the case of CO2, which leads to the stronger fluid-solid interaction as discussed earlier.

3.3.2. Effects of Tube Wall Distance

Having seen the effects of the tube diameter, we then discuss the effects of tube wall distance on adsorption mechanism. The simulation isotherms of CH4 and CO2 in bundles of SWCNs of 16.3 Ǻ at 273 K at various tube wall distances of 4, 7 and 10 Ǻ are shown in Figure 16.
The individual adsorption isotherms for adsorption inside the tube (the top curves as shown in pore) and outside the tube (bottom curves as shown in bulk) for tube bundle of SWCN having diameter of 16.3 Å with different tube wall distances are presented in Figure 16, and the following observations can be noted. At low pressures, fluid particles are initially adsorbed inside the tubes if the separation spacing is less than 10 Å due to the stronger solid-fluid potential inside the tube as discussed in Section 3.3.1. For larger tube wall distance, the behavior is different from the TWD less than 10 Å tubes in that, at low loadings, adsorption occurs both inside the tubes and in the cusp interstices where the solid-fluid potential is strong enough to compete with that inside the tube. This is the direct result from the difference in size of the cusp interstices and the tube diameter. However, when the tube radius is greater than the separation spacing between tubes, adsorption in the cusp interstices may occur first followed by that in the tube interior [28]. In the case of CO2 adsorption outside the tubes of 16.3 Å diameter and TWD of 10 Å, the isotherm increases gradually due to the layering outside the tube walls and then steeply changes in adsorption isotherm can be observed. This may be due to the capillary condensation behavior of CO2 molecules in the cusp interstices at sufficiently high pressure.

3.4. Pore Size Distribution (PSD) Determination

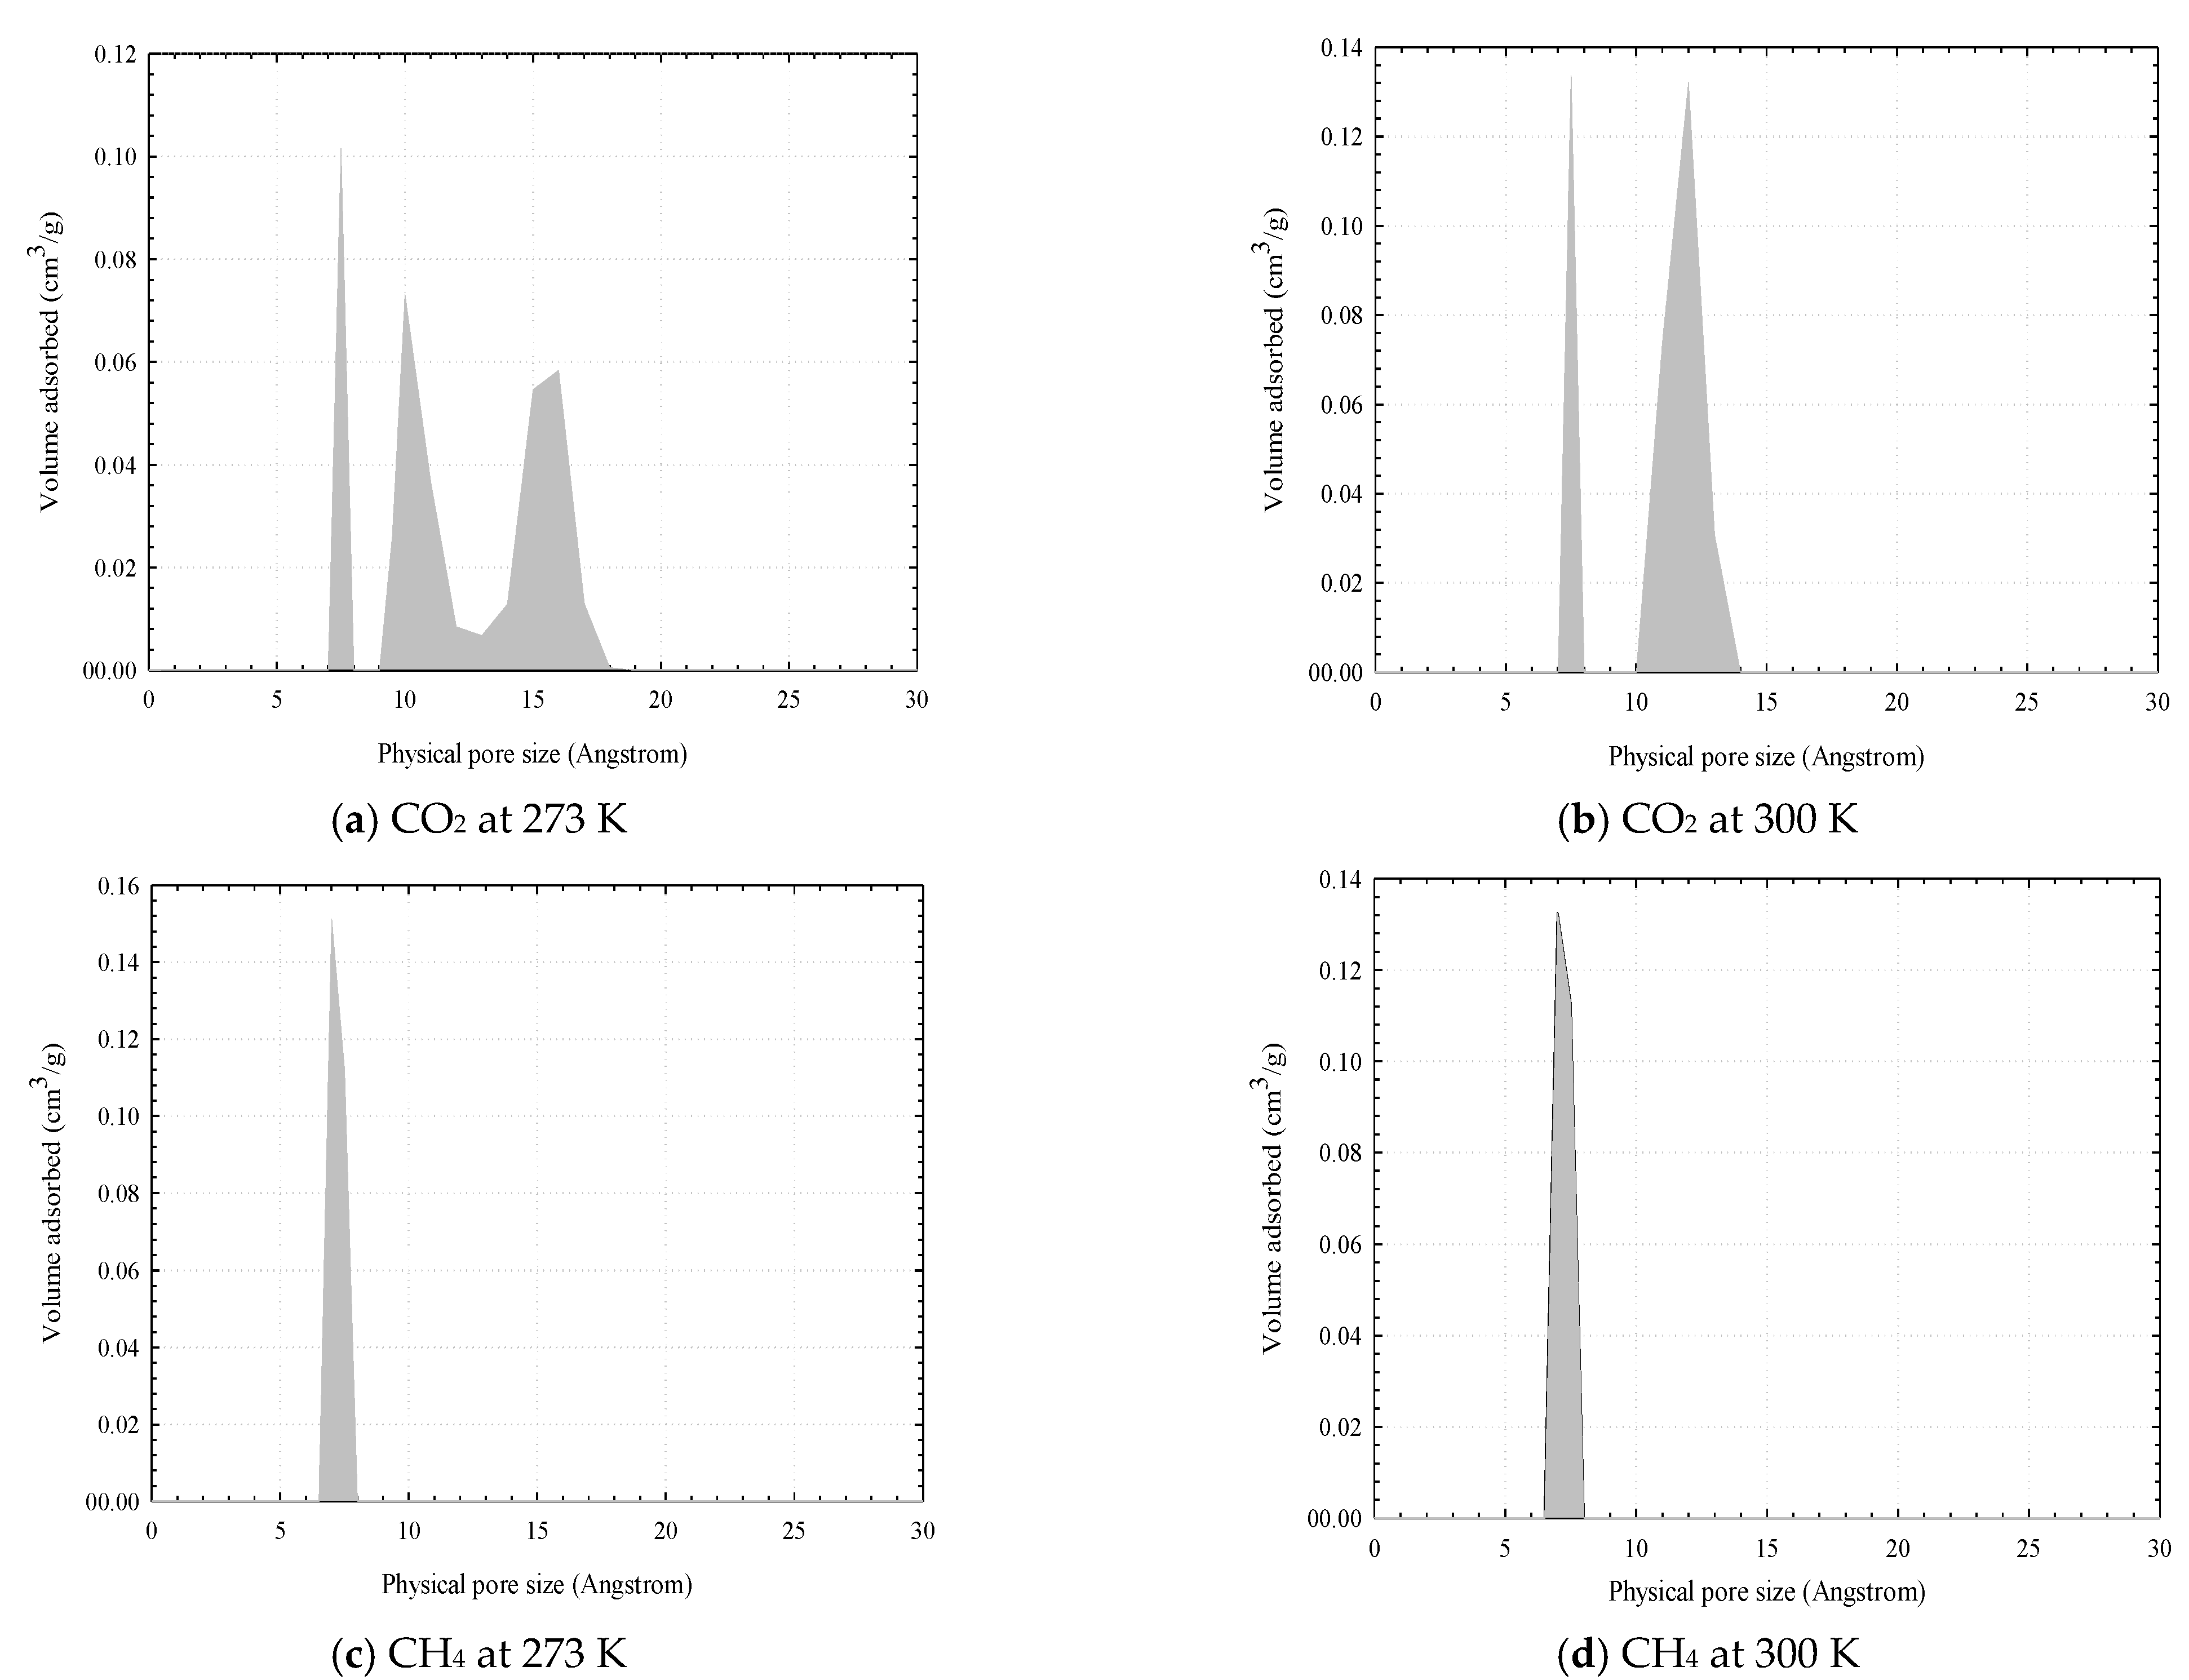
A method to determine the PSD developed based on GCMC simulations and measured isotherm data of CO2 proposed by Samios et al. [48] is used in this study. The set of simulation results are compared against the corresponding experimental isotherm counterpart by using an optimization function of MATLAB code. The PSD obtained by using adsorption isotherms of CO2 and CH4 in activated carbons at 273 and 300 K are shown in Figure 17. The total pore volume of LAC1 obtained by CO2 adsorptions at 273 and 300 K are 0.3921 and 0.3707 cm3/g, respectively, and those obtained by CH4 adsorptions at 273 and 300 K are 0.2633 and 0.2450 cm3/g, respectively. These values differ from those obtained from nitrogen isotherms at 77 K determined by a density functional theory (DFT) method. The total pore volume determined from DFT is 0.27 cm3/g for the longan seed activated carbon. The differences between these results may be due to that the 3-center-LJ model of CO2 does not completely fill in the larger pores because of its orientation requirement and the experiment is operated at pressures lower than its vapour pressure. The total pore volume determined from our model is greater than that obtained from the DFT method and experimental data for N2. This is because the kinetic energy of CO2 is greater than that of N2 (because of the higher adsorption temperature). Thus, the diffusion rate of CO2 into the narrow micropores is faster than that of N2, which agreed with the experimental data that the isotherm for CO2 adsorption in the T3A carbon at 273 K was easily obtained than that for N2 at 77 K [49]. The total pore volume obtained from methane adsorption isotherms is less than those obtained from the adsorption of N2 and CO2; again this because methane cannot fill completely the larger pores at the operating temperatures. This leads to the decrease of total pore volume with an increase temperature.
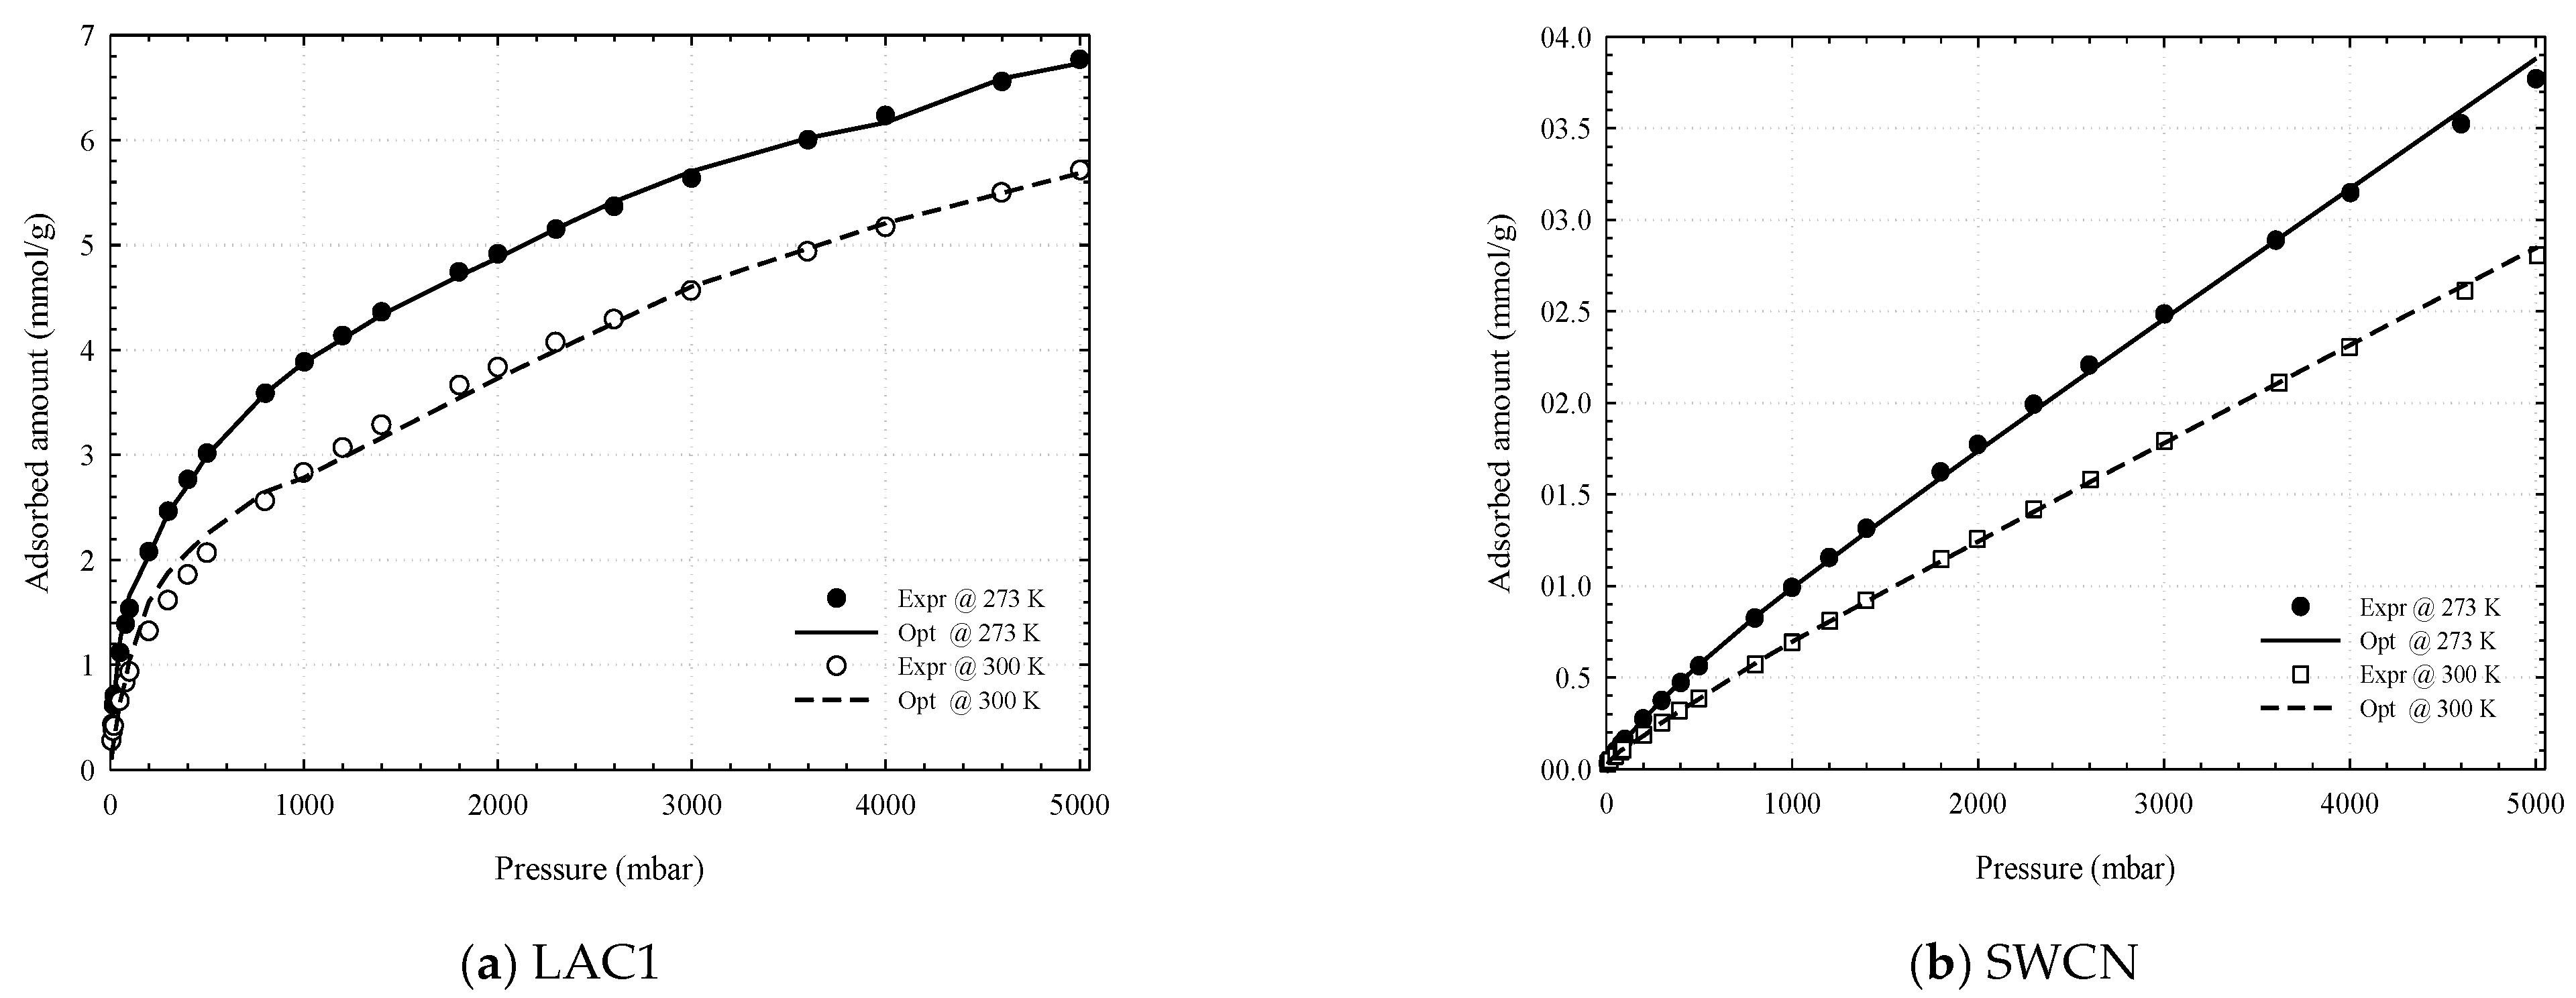
The reconstructed adsorption isotherm obtained from the PSD of CO2 data at 273 and 300 K agrees well with the experimental results for activated carbon and carbon nanotubes, as shown in Figure 18. Therefore, the CO2 data at low pressures can be used to determine the PSD for the micropores, while the N2 adsorption isotherm is used to determine the total pore volume in porous carbons. For better accuracy, the PSD obtained from nitrogen isotherm should be used together with the PSD obtained from CO2 isotherm.
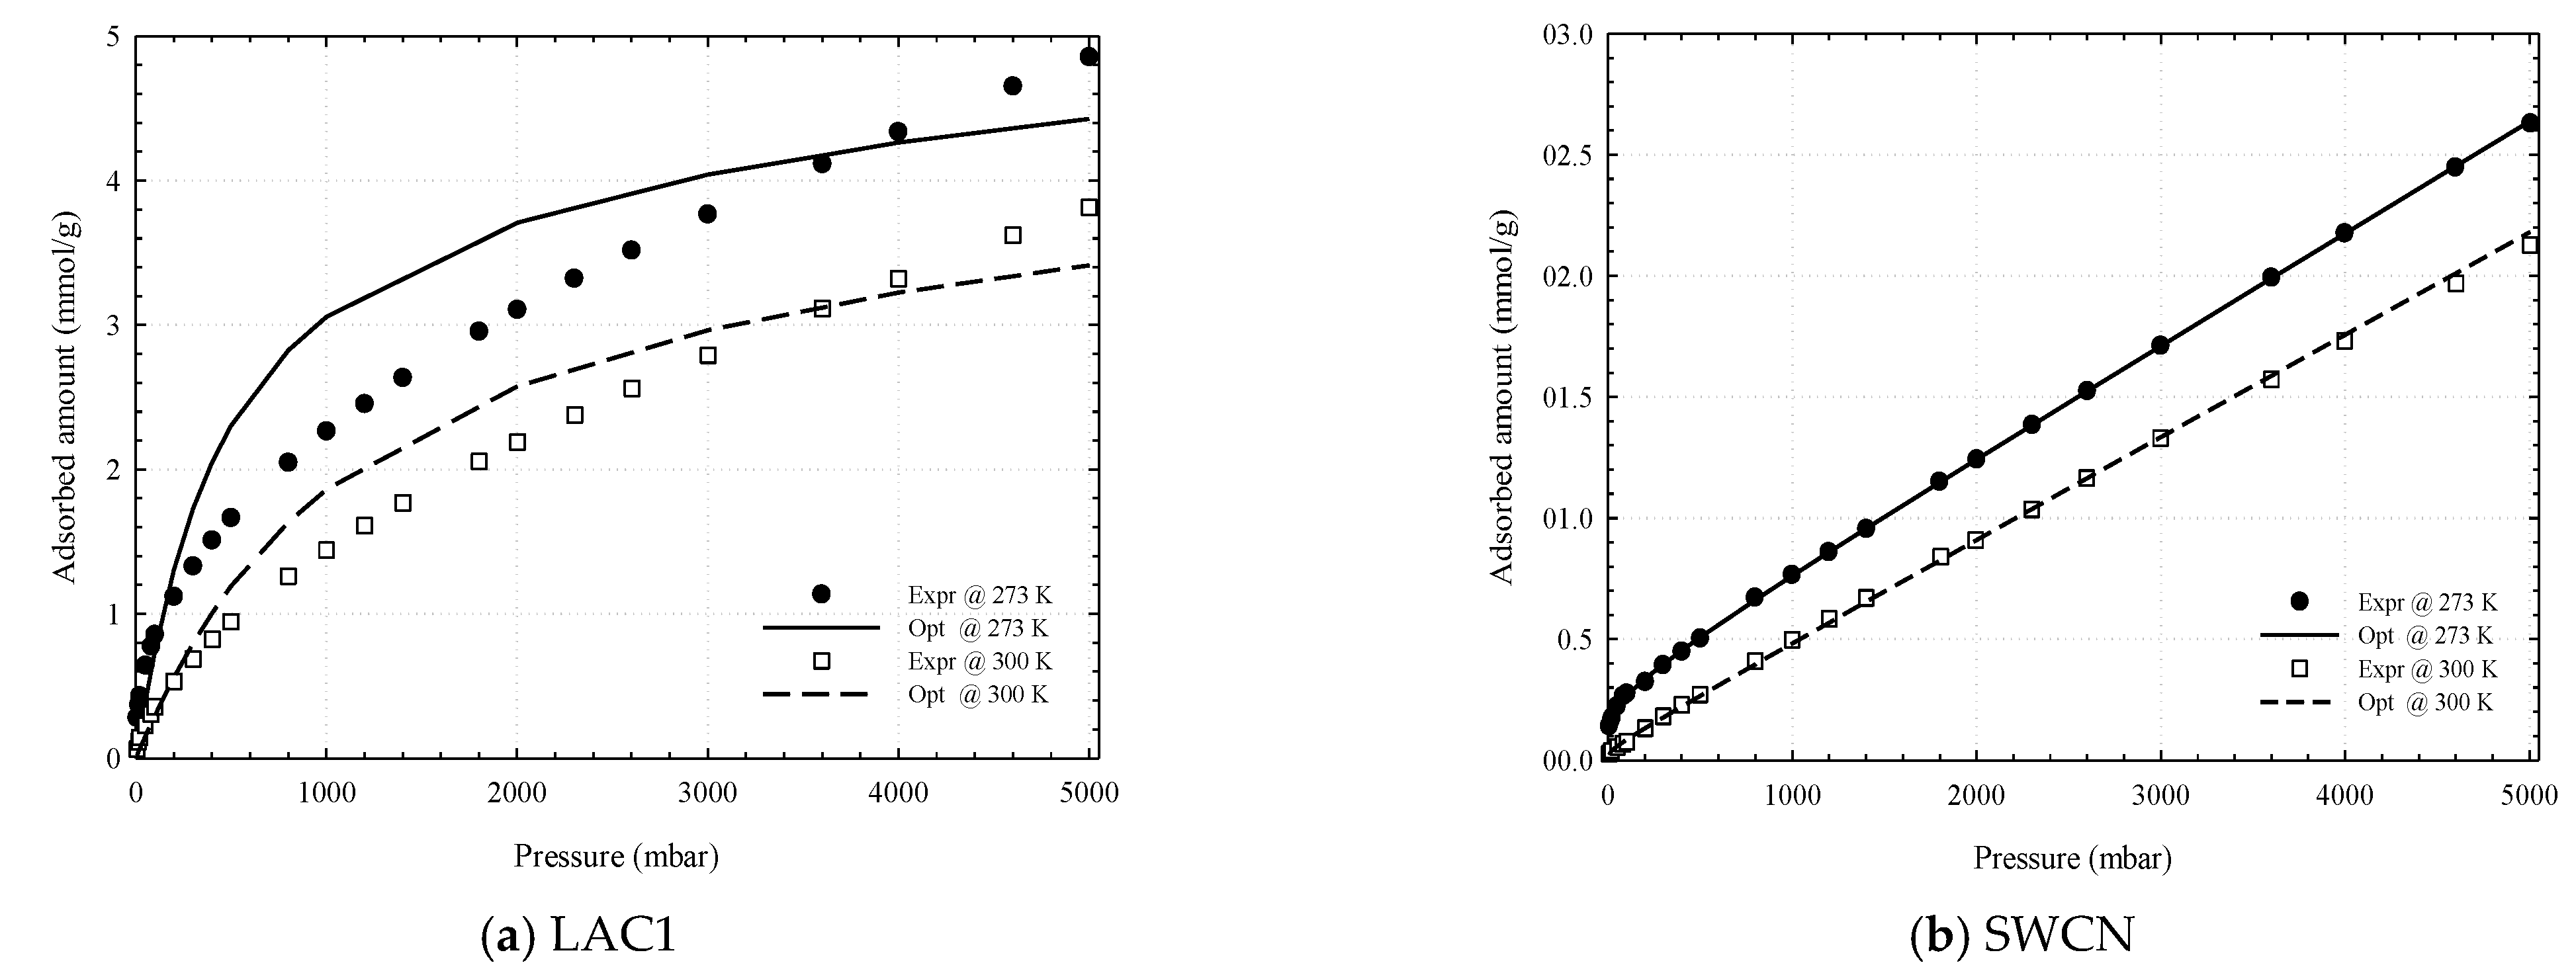
Having seen the PSD obtained from the CO2 adsorption isotherm, we now turn to the PSD obtained from that of CH4 at 273 and 300 K as shown in Figure 17. The micropore volume using the GCMC for LAC1 is 0.34 cm3/g while SWCN composed of pore having diameter of 10.8 Ǻ with TWD 4 Ǻ is observed. The reconstructed isotherms from PSD function agree well with the experimental data for SWCN as shown in Figure 19, but it cannot be described well for the activated carbon. This may be due to the supercritical fluid condition of methane at these temperatures and then the fluid condensation inside the pore cannot be observed. The different probe and temperature can affect the evaluation of PSD of porous carbons. It is noted that the small pores of width less than 10 Ǻ can be observed in the case of using GCMC simulation; however, they are not found for PSD obtained from the DFT calculation [46]. Although the simulation isotherm obtained for finite-length slit pore model proposed in this study cannot present the entire structure range of porous carbon, indeed some important characteristics are revealed.

3.5. Prediction Adsorption Isotherm of CO2/CH4 Mixture

In this section, the reconstructed adsorption isotherm obtained for single component of CO2 and CH4 in finite length slit pore derived in the previous section is used to predict the adsorption isotherm of their mixture. The adsorption equilibrium for multicomponent system equation based on thermodynamic theory is used for analysis of the adsorbed phase and gas phase components and for describing the adsorption behavior of the mixture. It is reported in the literature that the error between the adsorption isotherms obtained from the Vacancy Solution Theory (VSM) and the experimental data for binary mixture is about 5% [36]. Therefore, in this study we used this equation and Ideal Adsorption Solution Theory (IAST) [8] to evaluate the adsorption component of each gas in adsorbed phase, and the results are shown in Figure 20. The simulation isotherm obtained for CO2/CH4 in finite-length slit pores having widths of 7.5 and 13.5 Ǻ was also investigated by the GCMC simulation as shown in Figure 20. The adsorption isotherm of gas mixture is less than the adsorption isotherm of CO2 but it is greater than that of CH4, which is similar to that observed in the experimental section. The mole fraction of CO2 adsorption in activated carbon is about 0.65–0.75, while that of CH4 is around 0.25–0.35. Therefore, the selectivity of CO2–CH4 at equimolar feed is 1.8–3.0, which is close to that observed in the experimental study of Kurniawan et al. [50]. The simple model of finite length slit pore can be used to described the adsorption isotherm of single component and binary mixture quite well.

4. Conclusions

In this study the finite-length pore models of slit shaped pore and tube bundle were used to investigate the adsorption mechanism of CO2, CH4 and their mixture in activated carbons and carbon nanotubes, respectively. The pore size distribution obtained for pure component study of each gas using the Monte Carlo simulation agrees well with that obtained using nitrogen adsorption isotherm determined by the DFT; however, the PSD obtained from MC shows a pore size smaller than 10 Ǻ, which was not observed from the DFT. The PSD obtained by the MC and finite-length pore model were used to predict the adsorption isotherm for binary mixture and compare it with the experimental results, and the agreement is satisfactory.

Author Contributions

This work is contributed by P.K. and W.I. for methodology section including material preparation, simulation and experimental studies and data curation, A.W. for conceptualization, supervision, simulation software development and writing-original draft preparation and C.T. for writing-review and editing. All authors have read and agreed to the published version of the manuscript.

Funding

This research was funded by the Thailand Research Fund and the Commission on Higher Education, grant number MRG5280122. The APC was funded by Suranaree University of Technology.

Institutional Review Board Statement

Not applicable.

Informed Consent Statement

Not applicable.

Data Availability Statement

Not applicable.

Acknowledgments

We acknowledge the Thailand Research Fund and the Commission on Higher Education for research funding to Atichat Wongkoblap and The SUT Research and Development Fund, Suranaree University of Technology for the financial support to Pakamas Kohmuean.

Conflicts of Interest

The authors declare no conflict of interest.

Sample Availability

Samples of the compounds are not available from the authors.

References

  1. Ravikovitch, P.I.; Vishnyakov, A.; Russo, R.; Neimark, A.V. Unified Approach to Pore Size Characterization of Microporous Carbonaceous Materials from N2, Ar, and CO2 Adsorption Isotherms. Langmuir 2000, 16, 2311–2320. [Google Scholar] [CrossRef]
  2. Yang, R.T. Adsorbents Fundamentals and Applications; John Wiley & Sons, Inc. Publication: Hoboken, NJ, USA, 2003. [Google Scholar]
  3. Park, J.; Attia, N.F.; Jung, M.; Lee, M.E.; Lee, K.; Chung, J.; Oh, H. Sustainable nanoporous carbon for CO2, CH4, N2, H2 adsorption and CO2/CH4 and CO2/N2 separation. Energy 2018, 158, 9–16. [Google Scholar] [CrossRef]
  4. Fan, W.; Chakraborty, A.; Kayal, S. Adsorption cooling cycles: Insights into carbon dioxide adsorption on activated carbons. Energy 2016, 102, 491–501. [Google Scholar] [CrossRef]
  5. Hug, S.; Stegbauer, L.; Oh, H.; Hirscher, M.; Lotsch, B.V. Nitrogen-Rich Covalent Triazine Frameworks as High-Performance Platforms for Selective Carbon Capture and Storage. Chem. Mater. 2015, 27, 8001–8010. [Google Scholar] [CrossRef]
  6. Feng, L.; Shen, Y.; Wu, T.; Liu, B.; Zhang, D.; Tang, Z. Adsorption equilibrium isotherms and thermodynamic analysis of CH4, CO2, CO, N2 and H2 on NaY Zeolite. Adsorpt 2020, 26, 1101–1111. [Google Scholar] [CrossRef]
  7. Heuchel, M.; Davies, G.M.; Buss, E.; Seaton, N.A. Adsorption of Carbon Dioxide and Methane and Their Mixtures on an Activated Carbon: Simulation and Experiment. Langmuir 1999, 15, 8695–8705. [Google Scholar] [CrossRef]
  8. Álvarez-Gutiérrez, N.; Gil, M.; Rubiera, F.; Pevida, C. Adsorption performance indicators for the CO2/CH4 separation: Application to biomass-based activated carbons. Fuel Process. Technol. 2016, 142, 361–369. [Google Scholar] [CrossRef] [Green Version]
  9. Esteves, I.A.; Lopes, M.S.; Nunes, P.M.; Mota, J.P. Adsorption of natural gas and biogas components on activated carbon. Sep. Purif. Technol. 2008, 62, 281–296. [Google Scholar] [CrossRef]
  10. Kayal, S.; Sun, B.; Chakraborty, A. A Study of metal-organic framwork MIL-101(Cr) for natural gas (methane) storage and compare with other MOFs (metal-organic-framworks). Energy 2015, 91, 772–781. [Google Scholar] [CrossRef]
  11. Kaźmierczak, J.; Nowicki, P.; Pietrzak, R. Sorption properties of activated carbons obtained from corn cops by chemical and physical activation. Adsorption 2013, 19, 273–281. [Google Scholar] [CrossRef] [Green Version]
  12. Junpirom, S.; Do, D.; Tangsathitkulchai, C.; Tangsathitkulchai, M. A carbon activation model with application to longan seed char gasification. Carbon 2005, 43, 1936–1943. [Google Scholar] [CrossRef]
  13. Mintmire, J.W.; Dunlap, B.I.; White, C.T. Are fullerene tubules metallic? Phys. Rev. Lett. 1992, 68, 631–634. [Google Scholar] [CrossRef]
  14. Hamada, N.; Sawada, S.-I.; Oshiyama, A. New one-dimensional conductors: Graphitic microtubules. Phys. Rev. Lett. 1992, 68, 1579–1581. [Google Scholar] [CrossRef]
  15. Lozano-Castelló, D.; Alcañiz-Monge, J.; de la Casa-Lillo, M.; Cazorla-Amorós, D.; Linares-Solano, A. Advances in the study of methane storage in porous carbonaceous materials. Fuel 2002, 81, 1777–1803. [Google Scholar] [CrossRef]
  16. Molashahi, M.; Hashemipour, H. Experimental study and artificial neural network simulation of methane adsorption on activated carbon. Korean J. Chem. Eng. 2012, 29, 601–605. [Google Scholar] [CrossRef]
  17. Parkyns, N.D.; Quinn, D.F. Porosity in Carbons; Patrick, J.W., Ed.; Edward Arnold: London, UK, 1995; pp. 293–325. [Google Scholar]
  18. Nguyen, C.; Do, D.D. A New Method for the Characterization of Porous Materials. Langmuir 1999, 15, 3608–3615. [Google Scholar] [CrossRef]
  19. Gauden, P.A.; Terzyk, A.P.; Rychlicki, G.; Kowalczyk, P.; Cwiertnia, M.S.; Garbacz, J.K. Estimating the pore size distribution of activated carbons from adsorption data of different adsorbates by various methods. J. Colloid Interface Sci. 2004, 273, 39–63. [Google Scholar] [CrossRef] [PubMed]
  20. Mazzoldi, A.; Hill, T.; Colls, J.J. CFD and Gaussian atmospheric dispersion models: A comparison for leak from carbon dioxide transportation and storage facilities. Atmos. Environ. 2008, 42, 8046–8054. [Google Scholar] [CrossRef]
  21. Maddox, M.; Ulberg, D.; Gubbins, K. Molecular simulation of simple fluids and water in porous carbons. Fluid Phase Equilibria 1995, 104, 145–158. [Google Scholar] [CrossRef]
  22. Alexiadis, A.; Kassinos, S. Molecular Simulation of Water in Carbon Nanotubes. Chem. Rev. 2008, 108, 5014–5034. [Google Scholar] [CrossRef] [PubMed]
  23. Franklin, R.E. Crystallite growth in graphitizing and non-graphitizing carbons. Proc. Roy. Soc. 1951, 209, 196–218. [Google Scholar]
  24. Do, D.D. Adsorption Analysis: Equilibria and Kinetics; Imperial College Press: London, UK, 1998. [Google Scholar]
  25. Yin, Y.F.; Mays, T.; McEnaney, B. Adsorption of Nitrogen in Carbon Nanotube Arrays. Langmuir 1999, 15, 8714–8718. [Google Scholar] [CrossRef]
  26. Agnihotri, S.; Mota, J.P.B.; Rostam-Abadi, M.; Rood, M.J. Theoretical and Experimental Investigation of Morphology and Temperature Effects on Adsorption of Organic Vapors in Single-Walled Carbon Nanotubes. J. Phys. Chem. B 2006, 110, 7640–7647. [Google Scholar] [CrossRef] [PubMed]
  27. Wongkoblap, A.; Junpirom, S.; Do, D.D. Adsorption of Lennard-Jones Fluids in Carbon Slit Pores of a Finite Length. A Computer Simulation Study. Adsorpt. Sci. Technol. 2005, 23, 1–18. [Google Scholar] [CrossRef]
  28. Wongkoblap, A.; Do, D.; Wang, K. Adsorption of polar and non-polar fluids in carbon nanotube bundles: Computer simulation and experimental studies. J. Colloid Interface Sci. 2009, 331, 65–76. [Google Scholar] [CrossRef]
  29. Harris, J.G.; Yung, K.H. Carbon Dioxide’s Liquid-Vapor Coexistence Curve and Critical Properties as Predicted by a Simple Molecular Model. J. Phys. Chem. 1995, 99, 12021–12024. [Google Scholar] [CrossRef]
  30. Murthy, C.S.; O’Shea, S.F.; McDonald, I.R. Electrostatic interactions in molecular crystals: Lattice dynamics of solid nitrogen and carbon dioxide. Mol. Phys. 1983, 50, 531–541. [Google Scholar] [CrossRef]
  31. Vernov, A.; Steele, W. Simulation studies of bilayers of N2 adsorbed on graphite at 25 and 35 K. Surf. Sci. 1986, 171, 83–102. [Google Scholar] [CrossRef]
  32. Frenkel, D.; Smit, B. Understanding Molecular Simulation, 2nd ed.; Academic Press: New York, NY, USA, 2002. [Google Scholar]
  33. Allen, M.P.; Tildesley, D. Computer Simulation of Liquid; Oxford University Press: Oxford, UK, 1987. [Google Scholar]
  34. Johnson, J.K.; Zollweg, J.A.; Gubbins, K.E. The Lennard-Jones equation of state revisited. Mol. Phys. 1993, 78, 591–618. [Google Scholar] [CrossRef]
  35. Vishnyakov, A.; Ravikovitch, P.I.; Neimark, A.V. Molecular Level Models for CO2 Sorption in Nanopores. Langmuir 1999, 15, 8736–8742. [Google Scholar] [CrossRef]
  36. Yang, R.T. Gas Separation by Adsorption Processes; Imperial College Press, Butterworths: Boston, MA, USA, 1997. [Google Scholar]
  37. Huang, L.; Zhang, L.; Shao, Q.; Lu, L.; Lü, X.; Jiang, S.; Shen, W. Simulations of Binary Mixture Adsorption of Carbon Dioxide and Methane in Carbon Nanotubes: Temperature, Pressure, and Pore Size Effects. J. Phys. Chem. C 2007, 111, 11912–11920. [Google Scholar] [CrossRef]
  38. Tangsathitkulchai, C. Adsorption Processes; Suranaree University of Technology Press: Nakhon Ratchasima, Thailand, 2011. [Google Scholar]
  39. Kirk, R.E.; Othmer, D.F. Encyclopedia of Chemical Technology; Wiley & Sons, Inc. Publication: Chichester, UK; New York, NY, USA, 2004; pp. 493–527. [Google Scholar]
  40. Choi, B.-U.; Choi, D.-K.; Lee, Y.-W.; Lee, B.-K.; Kim, S.-H. Adsorption Equilibria of Methane, Ethane, Ethylene, Nitrogen, and Hydrogen onto Activated Carbon. J. Chem. Eng. Data 2003, 48, 603–607. [Google Scholar] [CrossRef]
  41. Lithoxoos, G.P.; Labropoulos, A.; Peristeras, L.D.; Kanellopoulos, N.; Samios, J.; Economou, I.G. Adsorption of N2, CH4, CO and CO2 gases in single walled carbon nanotubes: A combined experimental and Monte Carlo molecular simulation study. J. Supercrit. Fluids 2010, 55, 510–523. [Google Scholar] [CrossRef]
  42. Buss, E. Gravimetric measurement of binary gas adsorption equilibria of methane-carbon dioxide mixtures on activated carbon. Gas Sep. Purif. 1995, 9, 189–197. [Google Scholar] [CrossRef]
  43. Van Der Vaart, R.; Husiskes, C.; Bosch, H.; Reith, T. Single and Mixed Gas Adsorption Equilibria of Carbon Dioxide/Methane on Activated Carbon. Adsorption 2000, 6, 311–323. [Google Scholar] [CrossRef]
  44. Dreisbach, F.; Staudt, R.; Keller, J.U. High Pressure Adsorption Data of Methane, Nitrogen, Carbon Dioxide and their Binary and Ternary Mixtures on Activated Carbon. Adsorption 1999, 5, 215–227. [Google Scholar] [CrossRef]
  45. Goetz, V.; Pupier, O.; Guillot, A. Guillot, Carbon dioxide-methane mixture adsorption on activated carbon. Adsorption 2006, 12, 55–63. [Google Scholar] [CrossRef]
  46. Wongkoblap, A.; Intomya, W.; Somrup, W.; Charoensuk, S.; Junpirom, S.; Tangsathitkulchai, C. Pore Size Distribution of Carbon with Different Probe Molecules. Eng. J. 2010, 14, 45–56. [Google Scholar] [CrossRef] [Green Version]
  47. Bottani, E.; Bakaev, V. The Grand Canonical Ensemble Monte Carlo Simulation of Nitrogen on Graphite. Langmuir 1994, 10, 1550. [Google Scholar] [CrossRef]
  48. Samios, S.; Stubos, A.K.; Kanellopoulos, N.K.; Cracknell, R.F.; Papadopoulos, G.K.; Nicholson, D. Determination of micropore size distribution from Grand Canonical Monte Carlo simulations and experimental CO2 isotherm data. Langmuir 1997, 13, 2795–2802. [Google Scholar] [CrossRef]
  49. Cazorla-Amorós, D.; Alcañiz-Monge, J.; De La Casa-Lillo, M.A.; Linares-Solano, A. CO2 As an Adsorptive To Characterize Carbon Molecular Sieves and Activated Carbons. Langmuir 1998, 14, 4589–4596. [Google Scholar] [CrossRef]
  50. Kurniawan, Y.; Bhatia, S.K.; Rudolph, V. Monte Carlo simulation of binary mixture adsorption of methane and carbon dioxide in carbon slit pore. Ann. Univ. Mariae Curie-Sklodowska Sect. AA Chem. 2005, 60, 79–92. [Google Scholar]
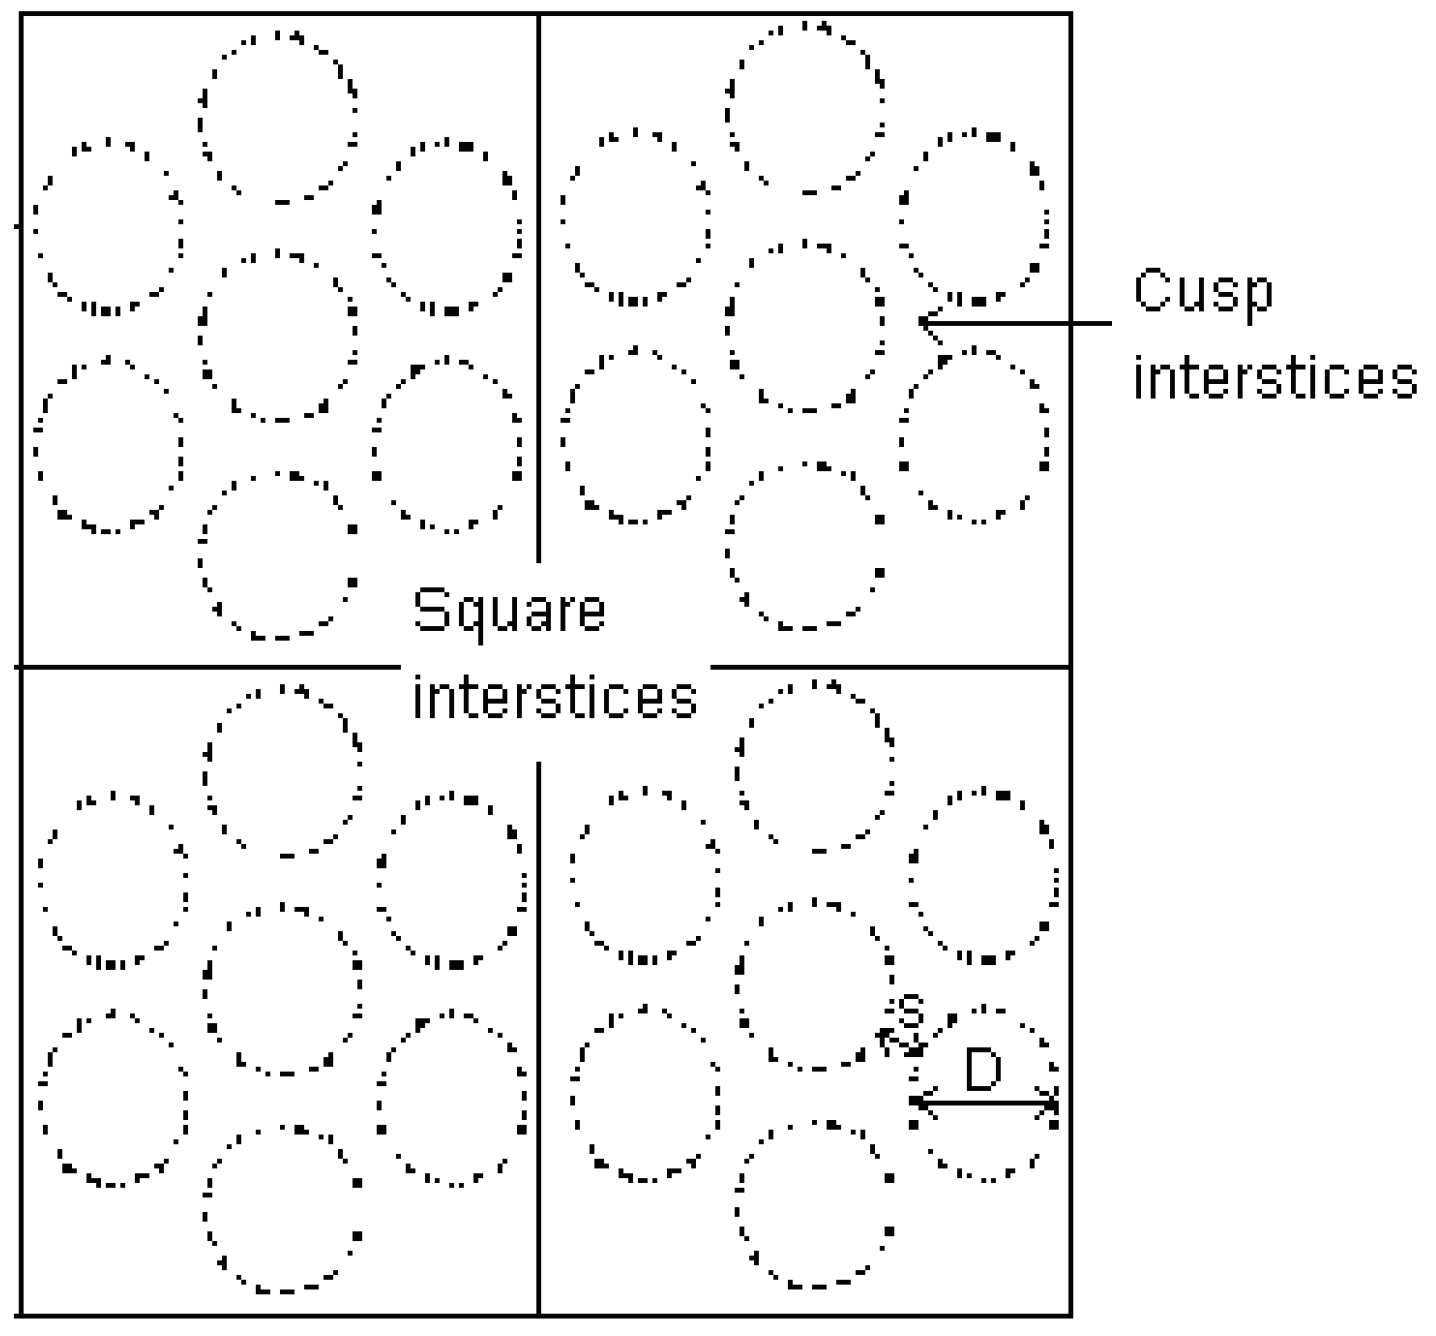
Figure 1. A schematic diagram of a cross section of bundles of single wall carbon nanotube (SWCN) and the minimum image convention used in this study.
Molecules 26 02413 g001
Figure 2. Adsorption isotherms of nitrogen at 77 K in various kinds of carbon (filled symbols for adsorption and unfilled symbols for desorption) in linear (a) and semi-log (b) scales.
Molecules 26 02413 g002
Figure 3. Adsorption isotherms of methane in activated carbons and single wall carbon nanotube at 273 K in linear (a) and semi-log (b) scales.
Molecules 26 02413 g003
Figure 4. Adsorption isotherms of methane in activated carbons and single wall carbon nanotube at 300 K in linear (a) and semi-log (b) scales.
Molecules 26 02413 g004
Figure 5. Adsorption isotherms of carbon dioxide at 273 K in various kinds of carbons in linear (a) and semi-log (b) scales.
Molecules 26 02413 g005
Figure 6. Adsorption isotherms of carbon dioxide at 300 K in various kinds of carbons in linear (a) and semi-log (b) scales.
Molecules 26 02413 g006aMolecules 26 02413 g006b
Figure 7. Experimental adsorption isotherms of CO2 and CH4 in LAC1 activated carbon at 273 and 300 K.
Molecules 26 02413 g007
Figure 8. Adsorption isotherms of methane, carbon dioxide and their mixture in LAC1 activated carbon at 273 K.
Molecules 26 02413 g008
Figure 9. Adsorption isotherms of methane, carbon dioxide and their mixture in SWCN at 273 and 300 K.
Molecules 26 02413 g009
Figure 10. Adsorption isotherms of carbon dioxide obtained for a finite-length slit pore at 273 K.
Molecules 26 02413 g010
Figure 11. Adsorption isotherms of methane obtained for a finite-length slit pore at 273 K.
Molecules 26 02413 g011
Figure 12. Snapshots of CO2 in 6.3, 9 and 20 Å pores at 273 K.
Molecules 26 02413 g012
Figure 13. Isotherms of CO2 (a) and CH4 (b) in bundles of tube size 10.8 and 16.3 Ǻ at 273 K.
Molecules 26 02413 g013
Figure 14. Snapshots of CO2 adsorption at various pressures: p = 0.3 (a), 1 (b), 900 (c), 8000 (d) and 90,000 Pa (e) in 10.8 Ǻ tubes at 273 K and TWD of 7 Å.
Molecules 26 02413 g014
Figure 15. Snapshots of CH4 adsorption at various pressures: p = 0.3 (a), 1 (b), 900 (c), 8000 (d) and 90,000 Pa (e) in 10.8 Å tubes at 273 K and TWD of 7 Å.
Molecules 26 02413 g015
Figure 16. Adsorption isotherms of CH4 (a) and CO2 (b) in bundles of 16.3 Å tubes at 273 K at various tube wall distance of 4, 7 and 10 Å.
Molecules 26 02413 g016
Figure 17. Pore size distribution obtained for LAC1 using the isotherms of CO2 at 273 K (a), CO2 at 300 K (b), CH4 at 273 K (c) and CH4 at 300 K (d).
Molecules 26 02413 g017
Figure 18. Comparison between the experimental data and reconstructed adsorption isotherms obtained from PSD determination for LAC1 (a) and SWCN (b) using the adsorption isotherms of CO2 at 273 and 300 K.
Molecules 26 02413 g018
Figure 19. Comparison between the experimental data and reconstructed adsorption isotherms obtained from PSD determination for LAC1 (a) and SWCN (b) using the adsorption isotherms of CH4 (b) at 273 and 300 K.
Molecules 26 02413 g019
Figure 20. Simulation isotherms obtained for CH4 and CO2 for binary mixture of equimolar CO2/CH4 in slit pore model at 273 K.
Molecules 26 02413 g020
Table 1. Molecular parameters for methane and nitrogen (rNN is the separation distance between two N atoms).
Fluid σ f f ,   Å ε f f / k ,   K r N N ,   Å
CH43.730148.0-
N2 (2 LJ sites)3.32036.41.1
Table 2. Molecular parameters for carbon dioxide.
ParameterValueParameterValue
σc-c2.757 Åεc-c/k28.129 K
σo-o3.033 Åεo-o/k80.507 K
qc0.6512eqo−0.3256e
λc-o1.149 Å
Table 3. Porous properties of carbons used in this study.
SampleBET Surface Area (m2/g)Micropore Volume (cm3/g)Meso- and Macropores Volume (cm3/g)Total Pore Volume (cm3/g)
SWCN8530.181.111.29
LAC15380.200.070.27
LAC27050.260.110.37
Publisher’s Note: MDPI stays neutral with regard to jurisdictional claims in published maps and institutional affiliations.