
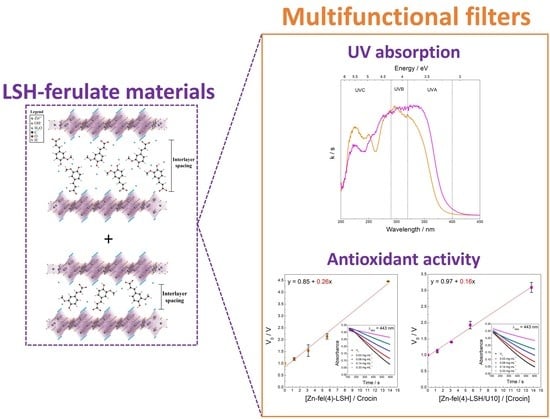
Zn(ferulate)-LSH Systems as Multifunctional Filters


Abstract
1. Introduction
2. Results and Discussion
3. Materials and Methods
3.1. Materials
3.2. Synthesis of Layered Zinc Hydroxide Nitrate Matrix
3.3. Synthesis of LSH Intercalated with Ferulate Anions
3.4. Preparation of Cosmetic Formulations
3.5. Characterization Techniques
3.6. Molecular Modeling Method
3.7. In Vitro Sun Protection Factor (SPF) Method
3.8. In Vitro Antioxidant Activity Assays
3.8.1. Method of DPPH• Radical Capture
3.8.2. ABTS Radical Cation Decolorization Assay
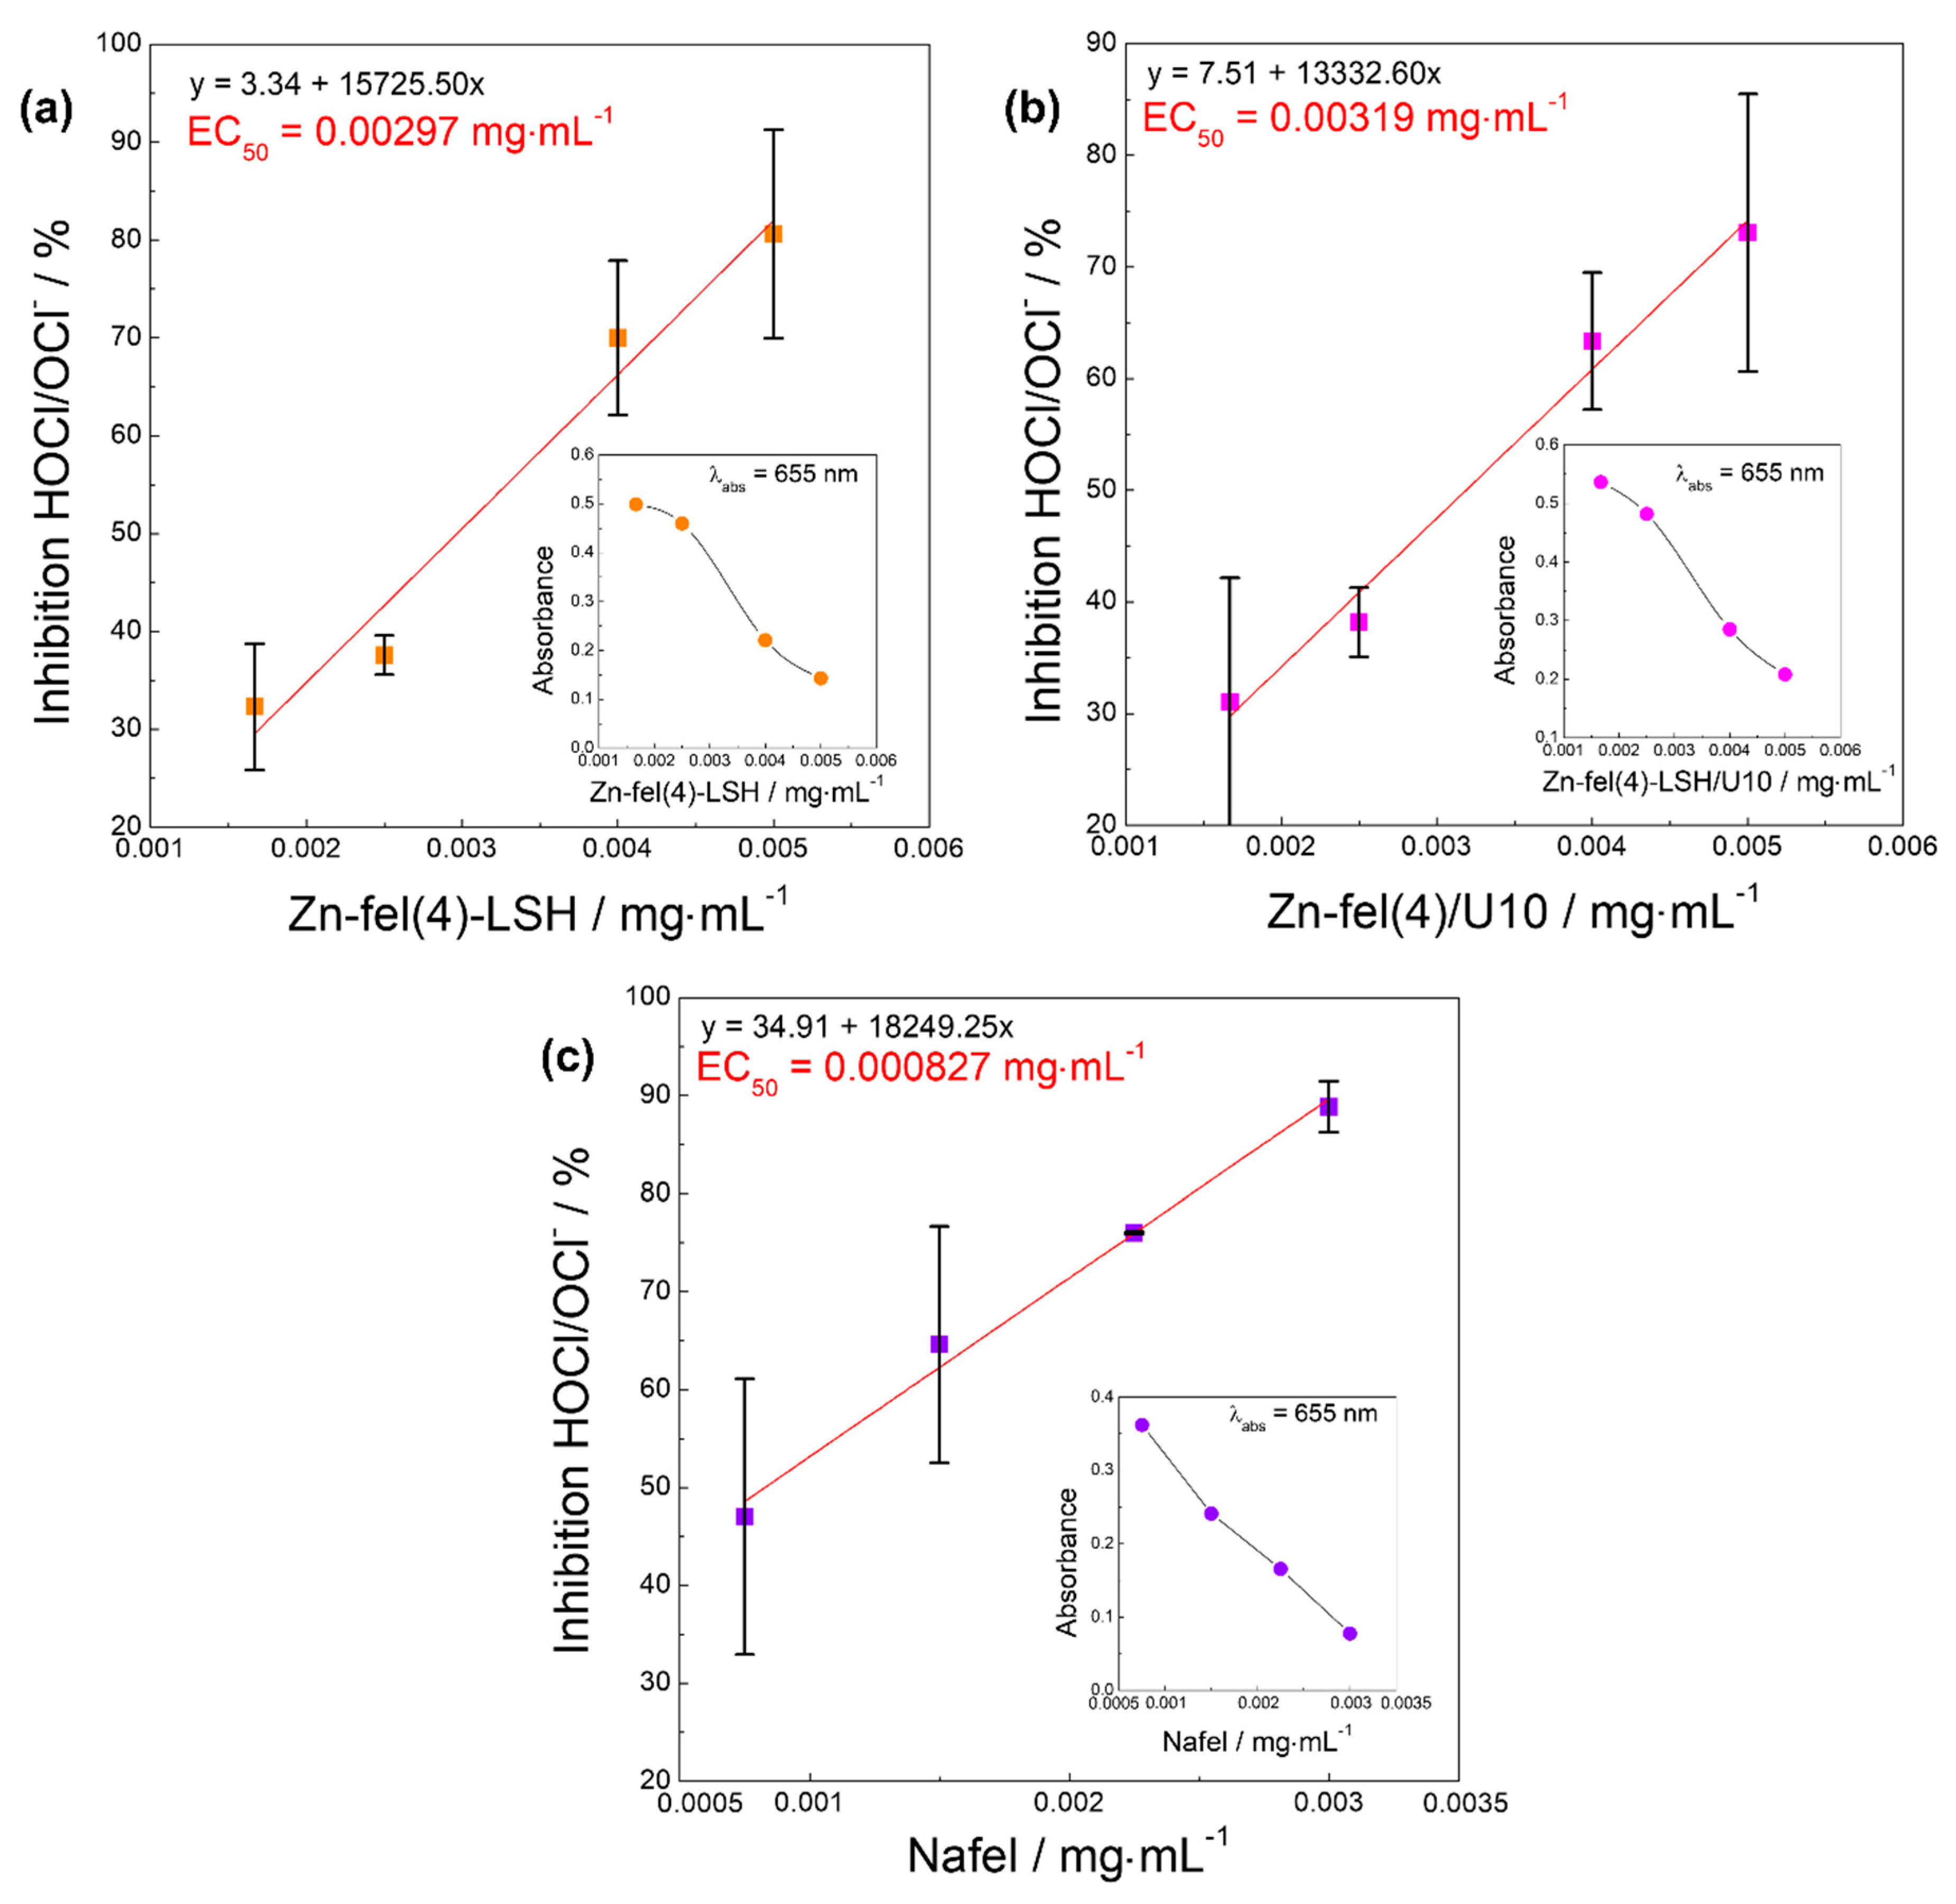
3.8.3. Hypochlorous Acid (HOCl/OCl−) Scavenging Assay
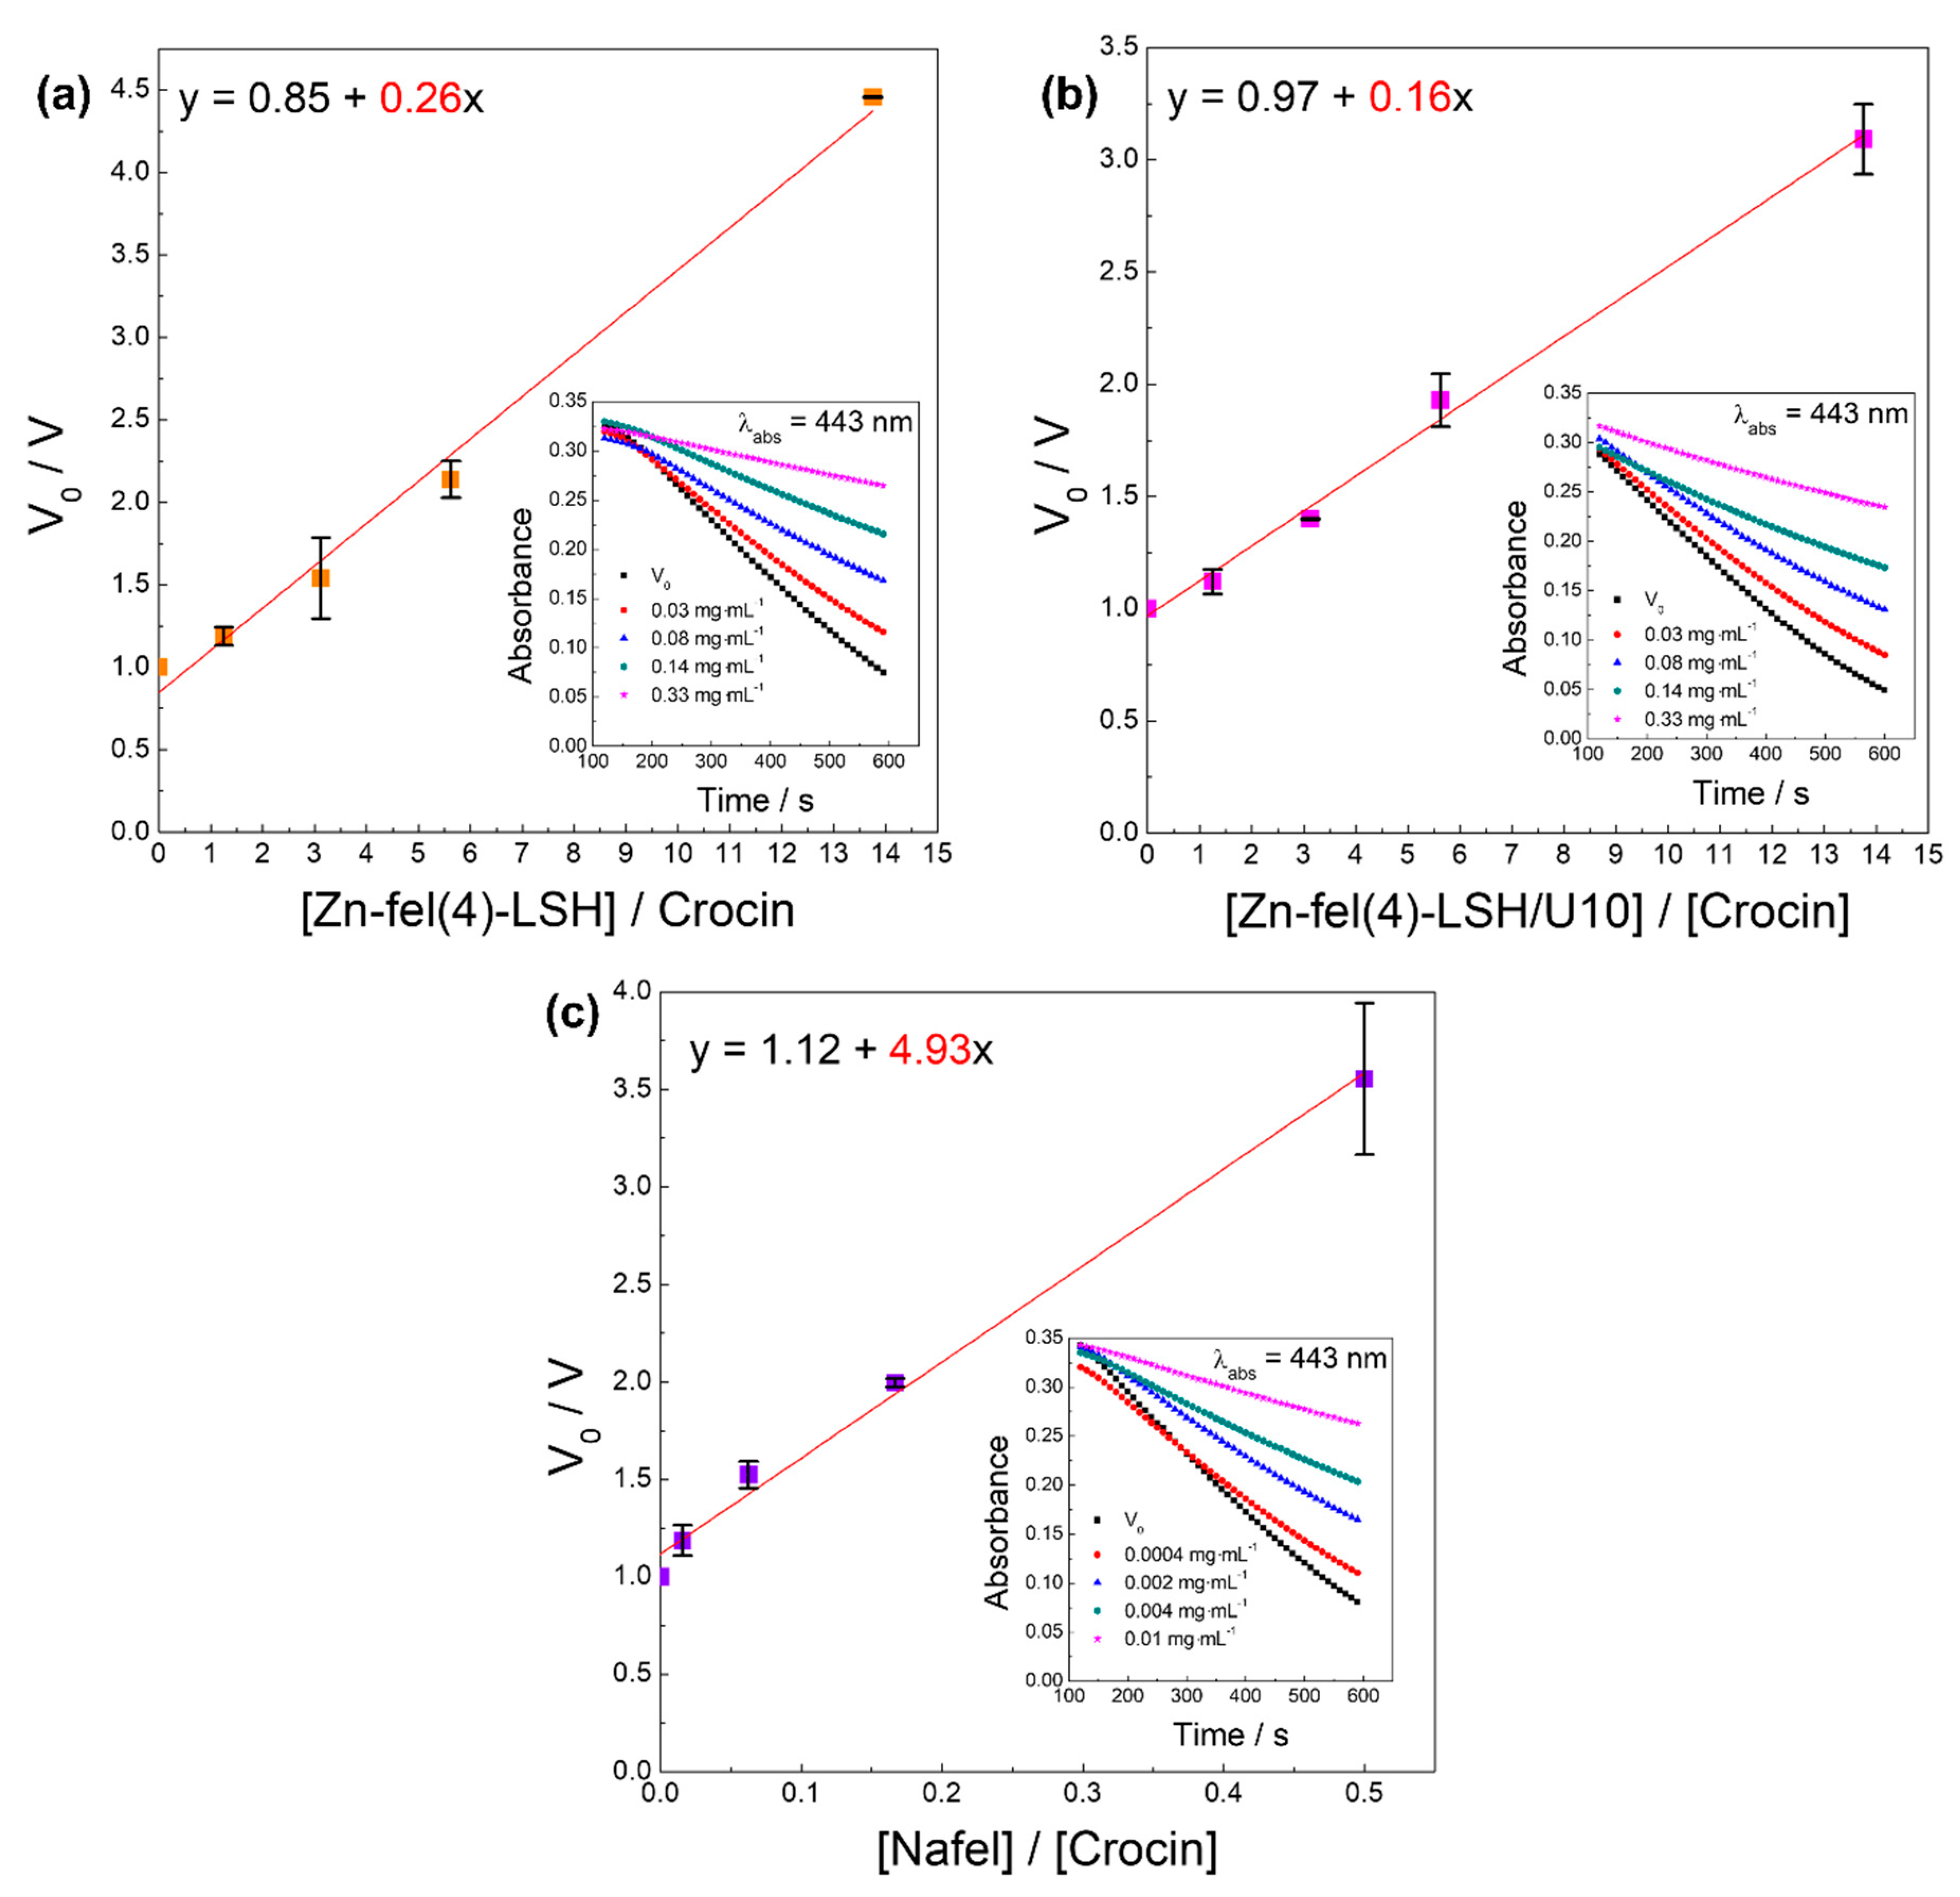
3.8.4. Crocin Bleaching Assay
4. Conclusions
Author Contributions
Funding
Acknowledgments
Conflicts of Interest
Sample Availability
Appendix A


References
- Sarkar, S.; Gaddameedhi, S. Solar ultraviolet-induced DNA damage response: Melanocytes story in transformation to environmental melanomagenesis. Environ. Mol. Mutagen. 2020, 1–16. [Google Scholar] [CrossRef] [PubMed]
- Powers, J.M.; Murphy, J.E.J. Sunlight radiation as a villain and hero: 60 years of illuminating research. Int. J. Radiat. Biol. 2019, 95, 1043–1049. [Google Scholar] [CrossRef] [PubMed]
- Baker, L.A.; Marchetti, B.; Karsili, T.N.V.; Stavros, V.G.; Ashfold, M.N.R. Photoprotection: Extending lessons learned from studying natural sunscreens to the design of artificial sunscreen constituents. Chem. Soc. Rev. 2017, 46, 3770–3791. [Google Scholar] [CrossRef] [PubMed]
- Sambandan, D.R.; Ratner, D. Sunscreens: An overview and update. J. Am. Acad. Dermatol. 2011, 64, 748–758. [Google Scholar] [CrossRef] [PubMed]
- Kockler, J.; Oelgemöller, M.; Robertson, S.; Glass, B.D. Photostability of sunscreens. J. Photochem. Photobiol. C 2012, 13, 91–110. [Google Scholar] [CrossRef]
- Huang, A.H.; Chien, A.L. Photoaging: A Review of Current Literature. Curr Derm Rep. 2020, 9, 22–29. [Google Scholar] [CrossRef]
- Modenese, A.; Korpinen, L.; Gobba, F. Solar radiation exposure and outdoor work: An underestimated occupational risk. Int. J. Environ. Res. Public Health 2018, 15, 1–24. [Google Scholar] [CrossRef]
- Hernández, J.M.G.; Escalante, A.; Vázquez, R.N.M.; Delgado, E.; González, F.J.; Toríz, G. Use of Agave tequilana-lignin and zinc oxide nanoparticles for skin photoprotection. J. Photochem. Photobiol. B 2016, 163, 156–161. [Google Scholar] [CrossRef]
- Sukarno; Law, C.S.; Santos, A. Realisation and optical engineering of linear variable bandpass filters in nanoporous anodic alumina photonic crystals. Nanoscale 2017, 9, 7541–7550. [Google Scholar] [CrossRef]
- Macleod, H.A. Thin-films optical filters, 3rd ed.; Institute of Physics Publishing: Bristol, UK, 2001; pp. 1–641. [Google Scholar]
- Saito, G.P.; Bizari, M.; Cebim, M.A.; Correa, M.A.; Jafelicci, M.; Davolos, M.R. Study of the colloidal stability and optical properties of sunscreen creams. Ecletica Quim J. 2019, 44, 26–36. [Google Scholar] [CrossRef]
- Flor, J.; Davolos, M.R.; Correa, M.A. Sunscreens. Quim. Nova 2007, 30, 153–158. [Google Scholar] [CrossRef]
- Saewan, N.; Jimtaisong, A. Natural products as photoprotection. J. Cosmet. Dermatol. 2015, 14, 47–63. [Google Scholar] [CrossRef]
- Nunes, A.R.; Vieira, I.G.P.; Queiroz, D.B.; Leal, A.L.A.B.; Morais, S.M.; Muniz, D.F.; Calixto, J.T.; Coutinho, H.D.M. Use of flavonoids and cinnamates, the main photoprotectors with natural origin. Adv. Pharmacol. Sci. 2018, 2018, 1–9. [Google Scholar] [CrossRef] [PubMed]
- Kostyuk, V.; Potapovich, A.; Albuhaydar, A.R.; Mayer, W.; De Luca, C.; Korkina, L. Natural substances for prevention of skin photoaging: Screening systems in the development of sunscreen and rejuvenation cosmetics. Rejuvenation Res. 2018, 21, 91–101. [Google Scholar] [CrossRef] [PubMed]
- Robbins, R.J. Phenolic acids in foods: An overview of analytical methodology. J. Agric. Food Chem. 2003, 51, 2866–2887. [Google Scholar] [CrossRef] [PubMed]
- Dai, J.; Mumper, R.J. Plant phenolics: Extraction, analysis and their antioxidant and anticancer properties. Molecules 2010, 15, 7313–7352. [Google Scholar] [CrossRef] [PubMed]
- Gunia-Krzyzak, A.; Sloczynska, K.; Popiol, J.; Koczurkiewicz, P.; Marona, H.; Pekala, E. Cinnamic acid derivatives in cosmetics: Current use and future prospects. Int. J. Cosmet. Sci. 2018, 40, 356–366. [Google Scholar] [CrossRef] [PubMed]
- Hwang, S.H.; Han, Y.S.; Choy, J.H. Intercalation of functional organic molecules with pharmaceutical, cosmeceutical and nutraceutical functions into layered double hydroxides and zinc basic salts. Bull. Korean Chem. Soc. 2001, 22, 1019–1022. [Google Scholar]
- Damiani, E.; Puglia, C. Nanocarriers and microcarriers for enhancing the UV protection of sunscreens: An overview. J. Pharm. Sci. 2019, 108, 3769–3780. [Google Scholar] [CrossRef]
- Yin, H.; Tang, Z. Ultrathin two-dimensional layered metal hydroxides: An emerging platform for advanced catalysis, energy conversion and storage. Chem. Soc. Rev. 2016, 45, 4873–4891. [Google Scholar] [CrossRef]
- Wypych, F.; Carbajal Arizaga, G.G. Intercalation and functionalization of brucite with carboxylic acids. Quim. Nova 2005, 28, 24–29. [Google Scholar] [CrossRef]
- Carbajal Arizaga, G.G.; Satyanarayana, K.G.; Wypych, F. Layered hydroxide salts: Synthesis, properties and potential applications. Solid State Ionics 2007, 178, 1143–1162. [Google Scholar] [CrossRef]
- Aisawa, S.; Ishida, E.; Takahashi, S.; Hirahara, H.; Narita, E. Synthesis and ultraviolet-ray-shielding property of organic UV-absorbent intercalated layered zinc hydroxide. Chem. Lett. 2005, 34, 630–631. [Google Scholar] [CrossRef]
- Cursino, A.C.T.; Gardolinski, J.E.F.D.; Wypych, F. Intercalation of anionic organic ultraviolet ray absorbers into layered zinc hydroxide nitrate. J. Colloid Interface Sci. 2010, 347, 49–55. [Google Scholar] [CrossRef] [PubMed]
- Cursino, A.C.T.; Mangrich, A.S.; Gardolinski, J.E.F.D.; Mattoso, N.; Wypych, F. Effect of confinement of anionic organic ultraviolet ray absorbers into two-dimensional zinc hydroxide nitrate galleries. J. Braz. Chem. Soc. 2011, 22, 1183–1191. [Google Scholar] [CrossRef]
- Mohsin, S.M.N.; Hussein, M.Z.; Sarijo, S.H.; Fakurazi, S.; Arulselvan, P.; Hin, T.Y.Y. Synthesis of (cinnamate-zinc layered hydroxide) intercalation compound for sunscreen application. Chem. Cent. J. 2013, 7, 1–12. [Google Scholar] [CrossRef]
- Cursino, A.C.T.; Rives, V.; Carlos, L.D.; Rocha, J.; Wypych, F. Layered Zinc Hydroxide Salts Intercalated with Anionic Surfactants and Adsolubilized with UV Absorbing Organic Molecules. J. Braz. Chem. Soc. 2015, 26, 1769–1780. [Google Scholar] [CrossRef]
- Aziz, I.N.F.A.; Sarijo, S.H.; Rajidi, F.S.M.; Yahaya, R.; Musa, M. Synthesis and characterization of novel 4-aminobenzoate interleaved with zinc layered hydroxide for potential sunscreen application. J. Porous Mater. 2019, 26, 717–722. [Google Scholar] [CrossRef]
- Ruiz, C.V.; Rodriguez-Castellon, E.; Giraldo, O. Structural Analysis and Conduction Mechanisms in Polycrystalline Zinc Hydroxide Nitrate. Inorg. Chem. 2018, 57, 9067–9078. [Google Scholar] [CrossRef]
- Nogueira, T.; Wypych, F.; Mei, L.; Lona, L. Effect of layered hydroxide salts, produced by two different methods, on the mechanical and thermal properties of poly(methyl methacrylate). Polym. Eng. Sci. 2019, 59, 1065–1074. [Google Scholar] [CrossRef]
- Stählin, W.; Oswald, H.R. The crystal structure of zinc hydroxide nitrate, Zn5(OH)8(NO3)2.2H2O. Acta Cryst. 1970, 26, 860–863. [Google Scholar] [CrossRef]
- Marangoni, R.; Ramos, L.P.; Wypych, F. New multifunctional materials obtained by the intercalation of anionic dyes into layered zinc hydroxide nitrate followed by dispersion into poly(vinyl alcohol) (PVA). J. Colloid Interface Sci. 2009, 330, 303–309. [Google Scholar] [CrossRef] [PubMed]
- Roth, W.J.; Gil, B.; Makowski, W.; Marszalek, B.; Eliasova, P. Layer like porous materials with hierarchical structure. Chem. Soc. Rev. 2016, 45, 3400–3438. [Google Scholar] [CrossRef] [PubMed]
- Shchukin, D.G.; Skorb, E.; Belova, V.; Mohwald, H. Ultrasonic Cavitation at Solid Surfaces. Adv. Mater. 2011, 23, 1922–1934. [Google Scholar] [CrossRef] [PubMed]
- Rojas, R.; Giacomelli, C.E. Effect of structure and bonding on the interfacial properties and the reactivity of layered double hydroxides and Zn hydroxide salts. Colloids Surf., A 2013, 419, 166–173. [Google Scholar] [CrossRef]
- Ruiz, C.V.; Becerra, M.E.; Giraldo, O. Structural, thermal, and release properties of hybrid materials based on layered zinc hydroxide and caffeic acid. Nanomaterials 2020, 10, 163. [Google Scholar] [CrossRef] [PubMed]
- Cano-Sarmiento, C.; Tellez-Medina, D.I.; Viveros-Contreras, R.; Cornejo-Mazon, M.; Figueroa-Hernandez, C.Y.; Garcia-Armenta, E.; Alamilla-Beltran, L.; Garcia, H.S.; Gutierrez-Lopez, G.F. Zeta Potential of Food Matrices. Food Eng. Rev. 2018, 10, 113–138. [Google Scholar] [CrossRef]
- Bhattacharjee, S. DLS and zeta potential—What they are and what they are not? J. Control. Release 2016, 235, 337–351. [Google Scholar] [CrossRef]
- Xu, Z.P.; Jin, Y.G.; Liu, S.M.; Hao, Z.P.; Lu, G.Q. Surface charging of layered double hydroxides during dynamic interactions of anions at the interfaces. J. Colloid Interface Sci. 2008, 326, 522–529. [Google Scholar] [CrossRef]
- Machado, G.S.; Arizaga, G.G.C.; Wypych, F.; Nakagaki, S. Immobilization of anionic metalloporphyrins on zinc hydroxide nitrate and study of an unusual catalytic activity. J. Catal. 2010, 274, 130–141. [Google Scholar] [CrossRef]
- Nakamoto, K. Infrared and Raman Spectra of Inorganic and Coordination Compounds, 5th ed.; John Wiley & Sons: New York, NY, USA, 1997; pp. 1–484. [Google Scholar]
- Kang, H.; Kim, H.J.; Yang, J.H.; Kim, T.H.; Choi, G.; Paek, S.M.; Choi, A.J.; Choy, J.H.; Oh, J.M. Intracrystalline structure and release pattern of ferulic acid intercalated into layered double hydroxide through various synthesis routes. Appl. Clay Sci. 2015, 112, 32–39. [Google Scholar] [CrossRef]
- Olga, G.; Styliani, C.; Ioannis, R.G. Coencapsulation of Ferulic and Gallic acid in hp-b-cyclodextrin. Food Chem. 2015, 185, 33–40. [Google Scholar] [CrossRef] [PubMed]
- Pavia, D.L.; Lampman, G.M.; Kriz, G.S.; Vyvyan, J.R. Infrared Spectroscopy. In Introduction to Spectroscopy, 5th ed.; Cengage Learning: Stamford, CT, USA, 2013; pp. 14–106. [Google Scholar]
- Deacon, G.B.; Phillips, R.J. Relationships between the carbon-oxygen stretching frequencies of carboxilato complexes and the type of carboxylate coordination. Coord. Chem. Rev. 1980, 33, 227–250. [Google Scholar] [CrossRef]
- Ahmed, A.A.A.; Talib, Z.A.; bin Hussein, M.Z.; Zakaria, A. Zn-Al layered double hydroxide prepared at different molar ratios: Preparation, characterization, optical and dielectric properties. J. Solid State Chem. 2012, 191, 271–278. [Google Scholar] [CrossRef]
- Junior Quites, F.; Germino, J.C.; Atvars, T.D.Z. Improvement in the emission properties of a luminescent anionic dye intercalated between the lamellae of zinc hydroxide-layered. Colloids Surf. A 2014, 459, 194–201. [Google Scholar] [CrossRef]
- Wang, J.; Cao, Y.; Sun, B.; Wang, C. Characterisation of inclusion complex of trans-ferulic acid and hydroxypropyl-β-cyclodextrin. Food Chem. 2011, 124, 1069–1075. [Google Scholar] [CrossRef]
- Pavia, D.L.; Lampman, G.M.; Kriz, G.S.; Vyvyan, J.R. Ultraviolet Spectroscopy. In Introduction to Spectroscopy, 5th ed.; Cengage Learning: Stamford, CT, USA, 2013; pp. 577–613. [Google Scholar]
- Stanfield, J.; Osterwalder, U.; Herzog, B. In vitro measurements of sunscreen protection. Photochem. Photobiol. Sci. 2010, 9, 489–494. [Google Scholar] [CrossRef]
- Binks, B.P.; Fletcher, P.D.I.; Johnson, A.J.; Marinopoulos, I.; Crowther, J.; Thompson, M.A. How the sun protection factor (SPF) of sunscreen films change during solar irradiation. J. Photochem. Photobiol. A 2017, 333, 186–199. [Google Scholar] [CrossRef]
- Wang, S.Q.; Lim, H.W. Current status of the sunscreen regulation in the United States: 2011 Food and Drug Administration’s final rule on labeling and effectiveness testing. J. Am. Acad. Dermatol. 2011, 65, 863–869. [Google Scholar] [CrossRef]
- Passeron, T.; Bouillon, R.; Callender, V.; Cestari, T.; Diepgen, T.L.; Green, A.C.; van der Pols, J.C.; Bernard, B.A.; Ly, F.; Bernerd, F.; et al. Sunscreen photoprotection and vitamin D status. Br. J. Dermatol. 2019, 181, 916–931. [Google Scholar] [CrossRef]
- Chan, T.C.W.; Berka, J.L.W.; Deliyanti, D.; Hunter, D.; Fung, A.; Liew, G.; White, A. The role of reactive oxygen species in the pathogenesis and treatment of retinal diseases. Exp. Eye Res. 2020, 201, 108255. [Google Scholar] [CrossRef]
- Lúcio, M.; Nunes, C.; Gaspar, D.; Ferreira, H.; Lima, J.L.F.C.; Reis, S. Antioxidant activity of vitamin E and trolox: Understanding of the factors that govern lipid peroxidation studies in vitro. Food Biophys. 2009, 4, 312–320. [Google Scholar] [CrossRef]
- Spagnol, C.M.; Assis, R.P.; Brunetti, I.L.; Isaac, V.L.B.; Salgado, H.R.N.; Corrêa, M.A. In vitro methods to determine the antioxidant activity of caffeic acid. Spectrochim. Acta Part A 2019, 219, 358–366. [Google Scholar] [CrossRef] [PubMed]
- Saito, G.P.; Romero, J.H.S.; Cebim, M.A.; Davolos, M.R. Eu(III) doped LDH intercalated with cinnamate anion as multifunctional sunscreens. J. Lumin. 2018, 203, 160–164. [Google Scholar] [CrossRef]
- Franco, J.G.; Ataide, J.A.; Ferreira, A.H.P.; Mazolla, P.G. Lamellar compounds intercalated with anions with solar protection function: A review. J. Drug. Deliv. Sci. Technol. 2020, 59, 1–5. [Google Scholar] [CrossRef]
- Prior, R.L.; Wu, X.; Schaich, K. Standardized methods for the determination of antioxidant capacity and phenolics in foods and dietary supplements. J. Agric. Food Chem. 2005, 53, 4290–4302. [Google Scholar] [CrossRef] [PubMed]
- Almeida, M.G.J.; Chiari, B.G.; Corrêa, M.A.; Chung, M.C.; Isaac, V.L.B. Validation of an alternative analytical method for the quantification of antioxidant activity in plant extracts. Lat. Am. J. Pharm. 2013, 32, 90–95. [Google Scholar]
- Lapenna, D.; Cuccurullo, F. Hypochlorous acid and its pharmacological antagonism: An update picture. Gen. Pharmacol. 1996, 27, 1145–1147. [Google Scholar] [CrossRef]
- Assis, R.P.; Castro, J.F.A.; Gutierres, V.O.; Arcaro, C.A.; Brotto, R.S.; Olga Oliveira, M.M.F.; Baviera, A.M.; Brunetti, I.L. Effects of uremic solutes on reactive oxygen species in vitro model systems as a possibility of support the renal function management. BMC Nephrol. 2015, 16, 1–13. [Google Scholar] [CrossRef]
- Gers-Barlag, H.; Klette, E.; Bimczok, R.; Springob, C.; Finkel, P.; Rudolph, T.; Gonzenbach, H.U.; Schneider, P.H.; Kockott, D.; Heinrich, U.; et al. In vitro testing to assess the UVA protection performance of sun care products. Int. J. Cosmet. Sci. 2001, 23, 3–14. [Google Scholar]
- ISO 24443:2012. Determination of Sunscreen UVA Photoprotection In Vitro, International Organization for Standardization; ISO: Geneva, Switzerland, 2012. [Google Scholar]
- Berni, A.; Mennig, M.; Schmidt, H. Doctor Blade. In Sol-Gel Technologies for Glass Producers and Users; Aegerter, M.A., Mennig, M., Eds.; Springer: Boston, MA, USA, 2004; pp. 89–92. [Google Scholar]
- Soares, J.R.; Dinis, T.C.P.; Cunha, A.P.; Almeida, L.M. Antioxidant Activities of Some Extracts of Thymus zygis. Free Rad. Res. 1997, 26, 469–478. [Google Scholar] [CrossRef]
- Re, R.; Pellegrini, N.; Proteggente, A.; Pannala, A.; Yang, M.; Rice-Evans, C. Antioxidant activity applying improved ABTS radical cation decolorization assay. Free Radic. Biol. Med. 1999, 26, 1231–1237. [Google Scholar] [CrossRef]
- Zgliczynski, J.M.; Stelmaszynska, T.; Domanska, J.; Ostrowski, W. Chloramines as intermediates of oxidation reaction of amino acids by myeloperoxidase. Biochem. Biophys. Acta. 1971, 235, 419–424. [Google Scholar] [CrossRef]
- Dypbukt, J.M.; Bishop, C.; Brooks, W.M.; Thong, B.; Eriksson, H.; Kettle, A.J. A sensitive and selective assay for chloramine production by myeloperoxidase. Free Radic. Biol. Med. 2005, 39, 1468–1477. [Google Scholar] [CrossRef] [PubMed]
- Tubaro, F.; Ghiselli, A.; Rapuzzi, P.; Maiorino, M.; Ursini, F. Analysis of plasma antioxidant capacity by competition kinetics. Free Radic. Biol. Med. 1998, 24, 1228–1234. [Google Scholar] [CrossRef]


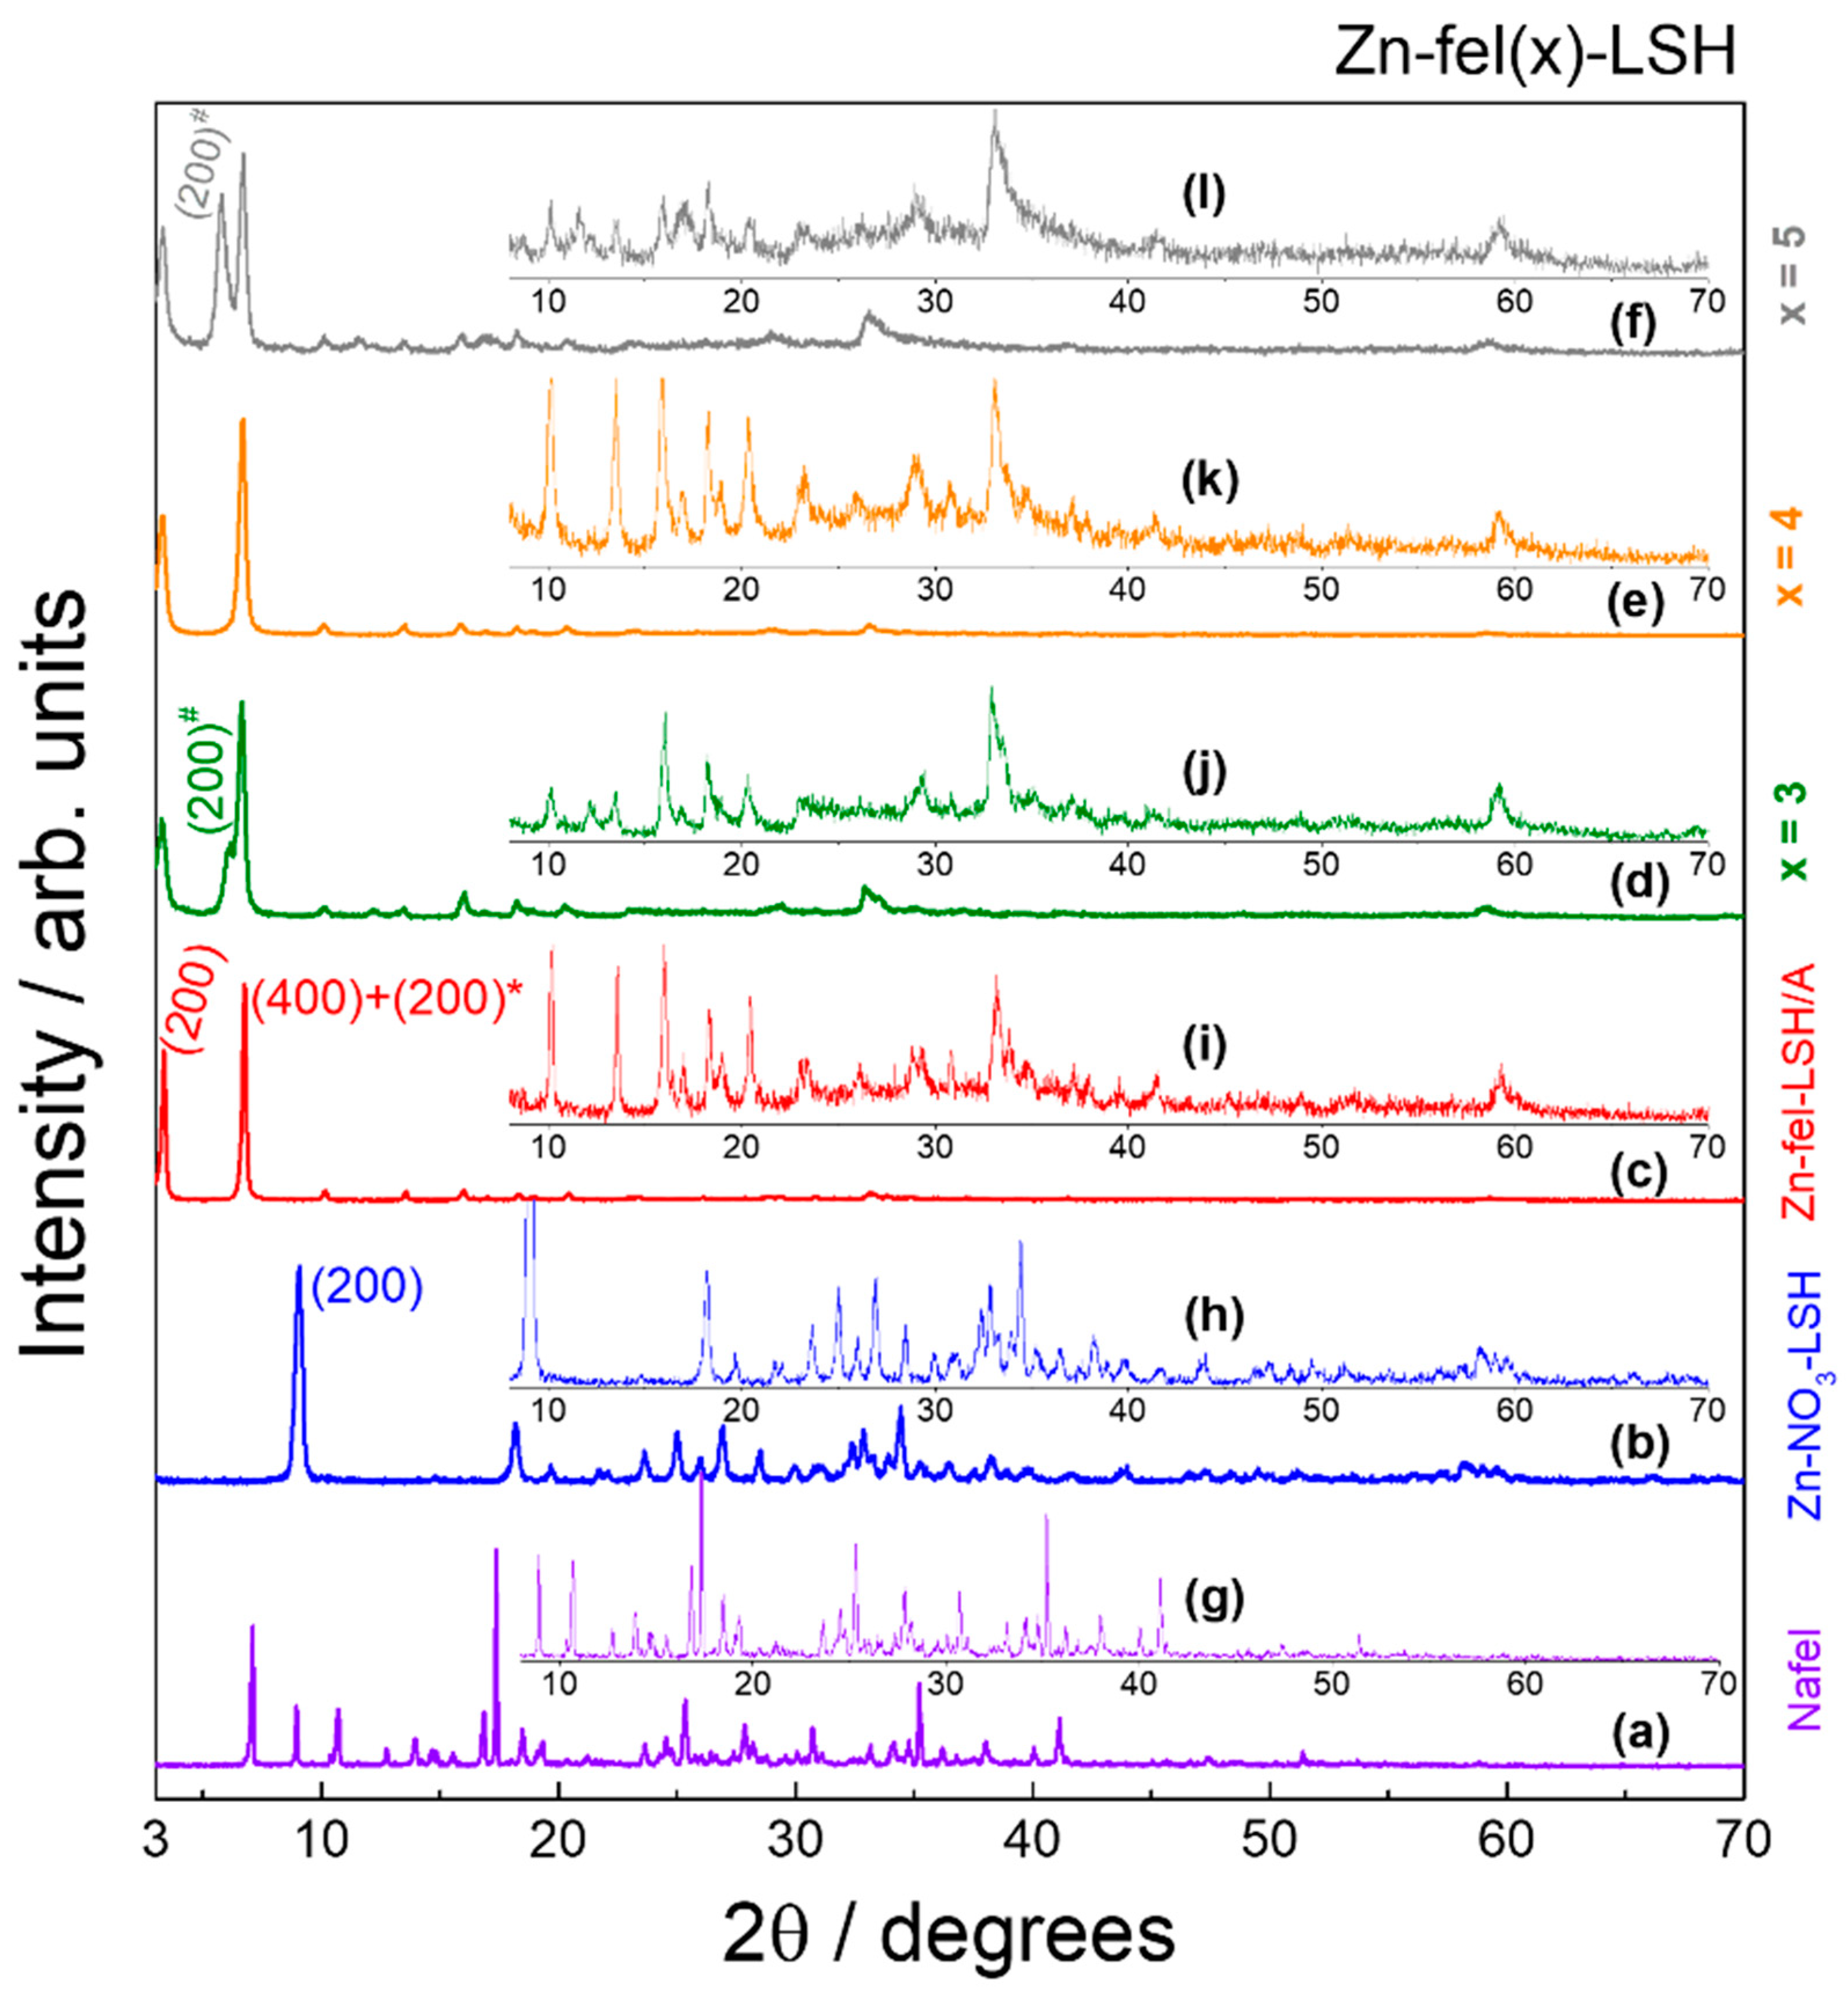
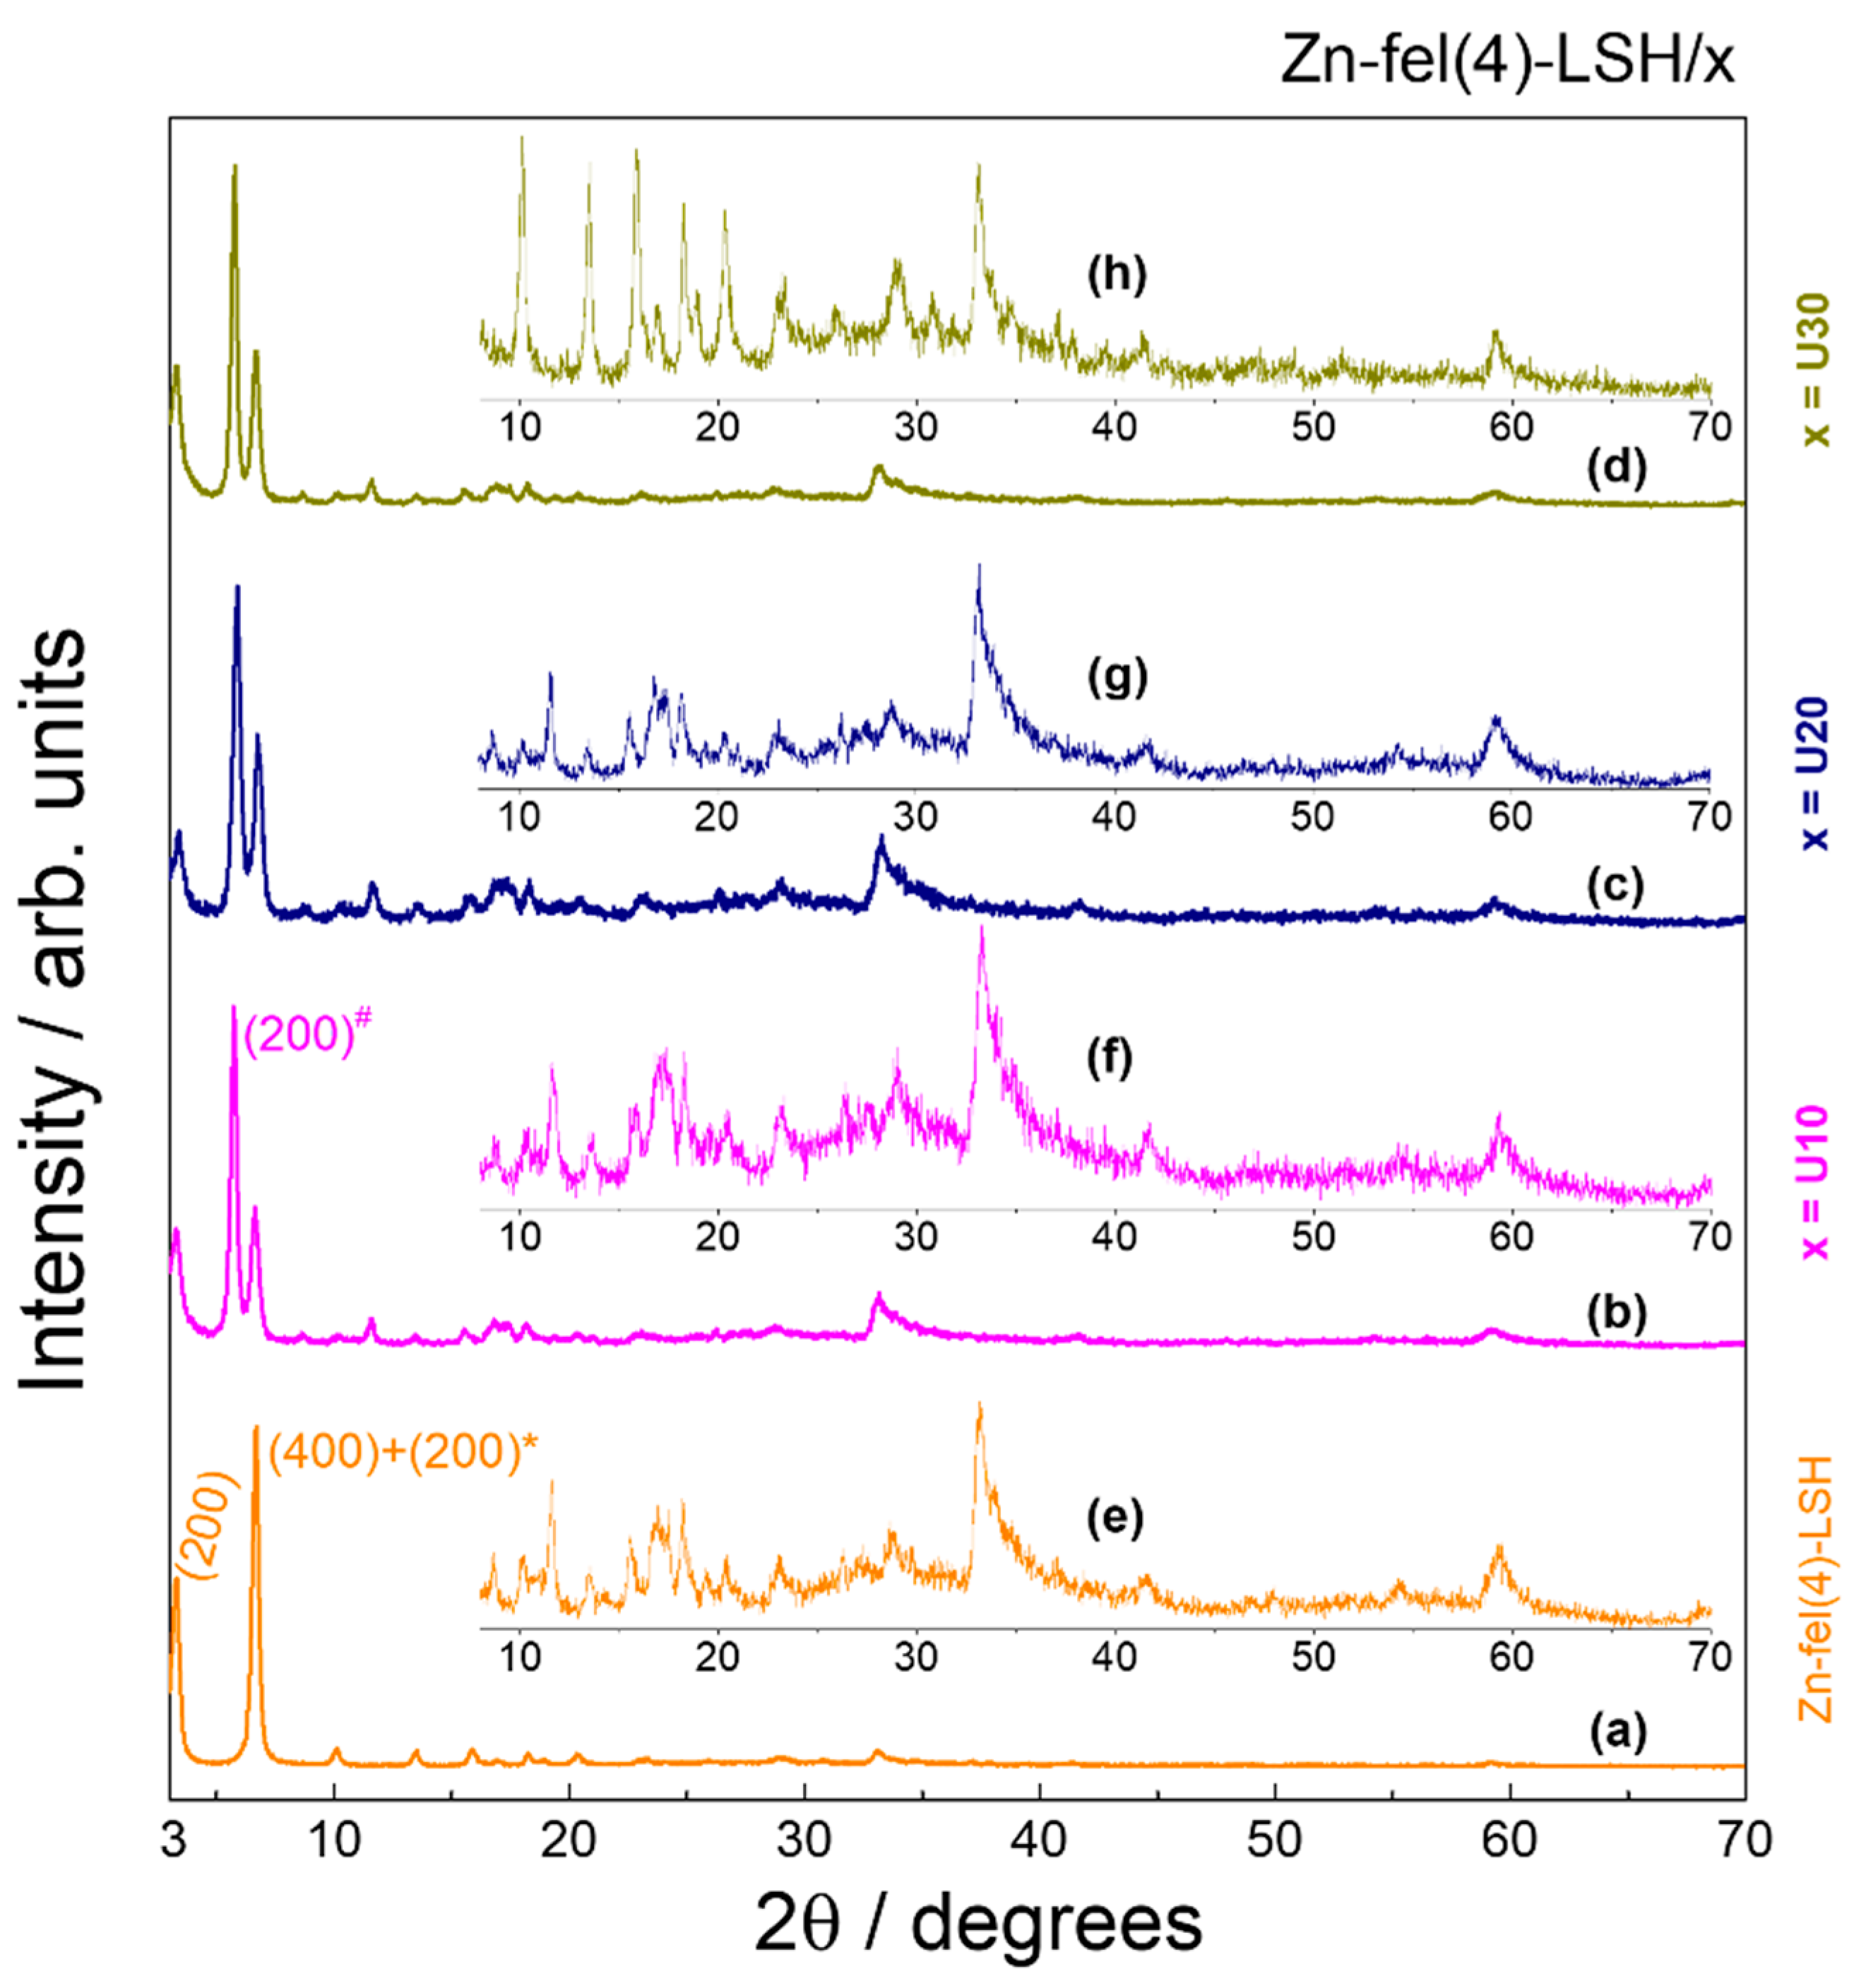
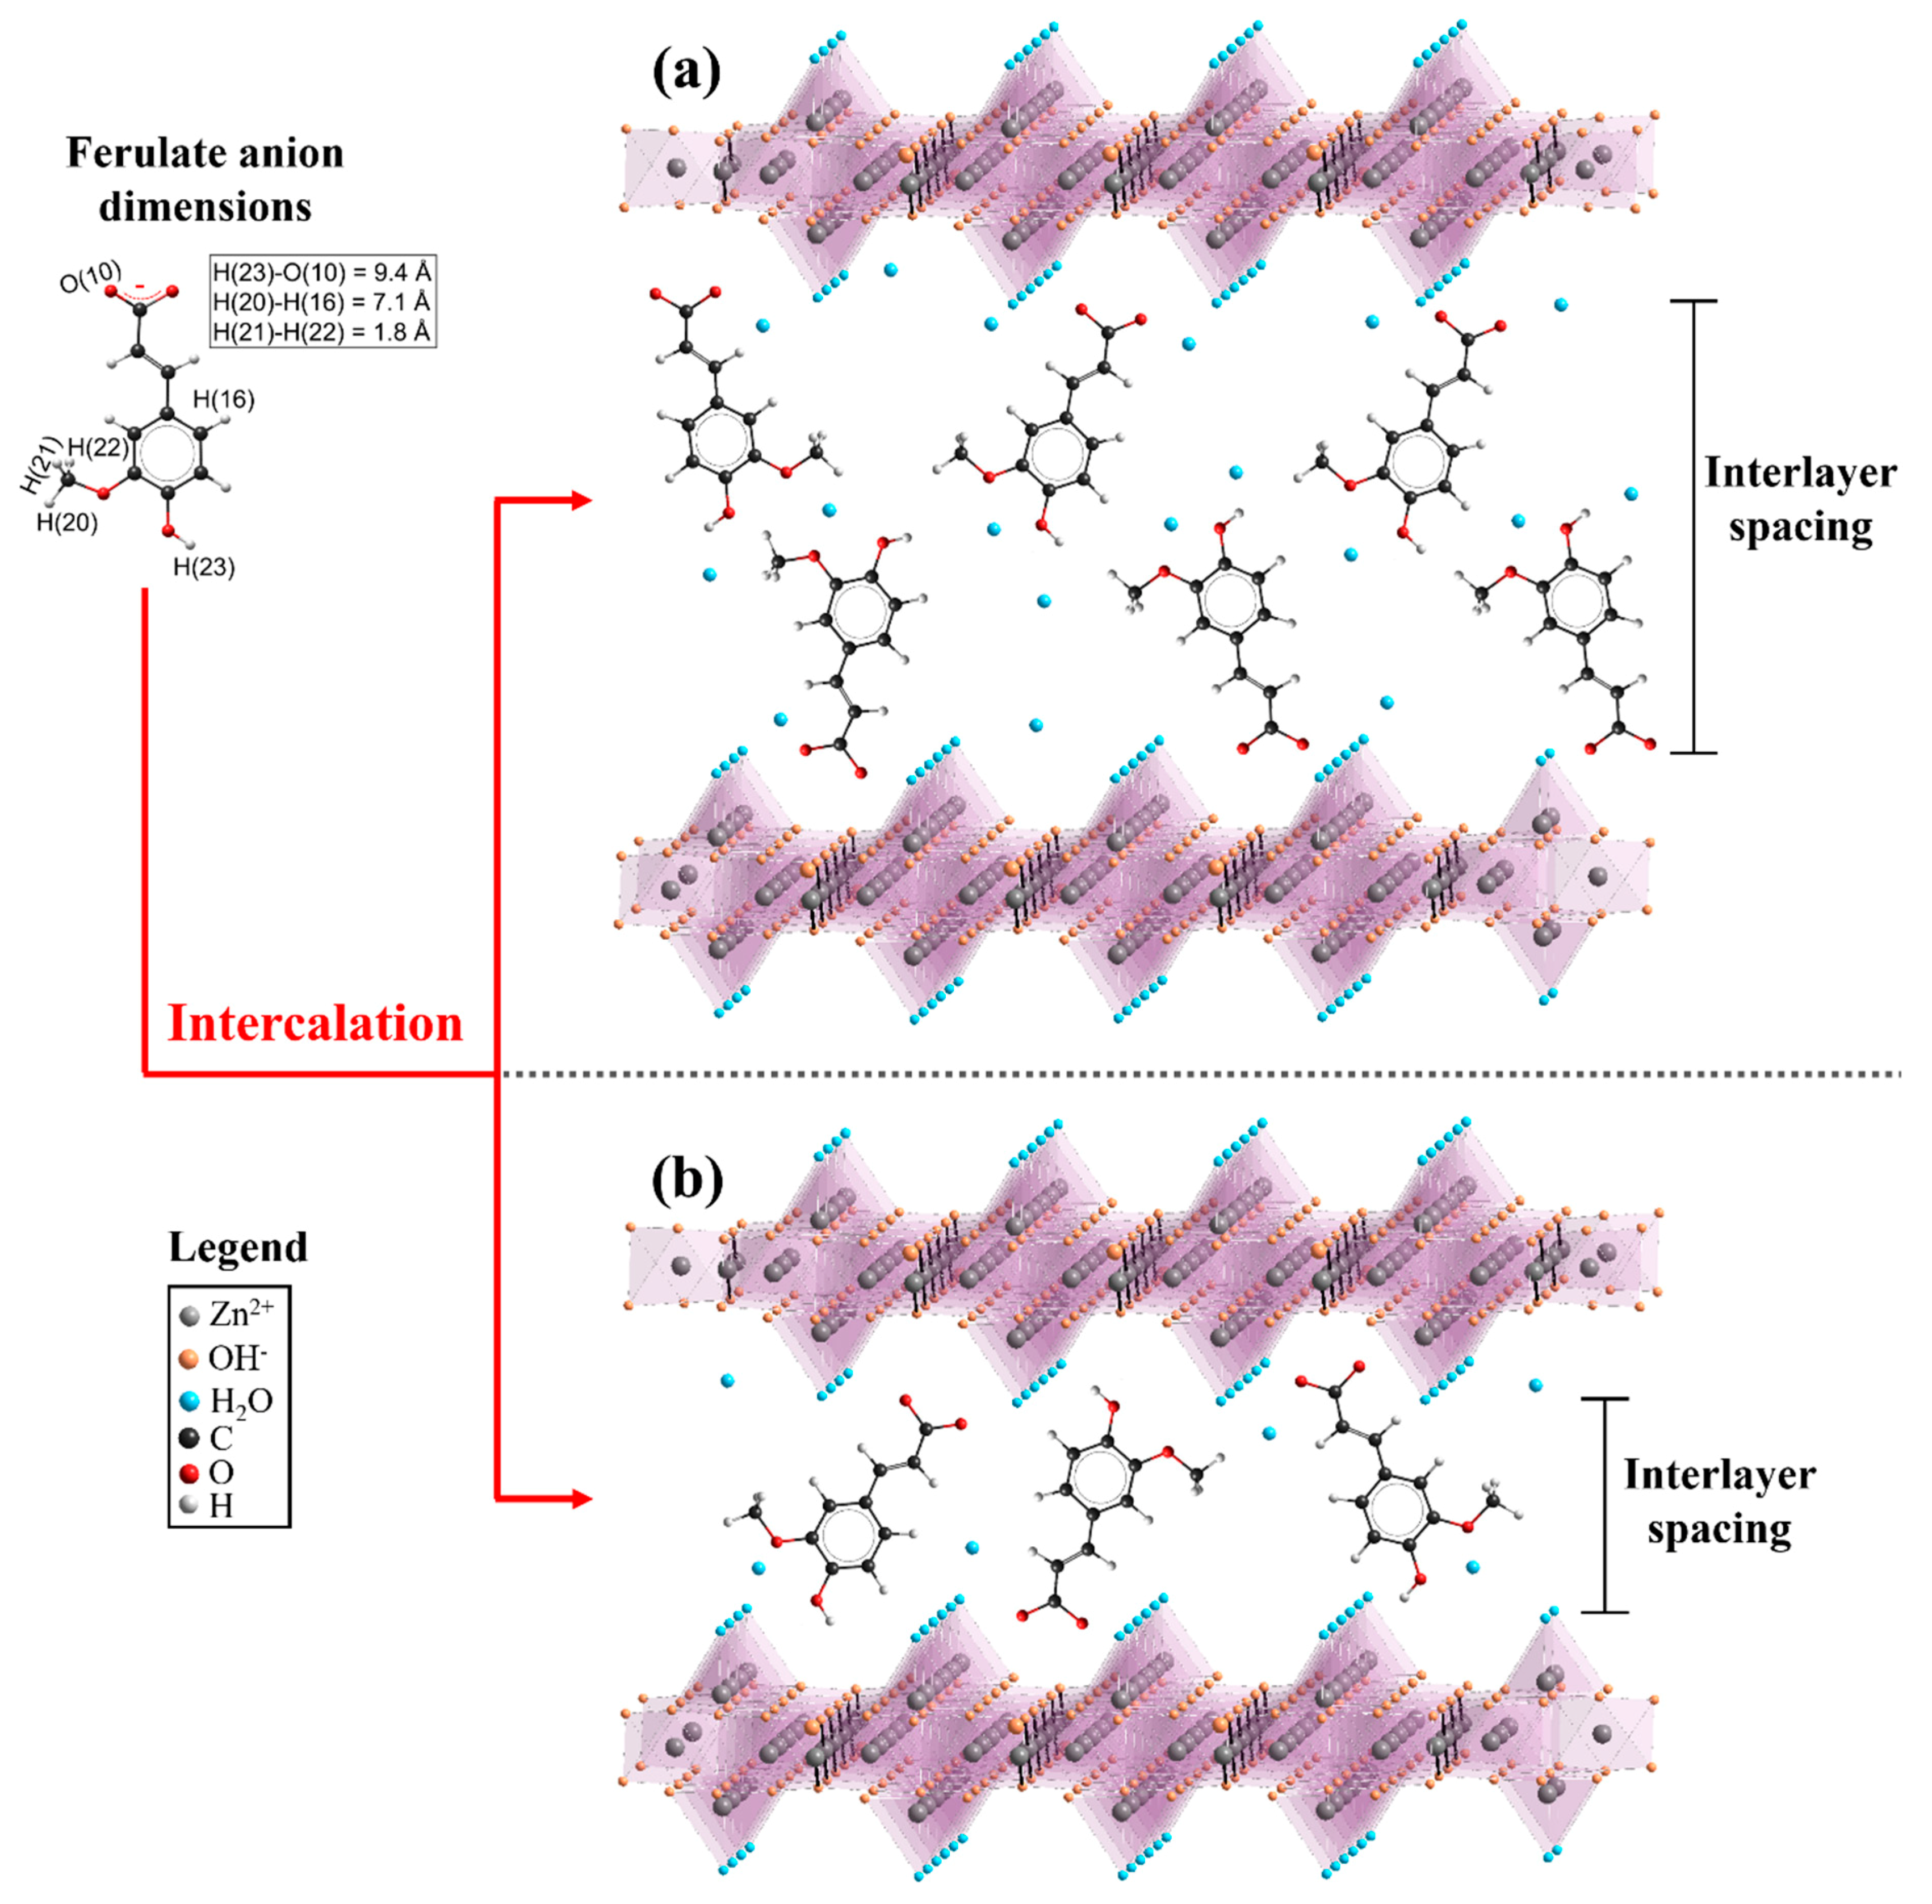
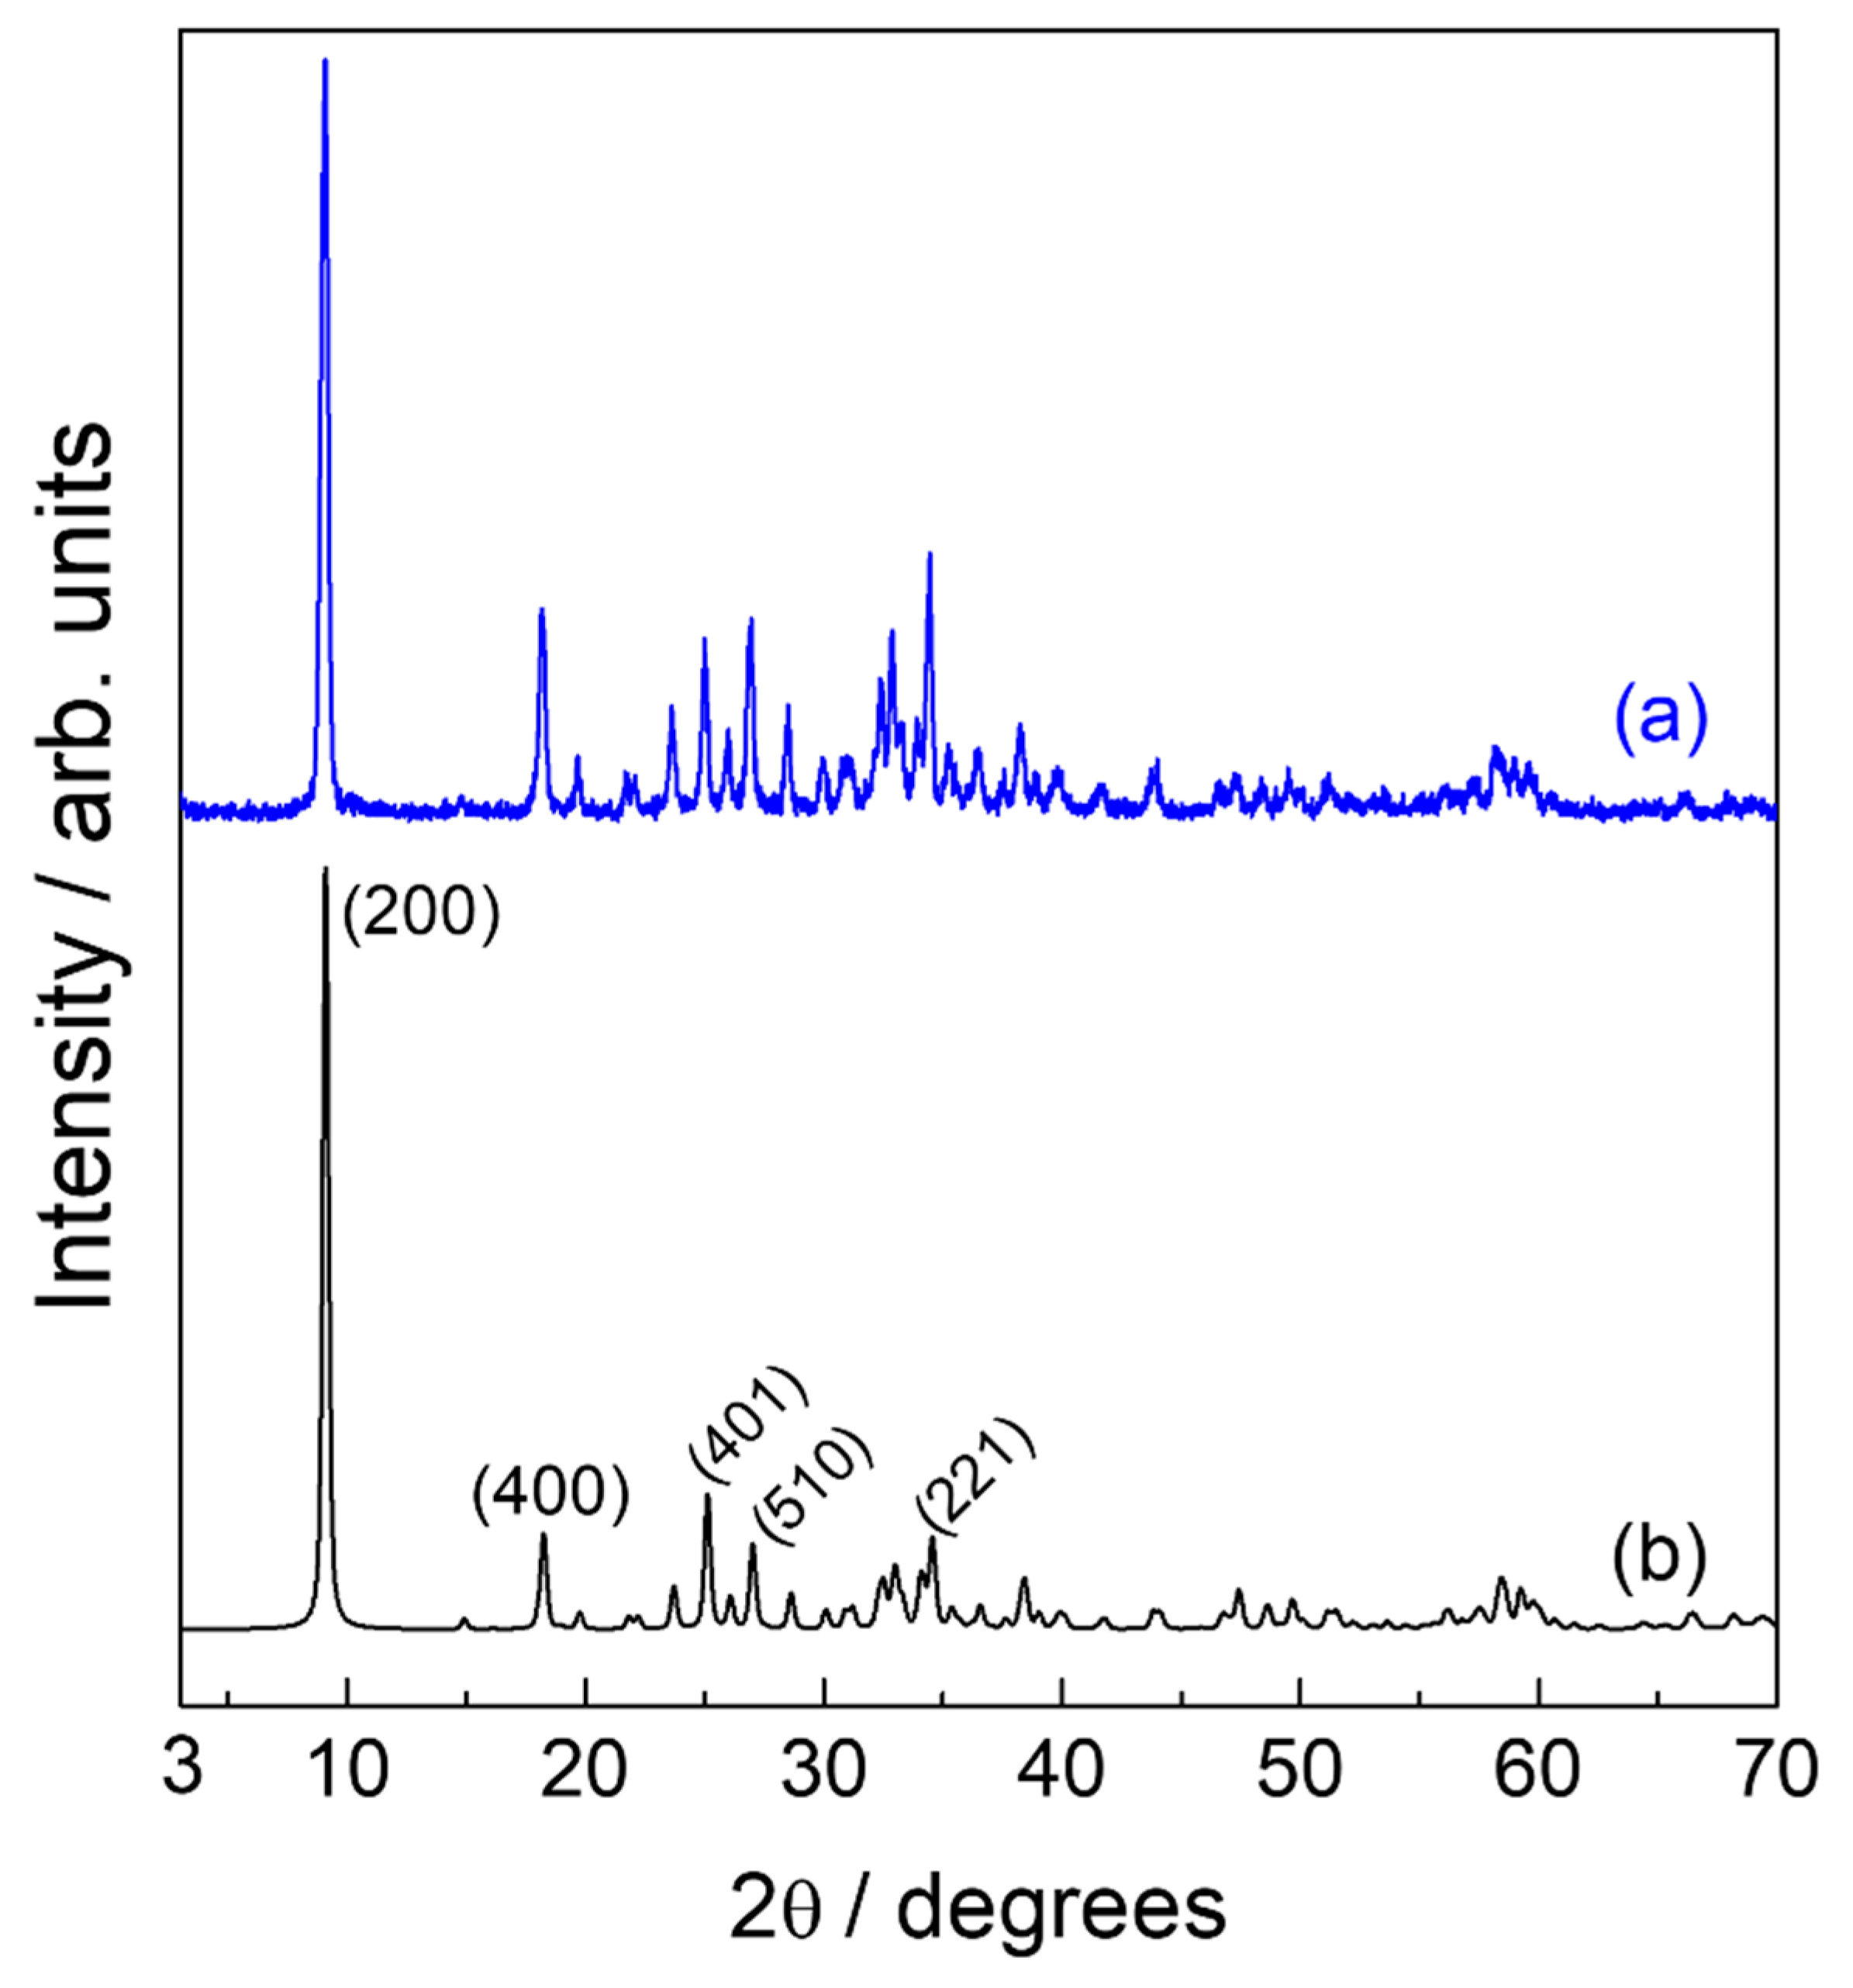
| Sample | d200/Å | Basal Distance/Å | Interlayer Spacing/Å |
|---|---|---|---|
| Zn-NO3-LSH | 9.74 | 9.74 | - |
| Zn-fel-LSH/A | 26.30 | 26.17 | 16.17 |
| 13.08 * | 13.05 * | 3.05 * | |
| Zn-fel(3)-LSH | 27.10 | 26.54 | 16.54 |
| 14.35 * | 14.48 * | 4.48 * | |
| 13.27 # | 13.19 # | 3.19 # | |
| Zn-fel(4)-LSH | 26.94 | 26.45 | 16.45 |
| 13.23 * | 13.17 * | 3.17 * | |
| Zn-fel(4)-LSH/U10 | 26.94 | 26.48 | 16.48 |
| 15.40 * | 15.33 * | 5.33 * | |
| 13.31 # | 13.23 # | 3.23 # | |
| Zn-fel(4)-LSH/U20 | 25.83 | 25.99 | 15.99 |
| 14.98 * | 15.14 * | 5.14 * | |
| 13.00 # | 13.03 # | 3.03 # | |
| Zn-fel(4)-LSH/U30 | 26.61 | 26.44 | 16.44 |
| 15.29 * | 15.28 * | 5.28 * | |
| 13.27 # | 13.17 | 3.17 | |
| Zn-fel(5)-LSH | 26.77 | 26.37 | 16.37 |
| 15.24 * | 15.27 * | 5.27 * | |
| 13.15 # | 13.12 # | 3.12 # |
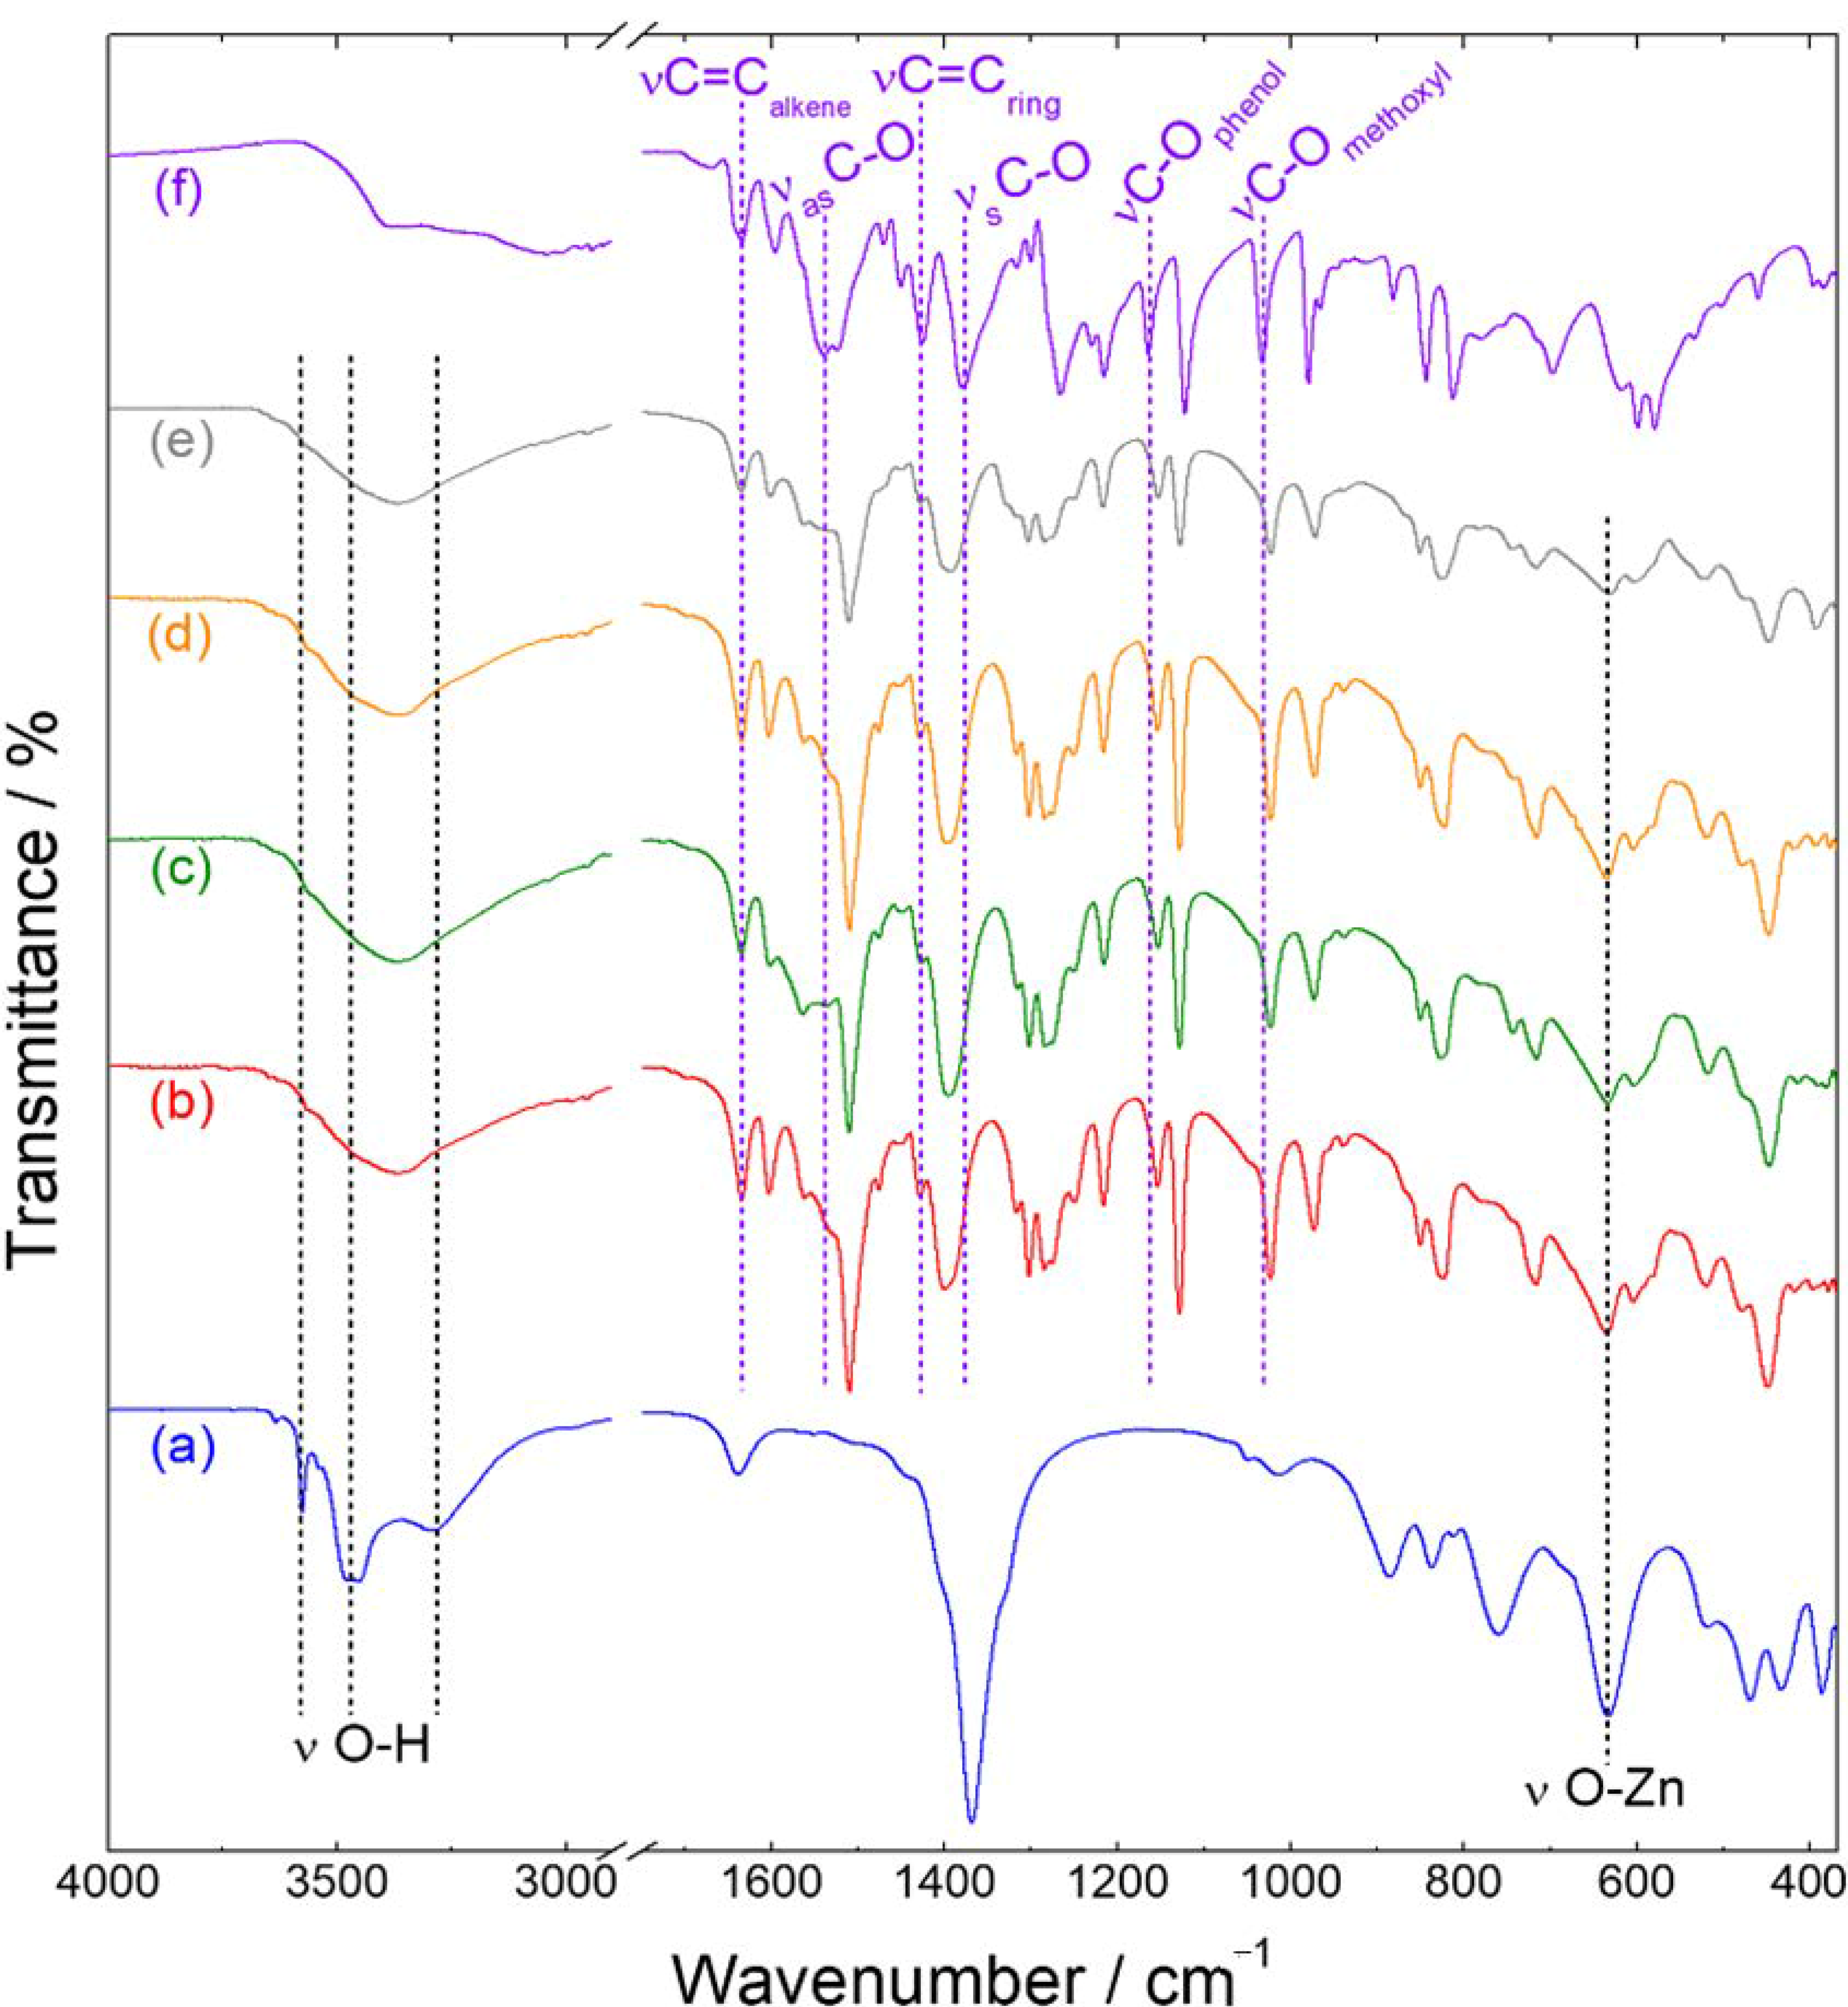
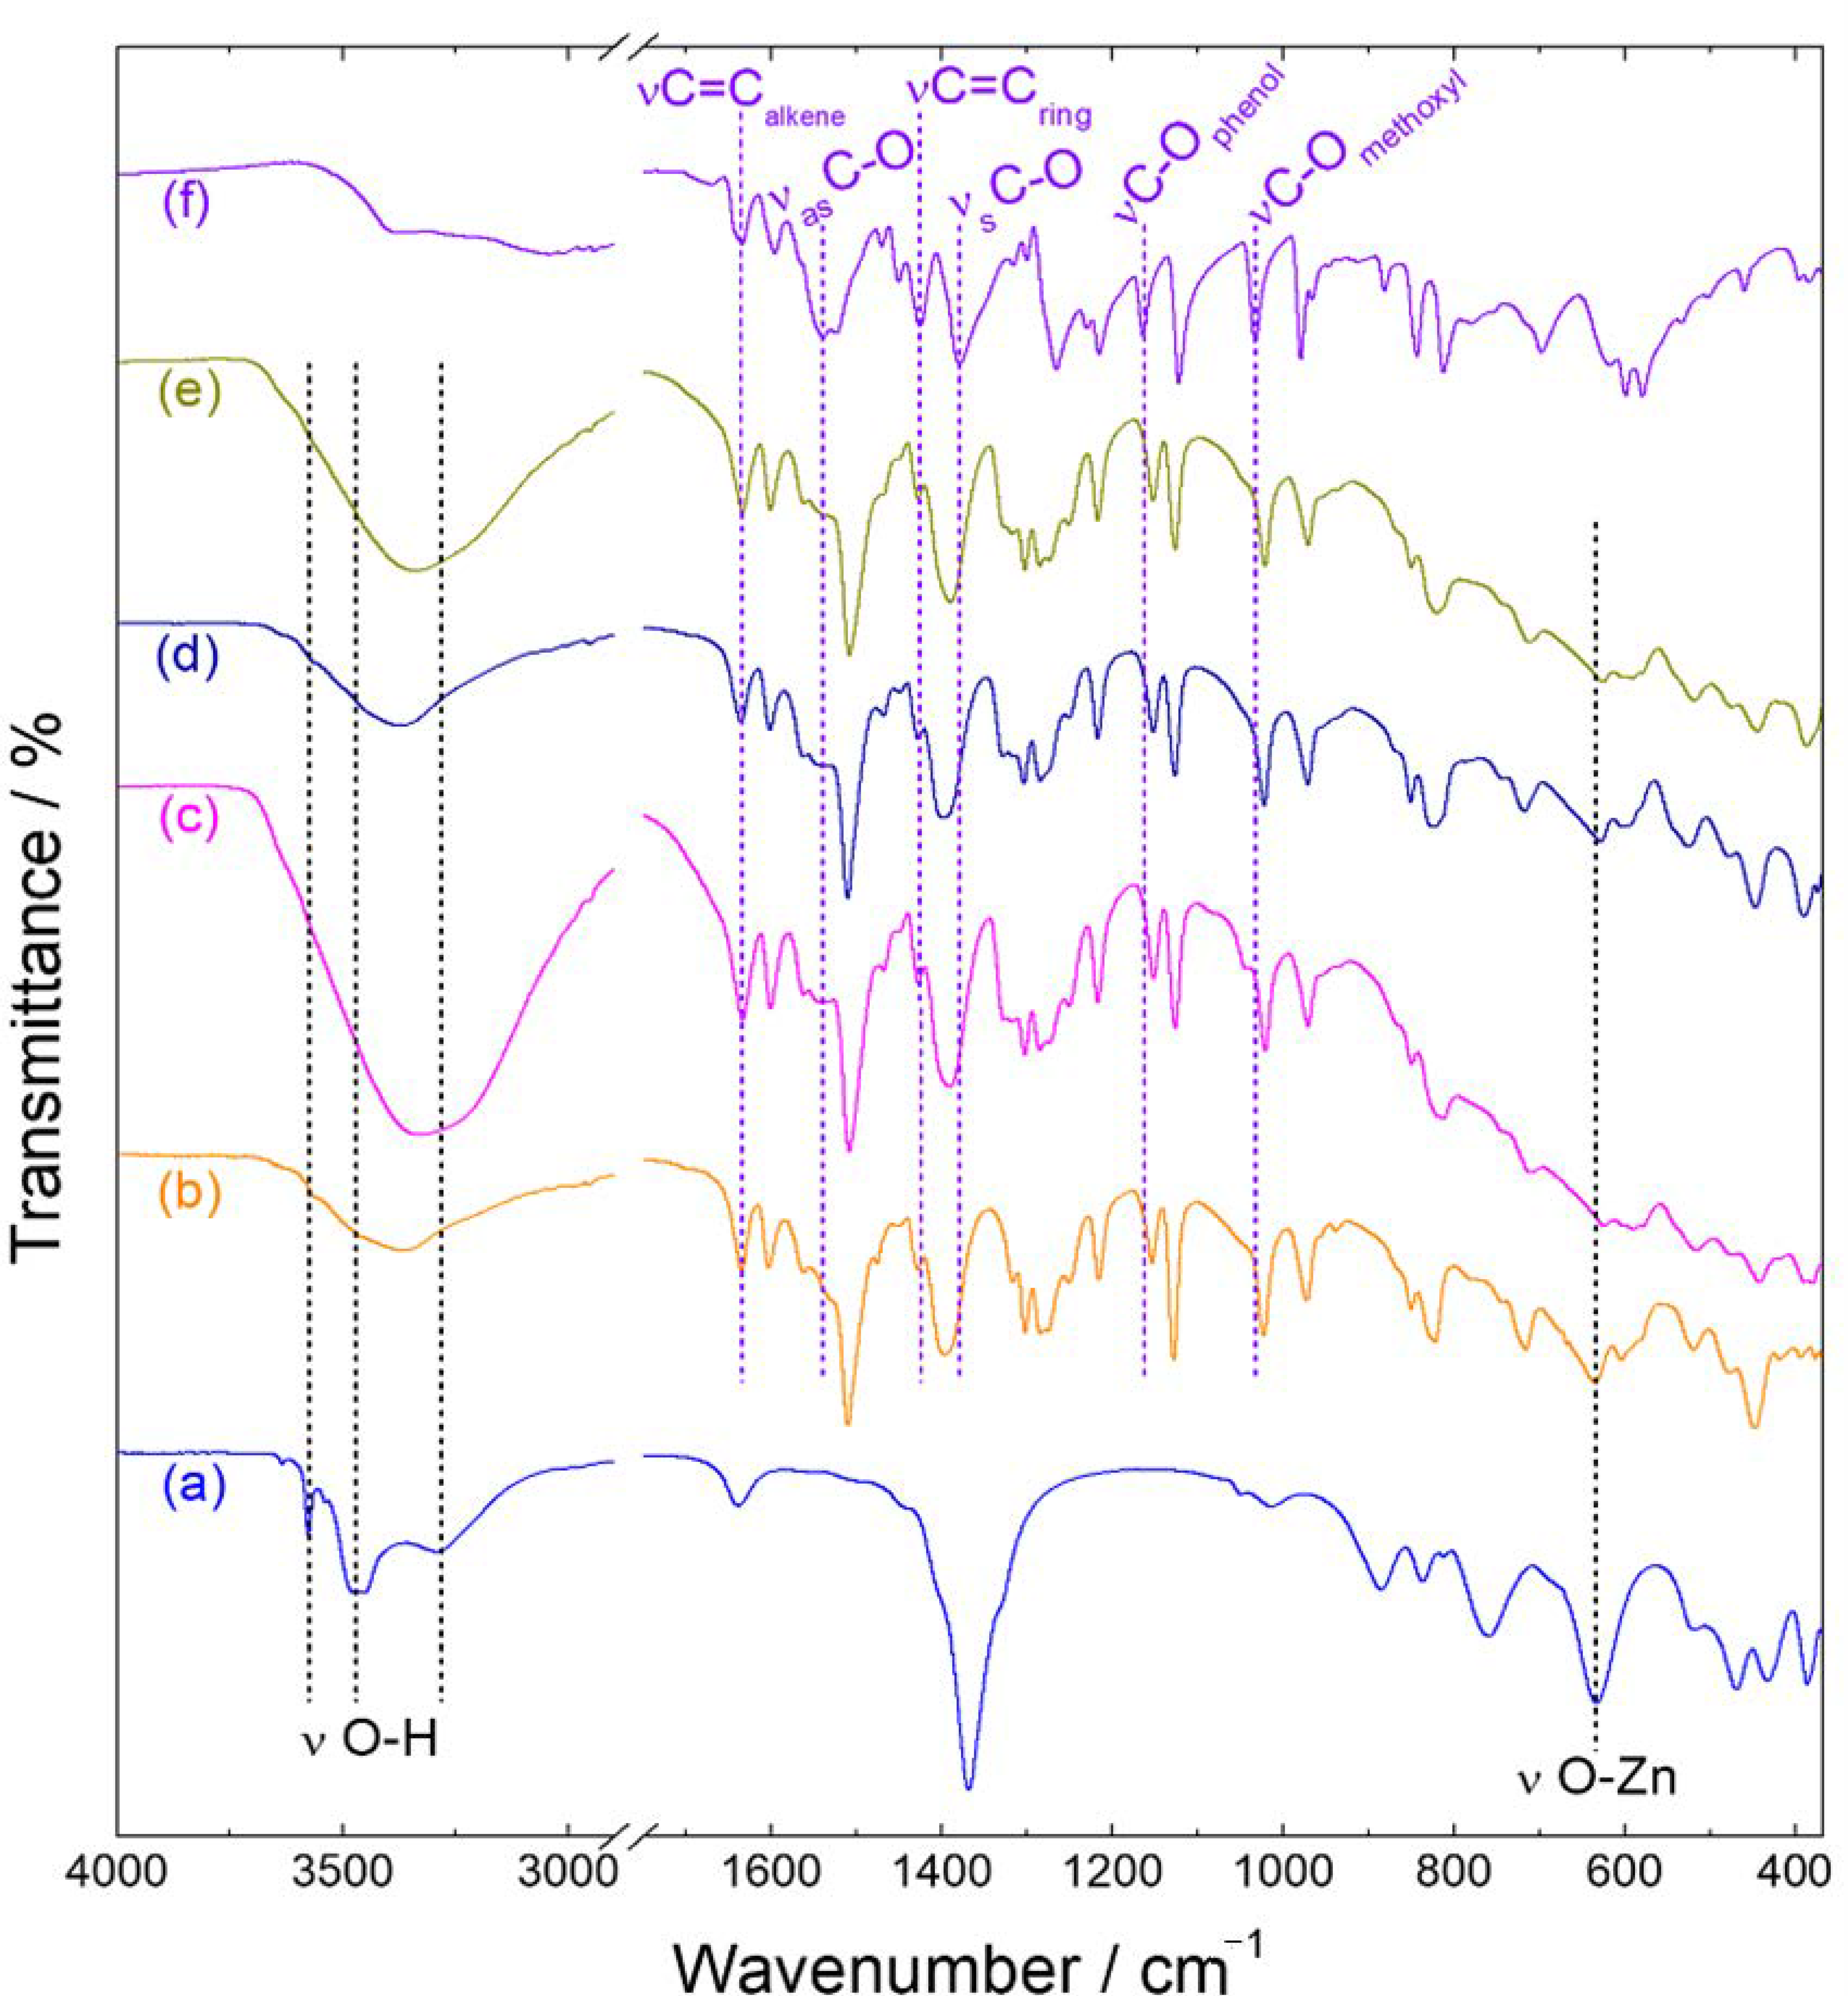
| Sample | νas/cm−1 | νs/cm−1 | Δν (νas − νs)/cm−1 |
|---|---|---|---|
| Nafel | 1539 | 1379 | 160 |
| Zn-fel-LSH/A | 1560 | 1400 | 160 |
| 1508 | 108 * | ||
| Zn-fel(3)-LSH | 1562 | 1394 | 168 |
| 1510 | 116 * | ||
| Zn-fel(4)-LSH | 1560 | 1394 | 166 |
| 1510 | 116 * | ||
| Zn-fel(4)-LSH/U10 | 1562 | 1390 | 172 |
| 1508 | 118 * | ||
| Zn-fel(4)-LSH/U20 | 1562 | 1398 | 164 |
| 1510 | 112 * | ||
| Zn-fel(4)-LSH/U30 | 1562 | 1391 | 171 |
| 1508 | 117 * | ||
| Zn-fel(5)-LSH | 1562 | 1394 | 168 |
| 1510 | 116 * |
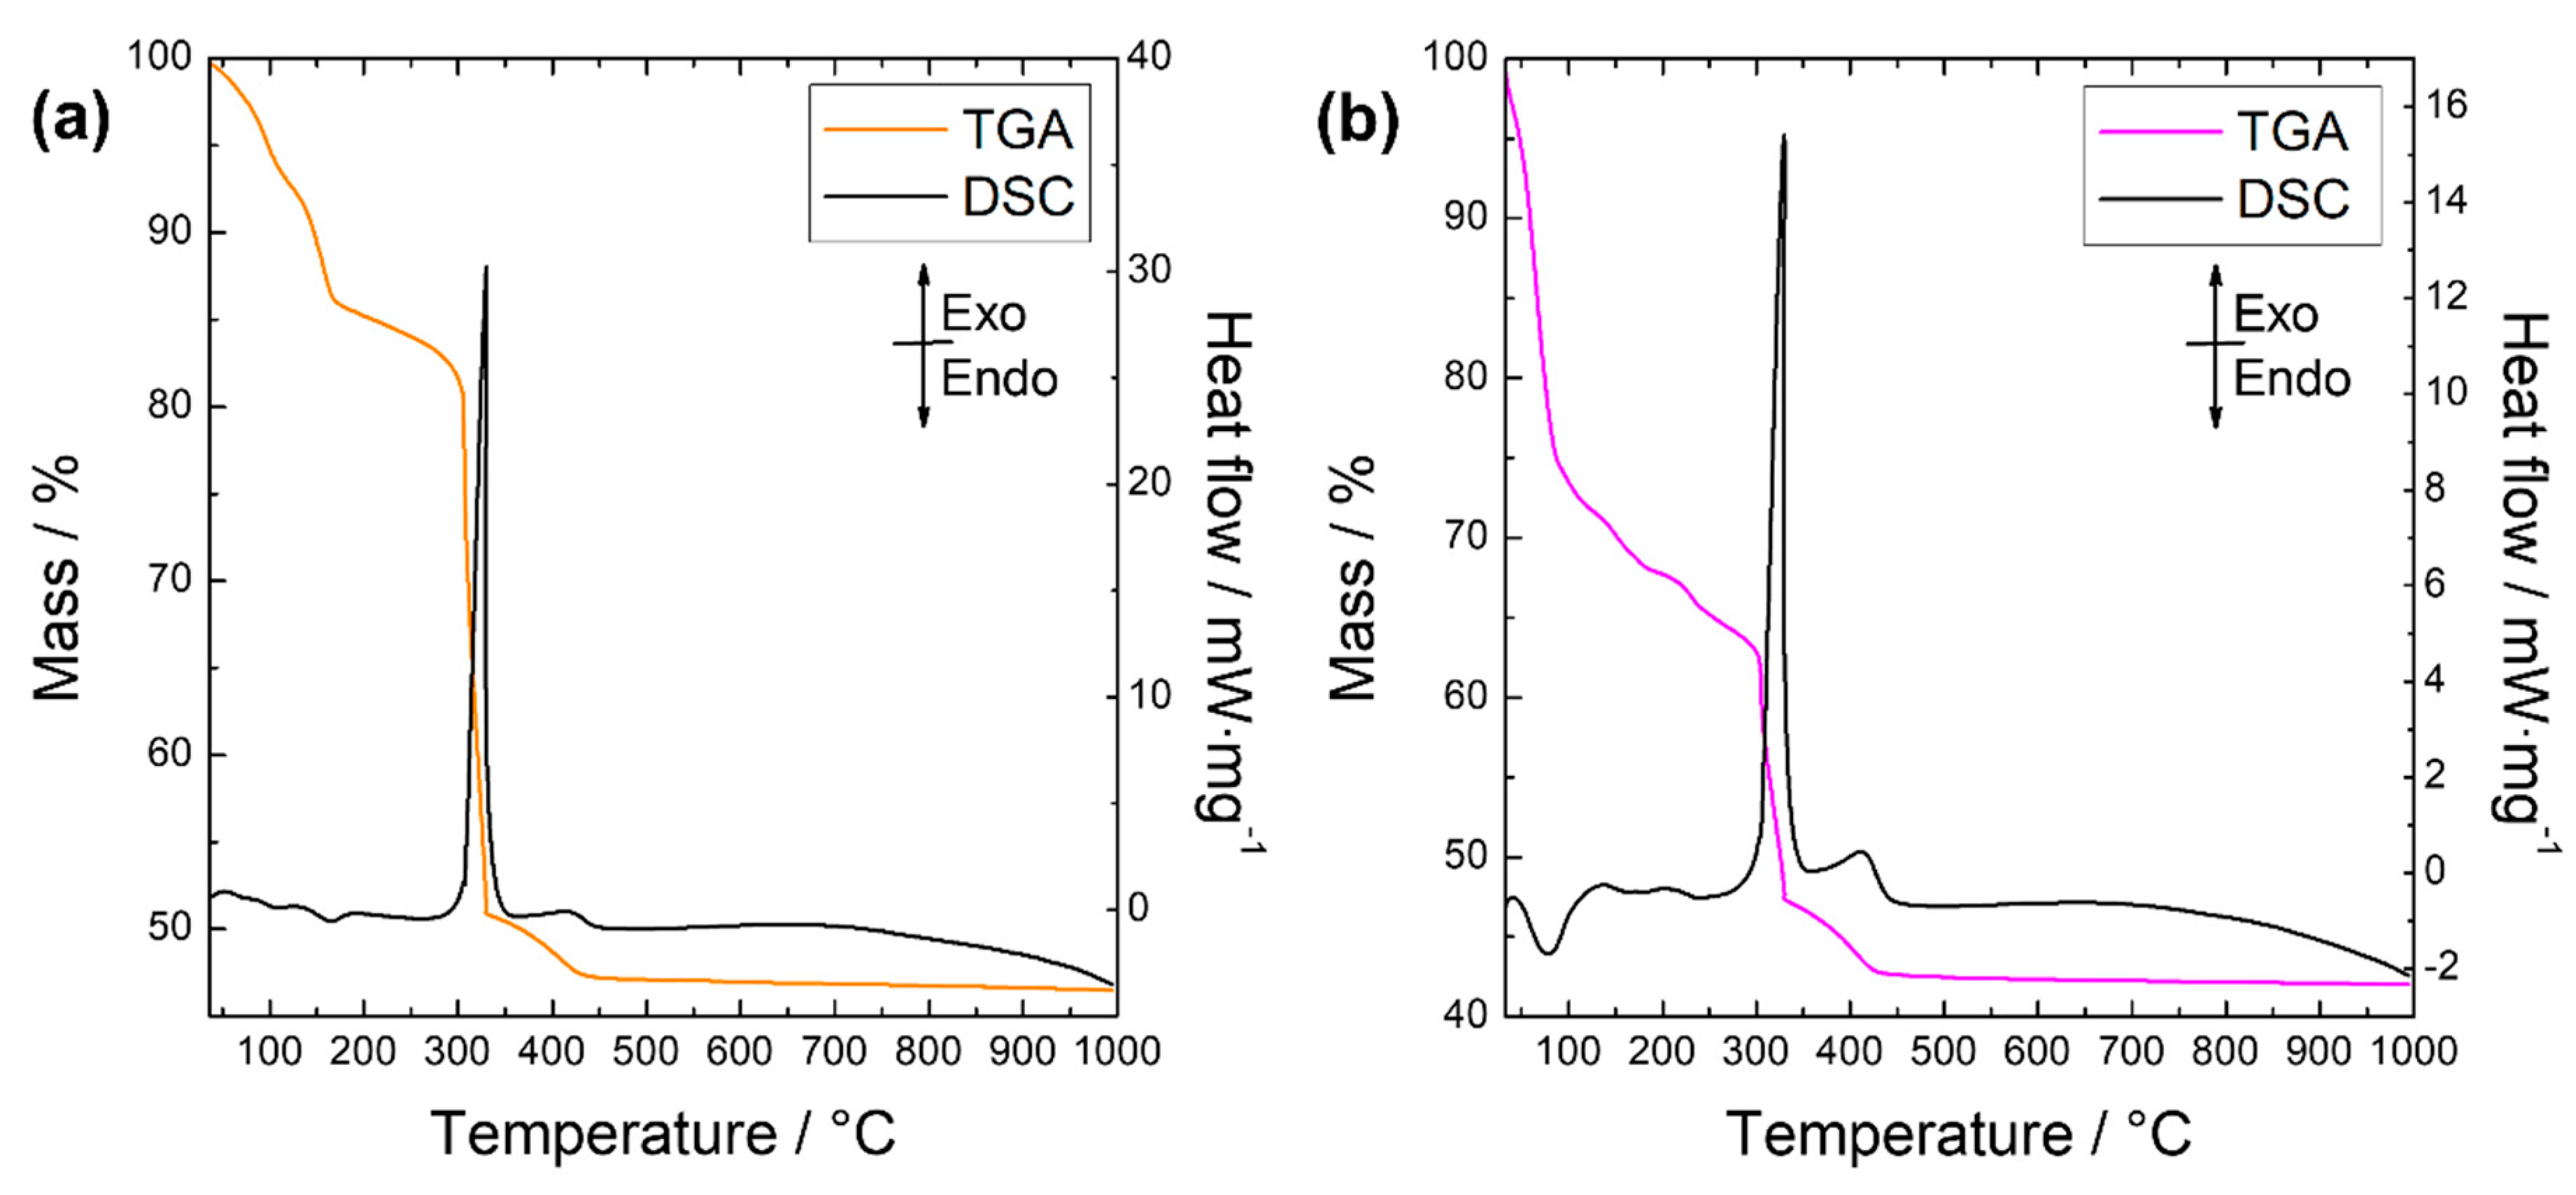
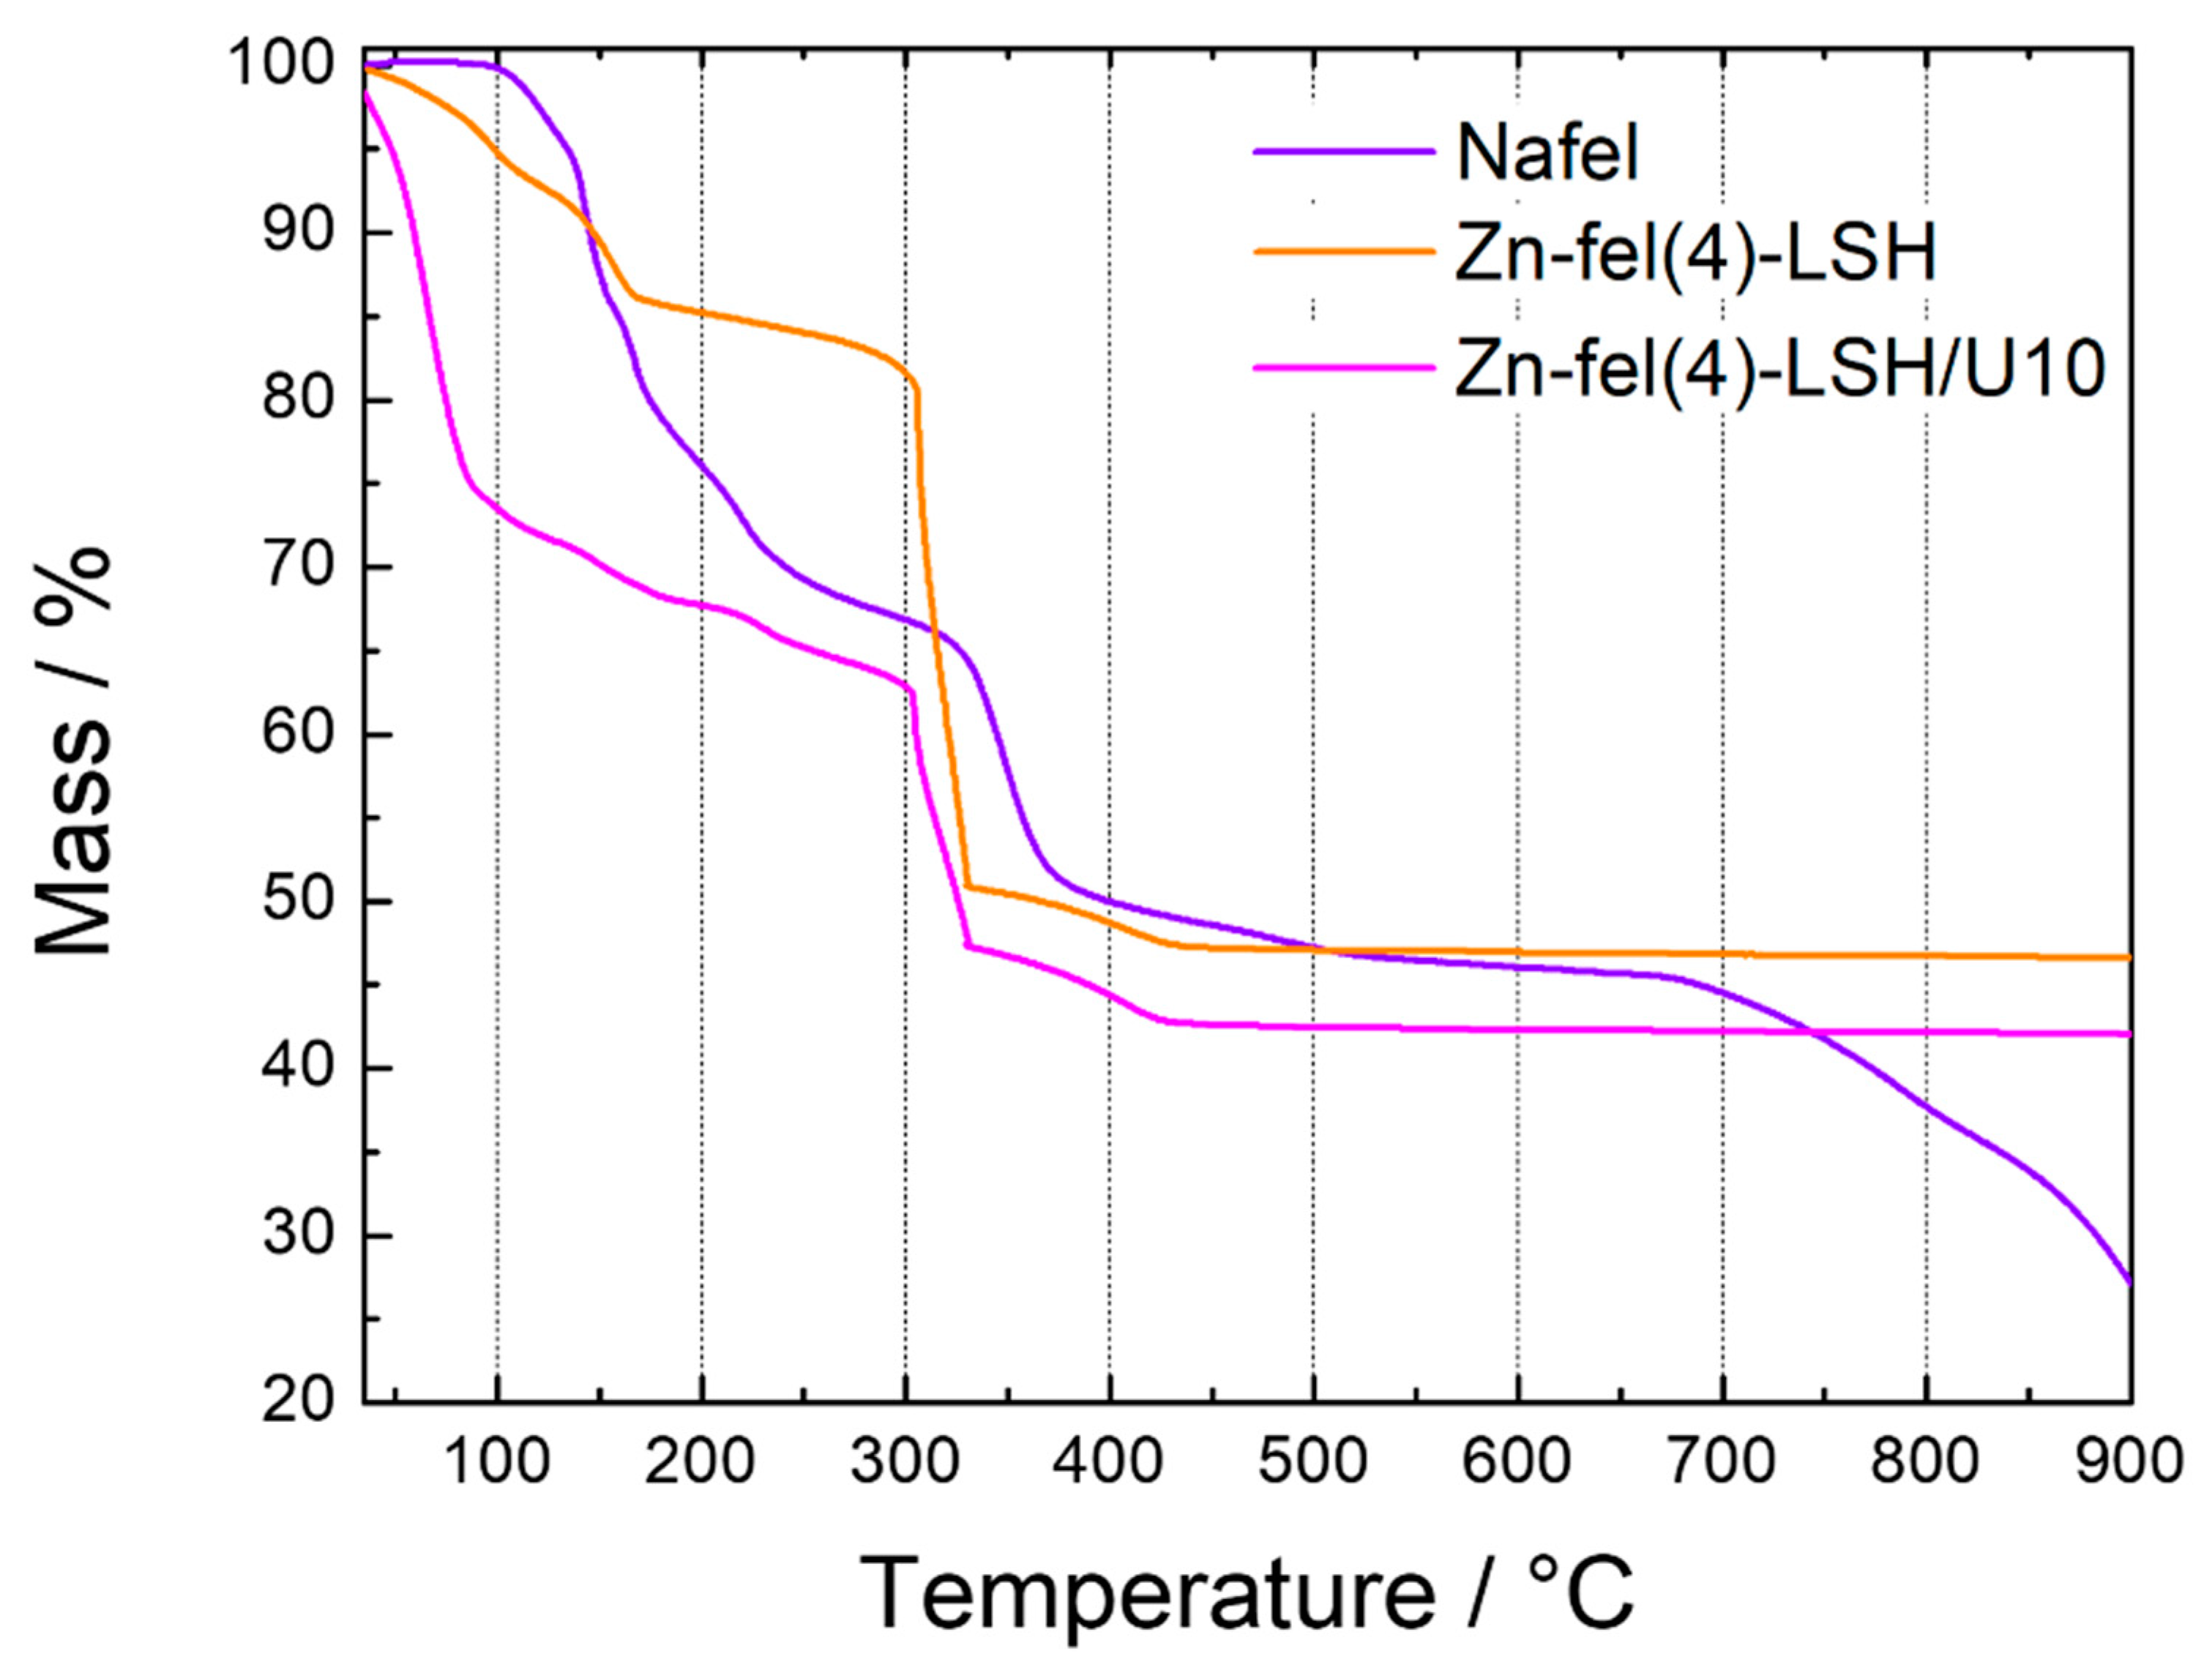
| Sample | H2O/wt% | Ferulate Anion/wt% | Residue/wt% |
|---|---|---|---|
| Zn-fel(4)-LSH | 18 | 35 | 47 |
| Zn-fel(4)-LSH/U10 | 38 | 19 | 43 |
| Formulation | SPF | Standard Deviation | Confidence Interval—95% |
|---|---|---|---|
| Commercial sunscreen * | 8.6 | 2.4 | 3.8 |
| Base | 2.3 | 0.4 | 0.7 |
| Zn-NO3-LSH | 7.8 | 0.7 | 1.1 |
| Zn-fel(4)-LSH/U10 | 8.0 | 1.5 | 2.3 |
| Nafel/1 | 6.8 | 0.7 | 1.2 |
| Zn-fel(4)-LSH | 12.1 | 0.9 | 1.4 |
| Nafel/2 | 7.0 | 1.1 | 1.8 |
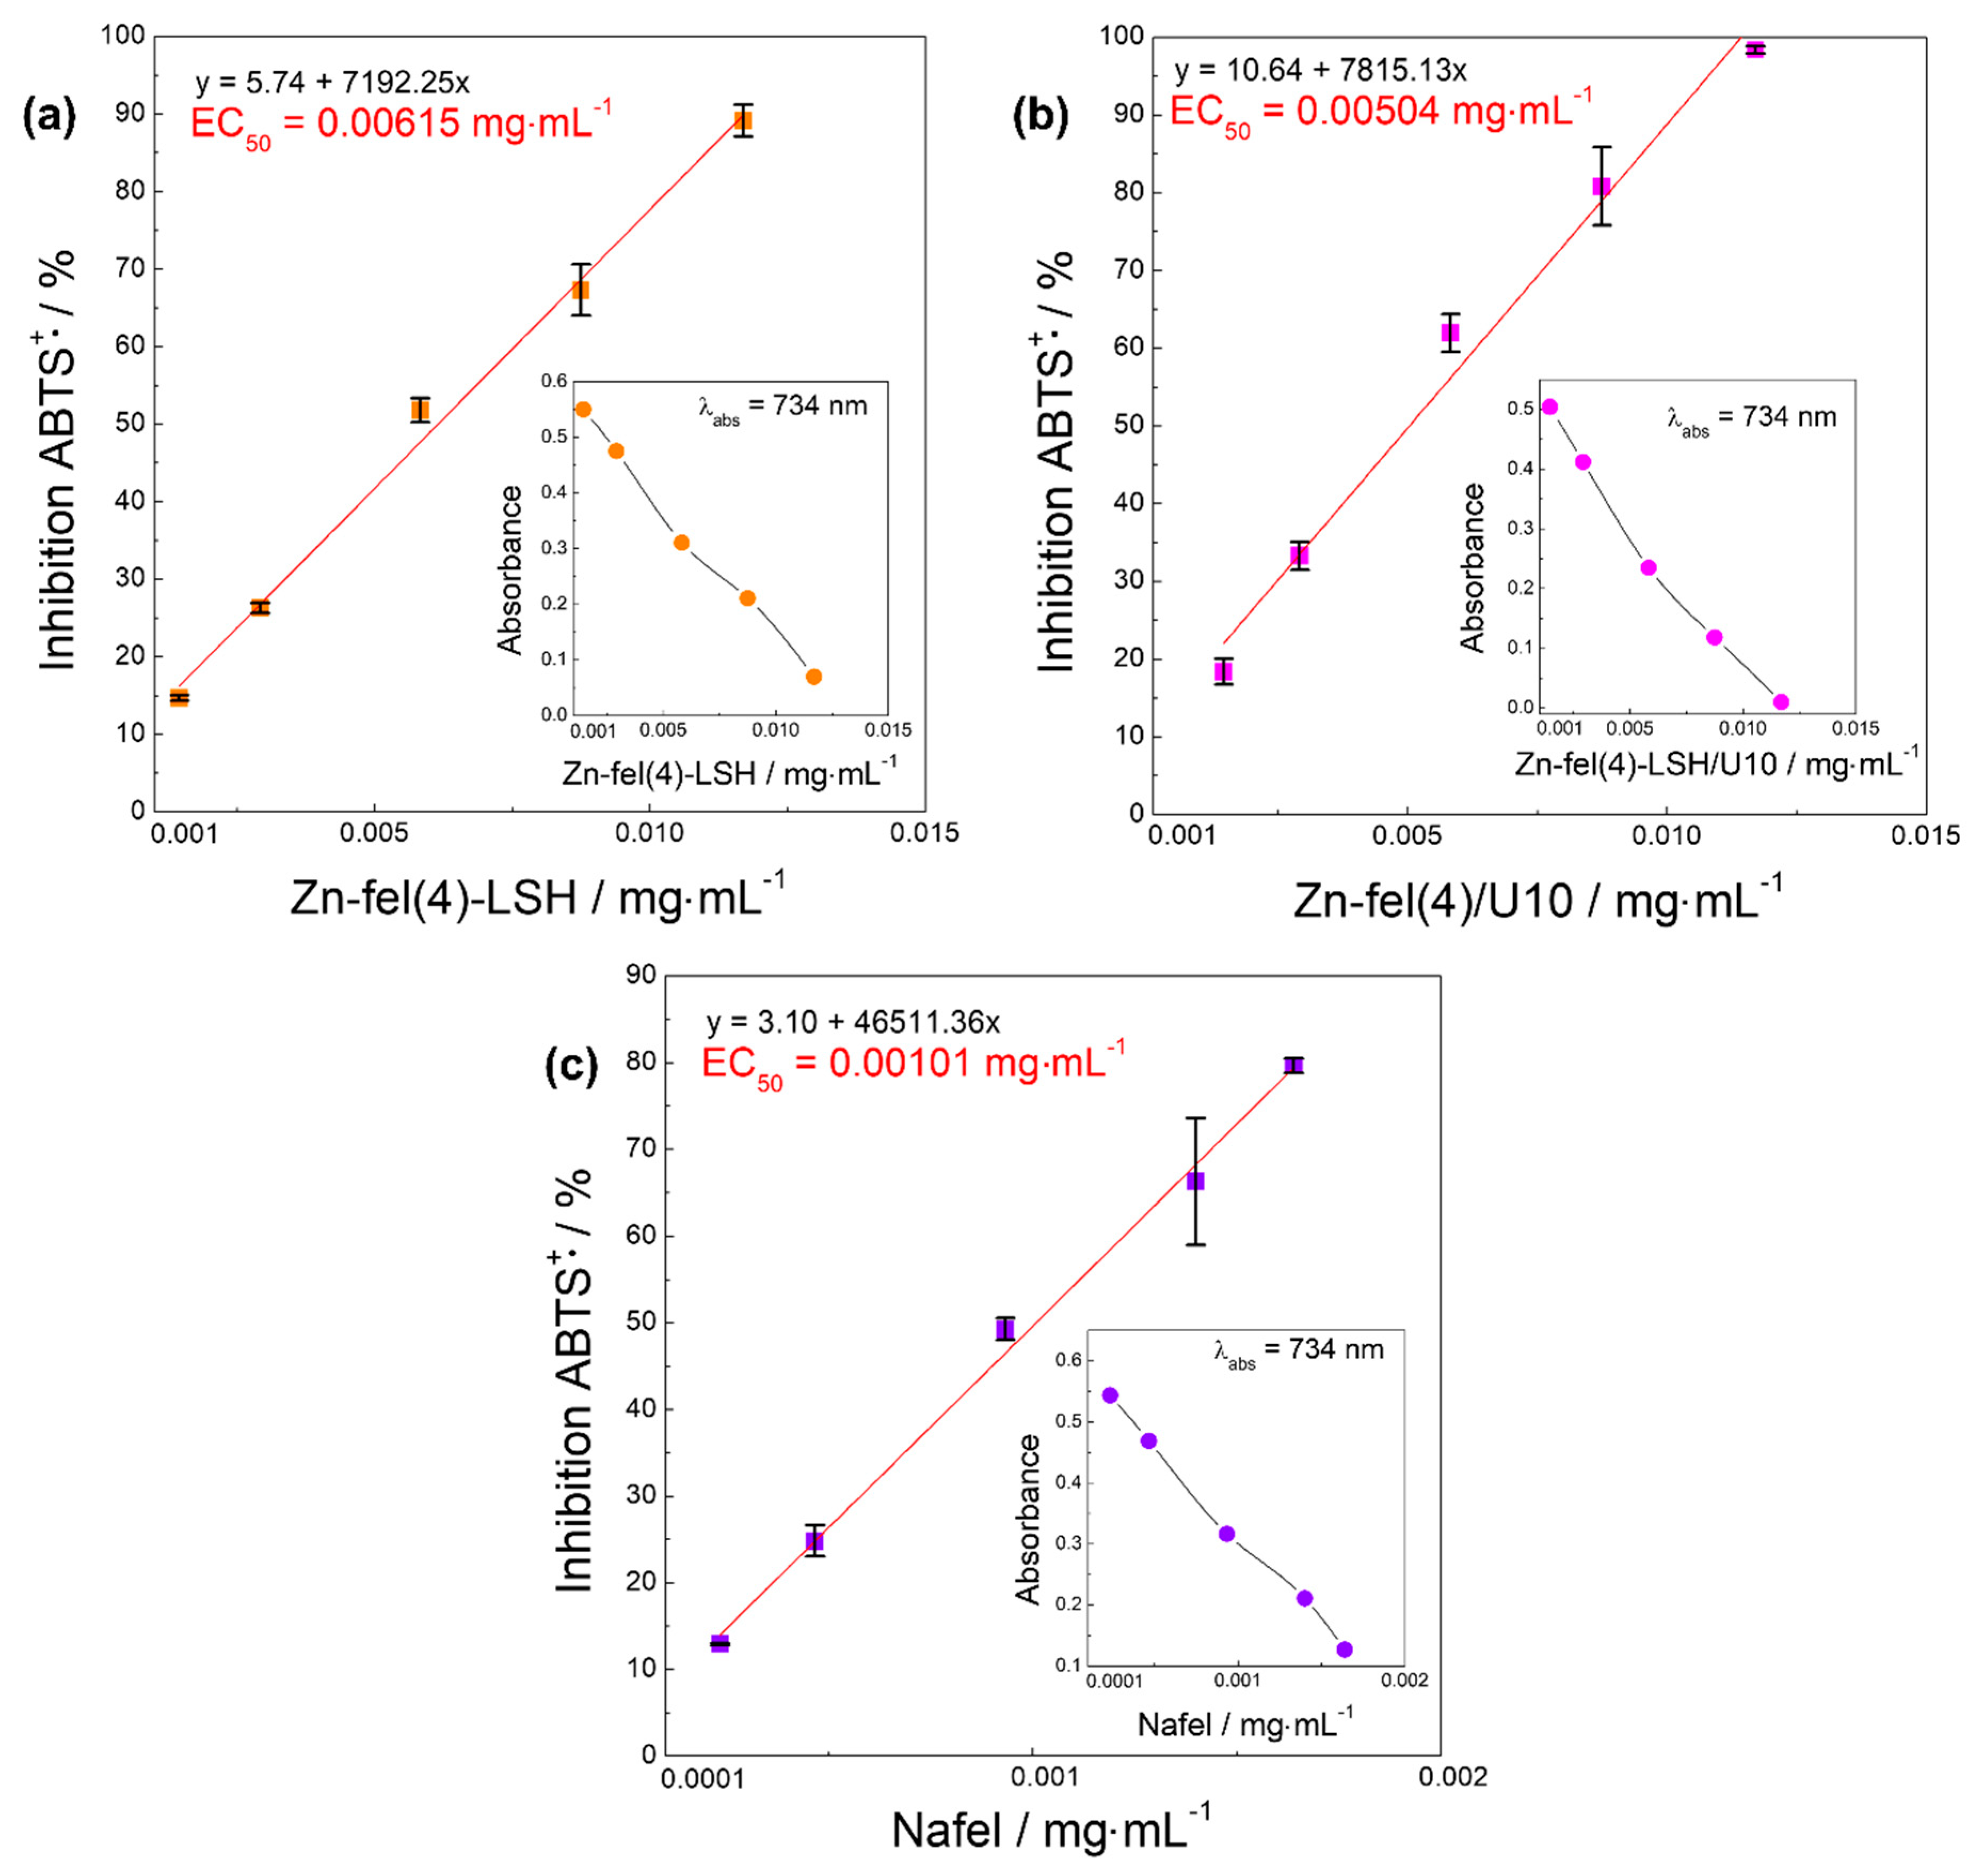
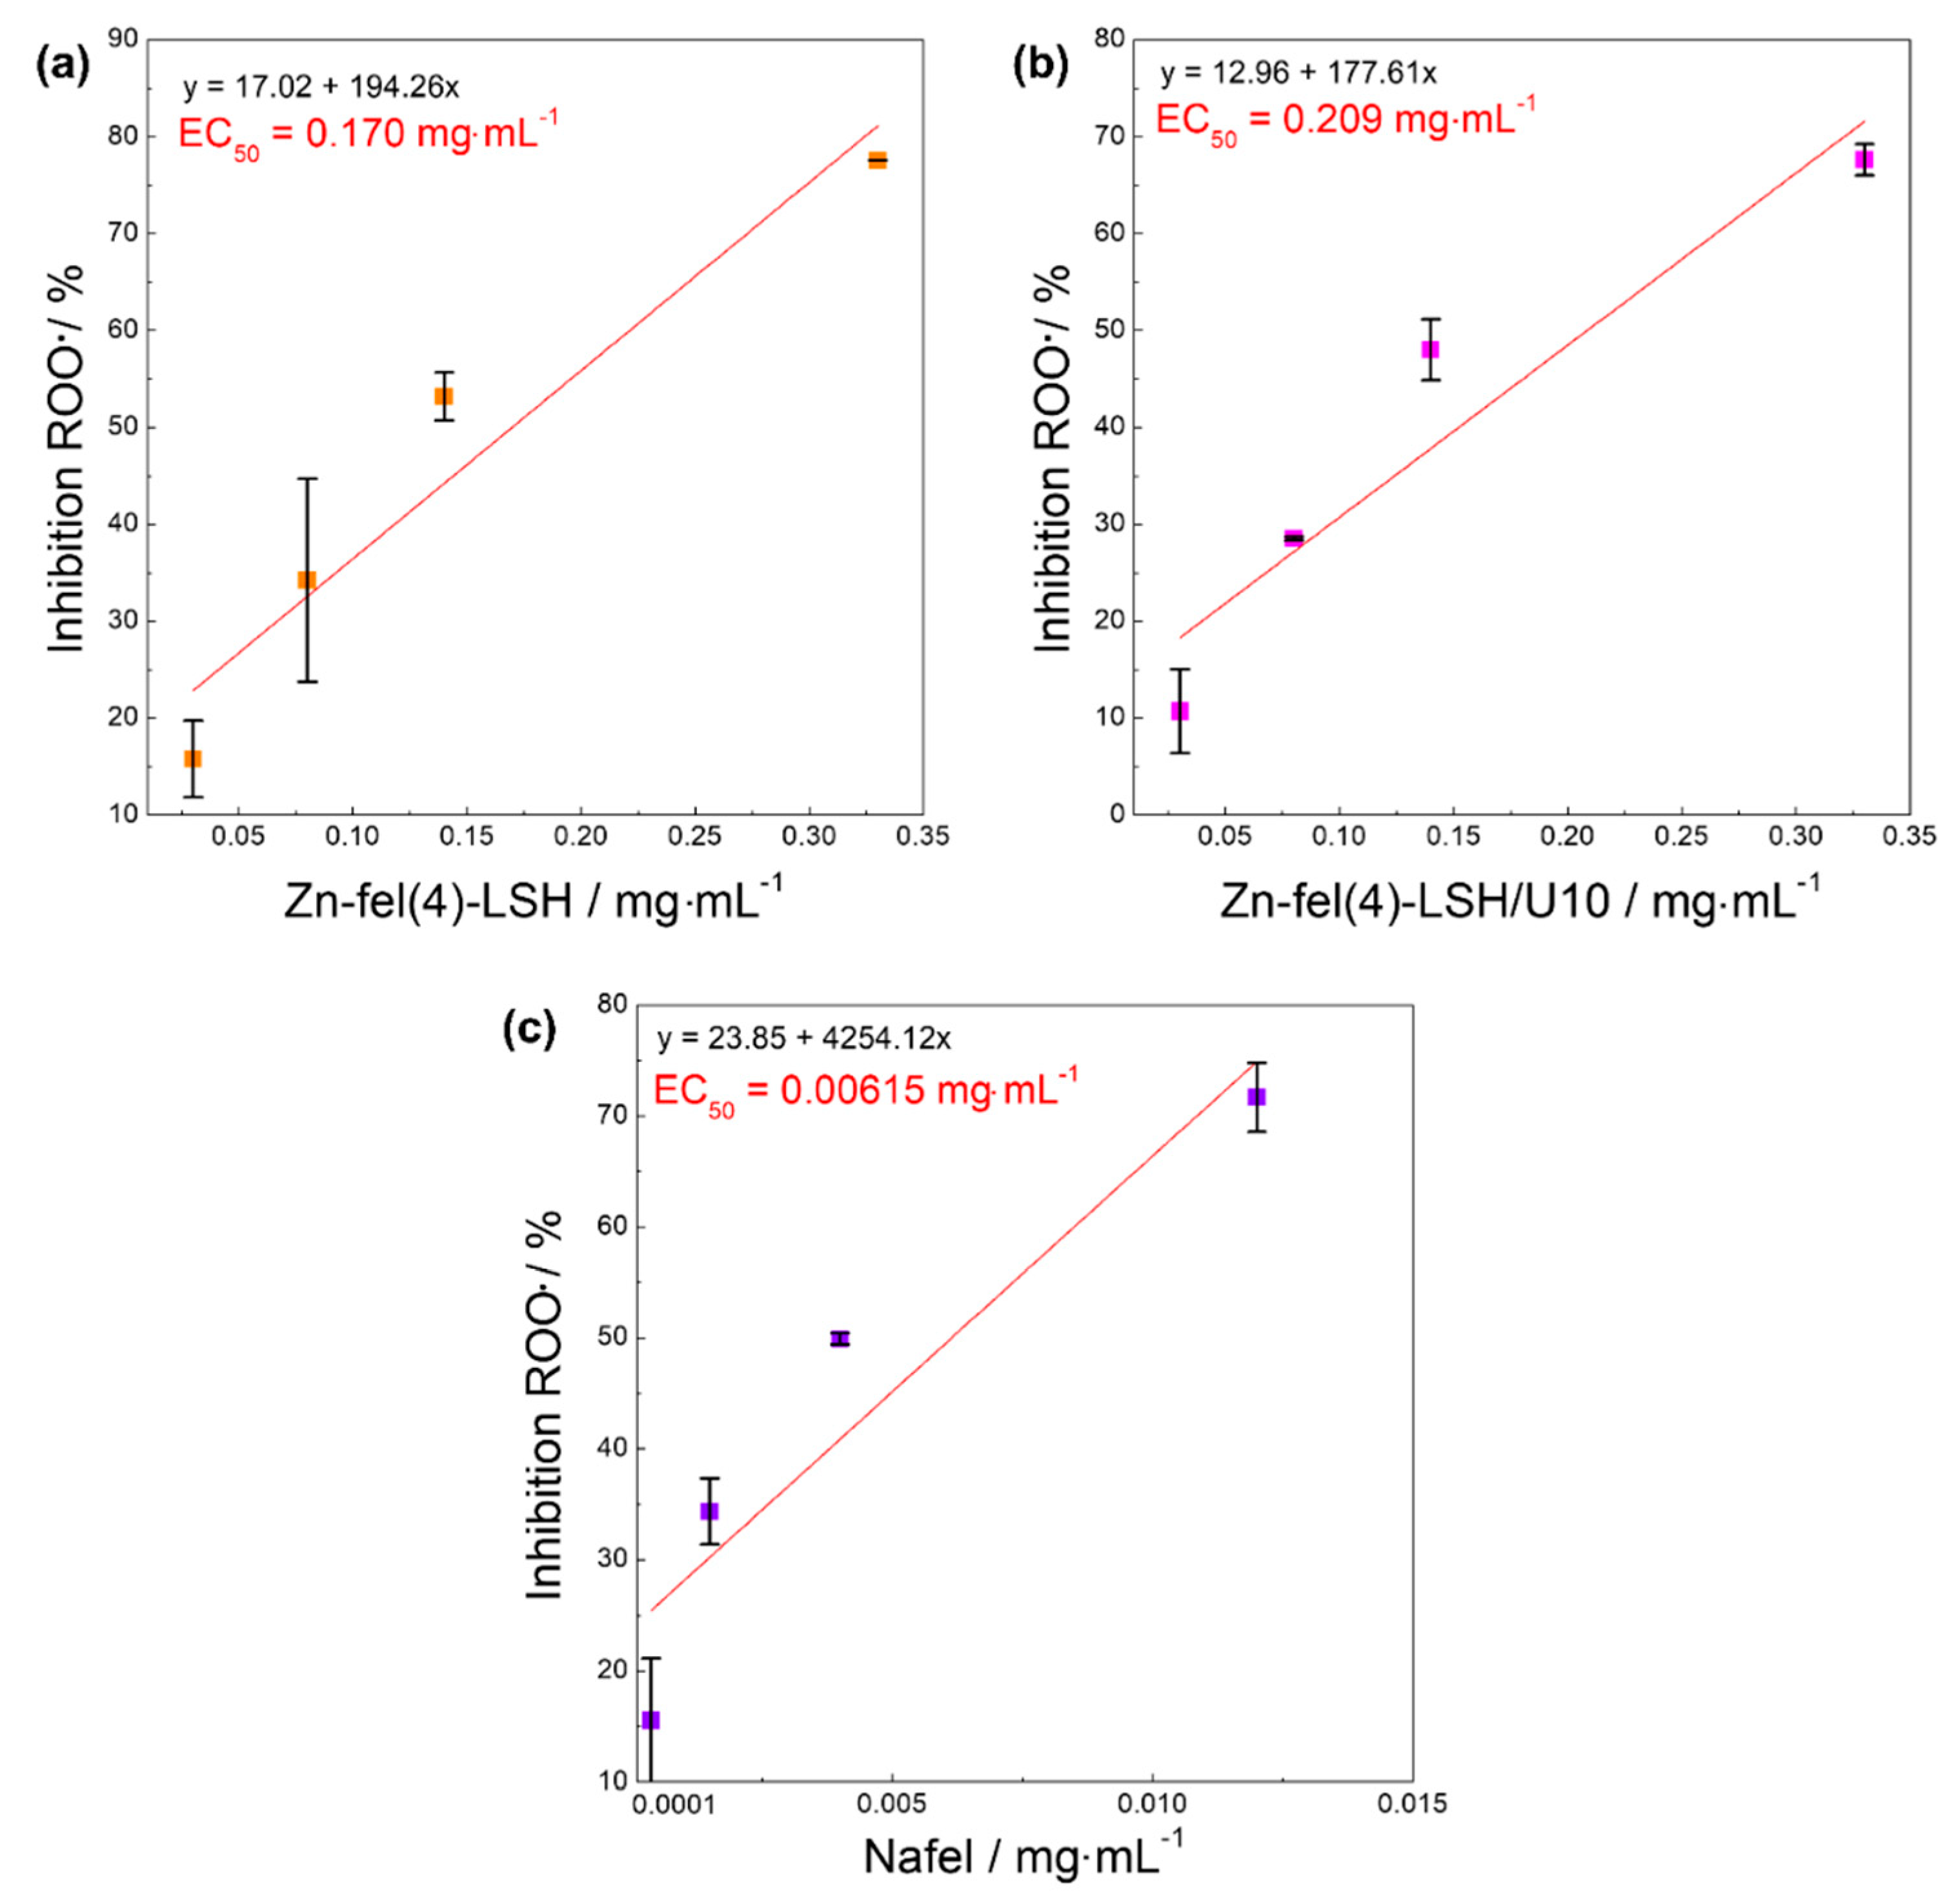
| Sample | DPPH• | ABTS•+ | HOCl/OCl− | ROO• | Slope |
|---|---|---|---|---|---|
| EC50/mg mL−1 | EC50/mg mL−1 | EC50/mg mL−1 | EC50/mg mL−1 | ||
| Nafel | 1.34 | 0.00101 | 0.000827 | 0.00615 | 4.93 |
| Zn-fel(4)-LSH | 0.0882 | 0.00615 | 0.00297 | 0.170 | 0.26 |
| Zn-fel(4)-LSH/U10 | 0.0957 | 0.00504 | 0.00319 | 0.209 | 0.16 |
| Ingredients | Phase | Cosmetic Formulations/% | |||||
|---|---|---|---|---|---|---|---|
| Cetostearyl alcohol | Oil | 2.00 | 2.00 | 2.00 | 2.00 | 2.00 | 2.00 |
| 2,3-dihydroxypropyl octadecenoate | Oil | 2.00 | 2.00 | 2.00 | 2.00 | 2.00 | 2.00 |
| Cosmowax® J. | Oil | 8.00 | 8.00 | 8.00 | 8.00 | 8.00 | 8.00 |
| Dipropan-2-yl hexanedioate | Oil | 1.50 | 1.50 | 1.50 | 1.50 | 1.50 | 1.50 |
| (1-decanoyloxy-3-octanoyloxypropan-2-yl)dodecanoate | Oil | 1.50 | 1.50 | 1.50 | 1.50 | 1.50 | 1.50 |
| Zn-NO3-LSH | Oil | - | 5.00 | - | - | - | - |
| Zn-fel(4)-LSH | Oil | - | - | 5.00 | - | - | - |
| Zn-fel(4)-LSH/U10 | Oil | - | - | - | 5.00 | - | - |
| Nafel | Oil | - | - | - | - | 1.8 | 0.1 |
| Propane-1,2-diol | Aqueous | 4.00 | 4.00 | 4.00 | 4.00 | 4.00 | 4.00 |
| Methyl 4-hydroxybenzoate | Aqueous | 0.18 | 0.18 | 0.18 | 0.18 | 0.18 | 0.18 |
| Propyl 4-hydroxybenzoate | Aqueous | 0.02 | 0.02 | 0.02 | 0.02 | 0.02 | 0.02 |
| 2,2′,2″,2‴-(1,2-Ethanediyldinitrilo)tetraacetic acid | Aqueous | 0.05 | 0.05 | 0.05 | 0.05 | 0.05 | 0.05 |
| Distilled Water | Aqueous | 80.75 | 75.75 | 75.75 | 75.75 | 78.95 | 80.65 |
Publisher’s Note: MDPI stays neutral with regard to jurisdictional claims in published maps and institutional affiliations. |
© 2021 by the authors. Licensee MDPI, Basel, Switzerland. This article is an open access article distributed under the terms and conditions of the Creative Commons Attribution (CC BY) license (http://creativecommons.org/licenses/by/4.0/).
Share and Cite
Saito, G.P.; Matsumoto, A.C.L.; Assis, R.P.; Brunetti, I.L.; Cebim, M.A.; Davolos, M.R. Zn(ferulate)-LSH Systems as Multifunctional Filters. Molecules 2021, 26, 2349. https://doi.org/10.3390/molecules26082349
Saito GP, Matsumoto ACL, Assis RP, Brunetti IL, Cebim MA, Davolos MR. Zn(ferulate)-LSH Systems as Multifunctional Filters. Molecules. 2021; 26(8):2349. https://doi.org/10.3390/molecules26082349
Chicago/Turabian StyleSaito, Gustavo Pereira, Ana Carolina Lanfredi Matsumoto, Renata Pires Assis, Iguatemy Lourenço Brunetti, Marco Aurélio Cebim, and Marian Rosaly Davolos. 2021. "Zn(ferulate)-LSH Systems as Multifunctional Filters" Molecules 26, no. 8: 2349. https://doi.org/10.3390/molecules26082349
APA StyleSaito, G. P., Matsumoto, A. C. L., Assis, R. P., Brunetti, I. L., Cebim, M. A., & Davolos, M. R. (2021). Zn(ferulate)-LSH Systems as Multifunctional Filters. Molecules, 26(8), 2349. https://doi.org/10.3390/molecules26082349