
Determination of 77 Multiclass Pesticides and Their Metabolitesin Capsicum and Tomato Using GC-MS/MS and LC-MS/MS

 ,
, 
Abstract
1. Introduction
2. Results and Discussions
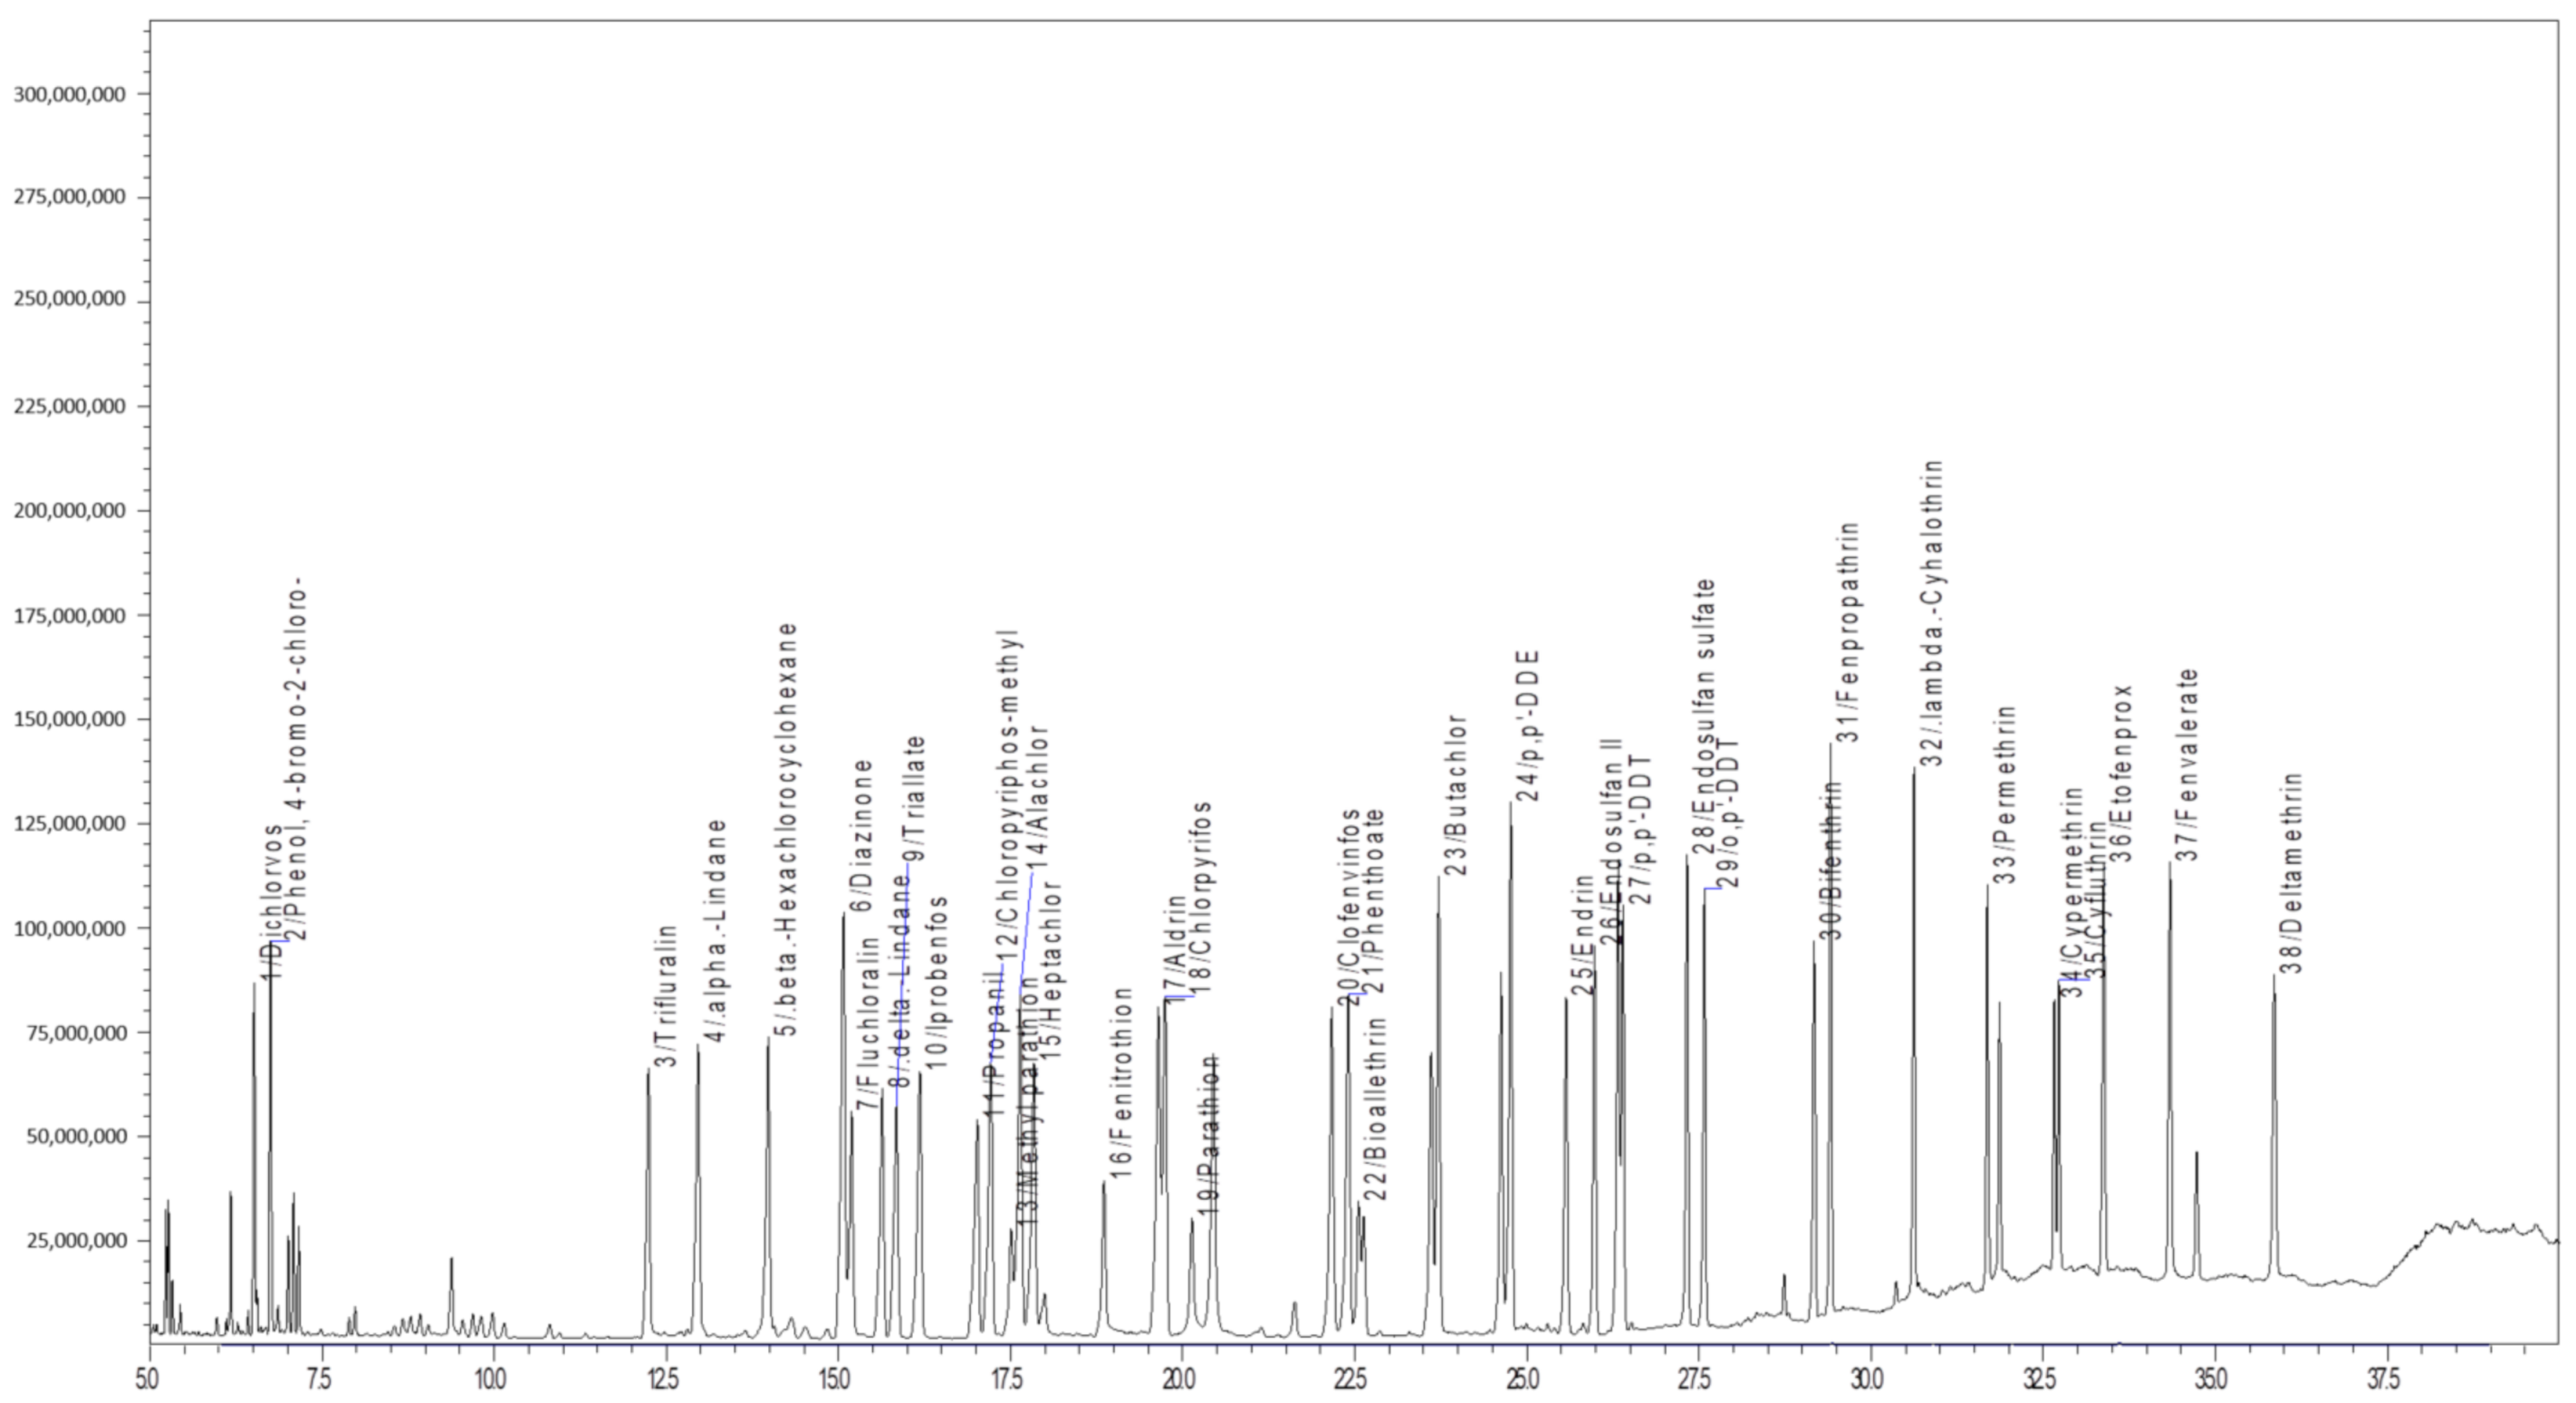
2.1. Optimization of Instruments Parameters
2.2. Method Verification in Capsicum
2.3. Method Verification in Tomato
2.4. Estimation of Measurement Uncertainty
3. Material and Methods
3.1. Chemical and Reagents
3.2. Preparation of Standard Solution
3.3. Extraction and Clean-Up
3.4. LC-MS/MS
3.5. GC-MS/MS
3.6. Method Verification
3.7. Estimation of Measurement Uncertainty
4. Conclusions
Author Contributions
Funding
Institutional Review Board Statement
Informed Consent Statement
Data Availability Statement
Acknowledgments
Conflicts of Interest
Sample Availability
References
- Klein, B.P. Nutritional consequences of minimal processing of fruits and vegetables. J. Food Qual. 1987, 10, 179–193. [Google Scholar] [CrossRef]
- Sharma, S.; Sharma, V.; Rawat, R.; Arya, S. Cardiovascular health in human: The role of diet. J. Clin. Preve. Cardiol. 2017, 6, 18–19. [Google Scholar] [CrossRef]
- Slavin, J.L.; Lloyd, B. Health benefits of fruits and vegetables. Adv. Nutr. 2012, 3, 506–516. [Google Scholar] [CrossRef] [PubMed]
- Drouillet, P.P.; Boisset, M.P.A.; Lecerf, J.M.; Casse, F.; Catteau, M. Realistic approach of pesticide residues and French consumer exposure within fruit & vegetable intake. J. Environ. Sci. Health B 2010, 46, 84–91. [Google Scholar]
- Claeys, W.L.; Schmit, J.F.; Bragard, C.; Maghuin-Rogister, G.; Pussemier, L.; Schiers, B. Exposure of several Belgian consumer groups to pesticide residues through fresh fruit and vegetable consumption. Food Control. 2011, 22, 508–516. [Google Scholar] [CrossRef]
- Zhu, Y.; Zhang, T.; Xu, D.; Wang, S.; Yuan, Y.; He, S.; Cao, Y. The removal of pesticide residues from pakchoi (Brassica rape L. ssp. chinensis) by ultrasonic treatment. Food Control. 2019, 95, 176–180. [Google Scholar] [CrossRef]
- Kumari, D.; John, S. Health risk assessment of pesticide residues in fruits and vegetables from farms and markets of Western Indian Himalayan region. Chemosphere 2019, 224, 162–167. [Google Scholar] [CrossRef]
- Bozena, L.; Elmira, A.; Abai, S.; Piotr, K.; Kazbek, T.; Alina, L. Studies of pesticide residues in tomatoes and cucumbers from Kazakhstan and the associated health risks. Environ. Monit. Assess 2015, 187, 609. [Google Scholar] [CrossRef]
- Kurl, S.P.; Kumar, A. Population dynamics of Helicoverpa armigera in relation to meteorological parameters. J. Exp. Zool. 2010, 13, 129–132. [Google Scholar]
- Rosso, I.; Giraudi, G.; Gamberini, R.; Baggiani, C.; Vanni, A. Application of an ELISA to the determination of benalaxyl in red wines. J. Agric. Food Chem. 2000, 48, 33–36. [Google Scholar] [CrossRef]
- Stensvand, A. Investigation on fungicide residues in greenhouse-grown strawberries. J. Agric. Food Chem. 2000, 48, 917–920. [Google Scholar] [CrossRef] [PubMed]
- Kim, S.; Abd El-Aty, A.M.; Rahman, M.M.; Choi, J.; Choi, O.; Rhee, G.; Chang, M.; Kim, H.; Abid, M.D.N.; Shin, S.C.; et al. Detection of pyridaben residue levels in hot pepper fruit and leaves by liquid chromatography-tandem mass spectrometry: Effect of household processes. Biomed. Chromatogr. 2015, 29, 990–997. [Google Scholar] [CrossRef] [PubMed]
- Kim, S.; Park, J.B.; Hwang, I.K. Quality attributes of various varieties of Korean red pepper powders (Capsicum annuum L.) and color stability during sunlight exposure. J. Agric. Food Chem. 2002, 67, 2957–2961. [Google Scholar] [CrossRef]
- Ozkan, A.; Bindak, R.O.; Erkmen. Aflatoxin B (1) and aflatoxins in ground red chilli pepper after drying. Food. Addit. Contam. Part. B Surveill. 2015, 8, 227–233. [Google Scholar] [CrossRef]
- Sunitha, T.R. Insect Pests of Capsicum Annuum var. Frutescens (L.) and Their Management. M.Sc. (Entomology). Thesis, University of Agricultural Sciences, Dharwad, India, 2007; p. 67. [Google Scholar]
- Herron, G.K.; Powis, R.J. Baseline studies and prelimary resistance survey of Australian populations of cotton aphid Aphis gossypii Glover (Homoptera: Aphididae). Aust. J. Entomol 2000, 39, 33–38. [Google Scholar] [CrossRef]
- Huang, F.; Zhongping, H.; Fengming, Y. Influence of oilseed rape seed treatment with imidacloprid on survival, feeding behavior and detoxifying enzymes of mustard aphid, Lipaphis erysimi. Insects 2019, 10, 144. [Google Scholar] [CrossRef]
- Liu, W.X.; He, W.; Qin, N.; Kong, X.Z.; He, Q.S.; Ouyang, H.L.; Xu, F.L. The residues, distribution, and partition of organochlorine pesticides in the water, suspended solids, and sediments from a large Chinese lake (Lake Chaohu) during the high water level period. Environ. Sci. Pollut. Res. 2013, 20, 2033–2045. [Google Scholar] [CrossRef]
- Klein, J.; Alder, L. Applicability of gradient liquid chromatography with tandem mass spectrometry to the simultaneous screening for about 100 pesticides in crops. J. AOAC Int. 2003, 86, 1015–1037. [Google Scholar] [CrossRef]
- Beyer, A.; Biziuk, M. Comparison of efficiency of different sorbents used during clean-up of extracts for determination of polychlorinated biphenyls and pesticide residues in low-fat food. Food Res. Int. 2010, 43, 831–837. [Google Scholar] [CrossRef]
- Koesukwiwat, U.; Lehotay, S.J.; Miao, S.; Leepipatpiboon, N. High throughput analysis of 150 pesticides in fruits and vegetables using QuEChERS and low-pressure gas chromatography-time-of-flight mass spectrometry. J. Chromatogr. A 2010, 1217, 6692–6703. [Google Scholar] [CrossRef] [PubMed]
- Park, J.; Choi, J.; Abd El-Aty, A.M.; Kim, B.M.; Oh, J.; Do, J.; Kwon, K.S.; Shim, K.; Choi, O.; Shin, S.C.; et al. Simultaneous multiresidue analysis of 41 pesticide residues in cooked foodstuff using QuEChERS: Comparison with classical method. Food Chem. 2011, 128, 241–253. [Google Scholar] [CrossRef]
- Alavanja, M.C.R.; Matthew, K.R.; Matthew, R.B. Increased cancer burden among pesticide applicators and others due to pesticide exposure. CA: Cancer J. Clin. 2013, 63, 120–142. [Google Scholar] [CrossRef] [PubMed]
- Schenck, F.J.; Hobbs, J.E. Evaluation of the quick, easy, cheap, effective, rugged, and safe (QuEChERS) approach to pesticide residue analysis. Bull. Environ. Contam. Toxicol. 2004, 73, 24–30. [Google Scholar] [CrossRef]
- Caldas, S.S.; Bolzan, C.M.; Cerqueira, M.B.; Tomasini, D.; Furlong, E.B.; Fagundes, C.; Primel, E.G. Evaluation of a modified QuEChERS extraction of multiple classes of pesticides from a rice paddy soil by LC-APCI-MS/MS. J. Agric. Food Chem. 2011, 59, 11918–11926. [Google Scholar] [CrossRef]
- Andrascikova, M.; Hrouzkova, S.A. Comparative study of three modifications of the QuEChERS method for determination of endocrine disrupting pesticide residues in lemon matrices by fast GC-MS. Anal. Methods. 2013, 5, 1374–1384. [Google Scholar] [CrossRef]
- Yogendrarajah, P.; Van, P.C.; De Meulenaer, B.; De Saeger, S. Development and validation of a QuEChERS based liquid chromatography tandem mass spectrometry method for the determination of multiple mycotoxins in spices. J. Chromatogr. A 2013, 1297, 1–11. [Google Scholar] [CrossRef]
- Liu, M.; Xie, Y.; Li, H.; Meng, X.; Zhang, Y.; Hu, D.; Zhang, K.; Xue, W. Multiresidue determination of 29 pesticide residues in pepper through a modified QuEChERS method and gas chromatography–mass spectrometry. Biomed. Chromatogr. 2016, 30, 1686–1695. [Google Scholar] [CrossRef] [PubMed]
- Santos Barreto, A.; de Cassia Da Silva, A.P.; Meira Farias, J.; Menezes Filho, A.; Fernandes de Sa, G.; Alves Junior, S. Characterization and application of a lanthanide-based metal-organic framework in the development and validation of a matrix solid-phase dispersion procedure for pesticide extraction on peppers (Capsicum annuum L.) with gas chromatography-mass spectrometry. J. Sep. Sci. 2018, 41, 1593–1599. [Google Scholar] [CrossRef]
- Naik, H.R.; Pallavi, M.S.; Kumar, P.; Nidoni, U.K.; Bheemanna, M.; Paramasivam, M. Determination of Tricyclazole Fungicide in Rice using LC-MS/MS and its Risk Assessment. Pesticide Res. J. 2020, 32, 148–158. [Google Scholar] [CrossRef]
- Rahul, C.; Harischandra Naik, R.; Pallavi, M.S.; Rachappa, V.; Pramesh, D.; Bheemanna, M. LC-ESI-MS/MS Method for Determination of Chlorantraniliprole Residue and its Dissipation Kinetics in Pigeonpea. Pesticide Res. J. 2020, 32, 96–106. [Google Scholar] [CrossRef]
- Naik, H.R.; Pallavi, M.S.; Chawan, R.; Bheemanna, M.; Anand, N.; Paramasivam, M. Method Development and Validation for Determination of Indoxacarb Using LC-ESI-MS/MS and Its Dissipation Kinetics in Pigeonpea. Food Anal. Methods 2020, 13, 647–657. [Google Scholar] [CrossRef]
- Naik, R.H.; Chawan, R.; Pallavi, M.S.; Bheemanna, M.; Rachappa, V.; Pramesh, D.; Naik, A.; Nidoni, U. Determination of Profenofos Residues using LC-MS/MS and Its Dissipation Kinetics in Pigeonpea Pods. Legume Res. 2020. [CrossRef]
- Naik, H.R.; Pallavi, M.S.; Bheemanna, M.; PavanKumar, K.; Chandra Sekhara Reddy, V.; Udaykumar Nidoni, R.; Paramasivam, M.; Sathish, Y. Simultaneous determination of 79 pesticides in pigeonpea grains using GC-MS/MS and LC-MS/MS. Food Chem. 2020. [Google Scholar] [CrossRef]
- Jang, J.; Rahman, M.M.; Abd El-Aty, A.M.; Ko, A.; Park, J.; Choi, J.; Park, K.H.; Yang, A.; Seo, Y.M.; Shim, J. Analysis of etoxazole in red pepper after major modification of QuEChERS for gas chromatography-nitrogen phosphorus detection. Biomed. Chromatogr. 2014, 28, 767–773. [Google Scholar] [CrossRef] [PubMed]
- Morales, A.; Ruiz, I.; Oliva, J.; Barba, A. Determination of sixteen pesticides in peppers using high-performance liquid chromatography/mass spectrometry. J. Environ. Sci. Health B 2011, 46, 525–529. [Google Scholar]
- Sreenivasa, R.C.H.; Gour, T.B.; Narasimha, R.K. Pesticide residues impact of agricultural exports in WTO. In National Seminar on Pesticide Residues and Their Risk Assessment; National Institute of Nutrition: Hyderabad, India, 2005; Volume 20, p. 15. [Google Scholar]
- Katz, J.M.; Winter, C.K. Comparison of pesticide exposure from consumption of domestic and imported fruits and vegetables. Food Chem. Toxicol. 2009, 47, 335–338. [Google Scholar] [CrossRef] [PubMed]
- Lehotay, S.J. Determination of pesticide residues in foods by acetonitrile extraction and partitioning with magnesium sulfate: Collaborative study. J. AOAC Int. 2007, 90, 485–520. [Google Scholar] [CrossRef]
- Chen, Y.Q.; Qiong, C.; Chuanjiang, T.; Chuanyong, L.; Yun, L. Evaluation of pesticide residues in fruits and vegetables from Xiamen, China. Food Control. 2011, 22, 1114–1120. [Google Scholar] [CrossRef]
- SANTE/12682/2019 of 1st January 2020. Guidance Document on Analytical Quality Control and Method Validation Procedures for Pesticide Residues and Analysis in Food and Feed; European Commission: Brussels, Belgium, 2019; pp. 1–53. [Google Scholar]
- Gambacorta, G.; Faccia, M.; Lamacchia, C.; di Luccia, A.; Notte, E.L. Pesticide residues in tomato grown in open field. Food Control 2005, 16. [Google Scholar] [CrossRef]
- Ellison, S.L.R.; Williams, A. EURACHEM/CITAC Guide: QuantifyingUncertainty in Analytical Measurement; London, UK. 2012. Available online: http://www.eurchem.org (accessed on 9 January 2020).
- Silva, C.M.; Habermann, G.; Marchi, M.R.; Zocolo, G.J. The role of matrix effects on the quantification of abscisic acid and its metabolites in the leaves of Bauhinia variegata L. using liquid chromatography combined with tandem mass spectrometry. Braz. J. Plant Physiol. 2012, 24, 223–232. [Google Scholar] [CrossRef]
- NABL Document 141. Guidelines for Estimation and Expression of Uncertainty in Measurement; NABL, Quality Council of India: New Delhi, India, 2016; p. 48. [Google Scholar]


| Pesticide | RT (Min.) | Quantification | Confirmation | ||||
|---|---|---|---|---|---|---|---|
| MRM Transition (m/z) | Collision Energy (eV) | MRM Transition (m/z) | Collision Energy (eV) | MRM Transition(m/z) | Collision Energy (eV) | ||
| GC-MS/MS | |||||||
| Dichlorvas | 6.41 | 185.0 > 93.0 | 14 | 185.0 > 109.0 | 14 | 185.0 > 63.0 | 22 |
| 4-Bromo-2-chloromophenol, | 6.56 | 208.0 > 63.10 | 27 | 208.0 > 99.10 | 21 | 208.0 > 144.00 | 15 |
| Trifluralin | 12.34 | 110.1 > 64.0 18 | 18 | 152.1 > 110.1 | 8 | 110.1 > 92.0 | 12 |
| α-BHC | 12.81 | 306.1 > 264.1 | 8 | 306.1 > 206.1 | 14 | 264.1 > 206.1 | 8 |
| β-BHC | 14.04 | 218.9 > 182.9 | 8 | 180.9 > 144.9 | 16 | 180.9 > 74.0 | 30 |
| Diazinon | 15.17 | 304.1 > 179.1 | 10 | 304.1 > 162.1 | 8 | 304.1 > 137.1 | 26 |
| Fluchloralin | 15.38 | 306.0 > 264.10 | 6 | 306.0 > 160.20 | 27 | 306.0 > 206.20 | 18 |
| Delta-BHC | 15.36 | 218.9 > 182.9 | 10 | 218.9 > 144.9 | 20 | 180.9 > 144.9 | 16 |
| Tri-allate | 15.67 | 268.1 > 226.0 | 14 | 268.1 > 184.0 | 20 | 270.1 > 228.0 | 14 |
| Iprobenfos | 16.06 | 204.0 > 91.0 | 8 | 204.0 > 171.0 | 6 | 123.0 > 45.0 | 16 |
| Propanil | 16.87 | 160.9 > 99.0 | 24 | 217.0 > 161.0 | 10 | 217.0 > 57.0 | 20 |
| Chlorpyrifos-methyl | 17.31 | 285.9 > 93.0 | 22 | 287.9 > 272.9 | 20 | 287.9 > 93.0 | 22 |
| Parathion-methyl | 17.30 | 125.0 > 47.0 | 12 | 263.0 > 109.0 | 14 | 125.0 > 62.0 | 6 |
| Alachlor | 17.73 | 188.1 > 160.1 | 10 | 188.1 > 132.1 | 18 | 160.1 > 132.1 | 10 |
| Heptachlor | 17.50 | 271.8 > 236.9 | 20 | 271.8 > 117.0 | 32 | 271.8 > 201.9 | 38 |
| Fenitrothion | 18.77 | 277.0 > 260.0 | 6 | 277.0 > 109.1 | 14 | 260.0 > 125.1 | 22 |
| Aldrin | 19.20 | 292.9 > 219.9 | 26 | 292.9 > 257.9 | 16 | 292.9 > 186.0 | 40 |
| Chlorpyrifos | 19.91 | 313.9 > 257.9 | 14 | 313.9 > 285.9 | 8 | 313.9 > 193.9 | 28 |
| Ethyl parathion | 19.95 | 291.1 > 109.0 | 14 | 291.1 > 137.0 | 6 | 291.1 > 81.0 | 24 |
| Chlorfenvinphos | 22.21 | 267.0 > 159.0 | 18 | 323.0 > 267.0 | 16 | 323.0 > 295.0 | 6 |
| Phenthoate | 22.34 | 119.1 > 82.1 | 28 | 119.1 > 84.1 | 28 | 149.1 > 105.1 | 4 |
| Allethrin | 22.39 | 273.9 > 125.0 | 20 | 246.0 > 121.0 | 6 | 246.0 > 63.0 | 28 |
| Butachlor | 23.76 | 188.1 > 160.1 | 12 | 188.1 > 132.1 | 18 | 176.1 > 134.1 | 12 |
| p,p’-DDE | 24.53 | 246.0 > 176.0 | 30 | 246.0 > 211.0 | 22 | 317.9 > 248.0 | 24 |
| Endrin | 25.22 | 262.9 > 193.0 | 28 | 262.9 > 228.0 | 22 | 244.9 > 210.0 | 8 |
| β-Endosulfan | 25.62 | 338.9 > 160.0 | 18 | 338.9 > 266.9 | 8 | 338.9 > 195.9 | 20 |
| p,p’-DDT | 26.12 | 235.0 > 165.0 | 24 | 235.0 > 199.0 | 16 | 237.0 > 199.0 | 16 |
| Endosulfan sulfate | 27.13 | 386.8 > 288.8 | 10 | 386.8 > 252.9 | 16 | 386.8 > 240.9 | 22 |
| o,p’-DDT | 27.34 | 235.0 > 165.0 | 24 | 235.0 > 199.0 | 16 | 237.0 > 199.0 | 16 |
| Bifenthrin | 29.08 | 181.1 > 166.1 | 12 | 181.1 > 153.1 | 8 | 181.1 > 179.1 | 12 |
| Fenpropathrin | 29.23 | 265.1 > 210.1 | 12 | 265.1 > 89.0 | 28 | 181.1 > 127.1 | 28 |
| λ-Cyhalothrin | 30.55 | 181.1 > 152.1 | 24 | 163.1 > 127.0 | 14 | - | - |
| Permethrin | 31.49 | 163.1 > 127.1 | 8 | 183.1 > 165.1 | 14 | 183.1 > 153.1 | 14 |
| Cypermethrin | 30.55 | 163.1 > 91.0 | 14 | 181.1 > 152.1 | 22 | 181.1 > 127.1 | 22 |
| Cyfluthrin | 32.56 | 226.1 > 206.1 | 14 | 226.1 > 199.1 | 6 | 163.1 > 91.0 | 14 |
| Etofenprox | 33.16 | 163.1 > 135.1 | 10 | 163.1 > 107.1 | 18 | 163.1 > 95.0 | 18 |
| Fenvalerate | 34.20 | 419.1 > 225.1 | 6 | 419.1 > 167.1 | 12 | 419.1 > 125.1 | 26 |
| Deltamethrin | 35.64 | 252.9 > 93.0 | 20 | 252.9 > 171.9 | 8 | 252.9 > 77.0 | 26 |
| LC-MS/MS | |||||||
| Acephate | 1.06 | 183.9 > 142.95 | 11 | 183.9 > 49 | 23 | 183.9 > 95.05 | 26 |
| Omethoate | 1.09 | 214 > 125 | 24 | 214 > 182.95 | 12 | 214 > 109.05 | 30 |
| Pymetrozine | 1.32 | 217.9 > 105.1 | 22 | 217.9 > 78 | 44 | 217.9 > 51.15 | 54 |
| Imidacloprid | 2.03 | 256.05 > 209.1 | 17 | 256.05 > 221.15 | 9 | 256.05 > 175.05 | 19 |
| Dimethoate | 2.67 | 229.95 > 199 | 10 | 229.95 > 125 | 22 | 229.95 > 171 | 17 |
| Carbendazim | 3.05 | 191.95 > 160 | 18 | 191.95 > 132 | 32 | 191.95 > 105.05 | 40 |
| Thiacloprid | 3.22 | 253.2 > 126.05 | 23 | 253.2 > 99.1 | 48 | 253.2 > 90.05 | 40 |
| Phosphomidon | 4.65 | 299.9 > 174.1 | 14 | 299.9 > 127.05 | 28 | 299.9 > 132.1 | 24 |
| Bendiocarb | 5.42 | 224 > 167.1 | 11 | 224 > 109 | 19 | 224 > 81.1 | 35 |
| Metribuzin | 5.43 | 215 > 187.1 | 20 | 215 > 49 | 29 | 215 > 58.05 | 27 |
| Carbofuron | 5.47 | 221.8 > 165.1 | 12 | 221.8 > 123.1 | 23 | 221.8 > 55.05 | 29 |
| Carbaryl | 6.12 | 202 > 145.05 | 12 | 202 > 127 | 28 | 202 > 117.1 | 24 |
| Isoproturon | 7.48 | 206.9 > 72.1 | 23 | 206.9 > 46.15 | 18 | 206.9 > 165.1 | 15 |
| Metalaxyl | 7.52 | 279.8 > 220.2 | 15 | 279.8 > 192.15 | 18 | 279.8 > 248.15 | 11 |
| Chlorantraniliprole | 8.31 | 483.75 > 452.95 | 17 | 483.75 > 285.9 | 16 | 483.75 > 177.05 | 50 |
| Coumatetryl | 9.11 | 293.1 > 175.1 | 24 | 293.1 > 91.15 | 36 | 293.1 > 107.05 | 35 |
| Paclobutrazole | 9.47 | 294.25 > 70.15 | 23 | 294.25 > 125.1 | 37 | 294.25 > 43.15 | 50 |
| Methoxyfenozide | 9.63 | 368.95 > 149.05 | 18 | 368.95 > 313.15 | 9 | 368.95 > 133.05 | 24 |
| Triademefon | 9.72 | 293.9 > 69.1 | 23 | 293.9 > 197.1 | 17 | 293.9 > 225.1 | 14 |
| Triazophos | 9.98 | 313.65 > 162.1 | 19 | 313.65 > 119.1 | 35 | 313.65 > 97.05 | 37 |
| Triademenol | 10.04 | 296.25 > 70.05 | 12 | 296.25 > 43.15 | 47 | 296.25 > 99.1 | 18 |
| Tetraconazole | 10.4 | 371.8 > 159.05 | 34 | 371.8 > 70.15 | 25 | 371.8 > 150.1 | 35 |
| Metalachlor | 10.64 | 283.95 > 252.15 | 15 | 283.95 > 176.2 | 27 | 283.95 > 134.1 | 34 |
| Quinalphos | 11.2 | 299.2 > 163.15 | 22 | 299.2 > 147.1 | 22 | 299.2 > 119 | 44 |
| Penconazole | 11.37 | 284.25 > 70.15 | 18 | 284.25 > 159.05 | 31 | 284.25 > 267.2 | 8 |
| Benalaxyl | 11.55 | 325.8 > 148.15 | 23 | 325.8 > 294.15 | 12 | 325.8 > 208.1 | 16 |
| Hexaconazole | 11.86 | 314.1 > 70.15 | 22 | 314.1 > 297.2 | 10 | 314.1 > 45.1 | 39 |
| Bitertenol | 12.03 | 338.2 > 269.2 | 10 | 338.2 > 99.1 | 17 | 338.2 > 70.15 | 11 |
| Phosalone | 12.05 | 367.7 > 182.05 | 16 | 367.7 > 111.05 | 43 | 367.7 > 138.1 | 32 |
| Spinosad | 12.17 | 732.2 > 142.15 | 35 | 732.2 > 98.25 | 54 | 732.2 > 99.15 | 52 |
| Thiobencarb | 12.25 | 258.05 > 125.05 | 20 | 258.05 > 100.15 | 13 | 258.05 > 89.15 | 49 |
| Difenconazole | 12.46 | 406.05 > 251 | 28 | 406.05 > 111.05 | 55 | 406.05 > 188.05 | 47 |
| Pretilachlor | 12.81 | 311.9 > 252.15 | 16 | 311.9 > 176.2 | 29 | 311.9 > 147.1 | 40 |
| Profenofos | 13.13 | 374.95 > 304.9 | 21 | 374.95 > 346.95 | 14 | 374.95 > 128.15 | 47 |
| Emamectin benzoate | 13.31 | 886.3 > 158.15 | 42 | 886.3 > 126.15 | 48 | 886.3 > 82.2 | 50 |
| Buprofezin | 13.51 | 306.15 > 200.9 | 11 | 306.15 > 57.15 | 30 | 306.15 > 116.1 | 16 |
| Hexythiazox | 14.00 | 352.9 > 228 | 15 | 352.9 > 168.15 | 28 | 352.9 > 116.15 | 43 |
| Pendimethalin | 14.18 | 281.8 > 212.05 | 11 | 281.8 > 199.95 | 8 | 281.8 > 193.95 | 20 |
| Fenpyroximate | 14.62 | 422 > 366.2 | 16 | 422 > 138.2 | 35 | 422 > 215.15 | 27 |
| Compounds | R2 | LOD(µg/kg) | LOQ(µg/kg) | Recovery (%) | Repeatability (100 µg·kg−1) | Reproducibility (100 µg·kg−1) | Matrix Effect (%) | MU at 50 µg·kg−1 | |||||
|---|---|---|---|---|---|---|---|---|---|---|---|---|---|
| 50(µg/kg) | 100 (µg/kg) | 200 (µg/kg) | Recovery (%) | RSD (%) | Recovery | RSD(%) | |||||||
| Day 1 | Day 2 | ||||||||||||
| GC-MS/MS | |||||||||||||
| Dichlorvos | 0.999 | 3.40 | 11.34 | 94.07 | 90.04 | 94.74 | 89.95 | 5.92 | 90.71 | 89.90 | 2.58 | 7.69 | ±7.34 |
| 4-Bromo-2-chlorophenol | 0.997 | 0.27 | 0.91 | 83.27 | 86.22 | 89.51 | 90.37 | 5.20 | 88.66 | 77.94 | 4.02 | 5.09 | ±6.82 |
| Trifluralin | 0.999 | 7.28 | 24.28 | 104.32 | 96.24 | 90.94 | 91.09 | 4.67 | 102.03 | 112.05 | 8.03 | 4.77 | ±5.79 |
| α-BHC | 0.999 | 1.95 | 6.51 | 103.27 | 96.40 | 98.91 | 92.65 | 3.92 | 96.48 | 95.96 | 4.81 | 5.37 | ± 5.12 |
| β-BHC | 0.999 | 2.90 | 9.65 | 103.11 | 94.35 | 92.70 | 90.81 | 5.05 | 92.56 | 95.04 | 7.62 | 4.88 | ±5.76 |
| Diazinon | 0.999 | 1.20 | 3.99 | 113.35 | 91.28 | 94.53 | 95.45 | 8.02 | 99.84 | 111.08 | 8.96 | 8.56 | ±5.77 |
| Fluchloralin | 0.997 | 3.19 | 10.62 | 103.94 | 102.43 | 92.27 | 90.88 | 5.83 | 105.10 | 99.67 | 11.63 | 2.87 | ±2.79 |
| delta-BHC | 0.999 | 2.30 | 7.66 | 102.62 | 98.51 | 91.16 | 91.23 | 5.13 | 93.49 | 100.35 | 6.58 | 4.53 | ±4.35 |
| Tri-allate | 0.997 | 1.50 | 5.02 | 108.10 | 95.89 | 98.37 | 96.92 | 5.55 | 90.60 | 105.83 | 12.45 | 25.99 | ±5.76 |
| Iprobenfos | 0.997 | 7.06 | 23.52 | 111.19 | 102.57 | 95.78 | 98.97 | 5.97 | 98.49 | 108.92 | 8.57 | 6.45 | ±6.59 |
| Propanil | 0.997 | 8.34 | 27.80 | 86.23 | 84.71 | 82.33 | 93.10 | 3.78 | 83.03 | 83.96 | 6.53 | 11.12 | ±5.24 |
| Chlorpyrifos-methyl | 0.997 | 1.06 | 3.53 | 101.65 | 90.69 | 91.86 | 90.46 | 5.18 | 95.32 | 99.38 | 12.35 | 9.94 | ±3.71 |
| Parathion-methyl | 0.997 | 4.13 | 13.78 | 99.54 | 95.82 | 91.81 | 97.17 | 5.73 | 98.16 | 97.27 | 8.58 | 8.40 | ±5,74 |
| Alachlor | 0.998 | 4.41 | 14.72 | 111.35 | 96.72 | 101.49 | 96.15 | 5.48 | 99.55 | 99.08 | 7.91 | 5.79 | ±6.59 |
| Heptachlor | 0.997 | 2.76 | 9.20 | 115.92 | 105.44 | 99.12 | 97.90 | 4.78 | 91.29 | 113.65 | 16.81 | 11.87 | ±2.83 |
| Fenitrothion | 0.998 | 1.35 | 4.50 | 105.80 | 98.85 | 112.83 | 91.41 | 4.83 | 101.06 | 103.53 | 3.24 | 2.92 | ±7.49 |
| Aldrin | 0.997 | 1.74 | 5.80 | 103.01 | 132.13 | 110.52 | 99.77 | 7.58 | 96.32 | 100.74 | 4.75 | 7.69 | ±5.63 |
| Chlorpyrifos | 0.999 | 10.91 | 36.35 | 108.09 | 90.49 | 90.48 | 92.55 | 3.88 | 89.90 | 105.82 | 12.99 | 4.14 | ±5.45 |
| Parathion-ethyl | 0.999 | 2.90 | 9.67 | 102.98 | 103.94 | 98.60 | 94.72 | 5.00 | 95.40 | 100.71 | 5.40 | 10.20 | ±7.26 |
| Chlorfenvinphos | 0.999 | 8.92 | 31.22 | 107.59 | 97.89 | 91.76 | 90.08 | 5.22 | 93.50 | 105.32 | 9.91 | 22.08 | ±4.62 |
| Phenthoate | 0.997 | 3.17 | 10.58 | 108.54 | 94.23 | 93.52 | 98.79 | 5.94 | 96.61 | 106.27 | 8.22 | 12.50 | ±5.38 |
| Allethrin | 0.996 | 0.19 | 0.63 | 103.60 | 106.66 | 98.60 | 98.02 | 1.59 | 99.06 | 101.33 | 3.17 | 7.51 | ±6.53 |
| Butachlor | 0.998 | 10.17 | 33.91 | 105.83 | 106.57 | 102.63 | 92.62 | 3.89 | 96.81 | 103.56 | 6.29 | 6.40 | ±6.29 |
| p,p’-DDE | 0.997 | 3.93 | 13.09 | 101.25 | 96.73 | 95.32 | 87.28 | 6.80 | 96.78 | 98.98 | 3.19 | 10.52 | ±5.01 |
| Endrin | 0.997 | 2.68 | 8.92 | 106.69 | 105.07 | 110.00 | 85.14 | 8.09 | 94.64 | 104.42 | 8.46 | 3.27 | ±3.05 |
| β-Endosulfan | 0.999 | 9.93 | 33.09 | 114.75 | 99.41 | 106.00 | 93.58 | 15.95 | 98.00 | 88.73 | 9.71 | 15.93 | ±6.63 |
| p,p’-DDT | 0.999 | 2.44 | 8.14 | 105.44 | 102.03 | 96.87 | 98.20 | 6.12 | 94.75 | 103.17 | 7.56 | 7.07 | ±2.23 |
| Endosulfan sulfate | 0.999 | 0.56 | 1.88 | 115.79 | 97.90 | 98.56 | 83.42 | 12.80 | 95.56 | 113.52 | 11.23 | 13.33 | ±11.71 |
| o,p’-DDT | 0.997 | 2.23 | 7.44 | 105.80 | 97.84 | 114.93 | 98.41 | 5.63 | 98.74 | 103.53 | 13.66 | 2.78 | ±4.24 |
| Bifenthrin | 0.998 | 1.5 | 4.90 | 101.68 | 93.28 | 98.14 | 90.94 | 4.95 | 96.73 | 99.41 | 3.53 | 7.13 | ±9.14 |
| Fenpropathrin | 0.997 | 6.09 | 20.30 | 104.63 | 95.93 | 93.81 | 92.68 | 6.44 | 93.68 | 102.36 | 7.81 | 10.50 | ±4.61 |
| λ-Cyhalothrin | 0.999 | 8.05 | 26.84 | 96.76 | 89.74 | 98.92 | 89.97 | 5.62 | 99.66 | 94.49 | 2.09 | 23.96 | ±12.09 |
| Permethrin | 0.999 | 2.57 | 8.55 | 92.01 | 88.34 | 93.51 | 89.21 | 6.15 | 91.52 | 89.74 | 8.37 | 9.63 | ±2.87 |
| Cypermethrin | 0.995 | 5.07 | 17.74 | 95.89 | 87.41 | 90.69 | 90.26 | 5.50 | 98.57 | 93.62 | 1.95 | 34.33 | ±8.14 |
| Cyfluthrin | 0.999 | 1.45 | 4.84 | 78.95 | 79.61 | 81.27 | 90.28 | 5.79 | 90.83 | 88.68 | 12.82 | 32.63 | ±3.47 |
| Etofenprox | 0.998 | 1.55 | 5.17 | 86.93 | 85.18 | 86.47 | 90.40 | 5.37 | 84.30 | 84.66 | 3.01 | 5.51 | ±2.97 |
| Fenvalerate | 0.996 | 1.61 | 5.35 | 89.14 | 84.64 | 90.05 | 86.77 | 7.83 | 88.69 | 94.87 | 16.51 | 37.50 | ±7.55 |
| Deltamethrin | 0.998 | 7.95 | 26.50 | 96.19 | 84.04 | 88.39 | 93.81 | 3.98 | 94.67 | 93.92 | 1.13 | 44.50 | ±8.52 |
| LC-MS/MS | |||||||||||||
| Thiacloprid | 0.999 | 2.65 | 8.84 | 83.43 | 83.32 | 85.37 | 88.66 | 4.90 | 81.77 | 92.50 | 7.41 | 4.3 | ±8.53 |
| Buprofezin | 0.999 | 2.50 | 8.32 | 85.22 | 87.56 | 91.28 | 83.28 | 5.08 | 88.84 | 94.62 | 5.63 | −1.6 | ±10.91 |
| Metalachlor | 0.999 | 2.59 | 8.64 | 83.25 | 89.32 | 80.55 | 80.16 | 4.42 | 91.05 | 84.50 | 7.38 | 23.0 | ±8.73 |
| Imidacloprid | 0.999 | 5.66 | 18.87 | 88.82 | 83.00 | 85.18 | 84.62 | 9.40 | 97.87 | 95.12 | 10.50 | 1.6 | ±8.68 |
| Dimethoate | 0.999 | 1.16 | 3.88 | 79.39 | 85.13 | 83.05 | 90.14 | 6.67 | 86.85 | 93.16 | 5.92 | −2.5 | ±12.20 |
| Coumatetryl | 0.999 | 1.24 | 4.14 | 85.86 | 89.00 | 82.38 | 84.68 | 8.39 | 93.61 | 79.18 | 8.09 | 6.1 | ±3.56 |
| Triademenol | 0.999 | 9.32 | 32.62 | 91.64 | 87.00 | 106.97 | 87.62 | 7.26 | 104.20 | 83.12 | 6.37 | −3.7 | ±10.66 |
| Triademefon | 0.999 | 2.03 | 6.76 | 85.00 | 102.00 | 90.25 | 99.51 | 4.91 | 97.43 | 90.02 | 5.51 | −22.1 | ±7.84 |
| Thiobencarb | 0.998 | 8.52 | 28.41 | 86.00 | 88.12 | 82.12 | 83.10 | 13.71 | 87.89 | 90.54 | 10.94 | 19.0 | ±12.29 |
| Spinosad | 0.999 | 0.83 | 2.75 | 104.12 | 110.23 | 98.20 | 108.23 | 5.29 | 89.85 | 98.23 | 6.50 | −5.6 | ±10.03 |
| Phosalone | 0.999 | 5.20 | 17.35 | 85.61 | 88.19 | 83.80 | 83.21 | 7.47 | 87.29 | 95.66 | 8.70 | −14.5 | ±10.96 |
| Methoxyfenozide | 0.999 | 0.96 | 3.21 | 111.15 | 118.23 | 91.52 | 108.13 | 5.14 | 93.38 | 100.08 | 6.64 | −4.8 | ±10.32 |
| Hexythiazox | 0.999 | 5.71 | 19.04 | 89.21 | 94.00 | 87.92 | 96.56 | 7.35 | 85.19 | 90.57 | 9.04 | −22.0 | ±9.22 |
| Fenpyroximate | 0.999 | 2.07 | 6.90 | 89.56 | 107.00 | 98.83 | 101.00 | 4.93 | 90.03 | 84.68 | 4.78 | −4.7 | ±11.16 |
| Carbendazim | 0.998 | 1.84 | 6.13 | 98.23 | 106.00 | 107.21 | 102.62 | 10.81 | 93.38 | 104.13 | 9.83 | 5.1 | ±10.24 |
| Carbaryl | 0.999 | 3.45 | 11.51 | 94.07 | 98.00 | 89.08 | 76.50 | 6.73 | 83.32 | 88.54 | 8.18 | −9.1 | ±7.47 |
| Triazophos | 0.999 | 1.98 | 6.60 | 95.61 | 85.00 | 88.79 | 97.50 | 6.16 | 84.64 | 95.04 | 8.38 | −2.5 | ±12.01 |
| Carbofuron | 0.999 | 1.44 | 4.79 | 85.61 | 83.03 | 88.11 | 81.13 | 4.25 | 96.61 | 90.80 | 5.40 | −0.9 | ±8.91 |
| Bitertenol | 0.999 | 9.14 | 30.47 | 97.93 | 102.12 | 95.55 | 92.17 | 10.21 | 96.48 | 86.65 | 8.18 | −10.6 | ±11.44 |
| Bendiocarb | 0.999 | 1.84 | 6.12 | 83.77 | 82.23 | 80.89 | 91.62 | 6.76 | 94.51 | 86.52 | 6.87 | −41.2 | ±7.09 |
| Benalaxyl | 0.999 | 0.42 | 1.40 | 89.41 | 84.01 | 82.71 | 81.45 | 5.14 | 87.44 | 87.95 | 7.23 | −55.0 | ±7.96 |
| Acephate | 0.998 | 3.17 | 10.58 | 87.82 | 85.02 | 78.95 | 87.07 | 10.85 | 81.66 | 100.07 | 9.44 | −7.4 | ±8.65 |
| Pymetrozine | 0.999 | 1.55 | 5.16 | 79.47 | 78.12 | 85.14 | 82.68 | 9.63 | 94.55 | 96.28 | 9.99 | −24.2 | ±11.66 |
| Omethoate | 0.999 | 2.68 | 8.92 | 89.61 | 98.12 | 83.92 | 92.61 | 13.24 | 81.70 | 101.11 | 11.26 | −0.7 | ±12.22 |
| Metribuzin | 0.998 | 8.24 | 27.48 | 93.13 | 111.05 | 94.14 | 100.48 | 8.14 | 84.90 | 91.52 | 8.57 | −10.4 | ±10.75 |
| Metalaxyl | 0.999 | 0.74 | 2.47 | 93.74 | 93.01 | 94.89 | 106.01 | 5.02 | 93.60 | 103.51 | 8.01 | 21.2 | ±10.94 |
| Emamectin benzoate | 0.999 | 0.68 | 2.26 | 92.12 | 98.02 | 96.01 | 95.01 | 4.85 | 89.50 | 93.52 | 3.27 | −27.7 | ±12.18 |
| Tetraconazole | 0.999 | 1.10 | 3.68 | 97.39 | 98.12 | 95.40 | 98.56 | 4.70 | 96.82 | 92.01 | 4.41 | −3.9 | ±10.75 |
| Quinalphos | 0.999 | 2.81 | 9.36 | 86.19 | 74.00 | 91.22 | 89.50 | 5.73 | 96.07 | 102.02 | 4.50 | −34.7 | ±9.24 |
| Profenofos | 0.999 | 2.57 | 8.56 | 95.34 | 109.02 | 101.18 | 114.01 | 5.64 | 96.15 | 98.56 | 5.67 | −10.2 | ±11.93 |
| Phosphomidon | 0.998 | 3.77 | 12.57 | 101.13 | 110.23 | 97.88 | 108.73 | 6.34 | 75.00 | 98.30 | 5.58 | −8.2 | ±10.37 |
| Pendimethalin | 0.999 | 3.51 | 11.69 | 99.23 | 102.89 | 100.04 | 110.54 | 9.09 | 90.99 | 101.41 | 9.94 | −1.9 | ±10.38 |
| Difenconazole | 0.999 | 1.50 | 5.01 | 94.25 | 101.08 | 86.85 | 114.66 | 5.25 | 92.55 | 106.01 | 6.12 | −17.9 | ±7.61 |
| Pretilachlor | 0.999 | 0.62 | 2.08 | 102.17 | 96.00 | 99.67 | 89.00 | 5.82 | 89.87 | 102.00 | 7.92 | 6.3 | ±8.86 |
| Paclobutrazole | 0.999 | 3.33 | 11.10 | 97.64 | 89.34 | 93.50 | 96.53 | 6.58 | 102.29 | 104.42 | 7.00 | 32.0 | ±10.59 |
| Chlorantraniliprole | 0.999 | 1.26 | 4.21 | 98.33 | 88.34 | 96.48 | 89.57 | 8.69 | 87.48 | 100.33 | 9.40 | 2.3 | ±10.64 |
| Isoproturon | 0.999 | 5.36 | 17.88 | 88.04 | 89.54 | 88.71 | 88.58 | 6.20 | 85.81 | 98.90 | 7.39 | −8.0 | ±10.51 |
| Hexaconazole | 0.998 | 8.01 | 26.71 | 103.34 | 84.57 | 97.84 | 98.75 | 6.07 | 92.56 | 99.08 | 9.40 | 20.2 | ±10.63 |
| Penconazole | 0.999 | 1.82 | 6.06 | 96.20 | 99.78 | 86.60 | 93.20 | 5.97 | 89.68 | 96.00 | 8.37 | 13.70 | ±11.57 |
| Compounds | R2 | LOD (µg/kg) | LOQ (µg/kg) | Recovery (%) | Repeatability (100 µg/kg) | Reproducibility (100 µg/kg) | Matrix Effect (%) | MU at 50 µg·kg−1 Spiking Level | |||||
|---|---|---|---|---|---|---|---|---|---|---|---|---|---|
| 50 (µg/kg) | 100 (µg/kg) | 200 (µg/kg) | Recovery(%) | RSD(%) | Recovery | RSD (%) | |||||||
| Day 1 | Day 2 | ||||||||||||
| GC-MS/MS | |||||||||||||
| Dichlorvos | 0.999 | 7.88 | 27.58 | 84.95 | 86.05 | 97.42 | 80.37 | 4.17 | 79.39 | 89.47 | 0.80 | −1.52 | ±13.51 |
| 4-Bromo-2-chloro-phenol | 0.999 | 5.36 | 18.76 | 79.57 | 78.93 | 93.25 | 73.05 | 4.76 | 82.07 | 84.02 | 1.58 | 10.95 | ±9.61 |
| Trifluralin | 0.999 | 4.11 | 14.39 | 86.16 | 89.96 | 100.85 | 82.05 | 5.27 | 81.07 | 89.57 | 2.17 | −4.39 | ±10.13 |
| α-BHC | 0.999 | 2.63 | 9.21 | 84.57 | 85.81 | 99.19 | 71.30 | 5.90 | 70.32 | 86.58 | 0.72 | −1.64 | ±8.33 |
| β-BHC | 0.996 | 5.15 | 18.03 | 81.98 | 86.43 | 83.03 | 73.42 | 5.87 | 72.44 | 85.93 | 2.38 | −2.17 | ±8.30 |
| Diazinon | 0.999 | 4.43 | 15.51 | 80.29 | 82.14 | 99.06 | 72.82 | 6.87 | 71.84 | 89.47 | 1.33 | 7.95 | ±9.62 |
| Fluchloralin | 0.999 | 2.35 | 8.23 | 80.56 | 84.87 | 84.86 | 78.16 | 7.42 | 77.18 | 87.35 | 6.44 | 0.04 | ±8.34 |
| delta-BHC | 0.999 | 4.53 | 15.86 | 82.04 | 87.94 | 90.35 | 72.01 | 5.27 | 71.03 | 90.40 | 1.35 | −1.50 | ±23.25 |
| Tri-allate | 0.999 | 3.39 | 11.87 | 82.44 | 83.14 | 89.06 | 75.27 | 7.09 | 74.29 | 88.25 | 0.96 | −0.75 | ±8.08 |
| Iprobenfos | 0.999 | 7.32 | 25.62 | 85.02 | 85.66 | 94.07 | 68.92 | 5.08 | 67.94 | 93.78 | 0.88 | −1.02 | ±10.63 |
| Propanil | 0.998 | 7.85 | 27.48 | 79.05 | 86.94 | 80.67 | 73.75 | 7.91 | 82.77 | 86.79 | 0.10 | 11.81 | ± 6.50 |
| Chlorpyrifos-methyl | 0.998 | 6.36 | 22.26 | 80.26 | 83.50 | 92.93 | 85.09 | 4.41 | 84.11 | 85.41 | 0.34 | 2.60 | ±13.18 |
| Parathion-methyl | 0.999 | 5.39 | 18.87 | 76.15 | 72.18 | 78.55 | 81.82 | 5.49 | 80.84 | 79.32 | 2.92 | −4.56 | ±13.95 |
| Alachlor | 0.999 | 3.56 | 12.46 | 83.92 | 82.91 | 91.82 | 71.52 | 5.78 | 70.54 | 80.18 | 1.34 | −2.90 | ±9.25 |
| Heptachlor | 0.999 | 5.99 | 20.97 | 79.31 | 87.49 | 97.35 | 76.50 | 4.40 | 75.52 | 89.40 | 2.63 | 11.97 | ±9.10 |
| Fenitrothion | 0.999 | 3.74 | 13.09 | 83.29 | 84.90 | 93.92 | 86.65 | 7.42 | 85.67 | 83.34 | 3.60 | −4.86 | ±11.91 |
| Aldrin | 0.994 | 5.53 | 19.36 | 86.46 | 88.16 | 99.05 | 78.87 | 7.15 | 77.89 | 96.56 | 2.10 | −1.90 | ±9.99 |
| Chlorpyrifos | 0.999 | 9.55 | 33.43 | 85.92 | 83.70 | 97.28 | 72.98 | 4.86 | 72.00 | 94.98 | 1.91 | −4.00 | ±11.15 |
| Parathion-ethyl | 0.999 | 1.33 | 4.66 | 82.81 | 82.94 | 98.39 | 69.33 | 6.65 | 78.35 | 87.00 | 2.42 | 1.57 | ±10.64 |
| Chlorfenvinphos | 0.999 | 5.14 | 17.99 | 81.63 | 84.05 | 89.54 | 69.57 | 6.00 | 88.59 | 86.99 | 2.67 | −0.48 | ±8.16 |
| Phenthoate | 0.999 | 3.90 | 13.65 | 84.35 | 83.02 | 97.82 | 70.29 | 5.42 | 69.31 | 91.24 | 0.95 | 0.64 | ±7.46 |
| Aallethrin | 0.997 | 0.10 | 0.35 | 78.49 | 79.93 | 76.24 | 92.94 | 5.60 | 91.96 | 93.24 | 0.22 | 0.15 | ±8.34 |
| Butachlor | 0.998 | 1.47 | 5.15 | 88.90 | 86.00 | 92.23 | 75.69 | 6.36 | 74.71 | 83.40 | 2.17 | −3.33 | ±8.25 |
| p,p’-DDE | 0.999 | 4.54 | 15.89 | 87.98 | 85.70 | 96.75 | 79.87 | 4.68 | 78.89 | 78.74 | 0.12 | −0.43 | ±8.94 |
| Endrin | 0.998 | 2.24 | 7.84 | 86.85 | 88.33 | 88.77 | 69.62 | 7.20 | 68.64 | 82.55 | 0.06 | −2.27 | ±8.40 |
| β-Endosulfan | 0.999 | 2.08 | 7.28 | 94.10 | 89.24 | 87.85 | 77.05 | 15.34 | 76.07 | 97.73 | 9.10 | 5.60 | ±7.37 |
| p,p’-DDT | 0.999 | 5.97 | 20.90 | 85.89 | 86.70 | 92.29 | 80.08 | 4.09 | 79.10 | 86.24 | 0.14 | −2.08 | ±8.24 |
| Endosulfansulfate | 0.998 | 1.56 | 5.46 | 83.59 | 81.11 | 88.48 | 76.47 | 15.04 | 85.49 | 80.68 | 4.34 | 2.76 | ±11.95 |
| o,p’-DDT | 0.998 | 8.79 | 30.77 | 80.82 | 82.05 | 74.10 | 73.22 | 5.03 | 72.24 | 78.91 | 5.29 | 6.66 | ±9.34 |
| Bifenthrin | 0.999 | 6.30 | 22.05 | 82.91 | 85.37 | 96.21 | 83.90 | 3.51 | 82.92 | 85.45 | 0.38 | 0.89 | ±9.21 |
| Fenpropathrin | 0.999 | 9.25 | 32.38 | 84.19 | 84.19 | 96.53 | 81.09 | 4.36 | 80.11 | 89.68 | 1.24 | 3.28 | ±8.08 |
| λ-Cyhalothrin | 0.999 | 5.06 | 17.71 | 89.81 | 92.18 | 99.89 | 83.15 | 3.99 | 82.17 | 85.82 | 0.28 | 3.47 | ±13.50 |
| Permethrin | 0.999 | 5.33 | 18.66 | 88.23 | 94.06 | 103.32 | 79.56 | 4.68 | 78.58 | 84.76 | 0.18 | 1.01 | ±10.41 |
| Cypermethrin | 0.999 | 6.25 | 21.88 | 81.89 | 82.79 | 98.62 | 83.25 | 4.24 | 82.27 | 81.75 | 1.29 | 0.85 | ±9.30 |
| Cyfluthrin | 0.997 | 5.20 | 18.20 | 82.89 | 81.97 | 91.32 | 80.49 | 4.11 | 79.51 | 96.54 | 0.84 | 2.54 | ±9.00 |
| Etofenprox | 0.999 | 3.84 | 13.44 | 82.47 | 83.04 | 93.46 | 71.78 | 2.99 | 70.80 | 94.56 | 0.22 | −0.55 | ±12.57 |
| Fenvalerate | 0.998 | 2.47 | 8.65 | 85.19 | 82.32 | 97.18 | 79.22 | 8.40 | 78.24 | 85.99 | 2.94 | 2.82 | ±23.94 |
| Deltamethrin | 0.999 | 5.06 | 17.71 | 79.81 | 81.60 | 88.23 | 83.09 | 5.60 | 82.11 | 88.62 | 3.91 | 4.57 | ±7.10 |
| LC-MS/MS | |||||||||||||
| Thiacloprid | 0.999 | 1.79 | 5.98 | 74.89 | 80.05 | 79.16 | 81.35 | 12.63 | 82.19 | 85.17 | 15.04 | −16.35 | ±12.71 |
| Buprofezin | 0.999 | 2.15 | 7.17 | 89.52 | 81.53 | 84.58 | 87.88 | 4.13 | 89.02 | 85.16 | 12.63 | 10.53 | ±8.37 |
| Metalachlor | 0.999 | 2.53 | 8.44 | 91.92 | 82.09 | 86.80 | 89.90 | 3.73 | 89.65 | 95.62 | 14.89 | −18.30 | ±7.80 |
| Imidacloprid | 0.999 | 2.70 | 8.99 | 81.32 | 81.08 | 97.39 | 86.39 | 9.51 | 89.08 | 87.46 | 6.41 | 3.11 | ±10.84 |
| Dimethoate | 0.999 | 0.52 | 1.74 | 92.49 | 87.07 | 93.22 | 92.99 | 3.64 | 88.76 | 90.46 | 13.28 | 6.89 | ±7.66 |
| Coumatetryl | 0.999 | 0.67 | 2.22 | 83.63 | 88.68 | 81.57 | 83.70 | 12.29 | 81.28 | 89.71 | 5.58 | 19.68 | ± 7.34 |
| Triademenol | 0.999 | 0.99 | 3.31 | 95.76 | 81.22 | 97.47 | 96.05 | 5.11 | 80.04 | 87.80 | 6.09 | 12.21 | ±7.13 |
| Triademefon | 0.999 | 0.67 | 2.23 | 96.15 | 88.12 | 89.32 | 96.01 | 5.33 | 88.85 | 89.10 | 5.30 | −12.01 | ±7.21 |
| Thiobencarb | 0.999 | 3.59 | 11.96 | 80.85 | 91.72 | 89.79 | 88.41 | 11.08 | 86.82 | 88.47 | 4.31 | −16.36 | ±10.73 |
| Spinosad | 0.999 | 0.75 | 2.52 | 71.57 | 76.67 | 77.45 | 79.60 | 7.65 | 70.34 | 71.14 | 5.51 | −2.42 | ±15.70 |
| Phosalone | 0.998 | 1.76 | 5.86 | 88.94 | 95.21 | 95.06 | 90.13 | 9.12 | 85.44 | 86.37 | 12.51 | 5.13 | ±8.99 |
| Methoxyfenozide | 0.999 | 0.71 | 2.37 | 95.11 | 88.52 | 90.06 | 92.86 | 3.43 | 80.64 | 91.43 | 10.33 | 10.95 | ±7.23 |
| Hexythiazox | 0.999 | 2.37 | 7.91 | 90.76 | 91.26 | 105.31 | 89.03 | 6.19 | 88.25 | 96.23 | 13.57 | 12.65 | ±8.06 |
| Fenpyroximate | 0.999 | 1.89 | 6.29 | 95.74 | 95.03 | 98.19 | 90.37 | 4.75 | 96.79 | 94.39 | 11.22 | 12.82 | ±7.25 |
| Carbendazim | 0.999 | 0.31 | 1.04 | 72.71 | 72.16 | 70.28 | 78.79 | 11.45 | 82.14 | 84.00 | 9.18 | −9.00 | ±15.57 |
| Carbaryl | 0.999 | 0.94 | 3.14 | 82.04 | 80.80 | 81.74 | 87.33 | 12.32 | 96.97 | 95.43 | 6.63 | −7.43 | ±11.11 |
| Triazophos | 0.999 | 2.87 | 9.58 | 90.41 | 85.04 | 89.75 | 90.72 | 4.46 | 87.68 | 89.31 | 14.55 | 26.77 | ±8.19 |
| Carbofuron | 0.999 | 0.71 | 2.38 | 91.79 | 89.92 | 88.15 | 90.79 | 4.05 | 96.40 | 99.27 | 10.02 | −3.72 | ±7.85 |
| Bitertenol | 0.999 | 1.73 | 5.78 | 86.38 | 92.32 | 96.54 | 87.86 | 8.92 | 85.26 | 88.95 | 10.13 | 9.09 | ±9.48 |
| Bendiocarb | 0.999 | 0.74 | 2.47 | 91.37 | 85.22 | 92.24 | 89.49 | 3.35 | 83.20 | 96.07 | 12.85 | 11.36 | ±7.88 |
| Benalaxyl | 0.999 | 0.29 | 0.95 | 94.69 | 85.04 | 87.65 | 91.71 | 4.00 | 89.16 | 84.93 | 12.25 | 15.43 | ±7.30 |
| Acephate | 0.999 | 2.33 | 7.78 | 87.71 | 85.92 | 87.64 | 92.23 | 13.44 | 82.23 | 86.59 | 5.86 | −14.11 | ±9.78 |
| Pymetrozine | 0.999 | 0.93 | 3.11 | 81.38 | 92.32 | 86.81 | 87.81 | 14.63 | 81.14 | 82.30 | 7.99 | 4.04 | ±20.55 |
| Omethoate | 0.998 | 3.87 | 12.90 | 78.37 | 80.22 | 79.65 | 85.17 | 11.20 | 78.14 | 79.80 | 10.30 | 0.16 | ±12.21 |
| Metribuzin | 0.999 | 2.16 | 7.18 | 87.39 | 88.78 | 83.46 | 91.15 | 7.13 | 96.91 | 98.12 | 12.92 | 15.67 | ±8.94 |
| Metalaxyl | 0.999 | 0.47 | 1.56 | 95.39 | 89.15 | 92.87 | 95.88 | 3.56 | 96.73 | 94.27 | 9.38 | 10.20 | ±7.20 |
| Emamectin benzoate | 0.999 | 0.39 | 1.29 | 89.46 | 83.80 | 85.93 | 85.61 | 14.34 | 85.89 | 89.44 | 8.10 | −15.61 | ±16.79 |
| Tetraconazole | 0.999 | 0.28 | 0.92 | 101.38 | 93.97 | 100.22 | 94.19 | 5.26 | 90.62 | 94.75 | 13.13 | 17.05 | ±7.22 |
| Quinalphos | 0.999 | 1.29 | 4.29 | 91.57 | 87.11 | 82.56 | 92.62 | 5.10 | 83.93 | 81.65 | 8.80 | −10.76 | ±7.97 |
| Profenofos | 0.998 | 1.16 | 3.87 | 97.70 | 89.71 | 99.16 | 95.42 | 5.25 | 94.32 | 89.40 | 8.32 | −7.87 | ±8.77 |
| Phosphomidon | 0.999 | 0.24 | 0.80 | 85.70 | 87.92 | 97.00 | 88.23 | 5.70 | 83.06 | 87.20 | 12.68 | −11.05 | ±9.37 |
| Pendimethalin | 0.998 | 0.53 | 1.78 | 92.57 | 89.01 | 82.65 | 91.47 | 8.83 | 88.80 | 99.76 | 9.48 | −7.07 | ±8.00 |
| Difenconazole | 0.999 | 0.51 | 1.71 | 94.04 | 88.00 | 84.50 | 91.77 | 4.45 | 94.41 | 102.84 | 10.68 | 8.79 | ±7.42 |
| Pretilachlor | 0.999 | 0.54 | 1.79 | 94.85 | 97.35 | 88.35 | 95.20 | 3.58 | 87.17 | 99.47 | 12.18 | 13.33 | ±7.27 |
| Paclobutrazole | 0.999 | 0.92 | 3.07 | 86.65 | 86.92 | 88.97 | 92.11 | 4.40 | 82.42 | 86.96 | 14.99 | 8.44 | ±9.05 |
| Chlorantraniliprole | 0.999 | 0.19 | 0.63 | 89.61 | 89.19 | 95.79 | 92.80 | 11.27 | 84.02 | 83.95 | 5.44 | 10.04 | ±9.04 |
| Isoproturon | 0.999 | 0.38 | 1.25 | 89.05 | 90.93 | 88.19 | 92.01 | 8.18 | 88.81 | 95.96 | 8.82 | −9.98 | ±8.56 |
| Hexaconazole | 0.999 | 0.59 | 1.96 | 92.41 | 90.24 | 87.96 | 93.66 | 4.66 | 97.55 | 99.62 | 11.25 | 8.56 | ±7.68 |
| Penconazole | 0.998 | 1.79 | 5.98 | 87.75 | 85.39 | 95.23 | 92.06 | 4.24 | 88.90 | 97.53 | 14.81 | 5.71 | ±8.79 |
Publisher’s Note: MDPI stays neutral with regard to jurisdictional claims in published maps and institutional affiliations. |
© 2021 by the authors. Licensee MDPI, Basel, Switzerland. This article is an open access article distributed under the terms and conditions of the Creative Commons Attribution (CC BY) license (http://creativecommons.org/licenses/by/4.0/).
Share and Cite
Naik Rathod, H.; Mallappa, B.; Malenahalli Sidramappa, P.; Reddy Vennapusa, C.S.; Kamin, P.; Revanasiddappa Nidoni, U.; Desai, B.R.K.R.; Rao, S.N.; Mariappan, P. Determination of 77 Multiclass Pesticides and Their Metabolitesin Capsicum and Tomato Using GC-MS/MS and LC-MS/MS. Molecules 2021, 26, 1837. https://doi.org/10.3390/molecules26071837
Naik Rathod H, Mallappa B, Malenahalli Sidramappa P, Reddy Vennapusa CS, Kamin P, Revanasiddappa Nidoni U, Desai BRKR, Rao SN, Mariappan P. Determination of 77 Multiclass Pesticides and Their Metabolitesin Capsicum and Tomato Using GC-MS/MS and LC-MS/MS. Molecules. 2021; 26(7):1837. https://doi.org/10.3390/molecules26071837
Chicago/Turabian StyleNaik Rathod, Harischandra, Bheemanna Mallappa, Pallavi Malenahalli Sidramappa, Chandra Sekhara Reddy Vennapusa, Pavankumar Kamin, Udaykumar Revanasiddappa Nidoni, Bheemsain Rao Kishan Rao Desai, Saroja Narsing Rao, and Paramasivam Mariappan. 2021. "Determination of 77 Multiclass Pesticides and Their Metabolitesin Capsicum and Tomato Using GC-MS/MS and LC-MS/MS" Molecules 26, no. 7: 1837. https://doi.org/10.3390/molecules26071837
APA StyleNaik Rathod, H., Mallappa, B., Malenahalli Sidramappa, P., Reddy Vennapusa, C. S., Kamin, P., Revanasiddappa Nidoni, U., Desai, B. R. K. R., Rao, S. N., & Mariappan, P. (2021). Determination of 77 Multiclass Pesticides and Their Metabolitesin Capsicum and Tomato Using GC-MS/MS and LC-MS/MS. Molecules, 26(7), 1837. https://doi.org/10.3390/molecules26071837