1. Introduction
Dropping Mentos candies into a freshly opened bottle of Diet Coke (or other carbonated beverage) is a popular experiment among science teachers and the general public [
1,
2,
3,
4,
5,
6,
7,
8,
9,
10]. The wide-spread fascination with this experiment stems from the fact that it produces impressive results and is extremely easy to carry out. When the candies enter the beverage, they catalyze a sudden degassing of dissolved CO
2 [
3,
8,
9,
10]:
The rapid escape of gas forces a jet of bubbly liquid out of the bottle that can reach up to a few meters high. Insight into the physical chemistry involved in fountain formation has been uncovered by studies on the kinetics of degassing and bubble growth in this experiment [
6,
7,
8,
9,
10]. Further understanding of the relevant processes has been guided by studies on nucleation and bubble growth in Champagne and other carbonated beverages [
11,
12,
13,
14,
15,
16,
17,
18,
19,
20]. We now turn to this information.
Carbonated soft drinks (sodas) are sealed under CO
2 pressures (P
CO2) of about 3–5 bar [
20,
21]. This causes CO
2 to dissolve into a beverage to a concentration ([CO
2]) in accordance with Henry’s Law:
where
KH is the Henry’s Law constant for CO
2 dissolving in water. This constant displays dependence on temperature [
22]:
Here, a1 = 14.000, a2 = −0.013341 K−1, a3 = −558.98 K, and a4 = −422,577 K2. Thus, 1 L of a soda with PCO2 = 4 bar would be expected to contain ~6 g of CO2 at room temperature (298.15 K, 1 kg of beverage, KH = 0.0336 mol kg−1 bar−1). Upon opening such a soda, PCO2 drops to the atmospheric level of CO2 (~0.0004 bar). Under this significantly lower pressure, essentially all the CO2 escapes, albeit slowly. This is fortunate for the many people that enjoy drinking carbonated beverages. Imagine if CO2 always escaped carbonated drinks quickly, such as what is observed when a soda bottle is opened after it has been vigorously shaken!
A number of factors contribute to the slow discharge of CO
2 from carbonated beverages. A large activation energy barrier exists for spontaneous bubble formation, which severely limits degassing via this route [
11,
12]. However, CO
2 escape can occur at the air-exposed beverage surface or at tiny, pre-existing gas cavities immersed in the bulk of the liquid [
11,
12,
13,
14,
15,
16,
17,
18,
19,
20]. Such gas pockets are provided by unwetted pores and pockets embedded in bits of dust, lint, and fiber that are submerged in the bulk of a beverage. These pre-existing gas bubbles serve as nucleating sites for bubble growth in what is known as Type IV bubble nucleation [
11,
12]. A second reason for the slow loss of CO
2 is that the beverage/air surface does not provide a facile route for gas discharge because of its small area. Third, it is usually the case that only a few nucleation-supporting items are found in a beverage. Together, these considerations restrict the rate of CO
2 escape from carbonated beverages. The addition of Mentos candies, however, drastically increases the rate of degassing. The surface of a Mentos candy contains enormous numbers of pits and pockets, each of which can serve as nucleation sites when submerged in a carbonated drink [
3,
9,
10]. The maximum number of nucleation sites on a single Mentos can be grossly estimated to be between 5 and 60 million by dividing the surface area of the candy (8 cm
2 [
9]) by the circular area of the nucleation sites, which have an estimated radius of 2–7 μm [
10]. Consistent with this estimate, in a previously published AFM image of the surface of a Mentos candy, about 5 pores appear in an area of 100 μm
2 [
3]. This translates to about 40 million such sites over the entire 8 cm
2 surface of the candy. These estimates represent a maximum number of sites, given that SEM images display alternating smooth and rough regions on the Mentos surface [
8]. Furthermore, the estimate assumes that all such sites are capable of actively nucleating bubbles, but the number of sites active sites likely decreases as the candy dissolves into the surrounding soda. Nevertheless, this back-of-the-envelope calculation illustrates that there are at least hundreds of thousands to millions of potential nucleation sites on a Mentos candy.
Being supersaturated in dissolved CO
2, carbonated beverages experience a thermodynamic driving force for the escape of CO
2 into the gas phase. However, a barrier to gas bubble formation exists due to the formation of a new gas/liquid interface. Bubbles with a radius,
, that exceed a critical value can surmount this energy barrier [
23,
24]:
where
γ is the surface tension at the gas/liquid interface and ∆
Gv is the free energy per molar volume associated with the process outlined in Equation (1). The radius,
r, of a spherical bubble can also be expressed as:
where
is the surface tension at the gas/beverage interface,
is the pressure inside and
is the pressure outside the bubble. From Henry’s Law
, while the pressure outside the bubble is the sum of atmospheric (
) and hydrostatic pressures. At the depths involved in carbonated drinks, the hydrostatic pressure is ~1% of
. Thus, to a good approximation:
In general, nucleation sites embedded within carbonated beverages are not spherical, nor are the seed bubbles that form within them. However, models of nucleation sites as cone-shaped cavities have indicated that bubbles contained therein can nucleate, grow, and detach if the radius of the cavity opening exceeds the critical radius. In such scenarios, Equation (5) is often used as a good approximation [
23,
25]. While the geometry of the nucleation sites on the surface of Mentos candies is not currently known, such a crevice-type model could serve as a starting point.
Using Equation (6), a critical radius of 0.5 μm can be estimated for the conditions typically found in a freshly opened carbonated beverage at room temperature ([CO
2] = 6 g L
−1,
= 0.072 N m
−1,
KH = 0.0336 mol kg
−1 bar
−1). Cavity openings on the Mentos surface that have a radius smaller than this would not be expected to support nucleation. On the other hand, crevice openings with a radius exceeding this critical radius would support bubble nucleation, growth, and production. Therefore, Mentos candies provide a catalyst for degassing because the size of their nucleation sites (2–7 μm) exceeds the critical radius. Rearrangement of Equation (6) has provided a basis for estimating the size of the nucleation sites in Mentos [
10]:
In this rearranged presentation, it is assumed that the crevices on the Mentos surface have a constant pore size (r). CO
2 concentrations that exceed the critical concentration, [CO
2*], support bubble growth in pores of this constant size. Estimates of [CO
2*] required to cause degassing on the surface of Mentos candies have come from observing Mentos- induced degassing rates in carbonated water at varying [CO
2]. In these experiments, the following Equation was used to fit the kinetics observed [
10]:
In the above Equation,
kcat is a kinetic constant and
K an equilibrium constant for the diffusion of CO
2 molecules into bubbles. In addition, in Equation (8) it is assumed that
when
. Equation (8) is derived from a simplified version of Brunauer–Emmett–Teller (BET) theory, an established theory that is useful for the analysis of gas adsorption in a multilayer fashion onto surfaces [
26,
27]. A modified version of this simplified version of BET theory is presented in the
Appendix A. In BET theory, gas molecules are envisioned to bind to surface receptor sites. Additional gas molecules may adhere to gas molecules already so adsorbed onto the surface sites. Thus, BET theory requires the consideration of two distinct events as when gases interact with surfaces: gas molecules adsorbing onto bare surface sites, and gas molecules adhering to each other. The simplified version of BET theory presented here assumes that during Type IV bubble nucleation all gas molecules diffuse into bubbles. As such, only one type of event needs to be considered: individual gas molecules entering bubbles. This simpler theory provides a novel basis for evaluating the critical CO
2 concentration that must be exceeded for a Type IV nucleation site with a radius large enough to support bubble growth, and to estimate the size of the nucleating site. This analysis has been used to ascertain that Mentos candies cause substantial degassing from water only when [CO
2] exceeds 1.8–2.2 g L
−1 at 25 °C [
27]. When substituted into Equation (6) as [CO
2*], these concentrations have allowed for the estimate that the pores on the Mentos candies are 2–7 μm in size [
10].
How beverage additives affect various physical properties of beverages, and fountain sizes, is not entirely clear. For example, it has been argued that beverage additives which lower surface tension might enhance fountain heights by lowering the activation energy for bubble formation [
3]. This suggestion contends that a lower activation energy to bubble formation might be induced by lower beverage surface tension, resulting in faster degassing kinetics and taller geysers. However, this proposal was based upon the assumption that bubbles form spontaneously within the bulk liquid of the beverage, when in fact carbonated beverages are generally agreed to degas via Type IV bubble nucleation at pre-existing cavities [
11,
12,
13,
14,
15,
16,
17,
18,
19,
20]. This hypothesis has further been called into question by the observation that certain beverage additives that
increase surface tension also increase fountain heights [
7]. Other physical parameters such as viscosity have been used to argue why diet sodas (lower viscosity) produce higher fountains than sugared sodas (higher viscosity) [
1,
5,
7]. Because ethanol lowers surface tension [
28] but increases viscosity [
29] when added to water, examining the Mentos-induced degassing of CO
2 from a mixture of water and ethanol could provide insight into the effects of beverage additives, beverage surface tension, and beverage viscosity on the Diet Coke and Mentos system.
To our knowledge, there exist no studies that explore the behavior of Mentos-induced degassing from alcoholic beverages. However, studies on bubble nucleation in Champagne [
13,
14,
15,
16,
17,
18,
19,
20] have shed much light on the various processes involved in the Diet Coke and Mentos system. This commonality suggests that illuminating mechanistic aspects of the Diet Coke and Mentos experiment could contribute to an understanding of various aspects of CO
2 degassing, foaming, and bubble formation in Champagne and other carbonated beverages. These issues have provided motivation for the present studies which examine the effect of ethanol addition on Mentos-induced CO
2 degassing from carbonated beverages and waters. The experiments presented here could also provide insights into similarities and differences in the characteristics of degassing behavior of alcoholic beverages vs. soft drinks.
2. Results
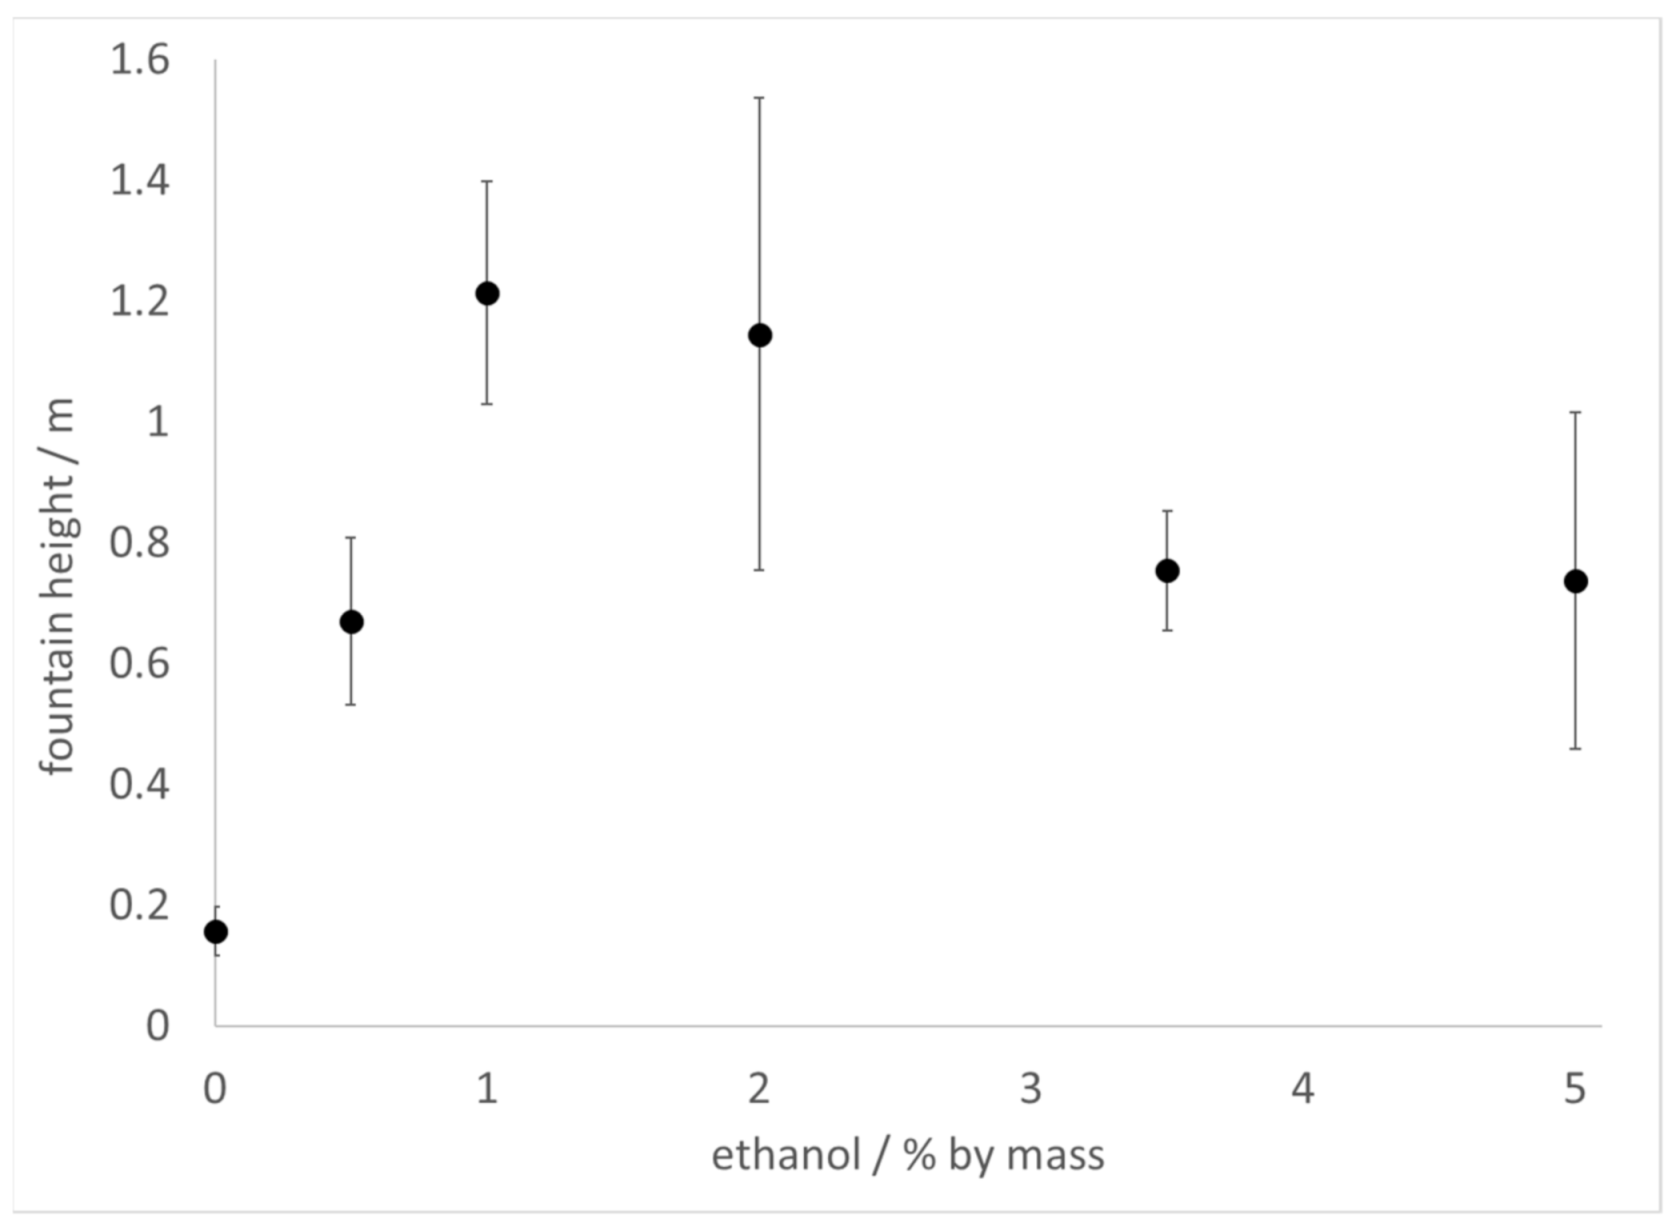
The Diet Coke and Mentos experiment was carried out with commercial 2 L bottles of Diet Coke or sparkling water (contains only carbonated water) prepared with increasing amounts of added ethanol by mass. In these experiments, 11 mint Mentos candies were added to each bottle, after opening, to initiate the reaction. In the samples of sparkling water to which ethanol was added, fountain heights reached as much as 6 times higher than control (no added ethanol), peaking at 1–2% ethanol, but decreasing to 3.5 times higher thereafter (
Figure 1). By comparison, fountain heights in samples of ethanol-treated Diet Coke decreased slightly at low ethanol concentrations, but then increased at higher ethanol concentrations (
Figure 2). Because surface tension decreases and viscosity increases with ethanol addition [
28,
29], these results demonstrate that neither the surface tension nor viscosity of a beverage can be linked to fountain heights in a straightforward manner. Furthermore, because alcoholic beverages generally contain ≥5% ethanol, these observations also suggest that CO
2 escapes faster from alcoholic beverages than from soft drinks during Type IV nucleation.
To further explore the effect of ethanol on the kinetics of CO
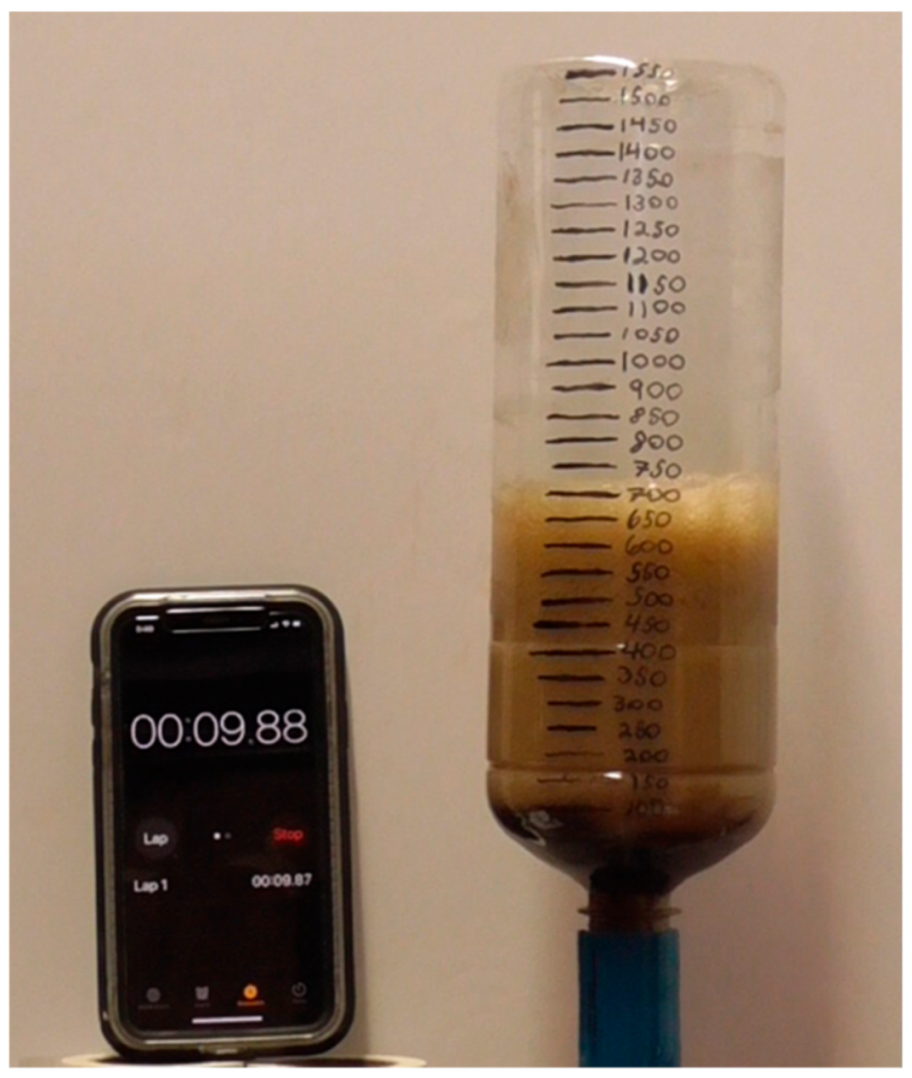
2 release in the Diet Coke and Mentos experiment, the kinetics of foam production was monitored at varying ethanol concentrations (
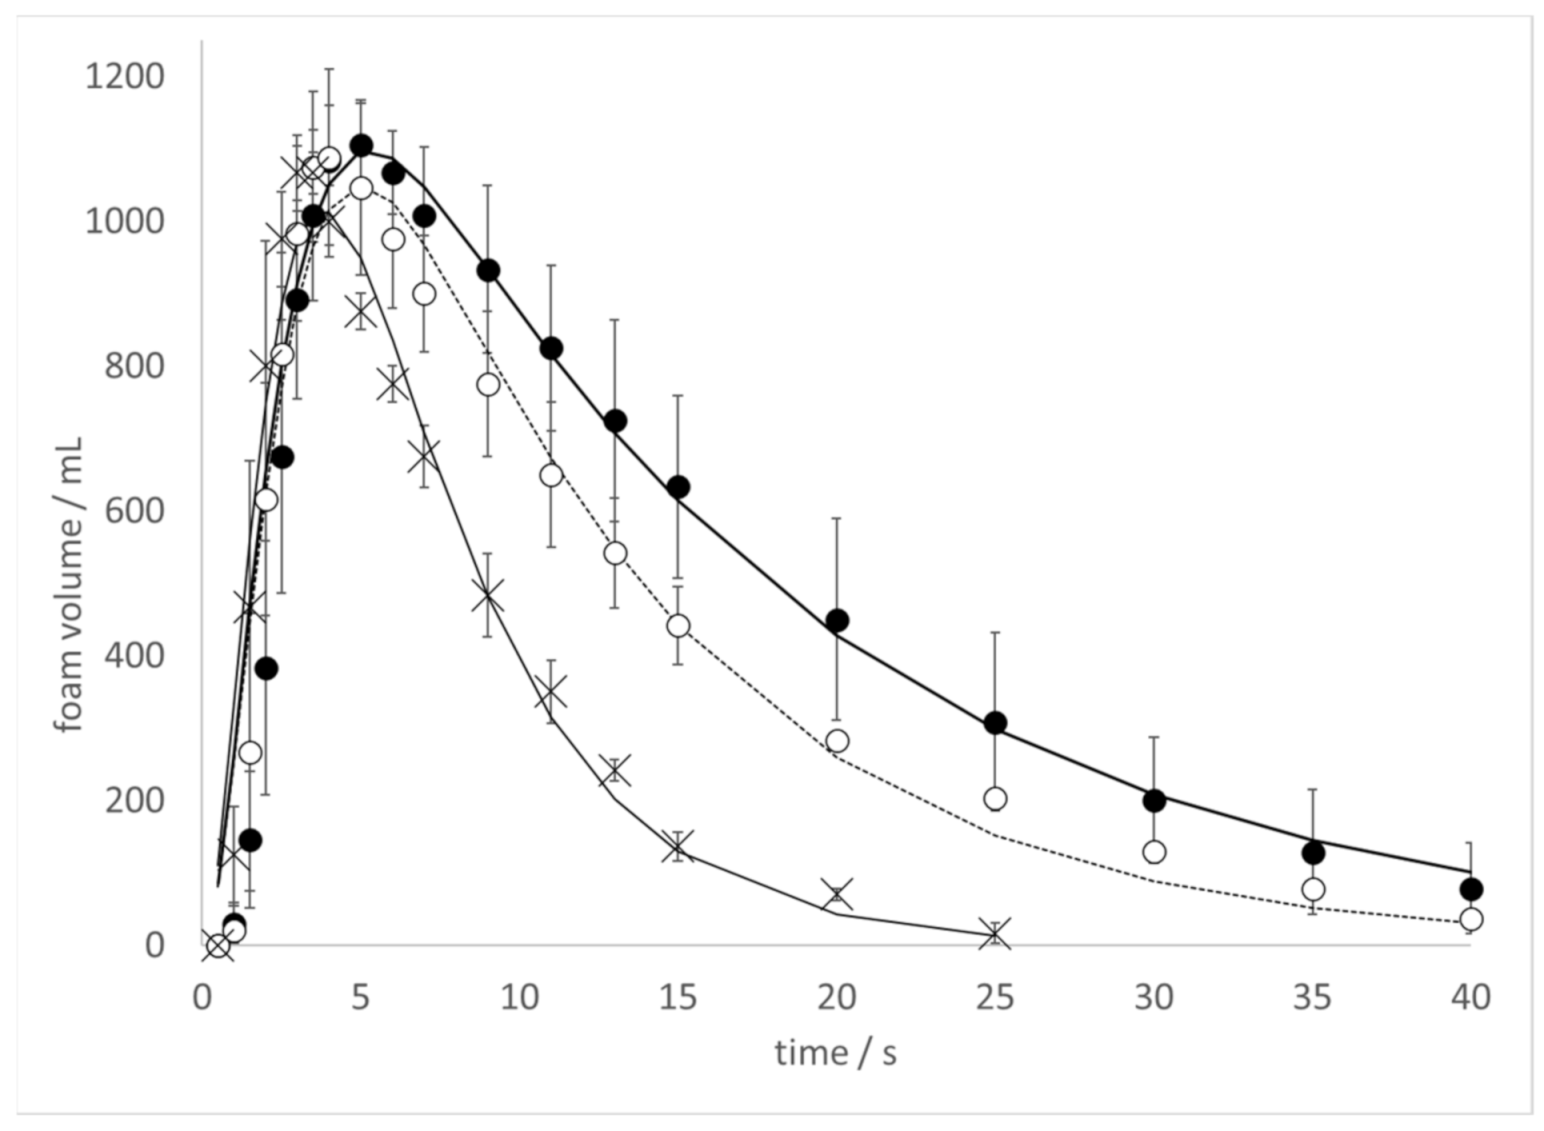
Figure 3). In these experiments, 500 mL bottles of Diet Coke to which increasing amounts of ethanol were added had 1 min Mentos candy added to it, and the time-dependent foam produced was observed. Foam production was observed to occur more rapidly with increasing ethanol concentrations.
The foam volume peaked at about 5 s at 0% ethanol (
Figure 3, closed circles), 4 s at 0.5% ethanol (
Figure 3 open circles), and 3 s at 5% ethanol (
Figure 3, closed triangles). A similar trend was observed in samples treated with 1%, 2%, and 3.5% ethanol (data in
supplementary material). Furthermore, foam decay was observed to occur more rapidly at increasing ethanol concentrations. The kinetic foam data were fit to the following Equation as described previously [
9]:
In Equation (9),
Y is the volume of foam produced,
Ymax indicates the maximum amount of foam that could be produced in the absence of foam decay,
t is time, and the
ki’s are kinetic constants for the following sequential, multistep, irreversible reactions:
In all cases, R
2 values of ≥ 0.96 were achieved (
Table 1). Because the foam exhibited much turbulence over the first 1–3 s of data collection, the kinetic parameters
k1 and
k2 (both associated with foam production) could not be resolved. Thus, the values for these parameters consistently matched to within 0.1% of each other in each fit. Nevertheless, the numerical value of these kinetic parameters provides some quantitative insight into the rate of foam production. While not a perfect trend, higher values for
k1 and
k2 required for the data fits tended to increase at higher ethanol concentrations (
Table 1). This observation is consistent with the faster foam production observed with increasing ethanol concentration (
Figure 3). Furthermore, a solid trend of larger values for
k3 (associated with foam decay) at higher ethanol concentrations was observed (
Table 1), in accord with faster foam decay observed at increasing ethanol concentrations (
Figure 3).
To further probe the effect of the presence of ethanol on Mentos-induced degassing from carbonated solutions, CO
2 degassing kinetics caused by Mentos addition was monitored in solutions containing 5% ethanol in water at increasing concentrations of CO
2. These experiments were also motivated by a previous report [
10] that measured CO
2 degassing rates from carbonated water alone. In this previously reported experiment, a plot of the rate of degassing vs. [CO
2] was used to find [CO
2*], which was then substituted into Equation (7) to find putative pore sizes of sites that nucleate bubbles on the Mentos candies. When Mentos were added to 5% solutions of ethanol at increasing [CO
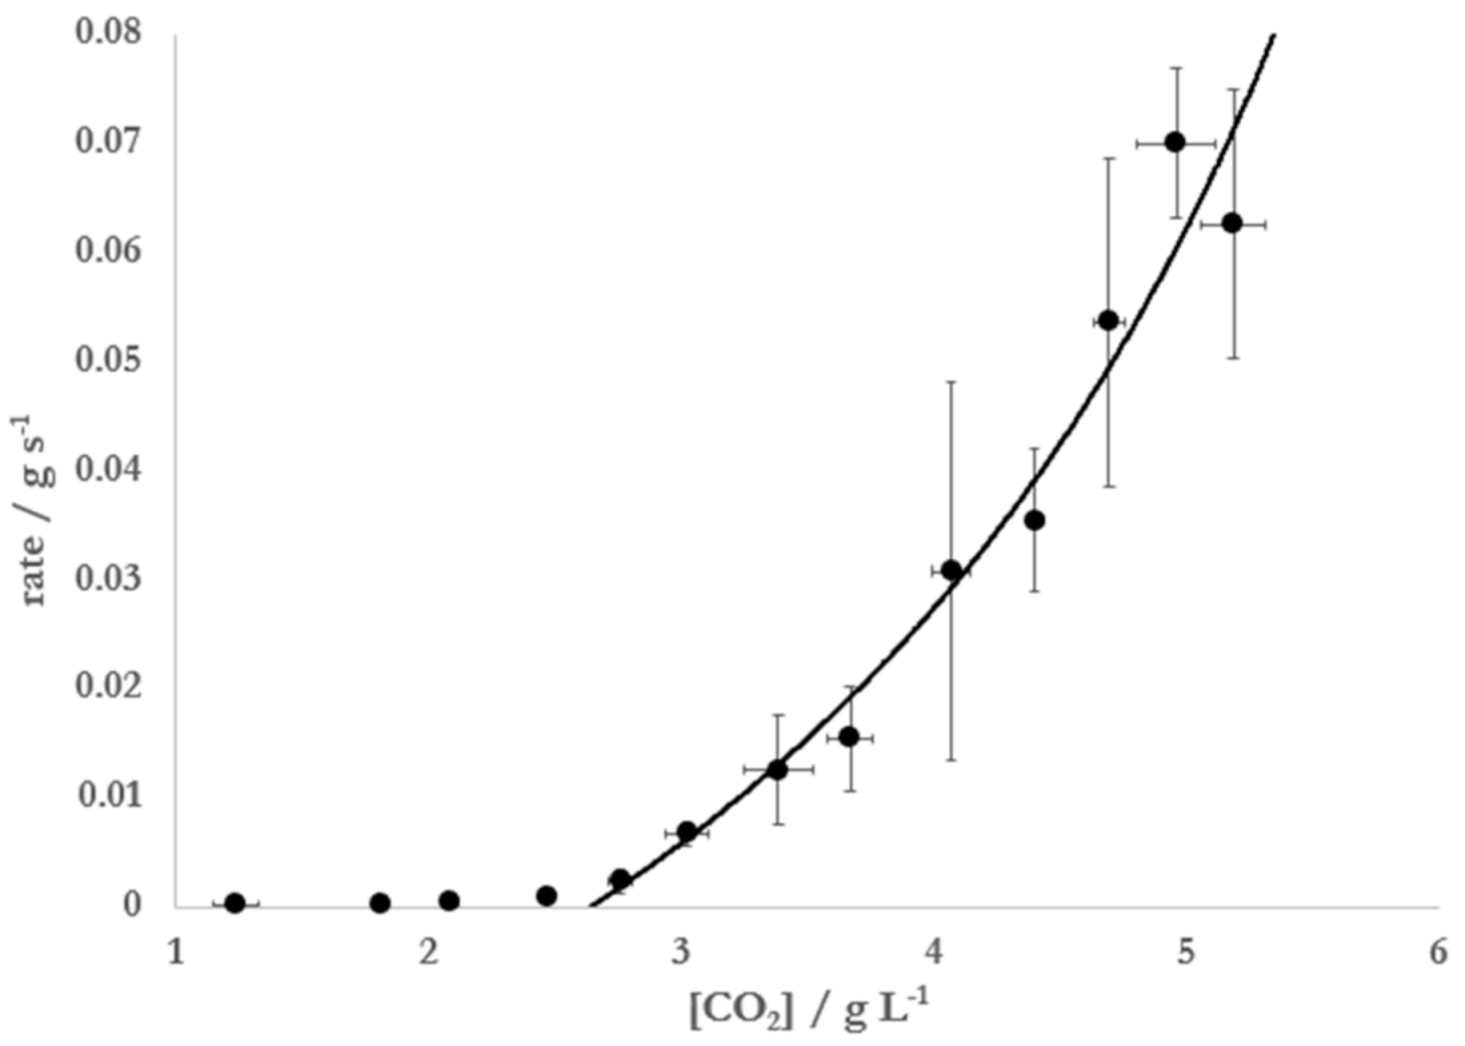
2], substantial degassing was only observed at concentrations higher than ~2.7 g L
−1 (
Figure 4).
The data were best fit (R
2 = 0.99) to Equation (8) using [CO
2*] = 2.65 ± 0.15 g L
−1,
kcat = 0.085 ± 0.009 g s
−1, and
K = 0.58 ± 0.01. Substitution of this critical concentration, the surface tension of 5% ethanol at 20 °C (
γ = 0.056 N m
−1 [
28]), the recorded atmospheric pressure (P
ATM = 0.975 bar), and the Henry’s Law constant for CO
2 in a 5% solution of ethanol at 20 °C (
= 0.0382 mol kg
−1 bar
−1) into Equation (8) yielded an estimated radius of 1.9 ± 0.3 μm, in agreement with previously reported estimates for the size of nucleation sites on the surface of Mentos candies [
10].
Figure 4 illustrates that the Mentos-induced rate of degassing from carbonated, ethanolic solutions approaches zero as [CO
2] approaches [CO
2*]. Consistent with the data in
Figure 4, the degassing from such solutions initially prepared at [CO
2] >> [CO
2*] were observed to degas rapidly at first but slow considerably over time (
Figure 5). Based on this observation, it was hypothesized that [CO
2*] could be determined by analyzing kinetic degassing data collected during a single run. This was attempted by first noting that Equation (8) can be linearized by taking its reciprocal:
with
. From Equation (11) it can be seen that a plot of 1/rate vs. 1/(
should yield a straight line with a slope of 1/
kcatK and an intercept of −1/
kcat.
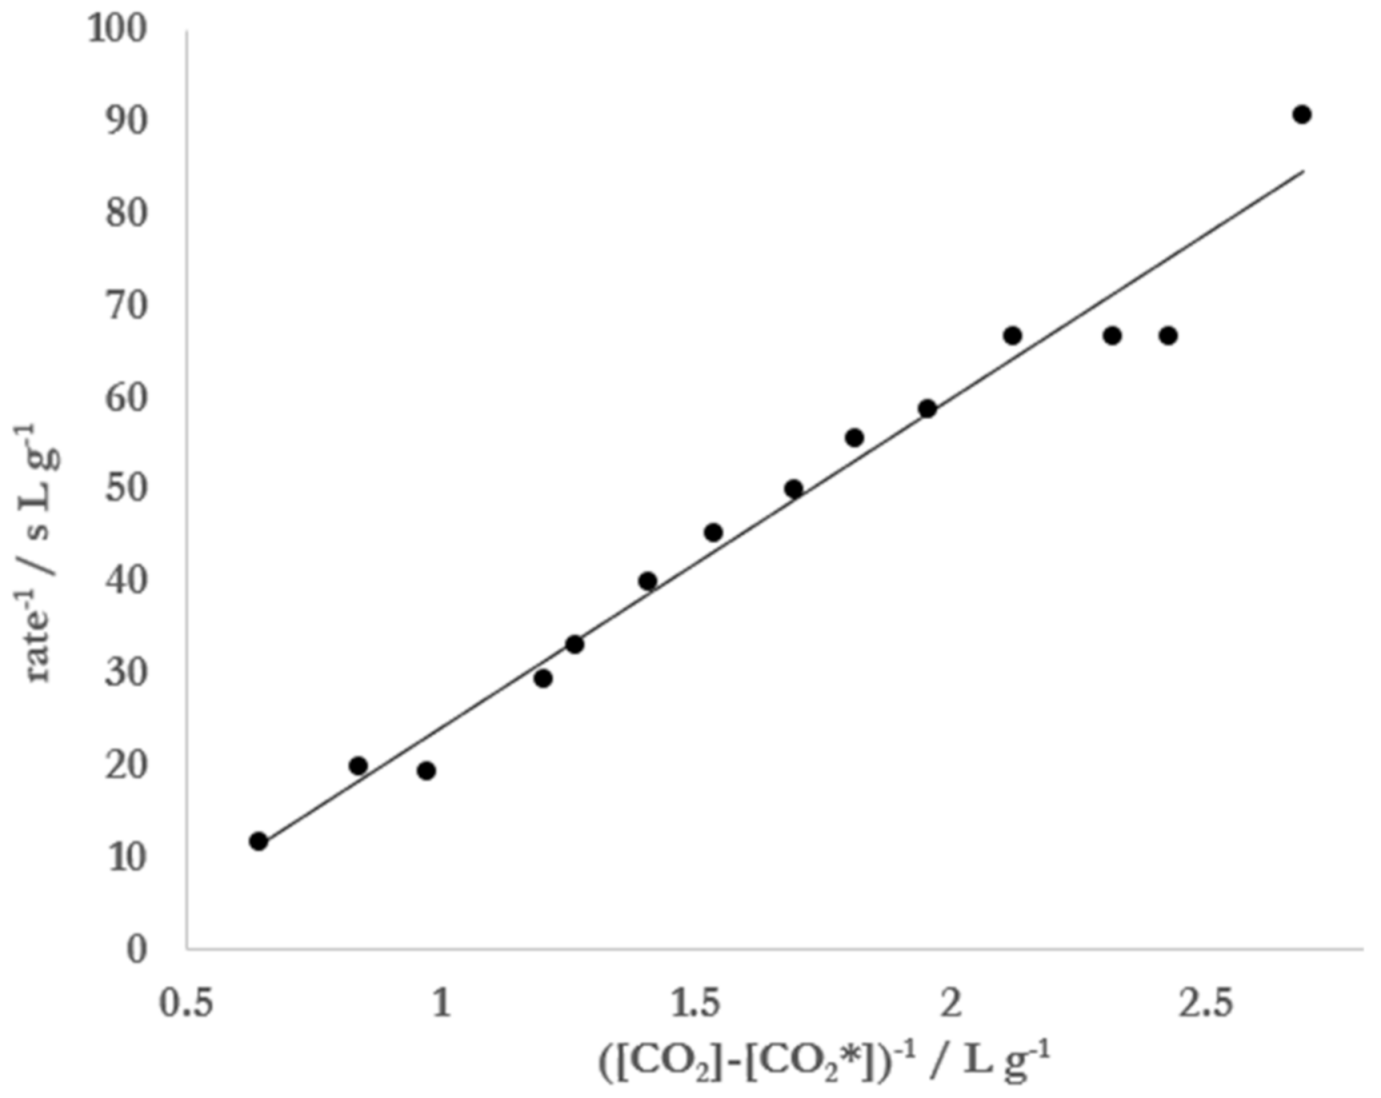
In this analysis, it was found that a best line of fit to the data could be achieved by varying [CO
2*] until R
2 was maximized. When the data displayed in
Figure 5 were treated in this manner, the best linear fit (R
2 = 0.97) was achieved when [CO
2*] = 2.77 g L
−1 (
Figure 6). Substitution of this concentration and appropriate parameters for the conditions under which the experiment was conducted into Equation (8) resulted in a radius of 1.7 μm. The value of
kcat = 0.087 g L
−1 s
−1 was obtained using the intercept of the linear fit and
K = 0.32 L g
−1 from a combination of the slope and intercept. This experiment was repeated 5 times under the same conditions of temperature (20 °C) and atmospheric pressure (0.992 bar), yielding an average critical CO
2 concentration of 2.7 ± 0.1 g L
−1 and an average radius of 1.9 ± 0.2 μm. The same analysis applied to degassing experiments with 5 separate runs of carbonated water (no ethanol) yielded averages of [CO
2*] = 3.2 ± 0.4 g L
−1 and r = 1.8 ± 0.7 μm.
3. Discussion
Differences in the physical properties of beverages have been offered as clues to explain why certain beverages produce higher fountains in the Diet Coke and Mentos experiment [
1,
3,
5,
7]. It has been claimed that diet sodas generate taller geysers than sugared sodas on account of the lower surface tension [
3] or higher viscosity [
1,
5,
7] of the former as compared to the latter. In the experiments presented here, it was observed that addition of ethanol to seltzer water increased fountain height (
Figure 1). It was also observed that high concentrations of ethanol added to Diet Coke increased fountain heights (
Figure 2). However, the viscosity of ethanol–water mixtures is higher than that of water [
29]. These observations conflict with the hypothesis that beverages with lower viscosity should always outperform beverages of higher viscosity in this experiment.
It could be argued that the lower surface tension [
28] imparted by ethanol addition accounts for the observed difference in heights (
Figure 1 and
Figure 2). However, fountain heights in seltzer water treated with 1–2% ethanol were higher than those observed at 3.5–5% ethanol (
Figure 1), the latter of which have lower surface tension than the former. In addition, small amounts of ethanol (0.5–1%) added to Diet Coke slightly lowered the fountain height relative to control (
Figure 2). Thus, beverages with lower surface tension do not always produce higher fountains than beverages with higher surface tension.
It is certainly the case that both surface tension and viscosity affect bubble nucleation in carbonated beverages [
1,
7,
9,
10,
11,
12,
13,
14,
15,
16,
17,
18,
19,
20]. It could be that the tandem of increased viscosity and decreased surface tension that accompanies ethanol addition results in competing effects with respect to fountain heights. This scenario would be consistent with fountain heights reaching a maximum at a particular ethanol concentration and decreasing thereafter, such as is observed in
Figure 1. On the other hand, an opposite effect is observed in samples of Diet Coke treated with ethanol: fountain heights reach a minimum at a low ethanol concentration and increase at higher concentrations (
Figure 2). The many additives in the Diet Coke likely account for this difference. Indeed, it has been noted that beverage additives impact the degree of foaming and bubble coalescence [
7] in carbonated drinks, all of which could impact fountain heights. Finally, it could be that the presence of ethanol influences interactions between the beverage and the surface of the Mentos. For example, the presence of ethanol could increase the dissolution rate of some candy ingredients that might act as surfactants and enhance the kinetics of foam production. While previous studies have indicated that some ingredients in Mentos (gum Arabic and gelatin) have no effect on foaming ability [
9], other ingredients in the candy could potentially play a role.
Nevertheless, the experiments presented here demonstrate that simple relationships between surface tension or viscosity and fountain heights may be difficult to establish in varied and complex beverage mixtures. Consistent with this, it has been demonstrated that beverage viscosity cannot be related to the diffusion coefficient of CO
2 in various carbonated drinks and sodas in a straightforward manner [
30]. Commercial sodas certainly contain a wide variety of solutes that could impact the degree to which foaming and fountaining occurs in a variety of ways. Thus, many aspects of the relationships between beverage viscosity, beverage surface tension, beverage additives and fountain heights in the Diet Coke and Mentos experiment still need to be explored. For now, it appears that differences in viscosity and surface tension might not sufficiently explain why diet sodas tend to form taller geysers than sugared sodas. The difference in fountain heights between diet and sugared sodas remains an open question.
Another impact of ethanol addition appears to involve faster foam generation and decay (
Figure 3). Larger values of
k1 and
k2 were required to fit the data at higher ethanol concentration (
Table 1). In addition, the kinetic constant
k3, which is associated with the rate of foam decay, was noted to increase with ethanol concentration. These results once again imply that ethanol addition can impact fountain heights in competing ways. Faster foam generation is likely to be associated with rapid degassing kinetics and higher fountains. However, faster foam decay necessarily makes it more difficult to achieve large foam volumes, and may contribute to smaller fountain heights. One should be cautious when interpreting the results of these foam generation experiments (
Figure 3) as being directly applicable to geyser heights observed in the original Diet Coke and Mentos experiment (
Figure 1 and
Figure 2). Nevertheless, these results suggest that exploring aspects of the stability of the foam generated (
Figure 3) might provide insight into the heights that can be achieved in the classic experiment (
Figure 1 and
Figure 2).
To our knowledge, the simplified version of BET theory presented herein is a novel approach in analyzing the kinetics of Type IV bubble nucleation in carbonated beverages. In the experiments presented here, Equation (8) was used to analyze Mentos-induced degassing from carbonated aqueous solutions of 5% ethanol (
Figure 4). The data collected and resulting fit allowed for an estimation of 1.9 ± 0.3 μm for the size of the nucleation sites on Mentos candies. Equation (8) was also linearized, which allowed for data from single degassing runs to be collected (
Figure 5) and analyzed (
Figure 6, Equation (11)). Application of this method of data collection and analysis on solutions of 5% ethanol yielded an estimation of 1.9 ± 0.2 μm for the size of nucleation sites on Mentos candies. An estimate of 1.8 ± 0.7 μm was also obtained from similar experiments conducted on solutions of carbonated water alone. These estimations for the radius of nucleating bubbles on the Mentos candies reported here were determined from experiments on liquids with quite different surface tensions and two different methods of analysis. Even so, the estimations are consistent with each other and with a previous report [
10]. Interestingly, the estimates reported here are quite close to the dimensions reported for sites (0.6–2.3 μm) embedded in fibers that cause bubble nucleation in Champagne [
13]. This general agreement suggests that the theory presented here could be useful in exploring Type IV degassing behavior induced by other nucleating surfaces, beverages, and solutions. These methods might also prove useful in exploring the effect that various beverage additives or mixtures of additives have on characteristics of bubble nucleation.
Results from previously reported studies conducted on bubbles in Champagne and beer [
16,
17,
18,
19] can be combined with results reported herein to make a rough prediction of the number of nucleation sites on the surface of a Mentos candy. Mentos-induced degassing of 500 mL of a Diet Coke to which ethanol was added completed in ~10 s (
Figure 3). Carbonated sodas contain about ~6.0 g CO
2 L
−1, which is degassed by Mentos to a critical concentration of ~2.5 g L
−1 in the presence of ethanol (
Figure 3). The difference in these two concentrations is 3.5 g L
−1, which translates to 1.75 g of CO
2 lost from 500 mL of beverage. Using the ideal gas law, it can be shown that 1.75 g of CO
2 corresponds to about 1 L of gaseous CO
2 at ambient temperature and pressure. It has been noted that the flux of CO
2 from a carbonated beverage is given by [
16,
17]:
where
V is the volume of CO
2 escaping from a beverage,
N is the number of nucleation sites inducing degassing,
f is the frequency at which active nucleation sites produce bubbles, and
v is the volume of an individual bubble that reaches the surface. We first take
= 1 L per 10 s. Next,
v in ethanol-treated Diet Coke bubbles is assumed to be the same as in Champagne (0.065 mm
3) [
18,
19], and
f for nucleation sites on Mentos to be the same as for alcoholic carbonated beverages (5–30 bubbles per second) [
15,
18]. Substitution of these parameters into Equation (12) results in 50,000–300,000 nucleating sites on the surface of a Mentos candy. This is substantially lower than the estimate of roughly 5–60 million pores outlined in the introduction. This discrepancy could partially be resolved by noting that the surface of the Mentos candy is not uniform, but rather contains both rough and smooth areas [
8]. If the smooth areas on the surface do not contain nucleation sites, then the estimate of millions of sites could be 2–4 times too high. It could also be the case that not all pores are capable of nucleating bubbles, or that pores near one another inhibit the frequency of bubble production. Finally, there is also the issue of the candy dissolving in the beverage, which could reduce the number and sizes of sites. Regardless, further experimentation is necessary to resolve this issue.
The estimated radius of nucleating bubbles on the surface of the Mentos was not affected by the presence of ethanol. Thus, it is very likely the same types and sizes of pores on the surface of the Mentos are responsible for nucleating bubbles in both liquids. On the other hand, the critical CO
2 concentration for degassing from water was consistently found to be ~0.5 g L
−1 higher in water than in 5% ethanol. This observation is consistent with Equation (7), which assures that higher CO
2 concentrations are required for degassing from liquids with higher surface tension. Further investigations could provide insight into whether it is generally true that higher critical CO
2 concentrations correspond to liquids with higher surface tension. Because outgassing slows considerably as the CO
2 concentration in a beverage approaches [CO
2*] [
18,
19], the rate of degassing is likely to abate more quickly in beverages that display higher [CO
2*]. Consistent with this, faster degassing kinetics (
Figure 3,
Table 1) and higher fountains (
Figure 1 and
Figure 2) are associated with increasing ethanol concentration. Further, a comparison of the critical concentrations found for Mentos-induced degassing from water (3.0 g L
−1) and 5% ethanol (2.5 g L
−1) indicate that an extra 0.5 g of CO
2 are available per liter for degassing from 5% ethanol as compared to water (carbonated soft drinks generally contain ~6.0 g of CO
2 per L). Beverages with lower [CO
2*] have more available CO
2 to degas, promoting faster kinetics and higher fountains. These factors could contribute to an explanation of the higher fountains observed in ethanol-containing samples as compared to their controls.
