
Combined Effects of Methyldopa and Flavonoids on the Expression of Selected Factors Related to Inflammatory Processes and Vascular Diseases in Human Placenta Cells—An In Vitro Study


 ,
,  ,
,  ,
,  ,
,  and
and
Abstract
1. Introduction
2. Results
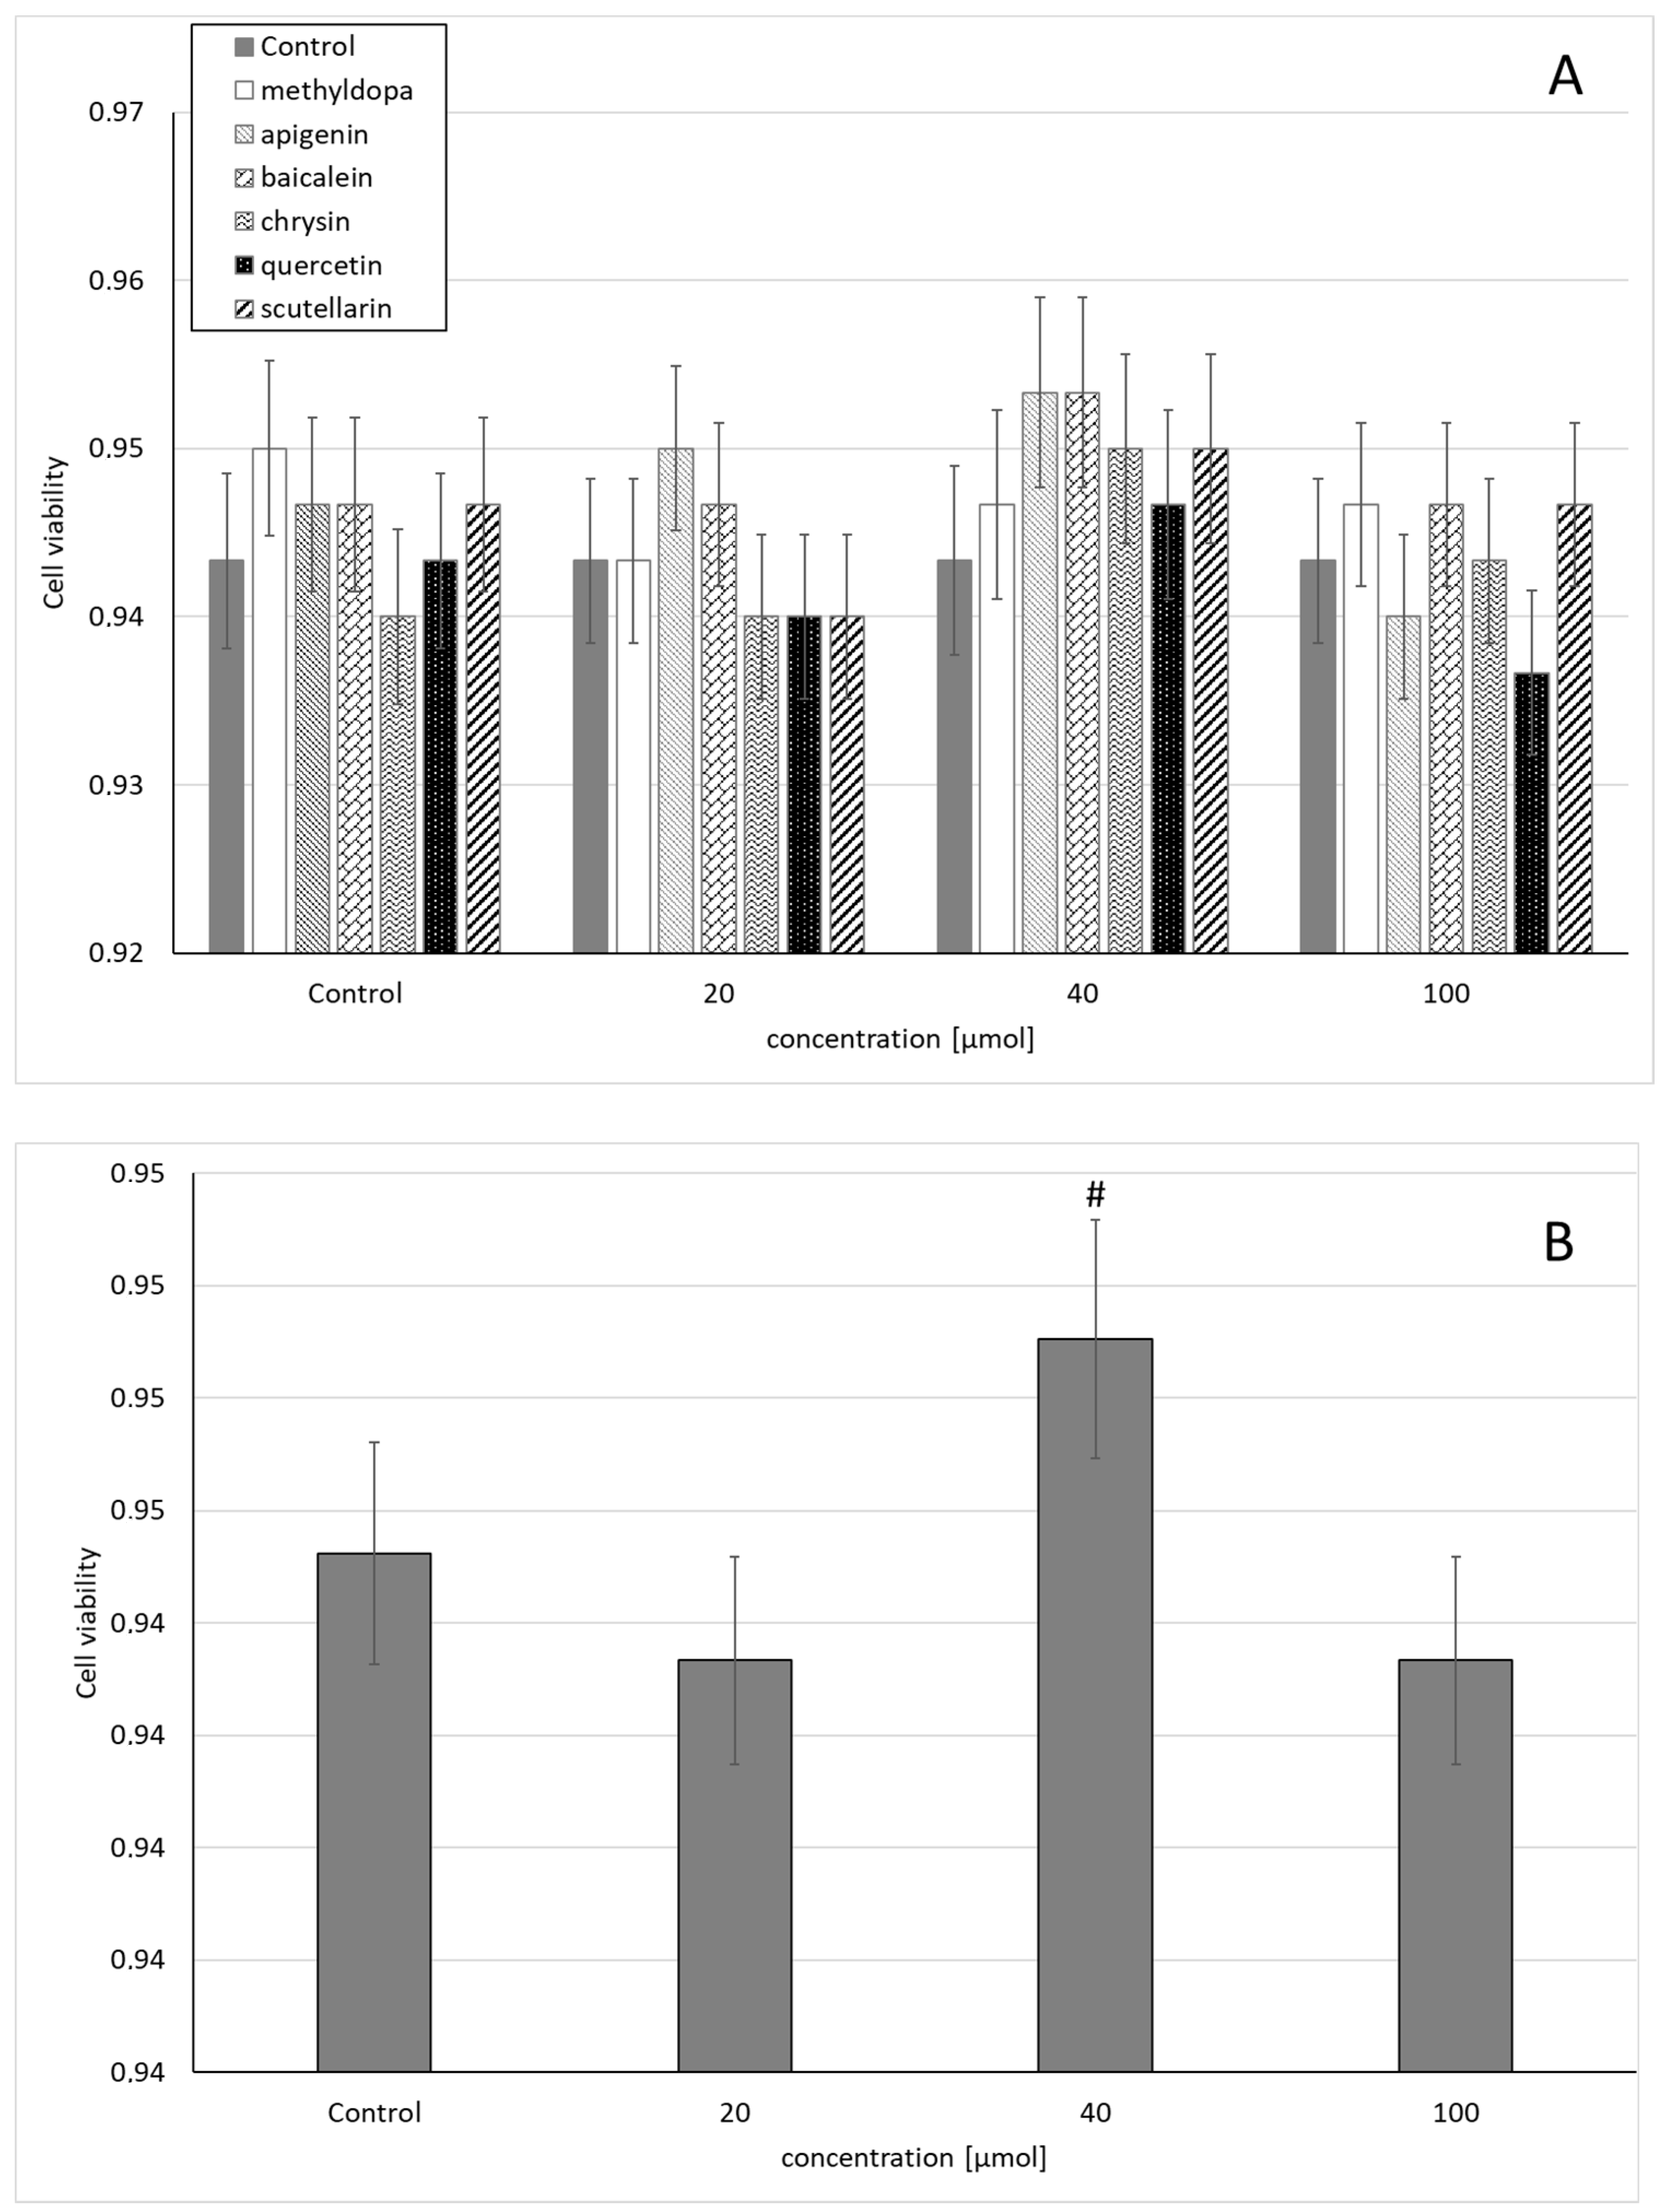
2.1. Cell Viability
2.2. TNF-Alpha
2.2.1. Studies Conducted on Human Trophoblasts of JEG-3 Cells
2.2.2. Studies Carried Out on Human Umbilical Vein Endothelial Cells (HUVEC)
2.3. IL-1Beta
2.3.1. Studies Conducted on Human Trophoblasts of JEG-3 Cells
2.3.2. Studies Carried Out on Human Umbilical Vein Endothelial Cells (HUVEC)
2.4. IL-6
2.4.1. Studies Conducted on Human Trophoblasts of JEG-3 Cells
2.4.2. Studies Carried Out on Human Umbilical Vein Endothelial Cells (HUVEC)
2.5. TGF-β
2.5.1. Studies Conducted on Human Trophoblasts of JEG-3 Cells
2.5.2. Studies Carried Out on Human Umbilical Vein Endothelial Cells (HUVEC)
2.6. VEGF
2.6.1. Studies Conducted on Human Trophoblasts of JEG-3 Cells
2.6.2. Studies Carried Out on Human Umbilical Vein Endothelial Cells (HUVEC)
2.7. PIGF
2.7.1. Studies Conducted on Human Trophoblasts of JEG-3 Cells
2.7.2. Studies Carried Out on Human Umbilical Vein Endothelial Cells (HUVEC)
2.8. HIF-1
2.8.1. Studies Conducted on Human Trophoblasts of JEG-3 Cells
2.8.2. Studies Carried Out on Human Umbilical Vein Endothelial Cells (HUVEC)
3. Discussion
4. Materials and Methods
4.1. Materials
4.2. Cell Lines and Culture Conditions
4.3. Expression Analysis
4.4. ELISA
5. Statistical Analysis
Author Contributions
Funding
Institutional Review Board Statement
Informed Consent Statement
Data Availability Statement
Conflicts of Interest
Sample Availability
Abbreviations
| ACE | angiotensin-converting enzyme |
| AT1 | II receptor |
| DMSO | dimethyl sulfoxide |
| eNOS | endothelial nitric oxide synthase |
| GAPDH | glyceraldehyde 3-phosphate dehydrogenase |
| HIF1α | hypoxia-inducible factor 1α |
| HUVEC | human umbilical vein endothelial cells |
| IL1β | interleukin-1β |
| IL6 | interleukin 6 |
| JEG-3 cells | trophoblast-derived human choriocarcinoma cells |
| mRNA | messenger RNA |
| MTT | 3-(4,5-dimethylthiazol-2-yl)-2,5-diphenyltetrazolium bromide |
| PCR | polymerase chain reaction |
| PIH | pregnancy-induced hypertension |
| PIGF | placental growth factor |
| qPCR | quantitative polymerase chain reaction |
| qRT-PCR | quantitative reverse transcription polymerase chain reaction |
| TGF-β | transforming growth factor β |
| TNF-α | tumor necrosis factor α |
| VEGF | vascular endothelial growth factor |
| ACE | angiotensin-converting enzyme |
| AT1 | II receptor |
| DMSO | dimethyl sulfoxide |
| eNOS | endothelial nitric oxide synthase |
References
- Tinawi, M. Hypertension in pregnancy. Arch. Intern. Med. Res. 2020, 3, 10–17. [Google Scholar] [CrossRef]
- Ożarowski, M.; Mikołajczak, P.Ł.; Kujawski, R.; Wielgus, K.; Klejewski, A.; Wolski, H.; Seremak-Mrozikiewicz, A. Pharmacological effect of quercetin in hypertension and its potential application in pregnancy-induced hypertension: Review of in vitro, in vivo, and clinical studies. Evid. Based Complement. Alternat. Med. 2018, 2018, 1–19. [Google Scholar] [CrossRef] [PubMed]
- Duley, L. The global impact of pre-eclampsia and eclampsia. Semin. Perinatol. 2009, 33, 130–137. [Google Scholar] [CrossRef]
- Sánchez-Aranguren, L.C.; Prada, C.E.; Riaño-Medina, C.E.; Lopez, M. Endothelial dysfunction and preeclampsia: Role of oxidative stress. Front. Physiol. 2014, 5, 372. [Google Scholar] [CrossRef]
- Rana, S.; Lemoine, E.; Granger, J.P.; Karumanchi, S.A. Preeclampsia: Pathophysiology, challenges, and perspectives. Circ. Res. 2019, 124, 1094–1112. [Google Scholar] [CrossRef]
- Karumanchi, S.A. Angiogenic factors in preeclampsia: From diagnosis to therapy. Hypertension 2016, 67, 1072–1079. [Google Scholar] [CrossRef]
- Roberts, J.M.; Hubel, C.A. The two stage model of preeclampsia: Variations on the theme. Placenta 2009, 30, S32–S37. [Google Scholar] [CrossRef]
- Lam, C.; Lim, K.H.; Karumanchi, S.A. Circulating angiogenic factors in the pathogenesis and prediction of preeclampsia. Hypertension 2005, 46, 1077–1085. [Google Scholar] [CrossRef] [PubMed]
- Myatt, L.; Webster, R.P. Vascular biology of preeclampsia. J. Thromb. Haemost. 2009, 7, 375–384. [Google Scholar] [CrossRef] [PubMed]
- Zhou, Y.; McMaster, M.; Woo, K.; Janatpour, M.; Perry, J.; Karpanen, T.; Alitalo, K.; Damsky, C.; Fisher, S.J. Vascular endothelial growth factor ligands and receptors that regulate human cytotrophoblast survival are dysregulated in severe preeclampsia and hemolysis, elevated liver enzymes, and low platelets syndrome. Am. J. Pathol. 2002, 160, 1405–1423. [Google Scholar] [CrossRef]
- Liberis, A.; Stanulov, G.; Ali, C.E.; Hassan, A.; Pagalos, A.; Kontomanolis, E.N. Pre-eclampsia and the vascular endothelial growth factor: A new aspect. Clin. Exp. Obstet.Gynecol. 2016, 43, 9–13. [Google Scholar] [PubMed]
- Cornelius, D.C. Preeclampsia: From inflammation to immunoregulation. Clin. Med. Insights Blood Disord. 2018, 11, 1–6. [Google Scholar] [CrossRef]
- Perucci, L.O.; Corrêa, M.D.; Dusse, L.M.; Gomes, K.B.; Sousa, L.P. Resolution of inflammation pathways in preeclampsia—A narrative review. Immunol. Res. 2017, 65, 774–789. [Google Scholar] [CrossRef]
- Schaefer, C.; Peters, P.; Miller, R.K. Drugs during Pregnancy and Lactation. Treatment Options and Risk Assessment; Elsevier: Oxford, UK, 2007. [Google Scholar]
- Cooper, W.O.; Hernandez-Diaz, S.; Arbogast, P.G.; Dudley, J.A.; Dyer, S.; Gideon, P.S.; Hall, K.; Ray, W.A. Major congenital malformations after first-trimester exposure to ACE inhibitors. N. Engl. J. Med. 2006, 354, 2443–2451. [Google Scholar] [CrossRef]
- Seremak-Mrozikiewicz, A.; Drews, K. Methyldopa in therapy of hypertension in pregnant women. Ginekol. Pol. 2004, 75, 160–165. [Google Scholar]
- Picaud, A.; Walter, P.; de Preville, G.; Nicolas, P. Fatal toxic hepatitis in pregnancy. A discuss the role of methyldopa. J. Gynecol. Obstet. Biol. Reprod. (Paris) 1990, 19, 192–196. [Google Scholar]
- Lowe, S.A.; Rubin, P.C. The pharmacological management of hypertension in pregnancy. J. Hypertens. 1992, 10, 201–207. [Google Scholar] [CrossRef]
- Sibai, B.M. Treatment of hypertension in pregnant women. N. Engl. J. Med. 1996, 335, 257–265. [Google Scholar] [CrossRef] [PubMed]
- Caton, A.R.; Bell, E.M.; Druschel, C.M.; Werler, M.M.; Lin, A.E.; Browne, M.L.; McNutt, L.A.; Romitti, P.A.; Mitchell, A.A.; Olney, R.S.; et al. National birth defects prevention study. Antihypertensive medication use during pregnancy and the risk of cardiovascular malformations. Hypertension 2009, 54, 63–70. [Google Scholar] [CrossRef]
- Xie, R.H.; Guo, Y.; Krewski, D.; Mattison, D.; Nerenberg, K.; Walker, M.C.; Wen, S.W. Trends in using β-blockers and methyldopa for hypertensive disorders during pregnancy in a Canadian population. Eur. J. Obstet. Gynecol. Reprod. Biol. 2013, 171, 281–285. [Google Scholar] [CrossRef] [PubMed]
- Adrover, R. Hepatotoxicity from alfa-methyldopa during pregnancy: Two case reports. J. Clin. Gastroenterol. Treat. 2016, 2, 1–3. [Google Scholar] [CrossRef]
- Aldomet (Methyldopa) Side Effects. Available online: https://www.rxlist.com/aldomet-side-effects-drug-center.htm (accessed on 26 February 2021).
- Smith, D.K.; Lennon, R.P.; Carlsgaard, P.B. Managing hypertension using combination therapy. Am. Fam. Physician 2020, 101, 341–349. [Google Scholar] [PubMed]
- Singh, P.; Mishra, A.; Goswami, S.; Singh, A.; Tiwari, K.D. Hypertension and herbal plant for its treatment: A review. Indian, J. Res. Pharm. Biotech. 2015, 3, 358–366. [Google Scholar]
- Adamczak, A.; Ożarowski, M.; Karpiński, T.M. Antibacterial activity of some flavonoids and organic acids widely distributed in plants. J. Clin. Med. 2019, 9, 109. [Google Scholar] [CrossRef] [PubMed]
- Roy, M.K.; Nakahara, K.; Na, T.V.; Trakoontivakorn, G.; Takenaka, M.; Isobe, S.; Tsushida, T. Baicalein, a flavonoid extracted from a methanolic extract of Oroxylum indicum inhibits proliferation of a cancer cell line in vitro via induction of apoptosis. Pharmazie 2007, 62, 149–153. [Google Scholar]
- Fujita, M.; Shiota, S.; Kuroda, T.; Hatano, T.; Yoshida, T.; Mizushima, T.; Tsuchiya, T. Remarkable synergies between baicalein and tetracycline, and baicalein and β-lactams against methicillin-resistant Staphylococcus aureus. Microbiol. Immunol. 2005, 49, 391–396. [Google Scholar] [CrossRef]
- He, S.; Dong, X.; Zhang, G.; Fan, W.; Duan, S.; Shi, H.; Li, D.; Li, R.; Chen, G.; Long, G.; et al. High quality genome of Erigeron breviscapus provides a reference for herbal plants in Asteraceae. Mol. Ecol. Resour. 2021, 21, 153–169. [Google Scholar] [CrossRef] [PubMed]
- Anand David, A.V.; Arulmoli, R.; Parasuraman, S. Overviews of Biological Importance of Quercetin: A Bioactive Flavonoid. Pharmacogn. Rev. 2016, 10, 84–89. [Google Scholar] [CrossRef]
- Salehi, B.; Venditti, A.; Sharifi-Rad, M.; Kręgiel, D.; Sharifi-Rad, J.; Durazzo, A.; Lucarini, M.; Santini, A.; Souto, E.B.; Novellino, E.; et al. The Therapeutic Potential of Apigenin. Int. J. Mol. Sci. 2019, 20, 1305. [Google Scholar] [CrossRef] [PubMed]
- Mani, R.; Natesan, V. Chrysin: Sources, beneficial pharmacological activities, and molecular mechanism of action. Phytochemistry 2018, 145, 187–196. [Google Scholar] [CrossRef] [PubMed]
- Fang, P.; Yu, M.; Shi, M.; Bo, P.; Gu, X.; Zhang, Z. Baicalin and its aglycone: A novel approach for treatment of metabolic disorders. Pharmacol. Rep. 2020, 72, 13–23. [Google Scholar] [CrossRef] [PubMed]
- Li, Y.; Song, K.; Zhang, H.; Yuan, M.; An, N.; Wei, Y.; Wang, L.; Sun, Y.; Xing, Y.; Gao, Y. Anti-inflammatory and immunomodulatory effects of baicalin in cerebrovascular and neurological disorders. Brain Res. Bull. 2020, 164, 314–324. [Google Scholar] [CrossRef]
- Chledzik, S.; Strawa, J.; Matuszek, K.; Nazaruk, J. Pharmacological effects of scutellarin, an active component of genus Scutellaria and Erigeron: A systematic review. Am. J. Chin. Med. 2018, 46, 319–337. [Google Scholar] [CrossRef]
- Ożarowski, M.; Kujawski, R.; Mikołajczak, P.Ł.; Wielgus, K.; Klejewski, A.; Wolski, H.; Seremak-Mrozikiewicz, A. In vitro and in vivo activities of flavonoids—apigenin, baicalin, chrysin, scutellarin—in regulation of hypertension—a review for their possible effects in pregnancy–induced hypertension. Herba Pol. 2019, 65, 55–70. [Google Scholar] [CrossRef]
- Kennedy, D.A.; Lupattelli, A.; Koren, G.; Nordeng, H. Herbal medicine use in pregnancy: Results of a multinational study. BMC Complement. Altern. Med. 2013, 13, 1–10. [Google Scholar] [CrossRef] [PubMed]
- John, L.J.; Shantakumari, N. Herbal medicines use during pregnancy: A review from the Middle East. Oman Med. J. 2015, 30, 229–236. [Google Scholar] [CrossRef]
- Orendi, K.; Kivity, V.; Sammar, M.; Grimpel, Y.; Gonen, R.; Meiri, H.; Lubzens, E.; Huppertz, B. Placental and trophoblastic in vitro models to study preventive and therapeutic agents for preeclampsia. Placenta 2011, 32, S49–S54. [Google Scholar] [CrossRef]
- Xu, B.; Nakhla, S.; Makris, A.; Hennessy, A. TNF-alfa inhibits trophoblast integration into endothelial cellular networks. Placenta 2011, 32, 241–246. [Google Scholar] [CrossRef]
- Zhu, A.; Romero, R.; Huang, J.B.; Clark, A.; Petty, H.R. Maltooligosaccharides from JEG-3 trophoblast-like cells exhibit immunoregulatory properties. Am. J. Reprod. Immunol. 2011, 65, 54–64. [Google Scholar] [CrossRef][Green Version]
- Zhang, Y.; Liu, H.; Shi, X.; Qiao, F.; Zeng, W.; Feng, L.; Deng, D.; Liu, H.; Wu, Y. Maspin impairs the function of endothelial cells: An implying pathway of preeclampsia. BMC Pregnancy Childbirth 2017, 17, 328. [Google Scholar] [CrossRef]
- Kus, G.; Ozkurt, M.; Kabadere, S.; Erkasap, N.; Goger, G.; Demirci, F. Antiproliferative and antiapoptotic effect of thymoquinone on cancer cells in vitro. Bratisl. Lek. Listy. 2018, 119, 312–316. [Google Scholar] [CrossRef]
- Harmon, A.C.; Cornelius, D.C.; Amaral, L.M.; Faulkner, J.L.; Cunningham, M.W., Jr.; Wallace, K.; LaMarca, B. The role of inflammation in the pathology of preeclampsia. Clin. Sci. 2016, 130, 409–419. [Google Scholar] [CrossRef] [PubMed]
- Michalczyk, M.; Celewicz, A.; Celewicz, M.; Woźniakowska-Gondek, P.; Rzepka, R. The Role of Inflammation in the Pathogenesis of Preeclampsia. Mediators Inflamm. 2020, 2020, 3864941. [Google Scholar] [CrossRef]
- Alijotas-Reig, J.; Esteve-Valverde, E.; Ferrer-Oliveras, R.; Llurba, E.; Gris, J.M. Tumor necrosis factor-alfa and pregnancy: Focus on biologics. An updated and comprehensive review. Clin. Rev. Allergy Immunol. 2017, 53, 40–53. [Google Scholar] [CrossRef] [PubMed]
- Xu, B.; Bobek, G.; Makris, A.; Hennessy, A. Antihypertensive methyldopa, laβlol, hydralazine, and clonidine reversed tumour necrosis factor-α inhibited endothelial nitric oxide synthase expression in endothelial-trophoblast cellular networks. Clin. Exp. Pharmacol. Physiol. 2017, 44, 421–427. [Google Scholar] [CrossRef] [PubMed]
- Rinehart, B.K.; Terrone, D.A.; Lagoo-Deenadayalan, S.; Barber, W.H.; Hale, E.A.; Martin, J.N.; Bennett, W.A. Expression of the placental cytokines tumor necrosis factor α, interleukin 1β, and interleukin 10 is increased in preeclampsia. Am. J. Obstet. Gynecol. 1999, 181, 915–920. [Google Scholar] [CrossRef]
- Amash, A.; Holcberg, G.; Sapir, O.; Huleihel, M. Placental secretion of interleukin-1 and interleukin-1 receptor antagonist in preeclampsia: Effect of magnesium sulfate. J. Interferon Cytokine Res. 2012, 32, 432–441. [Google Scholar] [CrossRef] [PubMed]
- Romero, R.; Gotsch, F.; Pineles, B.; Kusanovic, J.P. Inflammation in pregnancy: Its roles in reproductive physiology, obstetrical complications, and fetal injury. Nutr. Rev. 2007, 65, S194–S202. [Google Scholar] [CrossRef]
- Southcombe, J.H.; Redman, C.W.; Sargent, I.L.; Granne, I. Interleukin-1 family cytokines and their regulatory proteins in normal pregnancy and pre-eclampsia. Clin. Exp. Immunol. 2015, 181, 480–490. [Google Scholar] [CrossRef]
- Opsjon, S.L.; Austgulen, R.; Waage, A. Interleukin-1, interleukin-6 and tumor necrosis factor at delivery in preeclamptic disorders. Acta Obstet. Gynecol. Scand. 1995, 74, 19–26. [Google Scholar] [CrossRef] [PubMed]
- Stallmach, T.; Hebisch, G.; Joller, H.; Kolditz, P.; Engelmann, M. Expression pattern of cytokines in the different compartments of the feto-maternal unit under various conditions. Reprod. Fertil. Dev. 1995, 7, 1573–1580. [Google Scholar] [CrossRef]
- Keelan, J.A.; Mitchell, M.D. Placental cytokines and preeclampsia. Front. Biosci. 2007, 12, 2706–2727. [Google Scholar] [CrossRef] [PubMed]
- Lockwood, C.J.; Yen, C.F.; Basar, M.; Kayisli, U.A.; Martel, M.; Buhimschi, I.; Buhimschi, C.; Huang, S.J.; Krikun, G.; Schatz, F. Preeclampsia-related inflammatory cytokines regulate interleukin-6 expression in human decidual cells. Am. J. Pathol. 2008, 172, 1571–1579. [Google Scholar] [CrossRef]
- Omere, C.; Richardson, L.; Saade, G.R.; Bonney, E.A.; Kechichian, T.; Menon, R. Interleukin (IL)-6: A friend or foe of pregnancy and parturition? Evidence from functional studies in fetal membrane cells. Front. Physiol. 2020, 11, 891. [Google Scholar] [CrossRef]
- Wang, H.; Chen, M.; Sang, X.; You, X.; Wang, Y.; Paterson, I.C.; Hong, W.; Yang, X. Development of small molecule inhibitors targeting TGF-β ligand and receptor: Structures, mechanism, preclinical studies and clinical usage. Eur. J. Med. Chem. 2020, 191, 112154. [Google Scholar] [CrossRef]
- Tirado-Rodriguez, B.; Ortega, E.; Segura-Medina, P.; Huerta-Yepez, S. TGF-β: An important mediator of allergic disease and a molecule with dual activity in cancer development. J. Immunol. Res. 2014, 2014, 1–15. [Google Scholar] [CrossRef]
- Muy-Rivera, M.; Sanchez, S.E.; Vadachkoria, S.; Qiu, C.; Bazul, V.; Williams, M.A. Transforming growth factor-β1 (TGF-β1) in plasma is associated with preeclampsia risk in Peruvian women with systemic inflammation. Am. J. Hypertens. 2004, 17, 334–338. [Google Scholar] [CrossRef] [PubMed]
- Xiang, W.; Xu, X.; Chen, H. Expression of TGF-βl in placenta of the patients with pregnancy-induced hypertension and its relationship with serum VCAM-1. J. Huazhong Univ. Sci. Technolog. Med. Sci. 2005, 25, 82–84. [Google Scholar] [CrossRef] [PubMed]
- Alam, S.; Ahmad, S.; Zafeer, F.; Rizvi, A.A.; Gulati, R.; Rashid, S. Role of Tgf-Β1 in the pathogenesis of pre-eclampsia. Ann. Int. Med. Den. Res. 2017, 3, PH01–PH04. [Google Scholar] [CrossRef]
- Jena, M.K.; Sharma, N.R.; Petitt, M.; Maulik, D.; Nayak, N.R. Pathogenesis of preeclampsia and therapeutic approaches targeting the placenta. Biomolecules 2020, 10, 953. [Google Scholar] [CrossRef] [PubMed]
- Juwita, D.R.; Yulistiani, Y.; Zarkaty, M.E. Effects of methyldopa on VEGF levels as proangiogenic factor in severe pre-eclampsia at Haji hospital, Surabaya. Fol. Med. Indones. 2017, 53, 267–271. [Google Scholar] [CrossRef]
- Ren, Y.; Wang, H.; Qin, H.; Yang, J.; Wang, Y.; Jiang, S.; Pan, Y. Vascular Endothelial Growth Factor expression in peripheral blood of patients with pregnancy induced hypertension syndrome and its clinical significance. Pak. J. Med. Sci. 2014, 30, 634–637. [Google Scholar] [CrossRef]
- Duhig, K.E.; Seed, P.T.; Myers, J.E.; Bahl, R.; Bambridge, G.; Barnfield, S.; Ficquet, J.; Girling, J.C.; Khalil, A.; Shennan, A.H.; et al. Placental growth factor testing for suspected pre-eclampsia: A cost-effectiveness analysis. BJOG 2019, 126, 1390–1398. [Google Scholar] [CrossRef] [PubMed]
- Krauss, T.; Pauer, H.U.; Augustin, H.G. Prospective analysis of placenta growth factor (PlGF) concentrations in the plasma of women with normal pregnancy and pregnancies complicated by preeclampsia. Hypertens. Pregnancy 2004, 23, 101–111. [Google Scholar] [CrossRef] [PubMed]
- Khalil, A.; Muttukrishna, S.; Harrington, K.; Jauniaux, E. Effect of antihypertensive therapy with α methyldopa on levels of angiogenic factors in pregnancies with hypertensive disorders. PLoS ONE 2008, 3, e2766. [Google Scholar] [CrossRef] [PubMed]
- Tal, R. The role of hypoxia and hypoxia-inducible factor-1α in preeclampsia pathogenesis. Biol. Reprod. 2012, 87, 134. [Google Scholar] [CrossRef] [PubMed]
- Iriyama, T.; Wang, W.; Parchim, N.F.; Song, A.; Blackwell, S.C.; Sibai, B.M.; Kellems, R.E.; Xia, Y. Hypoxia-independent upregulation of placental hypoxia inducible factor-1α gene expression contributes to the pathogenesis of preeclampsia. Hypertension 2015, 65, 1307–1315. [Google Scholar] [CrossRef]
- Caniggia, I.; Grisaru-Gravnosky, S.; Kuliszewsky, M.; Post, M.; Lye, S.J. Inhibition of TGF-β 3 restores the invasive capability of extravillous trophoblasts in preeclamptic pregnancies. J. Clin. Investig. 1999, 103, 1641–1650. [Google Scholar] [CrossRef]
- Kim, S.Y.; Park, S.Y.; Lim, J.H.; Lee, B.Y.; Yang, J.H.; Ryu, H.M. Hypoxia inducible factor-1α (HIF-1α) gene polymorphisms in Korean patients with preeclampsia. J. Endocrinol. Invest. 2012, 35, 670–675. [Google Scholar] [CrossRef] [PubMed]
- Juskowiak, B.; Bogacz, A.; Wolek, M.; Kamiński, A.; Uzar, I.; Seremak-Mrozikiewicz, A.; Czerny, B. Expression profiling of genes modulated by rosmarinic acid (RA) in MCF-7 breast cancer cells. Ginekol. Pol. 2018, 89, 541–545. [Google Scholar] [CrossRef]


| Group | TNF-α | TGF-β | VEGF | PIGF | HIF-1α | IL-1β | IL-6 |
|---|---|---|---|---|---|---|---|
| control | 1.88 ± 0.04 | 1.4 ± 0.02 | 1.20 ± 0.05 | 1.20 ± 0.09 | 1.16 ± 0.06 | 1.83 ± 0.03 | 1.75 ± 0.11 |
| methyldopa | 1.53 ± 0.21 * | 1.50 ± 0.13 | 1.65 ± 0.09 * | 1.90 ± 0.21 * | 1.29 ± 0.03 * | 1.60 ± 0.13 * | 1.92 ± 0.16 |
| apigenin | 1.97 ± 0.20 | 1.40 ± 0.18 | 1.54 ± 0.02 *,# | 1.55 ± 0.05* | 1.23 ± 0.04 | 1.55 ± 0.12 * | 2.10 ± 0.17 * |
| Methyldopa + apigenin | 0.90 ± 0.05 *,# | 0.88 ± 0.03 *,# | 0.86 ± 0.02 *,# | 1.17 ± 0.01 *,# | 0.95 ± 0.03 *,# | 1.05 ± 0.04 *,# | 1.11 ± 0.02 *,# |
| baicalein | 1.53 ± 0.10 * | 1.41 ± 0.13 | 1.40 ± 0.08 | 1.24 ± 0.12 | 1.22 ± 0.02 | 1.64 ± 0.07 | 2.06 ± 0.11 * |
| Methyldopa + baicalein | 0.90 ± 0.04 *,# | 0.75 ± 0.06 *,# | 0.84 ± 0.05 *,# | 1.05 ± 0.01 *,# | 0.84 ± 0.02 *,# | 1.00 ± 0.03 *,# | 1.07 ± 0.03 *,# |
| chrysin | 1.40 ± 0.13 * | 1.47 ± 0.13 | 1.47 ± 0.16 * | 1.48 ± 0.16 | 1.26 ± 0.02 | 1.50 ± 0.04 * | 1.91 ± 0.01 |
| methyldopa+ chrysin | 0.79 ± 0.02 *,# | 0.64 ± 0.01 *,# | 0.72 ± 0.02 *,# | 0.90 ± 0.01 *,# | 0.82 ± 0.09 *,# | 0.89 ± 0.03 *,# | 1.09 ± 0.03 *,# |
| quercetin | 1.56 ± 0.03 * | 1.35 ± 0.04 | 1.38 ± 0.14 | 1.31 ± 0.14 | 1.25 ± 0.01 | 1.67 ± 0.09 | 1.86 ± 0.02 |
| Methyldopa + quercetin | 0.90 ± 0.05 *,# | 0.88 ± 0.07 *,# | 0.89 ± 0.06 *,# | 1.16 ± 0.05 *,# | 0.94 ± 0.02 *,# | 1.09 ± 0.04 *,# | 1.06 ± 0.02 *,# |
| scutellarin | 1.56 ± 0.04 * | 1.60 ± 0.05 | 1.58 ± 0.05 * | 1.52 ± 0.07 * | 1.26 ± 0.01 | 1.76 ± 0.05 | 2.30 ± 0.04 * |
| Methyldopa + scutellarin | 0.78 ± 0.04 *,# | 0.73 ± 0.03 *,# | 0.82 ± 0.06 *,# | 1.03 ± 0.01 *,# | 0.93 ± 0.03 *,# | 0.92 ± 0.04 *,# | 1.06 ± 0.03 *,# |
| Table. Cont. | TNF-α | TGF-β | VEGF | PIGF | HIF-1α | IL-1β | IL-6 |
|---|---|---|---|---|---|---|---|
| [ng/mL] | |||||||
| control | 0.041 ± 0.002 | 0.128 ± 0.002 | 0.174 ± 0.004 | 3.274 ± 0.055 | 0.011 ± 0.003 | 0.008 ± 0.001 | 0.035 ± 0.006 |
| methyldopa | 0.038 ± 0.003 | 0.095 ± 0.003 * | 0.061 ± 0.002 * | 3.006 ± 0.028 * | 0.052 ± 0.004 * | 0.010 ± 0.001 | 0.035 ± 0.002 |
| apigenin | 0.032 ± 0.002 * | 0.118 ± 0.001 * | 0.203 ± 0.004 * | 3.340 ± 0.126 | 0.011 ± 0.002 | 0.007 ± 0.001 | 0.043 ± 0.004 |
| Methyldpa + apigenin | 0.029 ± 0.001 *,# | 0.091 ± 0.001 | 0.115 ± 0.002 *,# | 3.290 ± 0.001 # | 0.025 ± 0.002 # | 0.008 ± 0.001 | 0.046 ± 0.001 |
| baicalein | 0.039 ± 0.002 | 0.113 ± 0.003 * | 0.138 ± 0.002 * | 3.507 ± 0.031 | 0.020 ± 0.003 | 0.009 ± 0.002 | 0.051 ± 0.008 * |
| Methyldopa + baicalein | 0.030 ± 0.001 *,# | 0.087 ± 0.001 *,# | 0.122 ± 0.002 *,# | 3.405 ± 0.001 # | 0.017 ± 0.002 # | 0.019 ± 0.001 *,# | 0.039 ± 0.001 |
| chrysin | 0.035 ± 0.002 * | 0.145 ± 0.004 * | 0.194 ± 0.004 * | 3.325 ± 0.171 | 0.022 ± 0.003 | 0.009 ± 0.002 | 0.033 ± 0.004 |
| methyldopa+ chrysin | 0.033 ± 0.001 * | 0.107 ± 0.002 *,# | 0.144 ± 0.001 *,# | 3.341 ± 0.001 # | 0.015 ± 0.001 # | 0.014 ± 0.001 * | 0.043 ± 0.002 |
| quercetin | 0.027 ± 0.002 * | 0.081 ± 0.002 * | 0.131 ± 0.004 * | 3.374 ± 0.038 | 0.019 ± 0.003 | 0.010 ± 0.001 | 0.031 ± 0.004 |
| Methyldopa + quercetin | 0.035 ± 0.001 * | 0.080 ± 0.001 *,# | 0.048 ± 0.001 *,# | 2.798 ± 0.001 * | 0.012 ± 0.001 # | 0.013 ± 0.001 | 0.041 ± 0.002 |
| scutellarin | 0.038 ± 0.002 | 0.141 ± 0.002 * | 0.152 ± 0.002 * | 3.284 ± 0.160 | 0.020 ± 0.004 | 0.011 ± 0.003 | 0.041 ± 0.005 |
| Methyldopa + scutellarin | 0.028 ± 0.001 *,# | 0.110 ± 0.002 *,# | 0.091 ± 0.001 *,# | 3.357 ± 0.001 # | 0.027 ± 0.001 *,# | 0.014 ± 0.001 * | 0.040 ± 0.001 |
| Group | TNF-α | TGF-β | VEGF | PIGF | HIF-1α | IL-1β | IL-6 |
|---|---|---|---|---|---|---|---|
| control | 1.17 ± 0.08 | 1.12 ± 0.06 | 1.12 ± 0.06 | 1.14 ± 0.06 | 1.12 ± 0.03 | 1.01 ± 0.03 | 1.26 ± 0.06 |
| methyldopa | 1.51 ± 0.27 * | 1.54 ± 0.10 * | 1.43 ± 0.01 * | 1.85 ± 0.08 * | 1.35 ± 0.05 * | 1.42 ± 0.05 * | 1.96 ± 0.04 * |
| apigenin | 2.27 ± 0.12 * | 1.50 ± 0.18 * | 1.66 ± 0.16 * | 1.59 ± 0.24 * | 1.90 ± 0.06 * | 1.75 ± 0.05 * | 1.55 ± 0.04 * |
| Methyldopa + apigenin | 1.37 ± 0.03 | 1.27 ± 0.05 # | 1.36 ± 0.18 | 1.43 ± 0.09 *,# | 1.16 ± 0.02 # | 1.60 ± 0.10 * | 1.15 ± 0.07 # |
| baicalein | 1.64 ± 0.04 * | 1.48 ± 0.02 * | 1.44 ± 0.03 * | 1.56 ± 0.11 * | 1.60 ± 0.05 * | 1.57 ± 0.07 * | 1.44 ± 0.03 * |
| Methyldopa + baicalein | 1.40 ± 0.09 | 1.21 ± 0.02 # | 1.34 ± 0.14 | 1.43 ± 0.02 *,# | 1.15 ± 0.03 # | 1.59 ± 0.01 * | 1.10 ± 0.04 *,# |
| chrysin | 1.52 ± 0.01 * | 1.57 ± 0.07 * | 1.40 ± 0.01 * | 1.50 ± 0.07 * | 1.50 ± 0.06 * | 1.36 ± 0.07 * | 1.41 ± 0.01 * |
| Methyldopa + chrysin | 1.16 ± 0.05 # | 1.16 ± 0.08 # | 1.36 ± 0.10 | 1.36 ± 0.03 *,# | 1.12 ± 0.01 # | 1.70 ± 0.05 *,# | 1.08 ± 0.01 *,# |
| quercetin | 1.63 ± 0.03 * | 1.41 ± 0.04 * | 1.43 ± 0.08 * | 1.40 ± 0.05 | 1.52 ± 0.04 * | 1.32 ± 0.04 * | 1.55 ± 0.04 * |
| Methyldopa + quercetin | 1.15 ± 0.15 # | 1.17 ± 0.04 # | 1.30 ± 0.04 | 1.30 ± 0.07 # | 1.02 ± 0.01 # | 1.52 ± 0.06 * | 1.02 ± 0.01 *,# |
| scutellarin | 1.63 ± 0.04 * | 1.70 ± 0.10 * | 1.69 ± 0.04 * | 1.69 ± 0.10 * | 1.66 ± 0.06 * | 1.44 ± 0.05 * | 1.40 ± 0.04 * |
| Methyldopa + scutellarin | 1.14 ± 0.03 # | 1.23 ± 0.14 # | 1.30 ± 0.10 | 1.38 ± 0.07 # | 1.14 ± 0.04 # | 1.35 ± 0.14 * | 1.12 ± 0.02 *,# |
| Group | TNF-α | TGF-β | VEGF | PIGF | HIF-1α | IL-1β | IL-6 |
|---|---|---|---|---|---|---|---|
| [ng/mL] | |||||||
| control | 0.046 ± 0.001 | 0.150 ± 0.001 | 0.162 ± 0.001 | 3.398 ± 0.002 | 0.017 ± 0.001 | 0.015 ± 0.001 | 0.050 ± 0.001 |
| methyldopa | 0.040 ± 0.001 * | 0.117 ± 0.002 * | 0.161 ± 0.001 | 3.393 ± 0.002 | 0.025 ± 0.003 * | 0.011 ± 0.001 | 0.057 ± 0.001 |
| apigenin | 0.041 ± 0.001 * | 0.144 ± 0.001 | 0.201 ± 0.001 * | 3.499 ± 0.002 * | 0.022 ± 0.001 | 0.018 ± 0.001 | 0.061 ± 0.002 * |
| Methyldopa + apigenin | 0.031 ± 0.002 *,# | 0.090 ± 0.002 *,# | 0.116 ± 0.002 *,# | 3.293 ± 0.003 *,# | 0.020 ± 0.001 | 0.009 ± 0.001 * | 0.042 ± 0.001 *,# |
| baicalein | 0.038 ± 0.001 * | 0.169 ± 0.001 * | 0.155 ± 0.003 | 3.564 ± 0.002 * | 0.025 ± 0.001 * | 0.017 ± 0.002 | 0.069 ± 0.001 * |
| Methyldopa + baicalein | 0.027 ± 0.001 *,# | 0.080 ± 0.002 *,# | 0.121 ± 0.002 *,# | 3.410 ± 0.011 | 0.019 ± 0.001 | 0.017 ± 0.001 # | 0.037 ± 0.004 *,# |
| chrysin | 0.049 ± 0.001 | 0.152 ± 0.002 | 0.165 ± 0.001 | 3.505 ± 0.003* | 0.030 ± 0.001* | 0.018 ± 0.001 | 0.063 ± 0.001* |
| Methyldopa + chrysin | 0.037 ± 0.002 * | 0.110 ± 0.001 *,# | 0.135 ± 0.002 *,# | 3.309 ± 0.011 *,# | 0.014 ± 0.001 | 0.014 ± 0.002 | 0.040 ± 0.001 *,# |
| quercetin | 0.035 ± 0.002 * | 0.096 ± 0.001 * | 0.167 ± 0.001 | 3.204 ± 0.002 * | 0.020 ± 0.001 | 0.014 ± 0.001 | 0.063 ± 0.002 * |
| Methyldopa + quercetin | 0.032 ± 0.001 *,# | 0.081 ± 0.002 *,# | 0.046 ± 0.005 *,# | 2.805 ± 0.014 *,# | 0.014 ± 0.004 | 0.013 ± 0.003 | 0.039 ± 0.006 *,# |
| scutellarin | 0.044 ± 0.001 | 0.154 ± 0.002 | 0.161 ± 0.001 | 3.491 ± 0.001 * | 0.024 ± 0.001 * | 0.020 ± 0.001 * | 0.071 ± 0.002 * |
| Methyldopa + scutellarin | 0.030 ± 0.001 *,# | 0.130 ± 0.001 *,# | 0.093 ± 0.004 *,# | 3.344 ± 0.002 *,# | 0.030 ± 0.001 *,# | 0.014 ± 0.002 | 0.040 ± 0.001 *,# |
| Gene | Primer Sequence Forward (5ʹ→3ʹ) | Primer Sequence Reverse (5ʹ→3ʹ) | bp |
|---|---|---|---|
| TNF-α | TGC TTG TTC CTC AGC CTC TT | TGA GGT ACA GGC CCT CTG AT | 218 |
| IL-1β | CGA TGC ACC TGT ACG ATC AC | TCT TTC AAC ACG CAG GAC AG | 226 |
| HIF-1α | TTG CCT TTC CTT CTC TTC TCC | CAA TCC AAG GTT GCC AAG TT | 164 |
| VEGF | CCT TGC TGC TCT ACC TCC AC | ATC CAC CCC AAA ACT TTT CC | 236 |
| TGF-β | ACA TTG ACT TCC GCA AGG AC | CCG GGT TAT GCT GGT TGT A | 150 |
| PIGF | GTT CAG CCC ATC CTG TGT CT | AGC AGG GAA ACA GTT GGC TA | 244 |
| IL-6 | TGC GTC CGT AGT TTC CTT CT | GGA ATC TTC TCC TGG GG GTA | 211 |
| GAPDH | GAT GGT GAA GGT CGG TGT G | ATG AAG GGG TCG TTG ATG G | 108 |
Publisher’s Note: MDPI stays neutral with regard to jurisdictional claims in published maps and institutional affiliations. |
© 2021 by the authors. Licensee MDPI, Basel, Switzerland. This article is an open access article distributed under the terms and conditions of the Creative Commons Attribution (CC BY) license (http://creativecommons.org/licenses/by/4.0/).
Share and Cite
Bogacz, A.; Mikołajczak, P.Ł.; Wolek, M.; Górska, A.; Szulc, M.; Ożarowski, M.; Kujawski, R.; Czerny, B.; Wolski, H.; Karpiński, T.M.; et al. Combined Effects of Methyldopa and Flavonoids on the Expression of Selected Factors Related to Inflammatory Processes and Vascular Diseases in Human Placenta Cells—An In Vitro Study. Molecules 2021, 26, 1259. https://doi.org/10.3390/molecules26051259
Bogacz A, Mikołajczak PŁ, Wolek M, Górska A, Szulc M, Ożarowski M, Kujawski R, Czerny B, Wolski H, Karpiński TM, et al. Combined Effects of Methyldopa and Flavonoids on the Expression of Selected Factors Related to Inflammatory Processes and Vascular Diseases in Human Placenta Cells—An In Vitro Study. Molecules. 2021; 26(5):1259. https://doi.org/10.3390/molecules26051259
Chicago/Turabian StyleBogacz, Anna, Przemysław Ł. Mikołajczak, Marlena Wolek, Aleksandra Górska, Michał Szulc, Marcin Ożarowski, Radosław Kujawski, Bogusław Czerny, Hubert Wolski, Tomasz M. Karpiński, and et al. 2021. "Combined Effects of Methyldopa and Flavonoids on the Expression of Selected Factors Related to Inflammatory Processes and Vascular Diseases in Human Placenta Cells—An In Vitro Study" Molecules 26, no. 5: 1259. https://doi.org/10.3390/molecules26051259
APA StyleBogacz, A., Mikołajczak, P. Ł., Wolek, M., Górska, A., Szulc, M., Ożarowski, M., Kujawski, R., Czerny, B., Wolski, H., Karpiński, T. M., & Seremak-Mrozikiewicz, A. (2021). Combined Effects of Methyldopa and Flavonoids on the Expression of Selected Factors Related to Inflammatory Processes and Vascular Diseases in Human Placenta Cells—An In Vitro Study. Molecules, 26(5), 1259. https://doi.org/10.3390/molecules26051259