
The Double Face of Ketamine—The Possibility of Its Identification in Blood and Beverages


Abstract
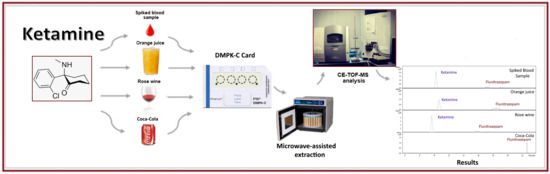
1. Introduction
2. Results and Discussion
2.1. Validation Parameters
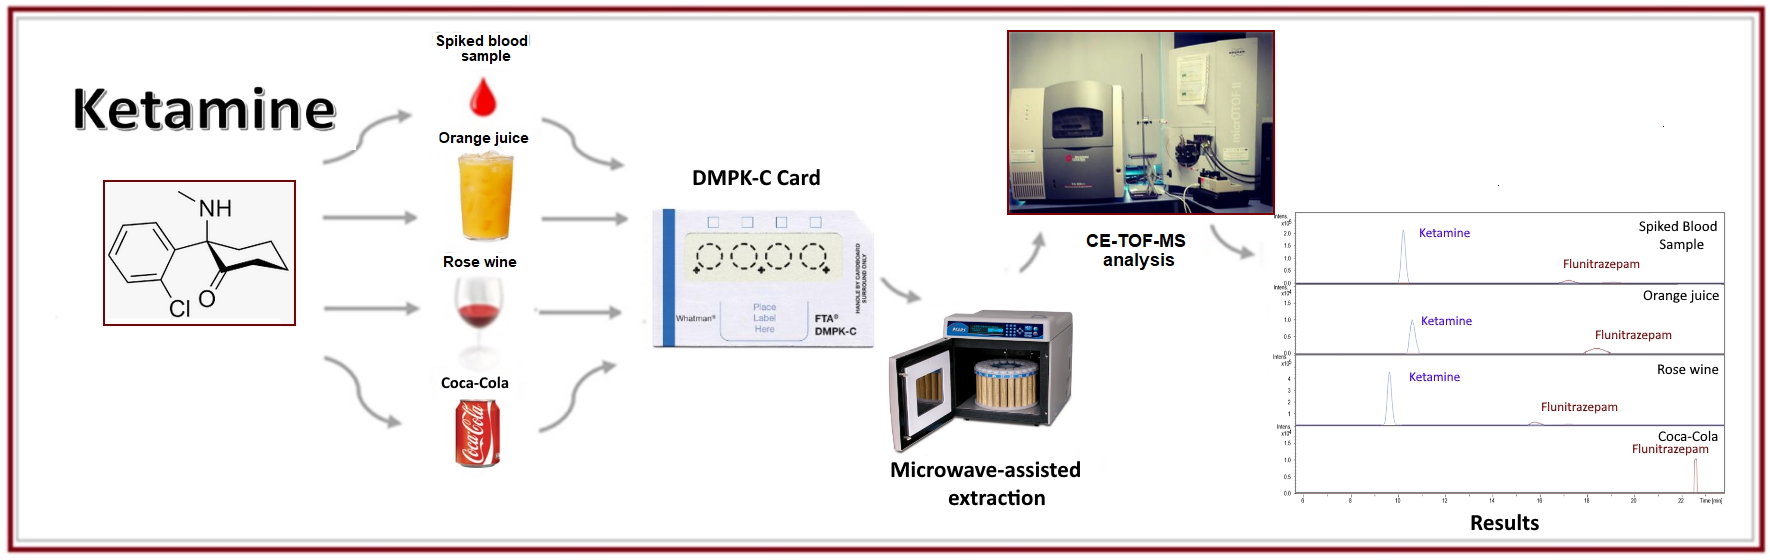
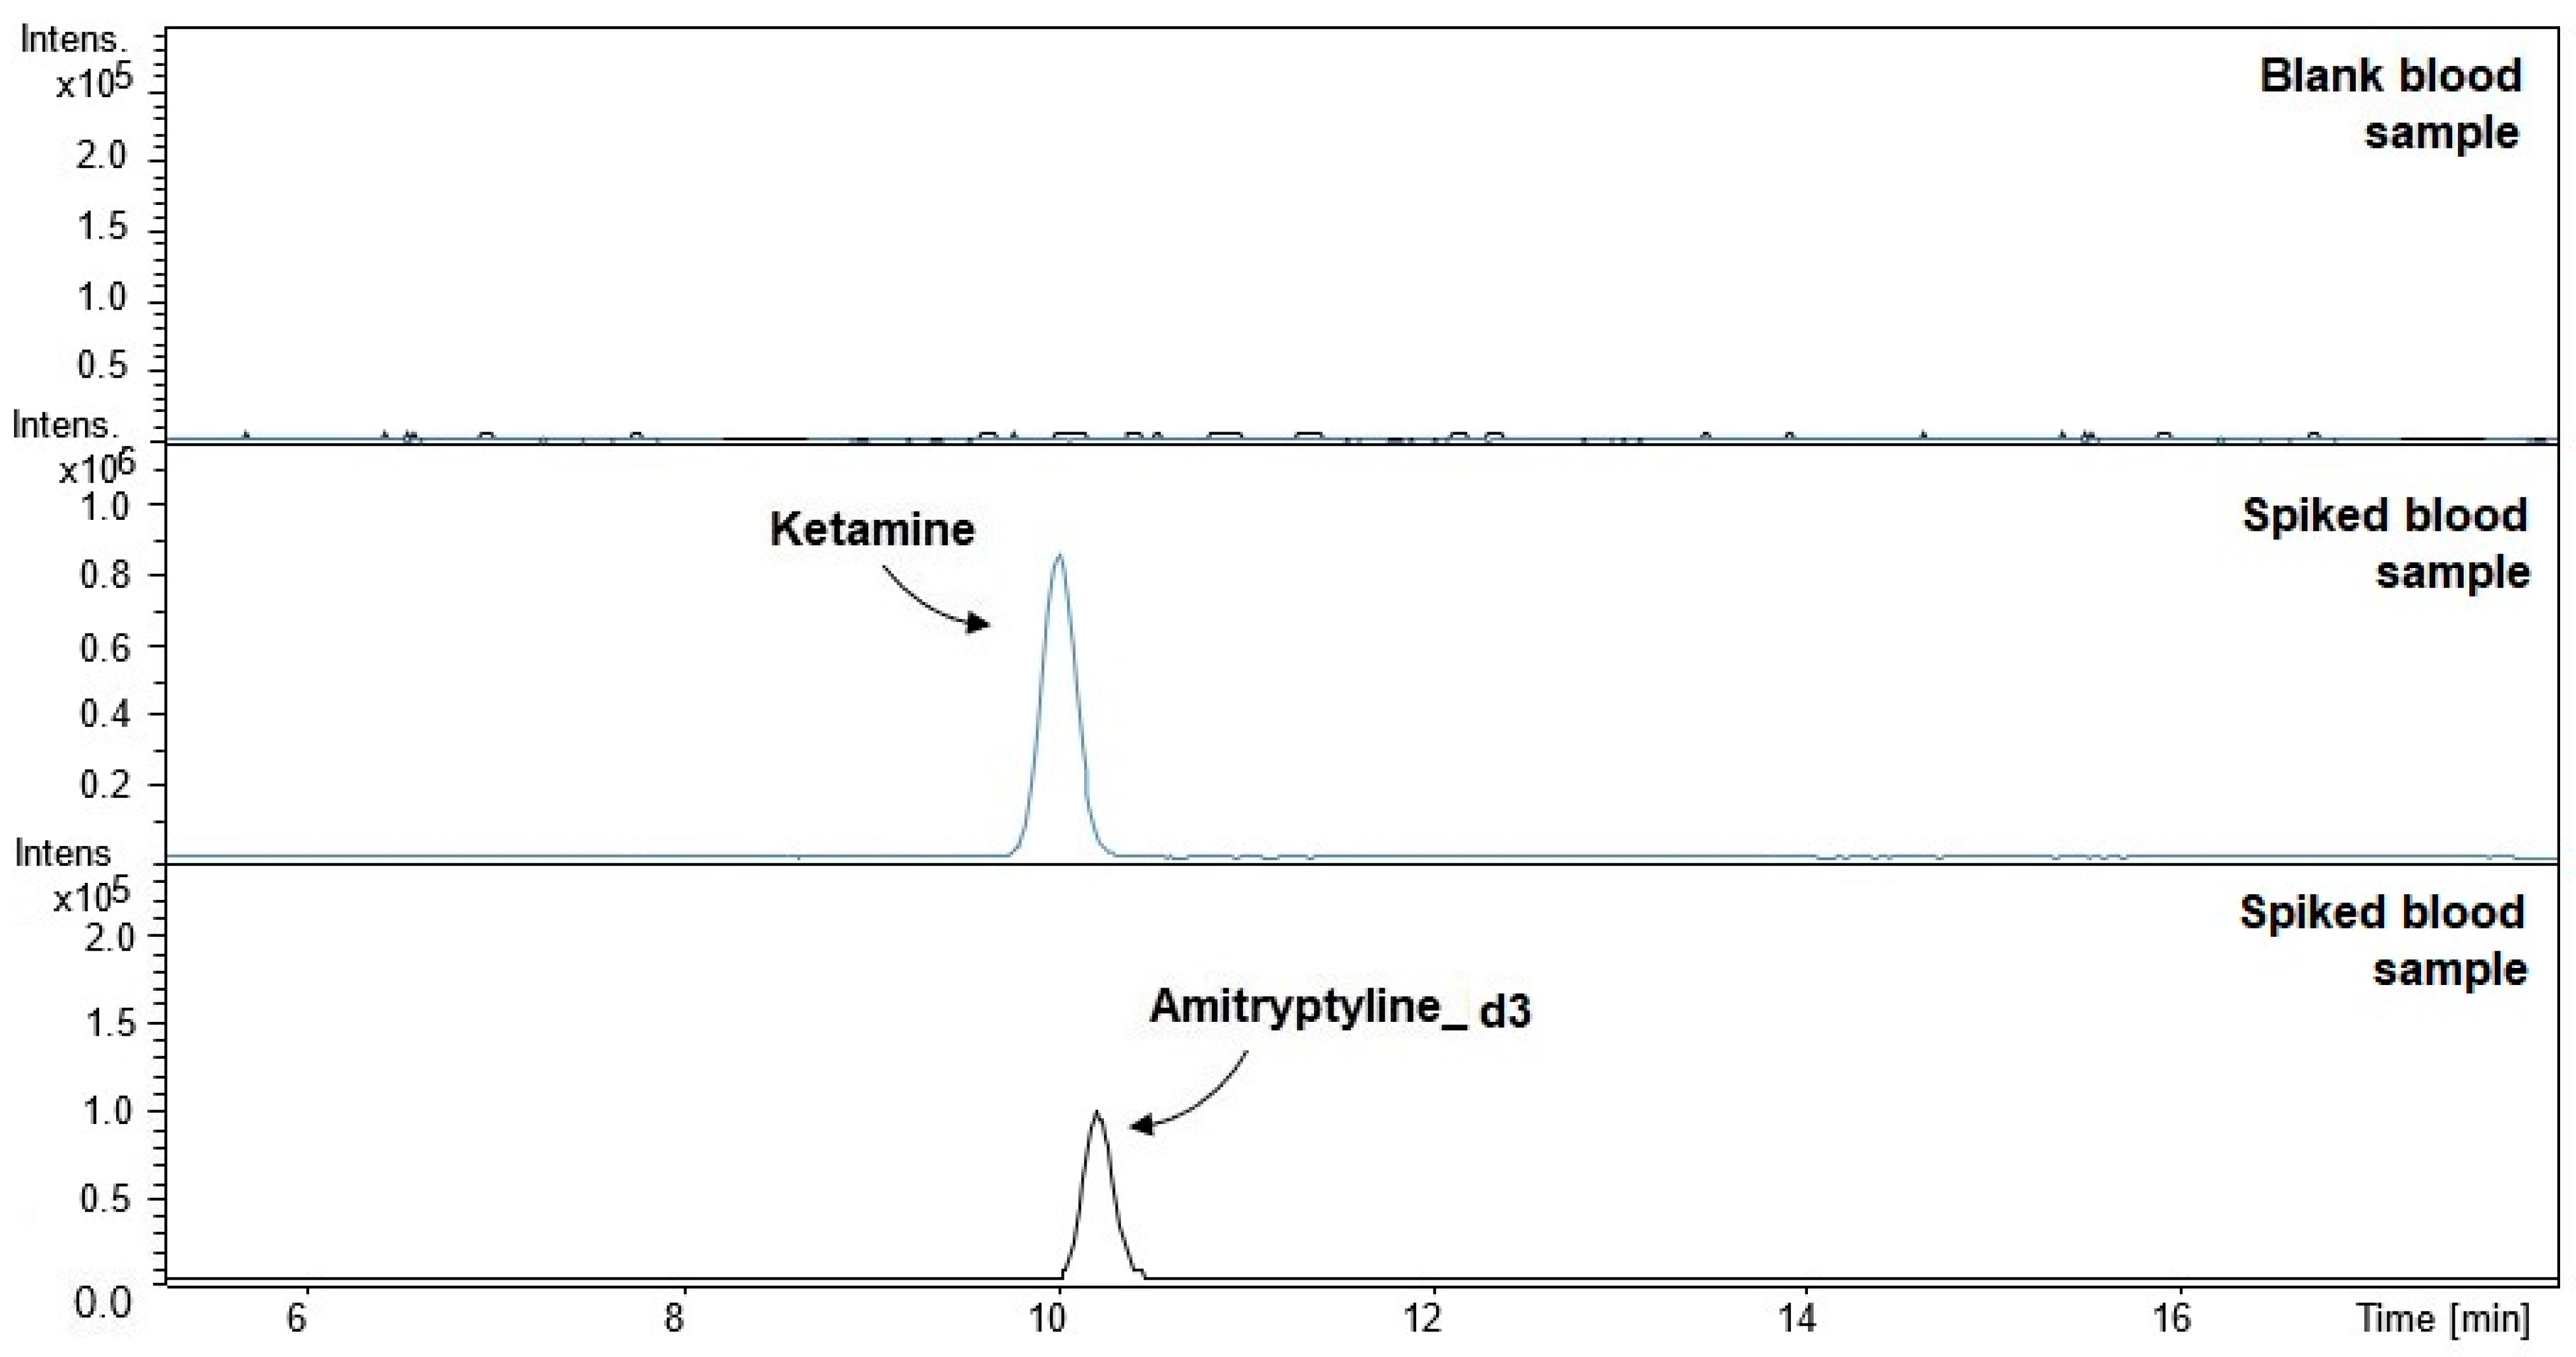
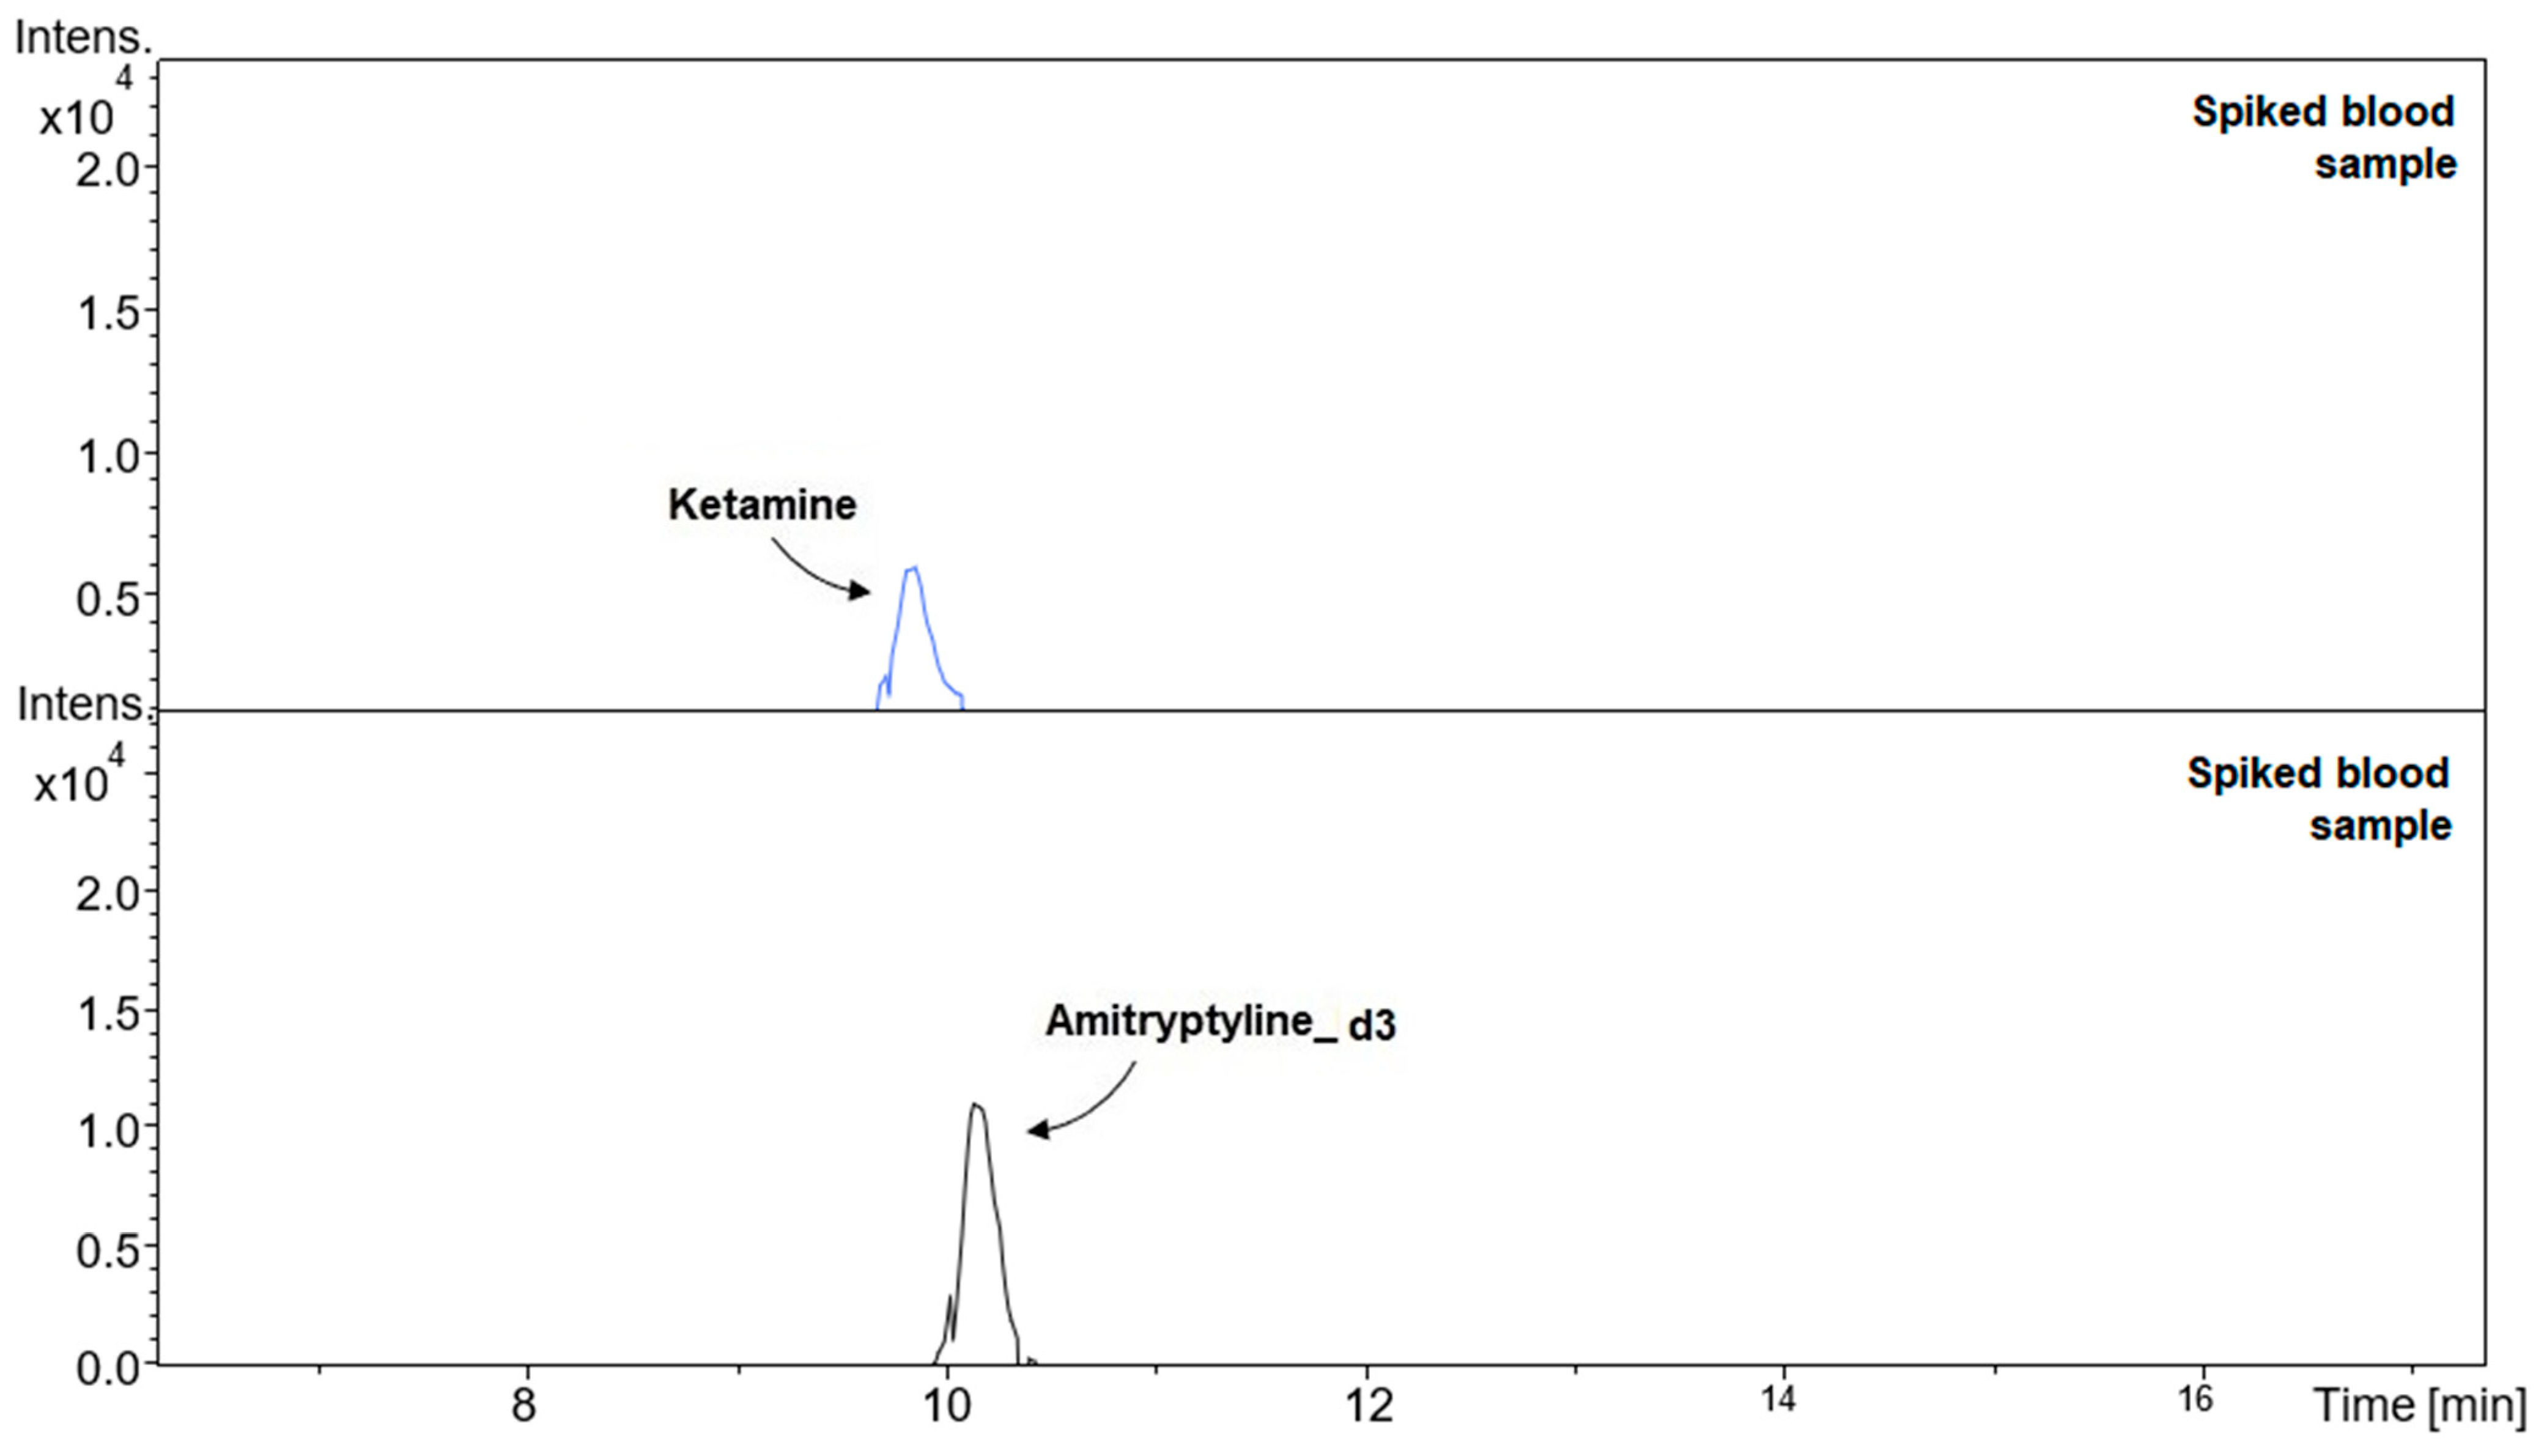
2.2. Analysis of Beverage Samples
3. Materials and Methods
3.1. Chemicals and Reagents
3.2. Instrumentations
3.3. Procedure
3.4. Validation Parameters
3.4.1. Linearity Range
3.4.2. Limits of Detection (LOD) and Quantification (LOQ)
3.4.3. Precision and Recovery
3.5. Preparation of Beverage Samples
4. Conclusions
Author Contributions
Funding
Institutional Review Board Statement
Informed Consent Statement
Data Availability Statement
Acknowledgments
Conflicts of Interest
Sample Availability
References
- Adamowicz, P.; Zuba, D.; Kała, M. Ketamine: A New substance on the polish drug market. Probl. Forensic Sci. 2003, 56, 24–37. [Google Scholar]
- Tsiu, P.Y.; Chu, M.C. Ketamine: An old drug revitalized in pain medicine. BJA Edu. 2017, 17, 84–87. [Google Scholar] [CrossRef]
- Vincenzi, P.; Starnari, R.; Faloia, L.; Grifoni, R.; Bucchianeri, R.; Chiado, L.; Venezia, A.; Stronato, M.; Giampieri, M.; Montaldi, R.; et al. Continuous thoracic spinal anesthesia with local anesthetic plus midazolam and ketamine is superior to local anesthetic plus fentanyl in major abdominal surgery. Surgery Open Sci. 2020, 2, 5–11. [Google Scholar] [CrossRef]
- Sumner, R.; McMillan, R.; Spriggs, M.J.; Camplbell, D.; Malpas, G.; Maxwell, E.; Deng, C.; Hay, J.; Ponton, R.; Sundram, F.; et al. Ketamine improves short-term plasticity in depression by enhancing sensitivity to prediction errors. Euro. Neuropsychopharm. 2020, 38, 73–85. [Google Scholar] [CrossRef]
- Bechtel, L.; Holstege, C. Criminal poisoning: Drug-facilitated sexual assault. Emerg. Med. Clin. N. Am. 2007, 25, 499–525. [Google Scholar] [CrossRef]
- Narang, J.; Singhal, C.; Mathur, A.; Dubey, A.K.; PN Krishna, A.; Anil, A.; Pundir, C.S. Naked-eye quantitative assay on paper device for date rape drug sensing via smart phone APP. Vacuum 2018, 153, 300–305. [Google Scholar] [CrossRef]
- Yehia, A.M.; Farag, M.A.; Tantawy, M.A. A novel trimodal system on a paper-based microfluidic device for onsite detection of the date rape drug “ketamine”. Anal. Chim. Acta 2020, 1104, 95–104. [Google Scholar] [CrossRef] [PubMed]
- Harun, N.; Andreson, R.; Cormack, P. Analysis of ketamine and norketamine in hair samples using molecularly imprinted solid-phase extraction (MISPE) and liquid chromatography–tandem mass spectrometry (LC-MS/MS). Anal. Bioanal. Chem. 2010, 396, 2449–2459. [Google Scholar] [CrossRef]
- Lee, H.; Park, Y.; Jo, J.; In, S.; Park, Y.; Kim, E.; Pyo, J.; Choe, S. Analysis of benzo- diazepines and their metabolites using DBS cards and LC-MS/MS. Forensic Sci. Int. 2015, 255, 137–145. [Google Scholar] [CrossRef] [PubMed]
- Świądro, M.; Stelmaszczyk, P.; Wietecha-Posłuszny, R.; Dudek, D. Development of a new method for drug detection based on a combination of the dried blood spot method and capillary electrophoresis. J. Chromatogr. B. 2020, 1157, 122339. [Google Scholar] [CrossRef] [PubMed]
- Simões, S.S.; Ajenjo, A.C.; Dias, M.J. Dried blood spots combined to an UPLC–MS/MS method for the simultaneous determination of drugs of abuse in forensic toxicology. J. Pharm. Biomed. Anal. 2018, 147, 634–644. [Google Scholar] [CrossRef] [PubMed]
- Kuban, P.; Dvorak, M.; Kuban, P. Capillary electrophoresis of small ions and molecules in less conventional human body fluid samples: A review. Anal. Chim. Acta 2019, 1075, 1–26. [Google Scholar] [CrossRef] [PubMed]
- De Kesel, P.M.; Sadones, N.; Capiau, S.; Lambert, W.E.; Stove, C.P. Hemato-critical issues in quantitative analysis of dried blood spots: Challenges and solutions. Bioanalysis. 2013, 5, 2023–2041. [Google Scholar] [CrossRef] [PubMed]
- Neto, R.; Gooley, A.; Breadmore, M.C.; Hilder, E.F.; Lapierre, F. Precise, accurate and user-independent blood collection system for dried blood spot sample preparation. Anal. Bioanal. Chem. 2018, 410, 3315–3323. [Google Scholar] [CrossRef]
- Majda, A.; Wietecha-Posłuszny, R.; Świądro, M.; Mrochem, K.; Kościelniak, P. Dried blood spots sampling in case samples deprived of hematocrit level information—Investigation and calculation strategy. J. Chromatogr. B. 2019, 1124, 308–312. [Google Scholar] [CrossRef]
- European Medicines Agency (EMEA). Guideline on Bioanalytical Method Validation; EMEA: London, UK, 2011; EMEA/CHMP/EWP/192217/2009 Rev. 1 Corr. 2. [Google Scholar]
- Scientific Working Group for Forensic Toxicology (SWGTOX). Standard practices for method validation in forensic toxicology. J. Anal. Toxicol. 2013, 37, 452–474. [Google Scholar] [CrossRef]
- Odoardi, S.; Anzillotti, L.; Strano-Rossi, S. Simplifying sample pretreatment: Application of dried blood spot (DBS) method to blood samples, including postmortem, for UHPLC–MS/MS analysis of drugs of abuse. Forensic Sci. Int. 2014, 243, 61–67. [Google Scholar] [CrossRef]
- Ambach, L.; Hernández Redondo, A.; König, S.; Weinmann, W. Rapid and simple LC-MS/MS screening of 64 novel psychoactive substances using dried blood spots. Drug Test Anal. 2013, 6, 367–375. [Google Scholar] [CrossRef]
- Nosseir, N.S.; Michels, G.; Binder, P.; Wiesen, M.H.J.; Müller, C. Simultaneous detection of ketamine, lorazepam, midazolam and sufentanil in human serum with liquid chromatography–tandem mass spectrometry for monitoring of analgosedation in critically ill patients. J. Chromatogr. B. 2014, 973, 133–141. [Google Scholar] [CrossRef]
- Rossas, M.E.R.; Patel, S.; Wainer, I.W. Determination of the enantiomers of ketamine and norketamine in human plasma by enantioselective liquid chromatography–mass spectrometry. J. Chromatogr. B. 2003, 794, 99–108. [Google Scholar] [CrossRef]
- Hasan, M.; Hofstetter, R.; Fassauer, G.M.; Link, A.; Siegmund, W.; Oswald, S. Quantitative chiral and achiral determination of ketamine and its metabolites by LC–MS/MS in human serum, urine and fecal samples. J. Pharm. Biomed. Anal. 2017, 139, 87–97. [Google Scholar] [CrossRef] [PubMed]
- Legrand, T.; Roy, S.; Monchaud, C.; Grondin, C.; Duval, M.; Jacqz-Aigrain, E. Determination of ketamine and norketamine in plasma by micro-liquid chromatography–mass spectrometry. J. Pharm. Biomed. Anal. 2008, 48, 171–176. [Google Scholar] [CrossRef]
- Albright, J.A.; Stevens, S.A.; Beussman, D.J. Detecting ketamine in beverage residues: Application in date rape detection. Drug Test Anal. 2012, 4, 337–341. [Google Scholar] [CrossRef]
- Mohamed, N.; Haw, C.K.; Abdullah, A.F.L. Analytical study of ketamine from different aqueous medium for forensic determination. Int. J. Med. Sci. 2019, 4, 13–18. [Google Scholar]
- Capiau, S.; Veenhof, H.; Koster, R.A.; Bergqvist, Y.; Boettcher, M.; Halmingh, O.; Alffenaar, J.W.C. Official international association for therapeutic drug monitoring and clinical toxicology guideline: Development and validation of dried blood spot–based methods for therapeutic drug monitoring. Ther. Drug Monit. 2019, 41, 409–430. [Google Scholar] [CrossRef] [PubMed]


| Parameter | Value |
|---|---|
| Linearity (ng/mL) | LOQ-300 |
| Slope | 0.024 |
| Intercept | 1.901 |
| R-squared | 0.997 |
| LOD (ng/mL): | |
| according to Equation (1) | 6.5 |
| based on signal-to-noise ratio | 6.0 |
| LOQ (ng/mL): | |
| according to Equation (1) | 19.5 |
| based on signal-to-noise ratio | 19.8 |
| Intra-day 1 precision, CV (%): | |
| 50 ng/mL | 11.1 |
| 150 ng/mL | 8.1 |
| 300 ng/mL | 6.1 |
| Inter-day 1 precision, CV (%): | |
| 50 ng/mL | 13.1 |
| 150 ng/mL | 8.6 |
| 300 ng/mL | 7.9 |
| Intra-day 1 recovery (%): | |
| 50 ng/mL | 92.7 |
| 150 ng/mL | 97.4 |
| 300 ng/mL | 98.2 |
| Inter-day 1 recovery (%): | |
| 50 ng/mL | 111.3 |
| 150 ng/mL | 94.6 |
| 300 ng/mL | 102.4 |
Publisher’s Note: MDPI stays neutral with regard to jurisdictional claims in published maps and institutional affiliations. |
© 2021 by the authors. Licensee MDPI, Basel, Switzerland. This article is an open access article distributed under the terms and conditions of the Creative Commons Attribution (CC BY) license (http://creativecommons.org/licenses/by/4.0/).
Share and Cite
Świądro, M.; Stelmaszczyk, P.; Lenart, I.; Wietecha-Posłuszny, R. The Double Face of Ketamine—The Possibility of Its Identification in Blood and Beverages. Molecules 2021, 26, 813. https://doi.org/10.3390/molecules26040813
Świądro M, Stelmaszczyk P, Lenart I, Wietecha-Posłuszny R. The Double Face of Ketamine—The Possibility of Its Identification in Blood and Beverages. Molecules. 2021; 26(4):813. https://doi.org/10.3390/molecules26040813
Chicago/Turabian StyleŚwiądro, Magdalena, Paweł Stelmaszczyk, Irena Lenart, and Renata Wietecha-Posłuszny. 2021. "The Double Face of Ketamine—The Possibility of Its Identification in Blood and Beverages" Molecules 26, no. 4: 813. https://doi.org/10.3390/molecules26040813
APA StyleŚwiądro, M., Stelmaszczyk, P., Lenart, I., & Wietecha-Posłuszny, R. (2021). The Double Face of Ketamine—The Possibility of Its Identification in Blood and Beverages. Molecules, 26(4), 813. https://doi.org/10.3390/molecules26040813