
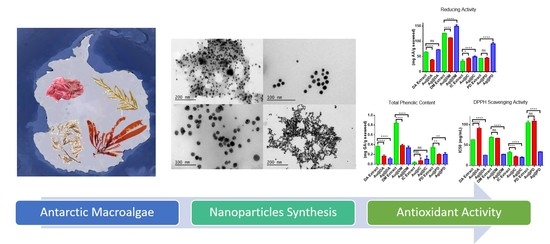
Evaluation of the Antioxidant Capacities of Antarctic Macroalgae and Their Use for Nanoparticles Production


Abstract
1. Introduction
2. Results and Discussion
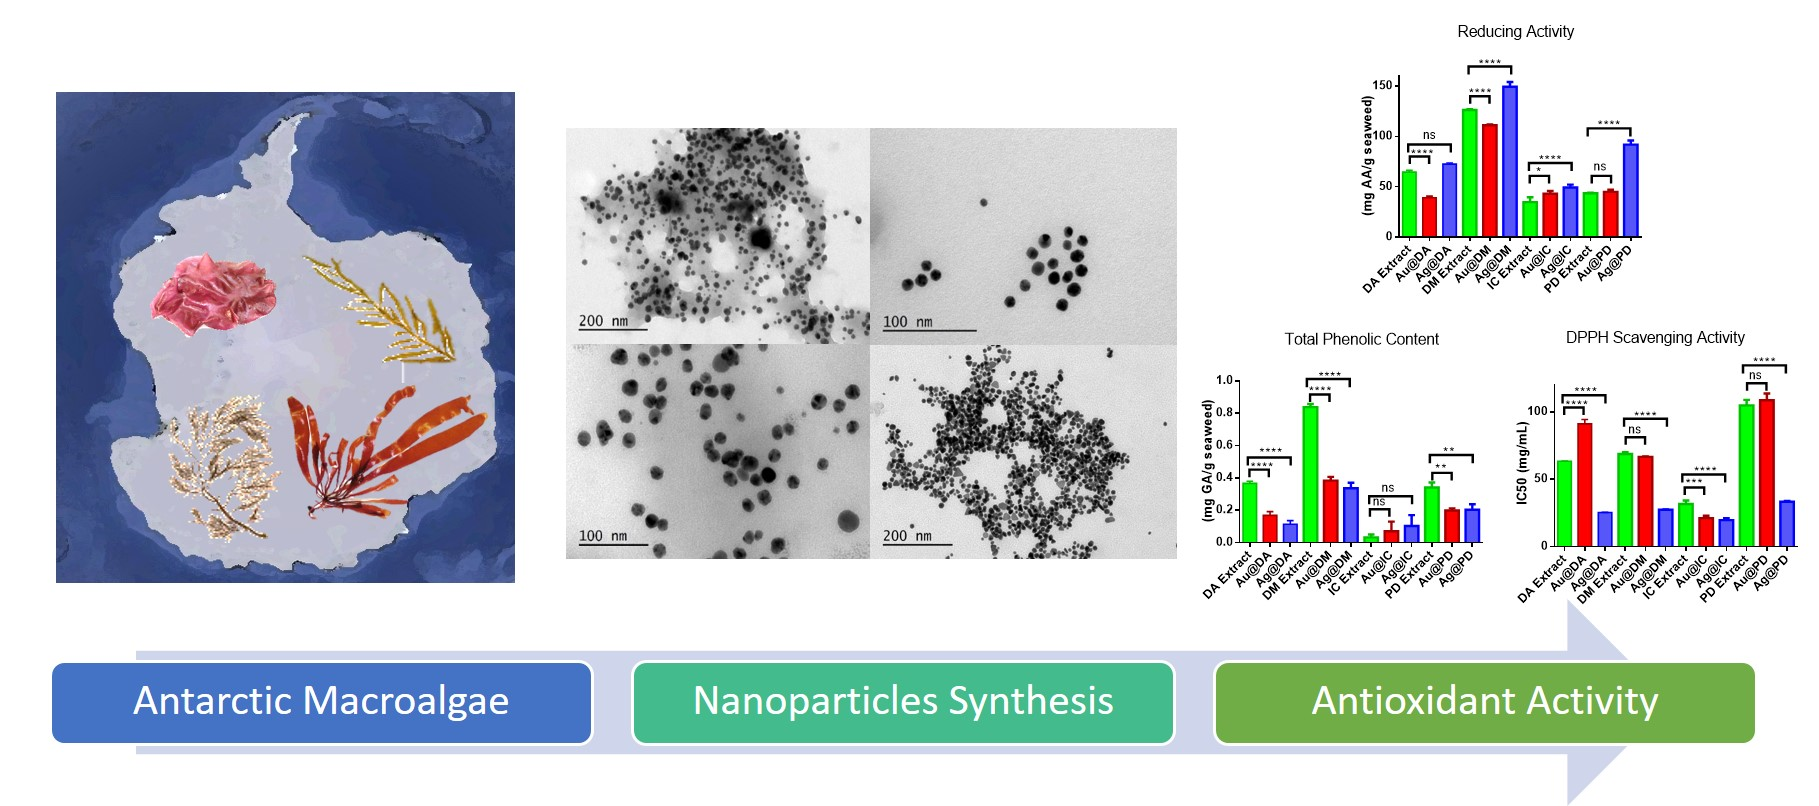
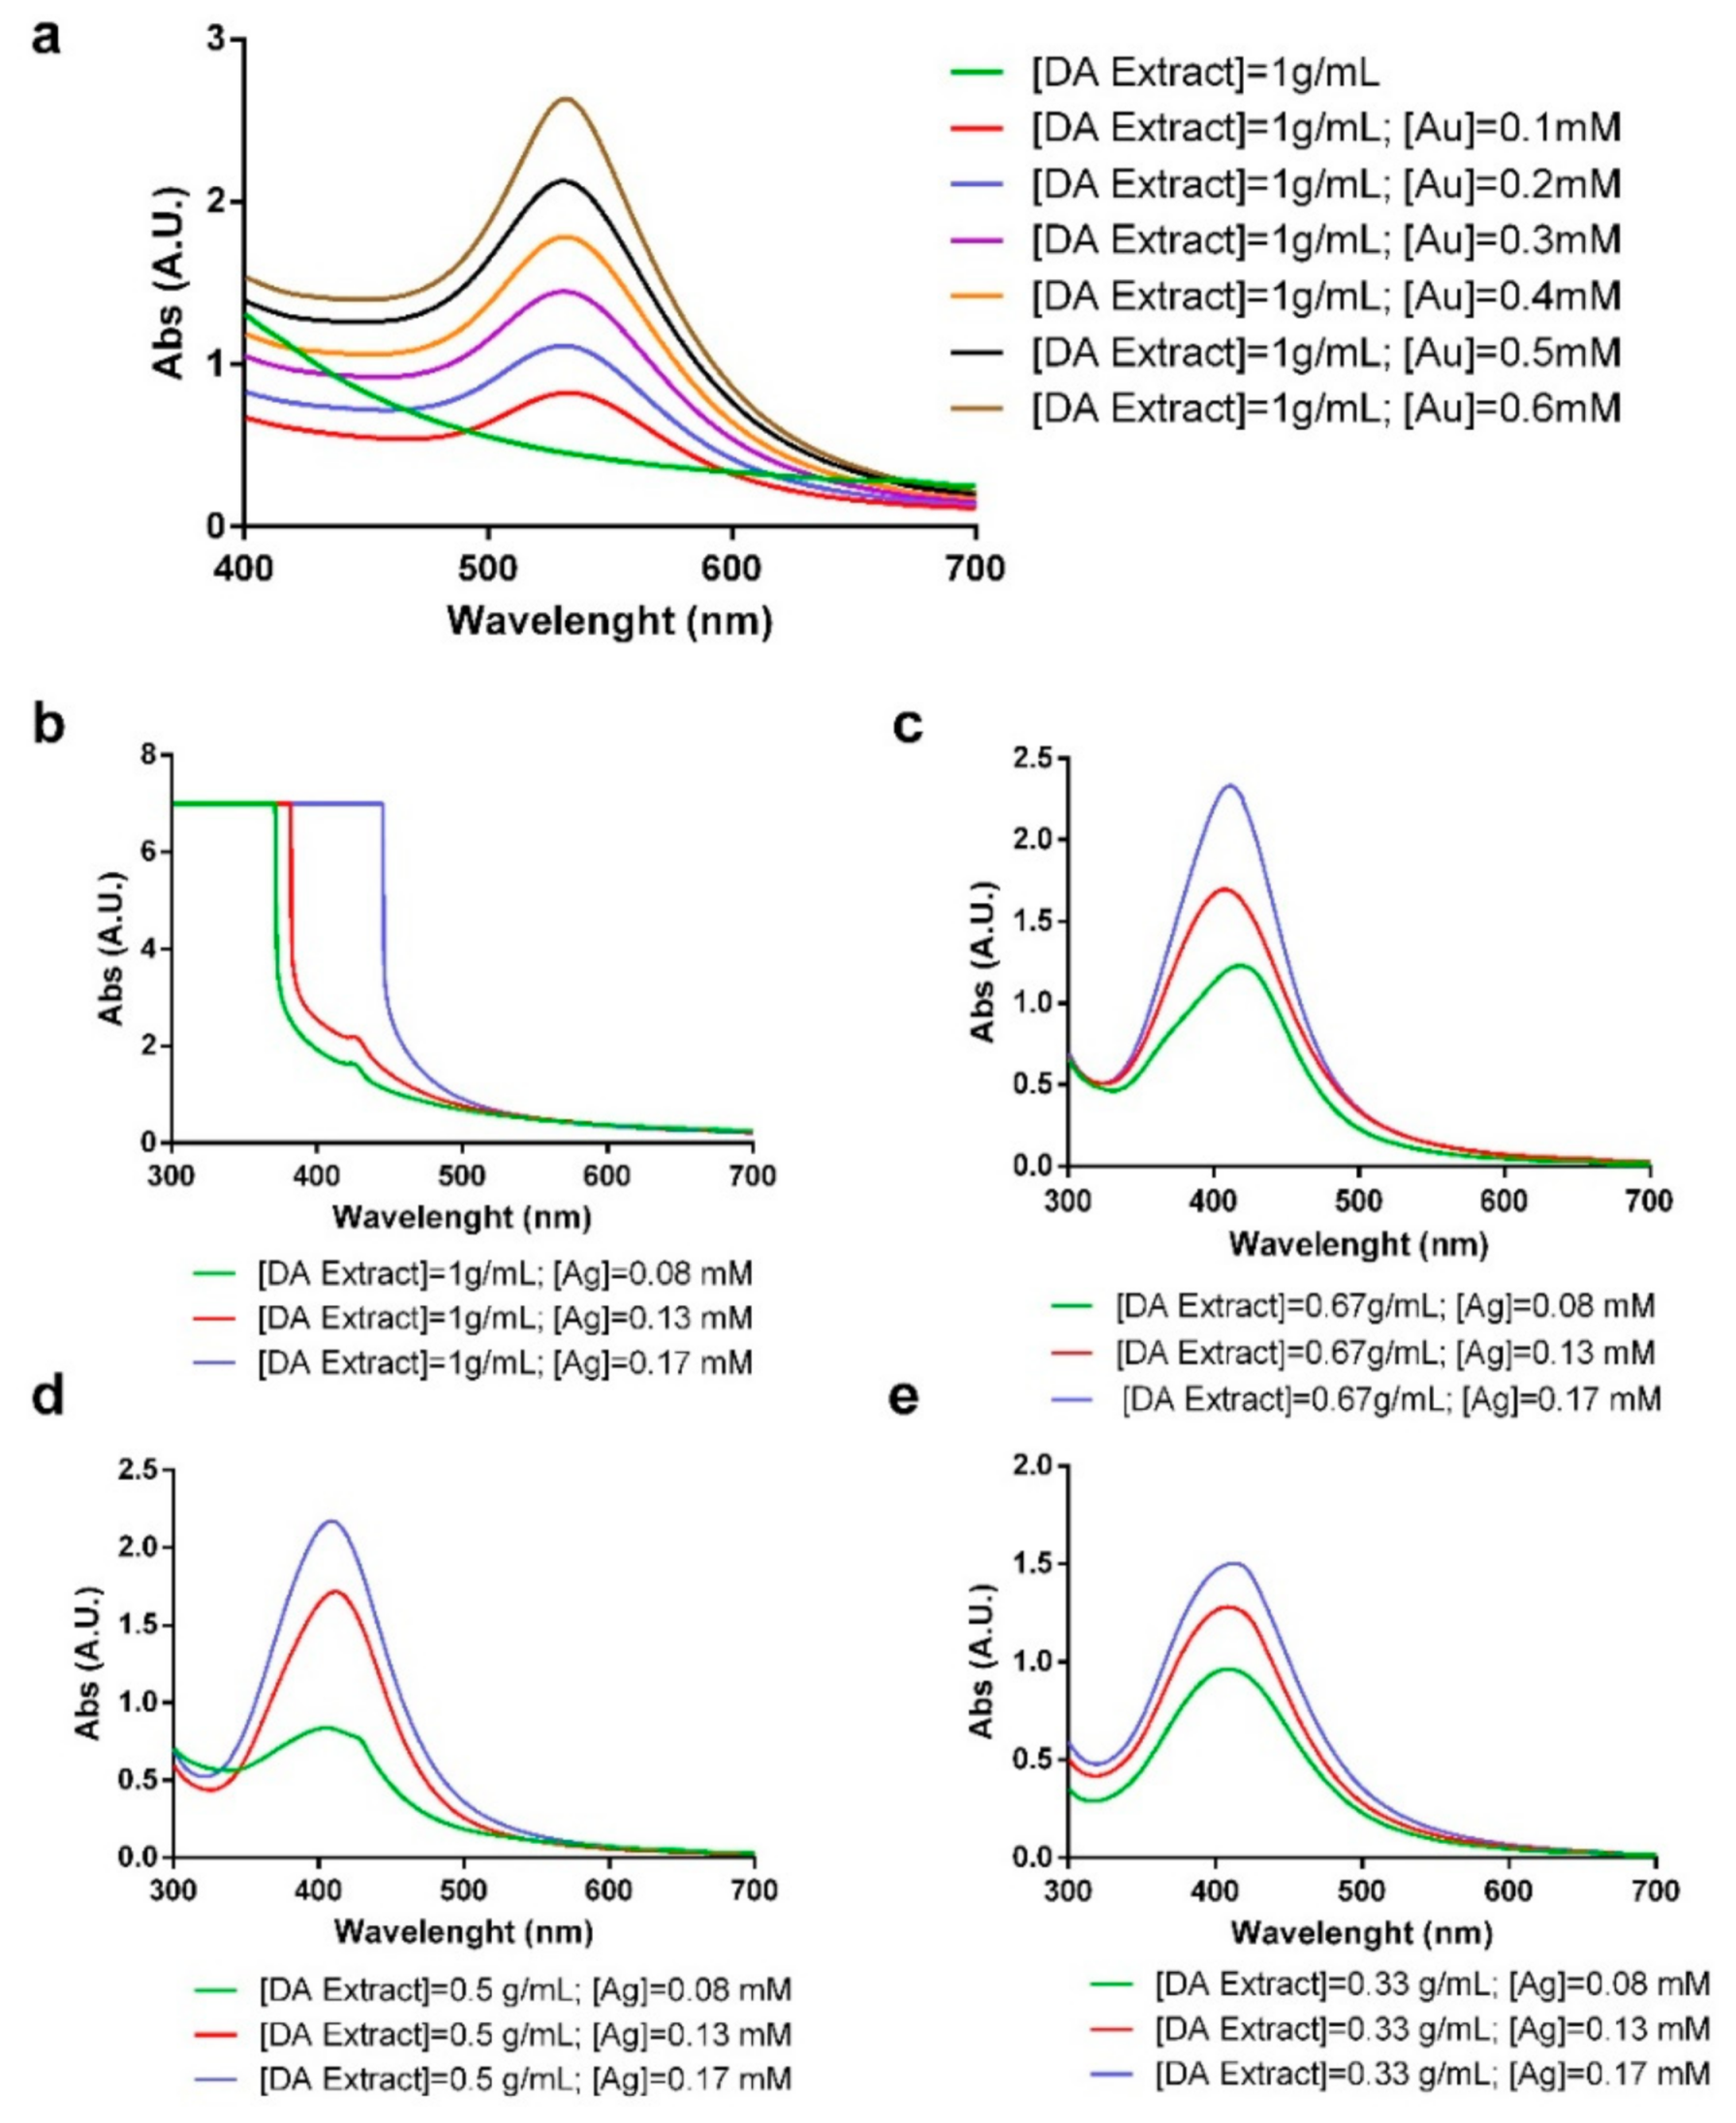
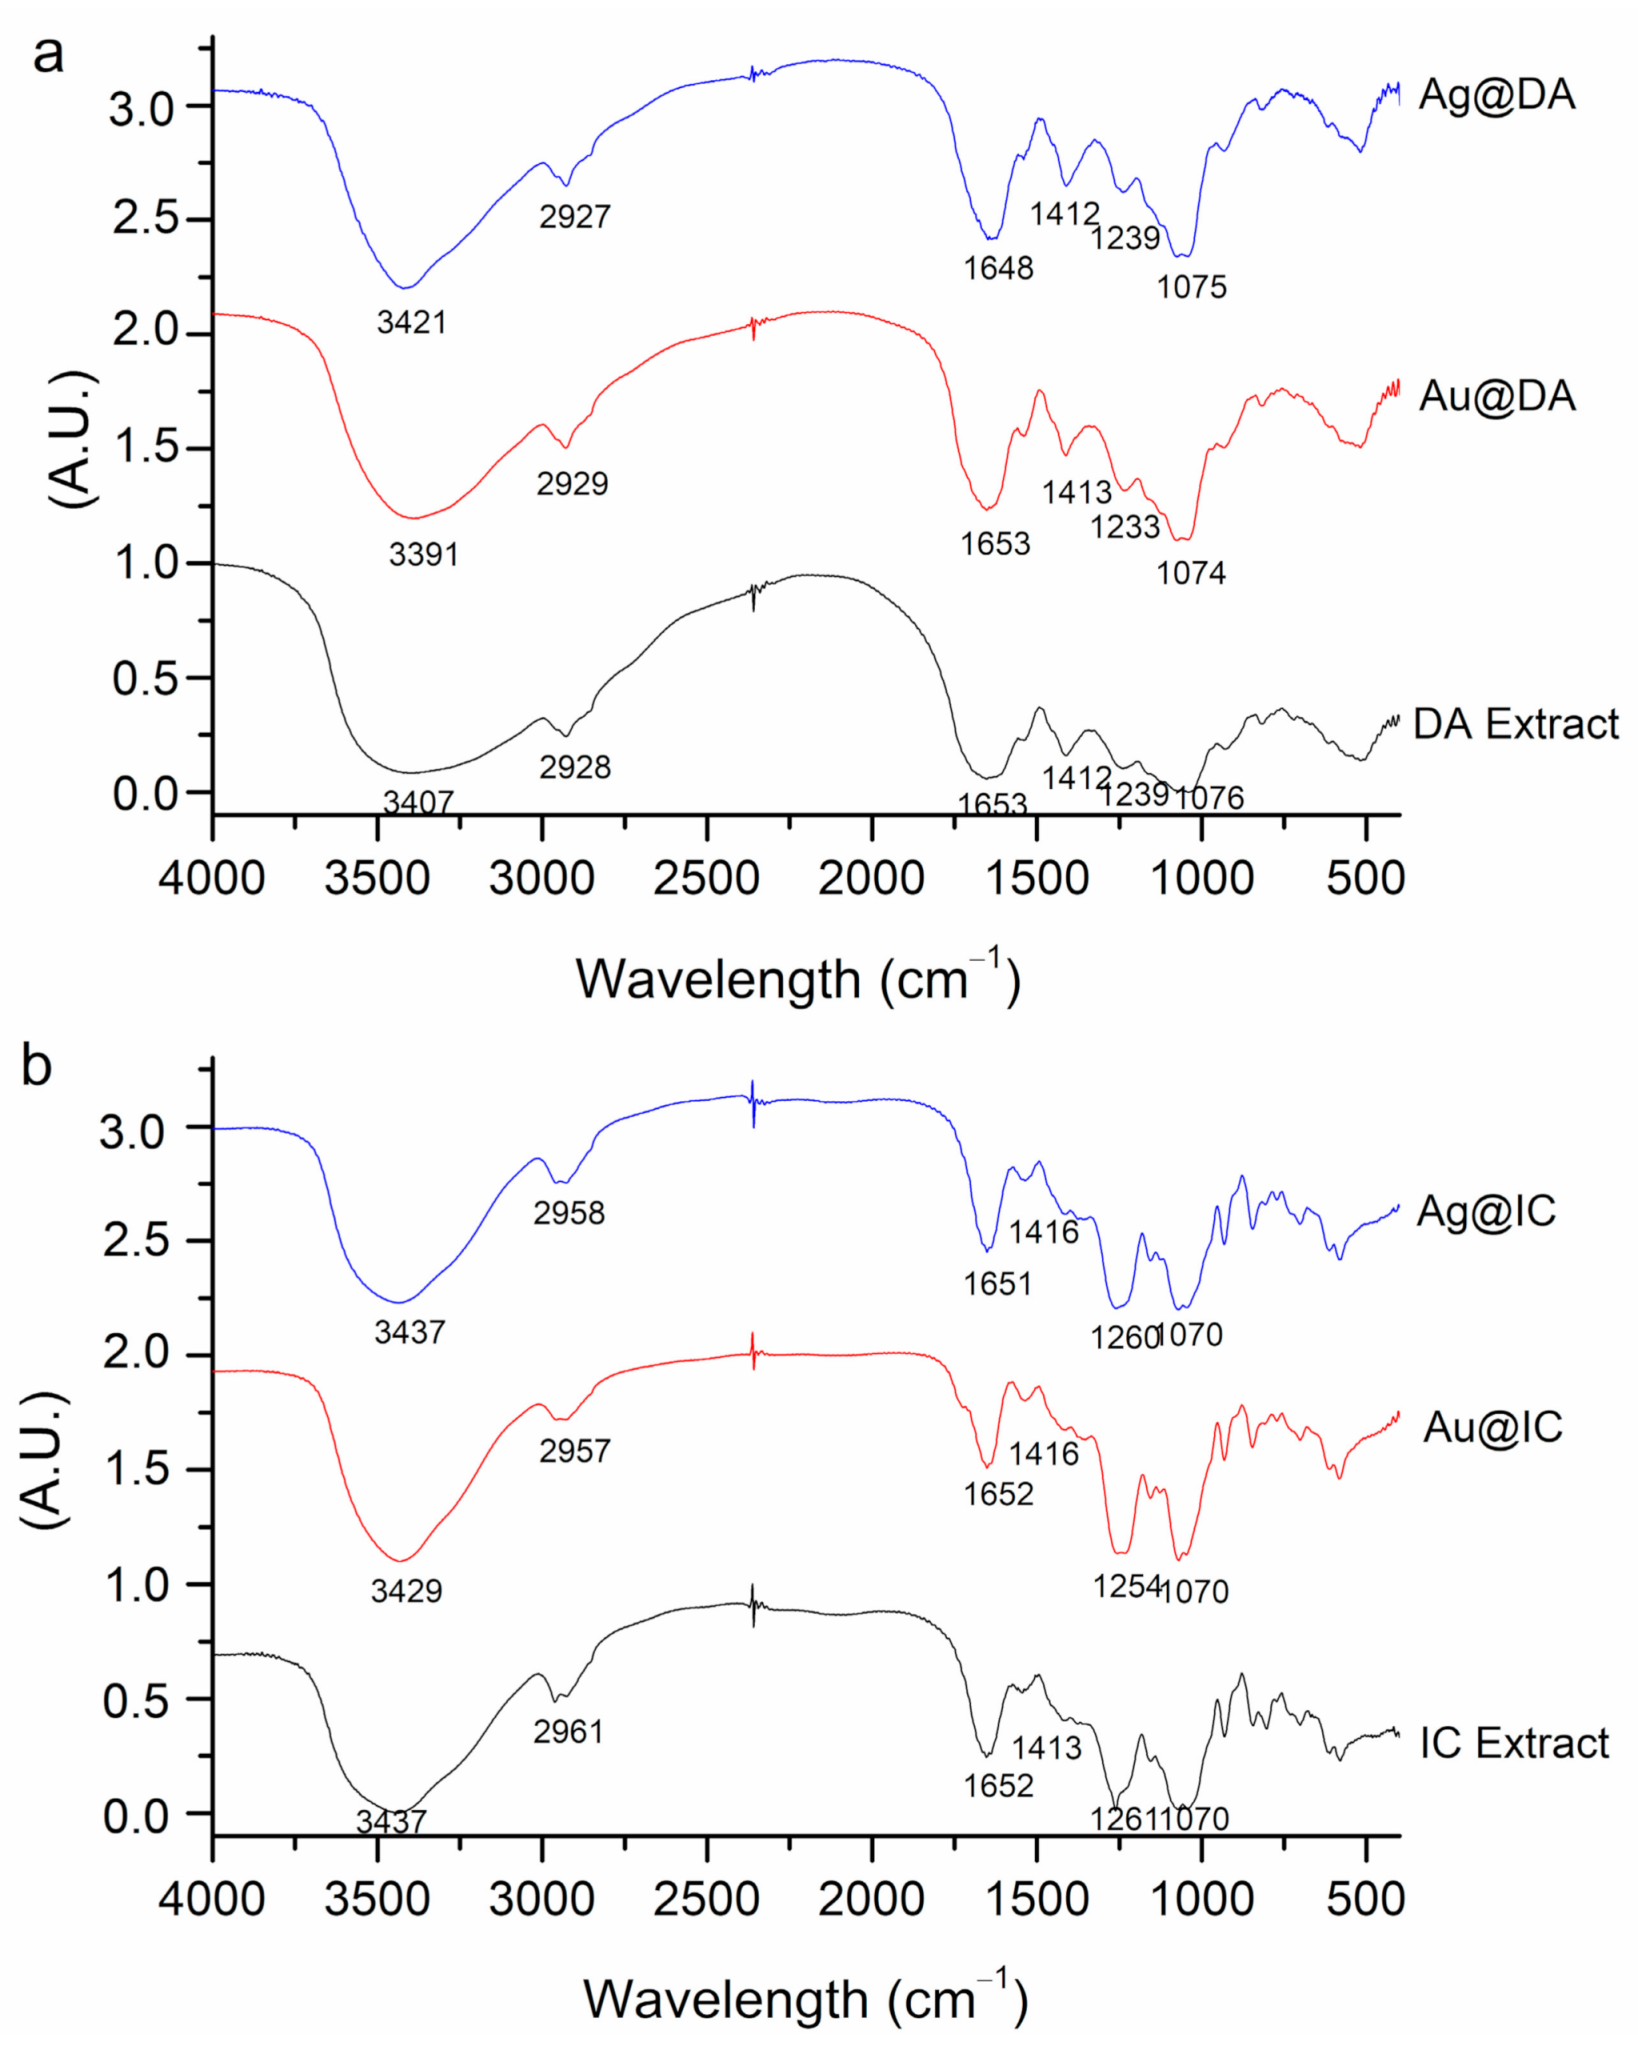
2.1. Synthesis and Characterization of Gold and Silver Nanoparticles
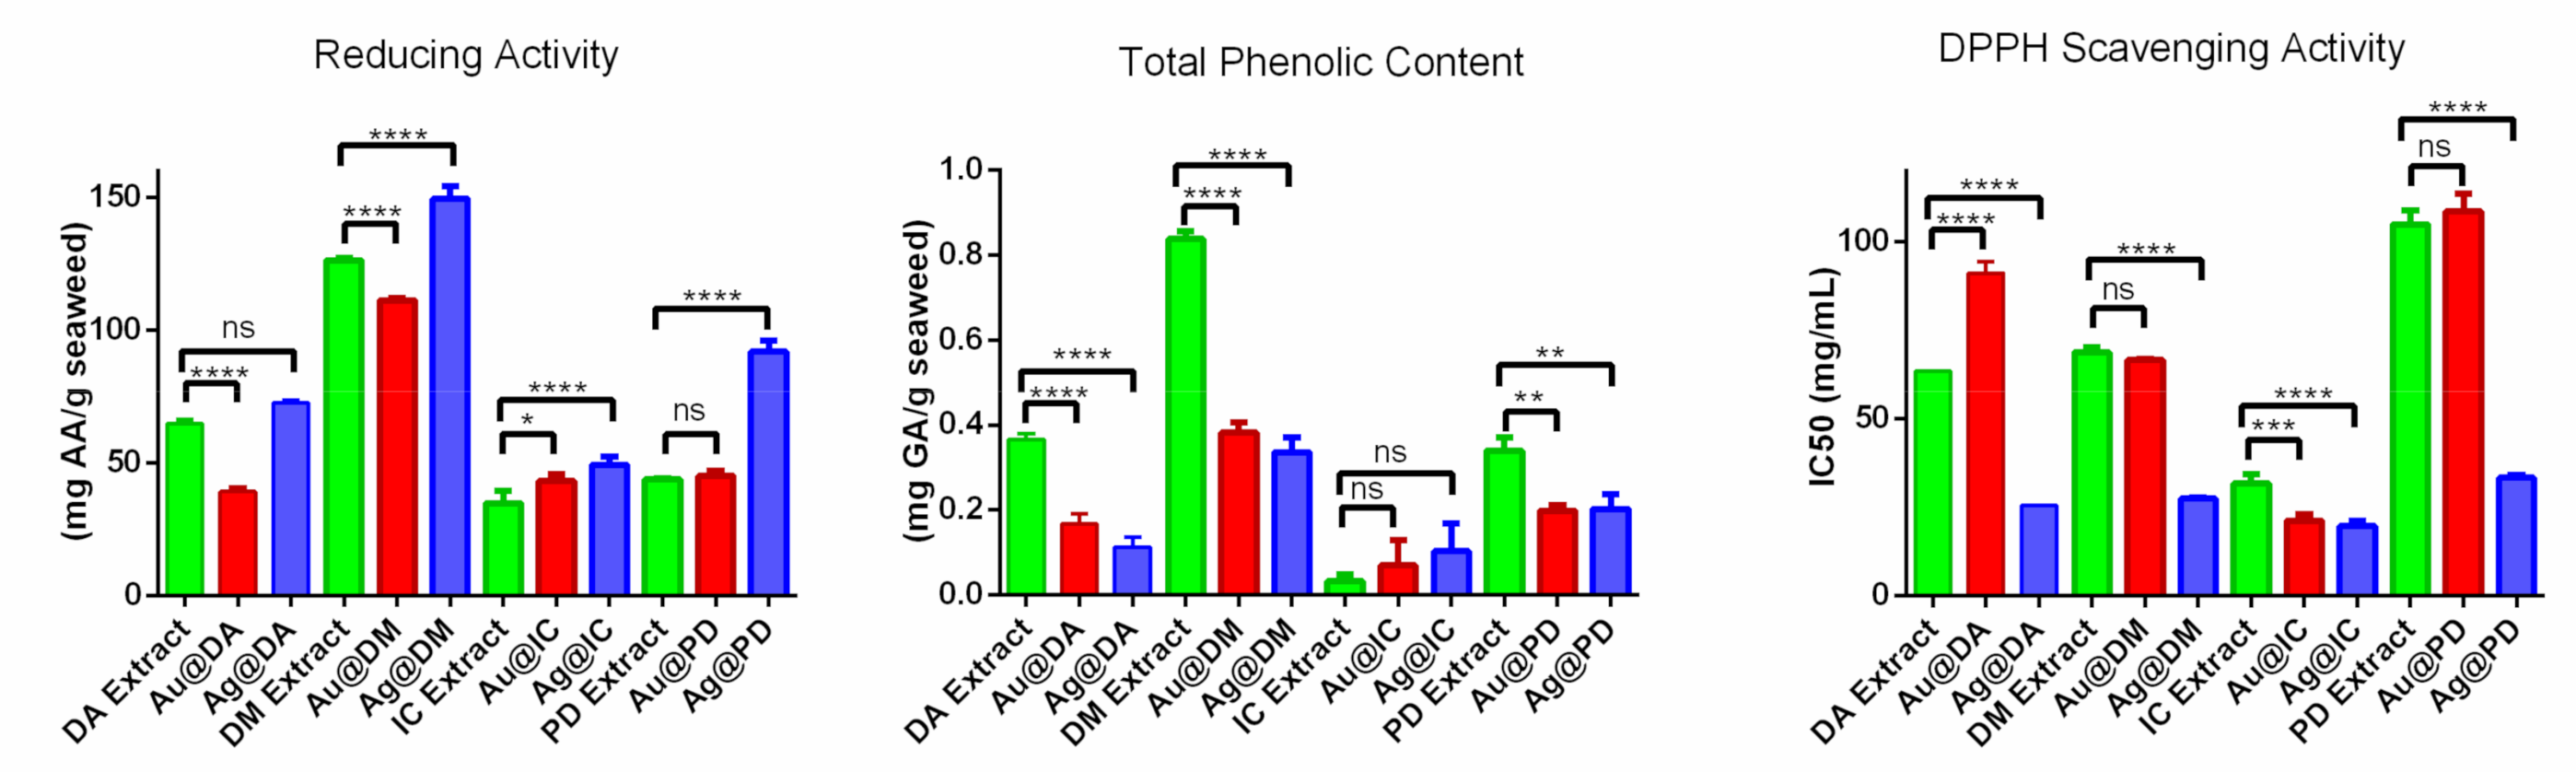
2.2. In Vitro Antioxidant Activity
3. Materials and Methods
3.1. Preparation of Aqueous Algae Extracts
3.2. Synthesis of Gold and Silver Nanoparticles
3.3. Characterization of Gold and Silver Nanoparticles
3.4. Evaluation of the Antioxidant Activity
3.5. Statistical Analysis
4. Conclusions
Author Contributions
Funding
Institutional Review Board Statement
Informed Consent Statement
Data Availability Statement
Conflicts of Interest
References
- Wulff, A.; Iken, K.; Quartino, M.L.; Al-Handal, A.; Wiencke, C.; Clayton, M.N. Biodiversity, biogeography and zonation of marine benthic micro-and macroalgae in the Arctic and Antarctic. Bot. Mar. 2009, 52, 491–509. [Google Scholar] [CrossRef]
- Clarke, A.; Crame, J.A. The origin of the Southern Ocean marine fauna. Geol. Soc. Lond. Spéc. Publ. 1989, 47, 253–268. [Google Scholar] [CrossRef]
- Thatje, S.; Hillenbrand, C.-D.; Larter, R. On the origin of Antarctic marine benthic community structure. Trends Ecol. Evol. 2005, 20, 534–540. [Google Scholar] [CrossRef] [PubMed]
- Rogers, A.D.; Murphy, E.J.; Jonhnson, N.M.; Clarke, A. Introduction. Antarctic Ecology: From Genes to the Ecosystem. Part 2. Evolution, Diversity and Functional Ecology. Phil. Trans. R. Soc. B 2007, 362, 2187–2189. [Google Scholar] [CrossRef]
- Quartino, M.L.; Boraso de Zaixo, A.L. Summer Macroalgal Biomass in Potter Cove, South Shetland Islands, Antarctica: Its Production and Flux to the Ecosystem. Polar Biol. 2008, 31, 281–294. [Google Scholar] [CrossRef]
- González-Ballesteros, N.; Prado-López, S.; Rodríguez-González, J.B.; Lastra-Valdor, M.; Rodríguez-Argüelles, M.C. Green Synthesis of Gold Nanoparticles using Brown Seaweed Cystoseira Baccata: Its Activity in Colon Cancer Cells. Colloids Surf. B Biointerfaces 2017, 153, 190–198. [Google Scholar] [CrossRef]
- Martins, R.M.; Nedel, F.; Guimarães, V.B.S.; Da Silva, A.F.; Colepicolo, P.; De Pereira, C.M.P.; Lund, R.G. Macroalgae Extracts From Antarctica Have Antimicrobial and Anticancer Potential. Front. Microbiol. 2018, 9, 412. [Google Scholar] [CrossRef]
- Vijayan, S.R.; Santhiyagu, P.; Ramasamy, R.; Arivalagan, P.; Kumar, G.; Ethiraj, K.; Ramaswamy, B.R. Seaweeds: A resource for marine bionanotechnology. Enzym. Microb. Technol. 2016, 95, 45–57. [Google Scholar] [CrossRef]
- González-Ballesteros, N.; Rodríguez-González, J.B.; Lastra-Valdor, M.; Rodríguez-Argüelles, M.C. New Application of Two Antarctic Macroalgae Palmaria Decipiens and Desmarestia menziesii in the Synthesis of Gold and Silver Nanoparticles. Polar Sci. 2018, 15, 49–54. [Google Scholar] [CrossRef]
- Billar, E.; Reyes, J.; Mansilla, A.; Faugeron, S.; Guillemin, S.L. Deep Genetic Divergence between Algal Populations of the Red Algae Gigartina Skottsbergii Reveals a Cryptic Species Endemic to the Antarctic Continent. Polar Biology 2015, 38, 2021–2034. [Google Scholar] [CrossRef]
- Quartino, M.L.; Zaixso, H.E.; De Zaixso, A.L.B. Biological and environmental characterization of marine macroalgal assemblages in Potter Cove, South Shetland Islands, Antarctica. Bot. Mar. 2005, 48, 187–197. [Google Scholar] [CrossRef]
- Escudero, L.B.; Smichowski, P.N.; Dotto, G.L. Macroalgae of Iridaea cordata as an efficient biosorbent to remove hazardous cationic dyes from aqueous solutions. Water Sci. Technol. 2017, 76, 3379–3391. [Google Scholar] [CrossRef] [PubMed]
- Foltran, A.; Maranzana, G.; Rascio, N.; Scarabel, L.; Talarico, L.; Andreoli, C. Iridaea cordata from Antarctica: An Ultrastructural, Cytochemical and Pigment Study. Bot. Mar. 1996, 39, 533–542. [Google Scholar] [CrossRef]
- Santos, M.A.Z.; Colepicolo, P.; Pupo, D.; Fujii, M.T.; De Pereira, C.M.P.; Mesko, M.F. Antarctic red macroalgae: A source of polyunsaturated fatty acids. J. Appl. Phycol. 2017, 29, 759–767. [Google Scholar] [CrossRef]
- Kim, H.J.; Kim, W.J.; Koo, B.-W.; Kim, D.-W.; Lee, J.H.; Nugroho, W.S.K. Anticancer Activity of Sulfated Polysaccharides Isolated from the Antarctic Red Seaweed Iridaea cordata. Ocean Polar Res. 2016, 38, 129–137. [Google Scholar] [CrossRef]
- Amsler, C.; Iken, K.; McClintock, J.; Amsler, M.; Peters, K.; Hubbard, J.; Furrow, F.; Baker, B. Comprehensive evaluation of the palatability and chemical defenses of subtidal macroalgae from the Antarctic Peninsula. Mar. Ecol. Prog. Ser. 2005, 294, 141–159. [Google Scholar] [CrossRef]
- Pereira, C.M.P.; Nunes, C.F.P.; Zambotti-Villela, L.; Streit, N.M.; Dias, D.; Pinto, E.; Gomes, C.B.; Colepicolo, P. Extraction of sterols in brown macroalgae from Antarctica and their identification by liquid chromatography coupled with tandem mass spectrometry. Environ. Boil. Fishes 2017, 29, 751–757. [Google Scholar] [CrossRef]
- Stolpe, U.; Wiencke, C.; Clayton, M.; Lehmann, H. Life History, Morphology and Development of a Ligulate Desmarestia Species from Southernmost Chile. Br. Phycol. J. 1991, 26, 235–245. [Google Scholar] [CrossRef]
- Qin, L.; Zeng, G.; Lai, C.; Huang, D.; Xu, P.; Zhang, C.; Cheng, M.; Liu, X.; Liu, S.; Li, B.; et al. “Gold rush” in modern science: Fabrication strategies and typical advanced applications of gold nanoparticles in sensing. Coord. Chem. Rev. 2018, 359, 1–31. [Google Scholar] [CrossRef]
- Prado-López, S.; González-Ballesteros, N.; Rodríguez-Argüelles, M.C. Nanometals in Cancer Diagnosis and Therapy. In Biomaterials in Clinical Practice; Zivic, F., Affatato, S., Trajanovic, M., Schnabelrauch, M., Grujovic, N., Choy, K.L., Eds.; Springer: Cham, Switzerland, 2018; pp. 407–428. [Google Scholar]
- Fahmy, H.M.; Saad, O.A.; Rashed, H.A.; Hessen, O.E.; Elgamal, K.H.; Aboelfetouh, M.M. Alternative Green Chemistry Methods of Silver Nanoparticles Synthesis: Review and Comparison. J. Bionanosci. 2017, 11, 7–16. [Google Scholar] [CrossRef]
- Khan, S.U.; Saleh, T.A.; Wahab, A.; Khan, M.H.U.; Khan, D.; Khan, W.U.; Rahim, A.; Kamal, S.; Khan, F.U.; Fahad, S. Nanosilver: New ageless and versatile biomedical therapeutic scaffold. Int. J. Nanomed. 2018, 13, 733–762. [Google Scholar] [CrossRef] [PubMed]
- Medici, S.; Peana, M.F.; Nurchi, V.M.; Zoroddu, M.A. Medical Uses of Silver: History, Myths, and Scientific Evidence. J. Med. Chem. 2019, 62, 5923–5943. [Google Scholar] [CrossRef]
- Khalil, I.; Yehye, W.A.; Etxeberria, A.E.; Alhadi, A.A.; Dezfooli, S.M.; Julkapli, N.B.M.; Basirun, W.J.; Seyfoddin, A. Nanoantioxidants: Recent Trends in Antioxidant Delivery Applications. Antioxidants 2020, 9, 24. [Google Scholar] [CrossRef]
- Kang, S.; Kang, K.; Chae, A.; Kim, Y.-K.; Jang, H.; Min, D.-H. Fucoidan-coated coral-like Pt nanoparticles for computed tomography-guided highly enhanced synergistic anticancer effect against drug-resistant breast cancer cells. Nanoscale 2019, 11, 15173–15183. [Google Scholar] [CrossRef] [PubMed]
- Nurakhmetova, Z.A.; Azhkeyeva, A.N.; Klassen, I.A.; Tatykhanova, G.S. Synthesis and Stabilization of Gold Nanoparticles Using Water-Soluble Synthetic and Natural Polymers. Polymers 2020, 12, 2625. [Google Scholar] [CrossRef] [PubMed]
- Bhattacharjee, S. DLS and zeta potential—What they are and what they are not? J. Control. Release 2016, 235, 337–351. [Google Scholar] [CrossRef]
- Martínez-Gómez, F.; Mansilla, A.; Matsuhiro, B.; Matulewicz, M.C.; Troncoso-Valenzuela, M.A. Chiroptical characterization of homopolymeric block fractions in alginates. Carbohydr. Polym. 2016, 146, 90–101. [Google Scholar] [CrossRef]
- Leal, D.; Matsuhiro, B.; Rossi, M.; Caruso, F. FT-IR spectra of alginic acid block fractions in three species of brown seaweeds. Carbohydr. Res. 2008, 343, 308–316. [Google Scholar] [CrossRef]
- Guarín, J.R.; Moreno-Pirajan, J.C.; Giraldo, L. Kinetic Study of the Bioadsorption of Methylene Blue on the Surface of the Biomass Obtained from the Algae D. antarctica. J. Chem. 2018, 2018, 1–12. [Google Scholar] [CrossRef]
- Fernández, P.V.; Ciancia, M.; Estevez, J.M. Cell Wall Variability in the Green Seaweed Codium Vermilara (Bryopsidales Chlorophyta) from the Argentine Coast.T1. J. Phycol. 2011, 47, 802–810. [Google Scholar] [CrossRef]
- Balavandy, S.K.; Shameli, K.; Abidin, Z.Z. Rapid and Green Synthesis of Silver Nanoparticles Via Sodium Alginate Media. Int. J. Elecrochem. Sci. 2015, 10, 486–497. [Google Scholar]
- Dhas, T.S.; Kumar, V.G.; Abraham, L.S.; Karthick, V.; Govindaraju, K. Sargassum myriocystum mediated biosynthesis of gold nanoparticles. Spectrochim. Acta Part A: Mol. Biomol. Spectrosc. 2012, 99, 97–101. [Google Scholar] [CrossRef]
- Devi, J.S.; Bhimba, B.V. Anticancer Activity of Silver Nanoparticles Synthesized by the Seaweed Ulva Lactuca in Vitro. Open Acces Sci. Rep. 2012, 2, 1–5. [Google Scholar]
- De Souza, M.C.R.; Marques, C.T.; Dore, C.M.G.; Da Silva, F.R.F.; Rocha, H.A.O.; Leite, E.L. Antioxidant activities of sulfated polysaccharides from brown and red seaweeds. J. Appl. Phycol. 2006, 19, 153–160. [Google Scholar] [CrossRef]
- Indu, H.; Seenivasan, R. In Vitro Antioxidant Activity of Selected Seaweeds from Southeast Coast of India. Int. J. Pharm. Pharm. Sci. 2013, 5, 474–484. [Google Scholar]
- Barahona, T.; Encinas, M.V.; Imarai, M.; Mansilla, A.; Matsuhiro, B.; Torres, R.; Valenzuela, B. Bioactive polysaccharides from marine algae. Bioact. Carbohydr. Diet. Fibre 2014, 4, 125–138. [Google Scholar] [CrossRef]
- Fairhead, V.A.; Amsler, C.D.; McClintock, J.B.; Baker, B.J. Lack of Defense or Phlorotannin Induction by UV Radiation or Mesograzers in Desmarestia Anceps and D. Menziesii (Phaeophyceae). J. Phycol. 2006, 42, 1174–1183. [Google Scholar] [CrossRef]
- Becker, S.; Quartino, M.L.; Campana, G.L.; Bucolo, P.; Wiencke, C.; Bischof, K. The biology of an Antarctic rhodophyte, Palmaria decipiens: Recent advances. Antarct. Sci. 2011, 23, 419–430. [Google Scholar] [CrossRef]
- Dhargalkar, V.K.; Bhosle, N.B. Hydrocarbons in benthic marine algae of the Vestfold Hills, Antarctica. Bull. Environ. Contam. Toxicol. 1987, 38, 313–317. [Google Scholar] [CrossRef]
- Graeve, M.; Kattner, G.; Wiencke, C.; Karsten, U. Fatty acid composition of Arctic and Antarctic macroalgae: Indicator of phylogenetic and trophic relationships. Mar. Ecol. Prog. Ser. 2002, 231, 67–74. [Google Scholar] [CrossRef]
- Iken, K.; Amsler, C.D.; Amsler, M.O.; McClintock, J.B.; Baker, B.J. Field studies on deterrent properties of phlorotannins in Antarctic brown algae. Bot. Mar. 2009, 52, 547–557. [Google Scholar] [CrossRef]
- González-Ballesteros, N.; Rodríguez-González, J.; Rodríguez-Argüelles, M. Harnessing the wine dregs: An approach towards a more sustainable synthesis of gold and silver nanoparticles. J. Photochem. Photobiol. B Biol. 2018, 178, 302–309. [Google Scholar] [CrossRef] [PubMed]


| Algae | [Extract] (g/mL) | [Ag] (mM) | [Au] (mM) | T (°C) | T (h) | SPR λmax (nm) | Code |
|---|---|---|---|---|---|---|---|
| D. antarctica | 0.25 | 0.17 | - | 100 | 1 | 417 | Ag@DA |
| 1 | - | 0.4 | RT | 15 | 532 | Au@DA | |
| I. cordata | 0.2 | 0.17 | - | 100 | 1 | 418 | Ag@IC |
| 0.13 | - | 0.5 | RT | 40 | 539 | Au@IC |
| Sample | pH | T (°C) | Z Potential (mV) |
|---|---|---|---|
| D. antarctica | 6.17 | 25 | - |
| Au@DA | 5.05 | 25 | −42.4 ± 2.4 |
| Ag@DA | 5.96 | 25 | −50.7 ± 2.3 |
| I. cordata | 7.30 | 25 | - |
| Au@IC | 3.87 | 25 | −58.9 ± 1.5 |
| Ag@IC | 6.17 | 25 | −45.6 ± 1.1 |
| Extract/Water Ratio | [Ag] (mM) | [Au] (mM) |
|---|---|---|
| 1:0 | 0.08–0.17 | 0.1–0.5 |
| 0.75:0.25 | ||
| 0.5:0.5 | ||
| 0.25:0.75 |
Publisher’s Note: MDPI stays neutral with regard to jurisdictional claims in published maps and institutional affiliations. |
© 2021 by the authors. Licensee MDPI, Basel, Switzerland. This article is an open access article distributed under the terms and conditions of the Creative Commons Attribution (CC BY) license (http://creativecommons.org/licenses/by/4.0/).
Share and Cite
González-Ballesteros, N.; Rodríguez-Argüelles, M.C.; Lastra-Valdor, M. Evaluation of the Antioxidant Capacities of Antarctic Macroalgae and Their Use for Nanoparticles Production. Molecules 2021, 26, 1182. https://doi.org/10.3390/molecules26041182
González-Ballesteros N, Rodríguez-Argüelles MC, Lastra-Valdor M. Evaluation of the Antioxidant Capacities of Antarctic Macroalgae and Their Use for Nanoparticles Production. Molecules. 2021; 26(4):1182. https://doi.org/10.3390/molecules26041182
Chicago/Turabian StyleGonzález-Ballesteros, N., M. C. Rodríguez-Argüelles, and M. Lastra-Valdor. 2021. "Evaluation of the Antioxidant Capacities of Antarctic Macroalgae and Their Use for Nanoparticles Production" Molecules 26, no. 4: 1182. https://doi.org/10.3390/molecules26041182
APA StyleGonzález-Ballesteros, N., Rodríguez-Argüelles, M. C., & Lastra-Valdor, M. (2021). Evaluation of the Antioxidant Capacities of Antarctic Macroalgae and Their Use for Nanoparticles Production. Molecules, 26(4), 1182. https://doi.org/10.3390/molecules26041182