
Separation and Quantification of Selected Sapogenins Extracted from Nettle, White Dead-Nettle, Common Soapwort and Washnut


Abstract
:1. Introduction
2. Results and Discussion
2.1. Antioxidant Activity of Investigated Plants
2.2. Separation of Plant Extract Components Using TLC Analysis
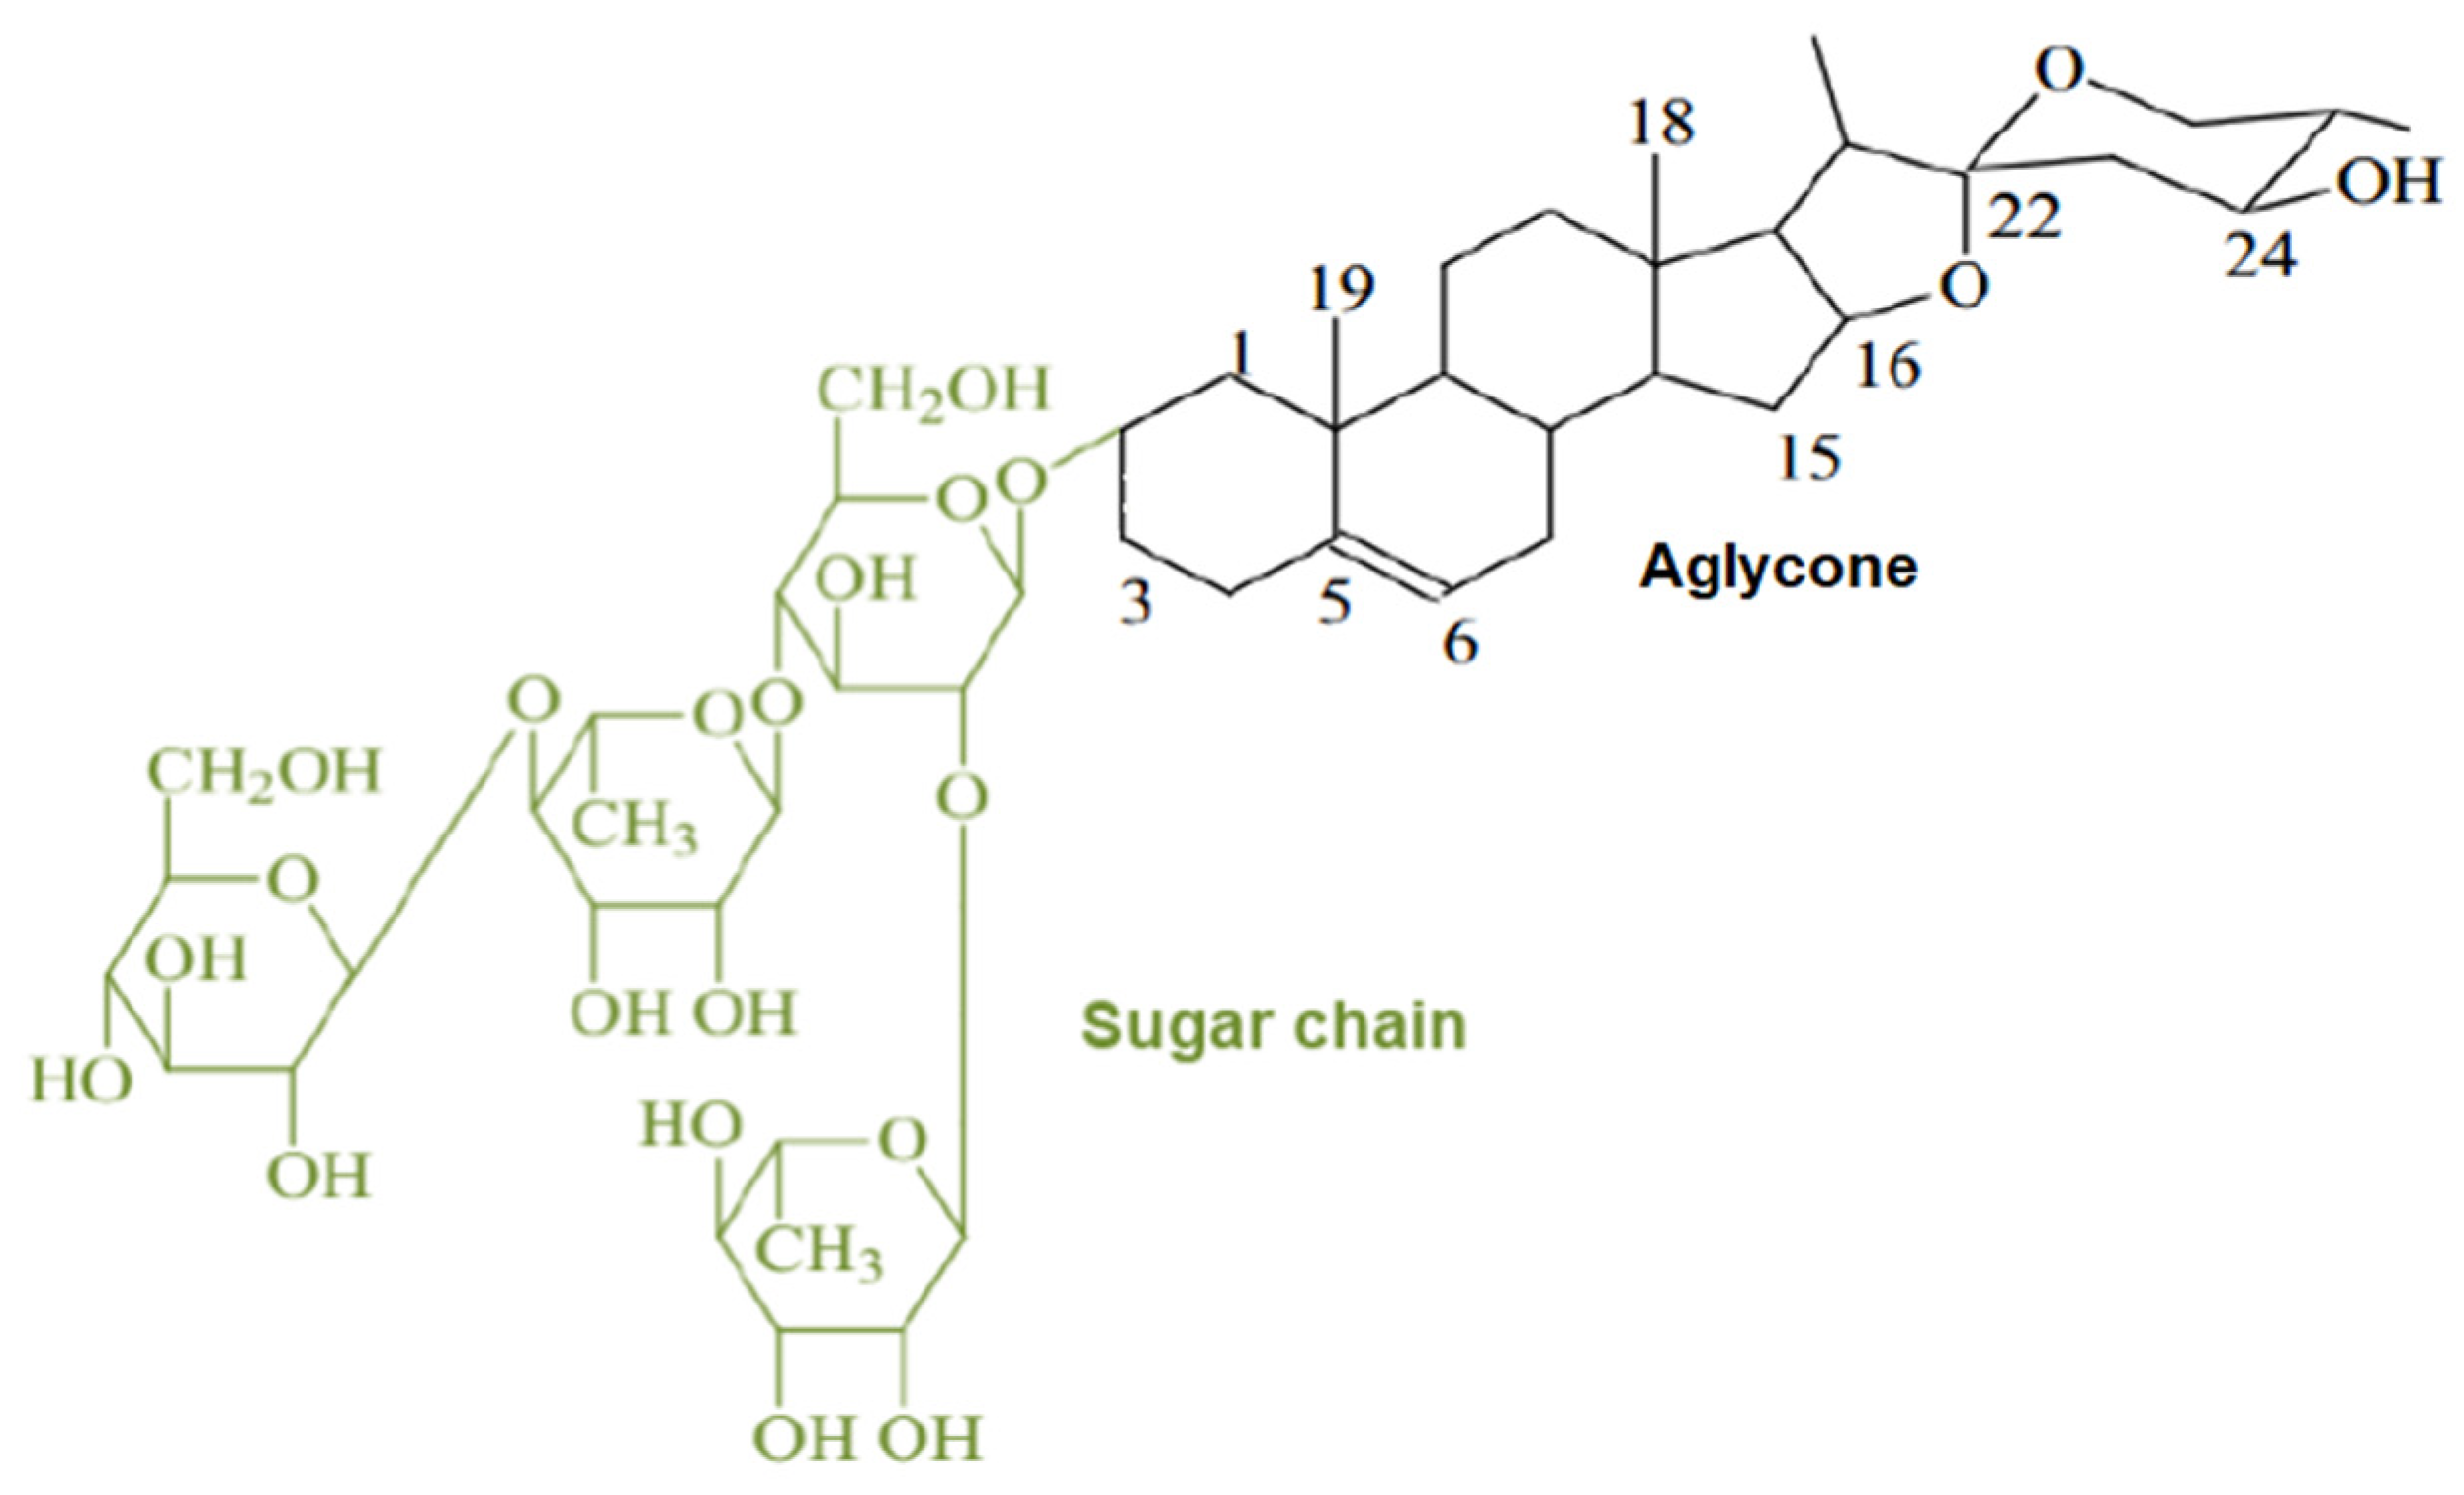
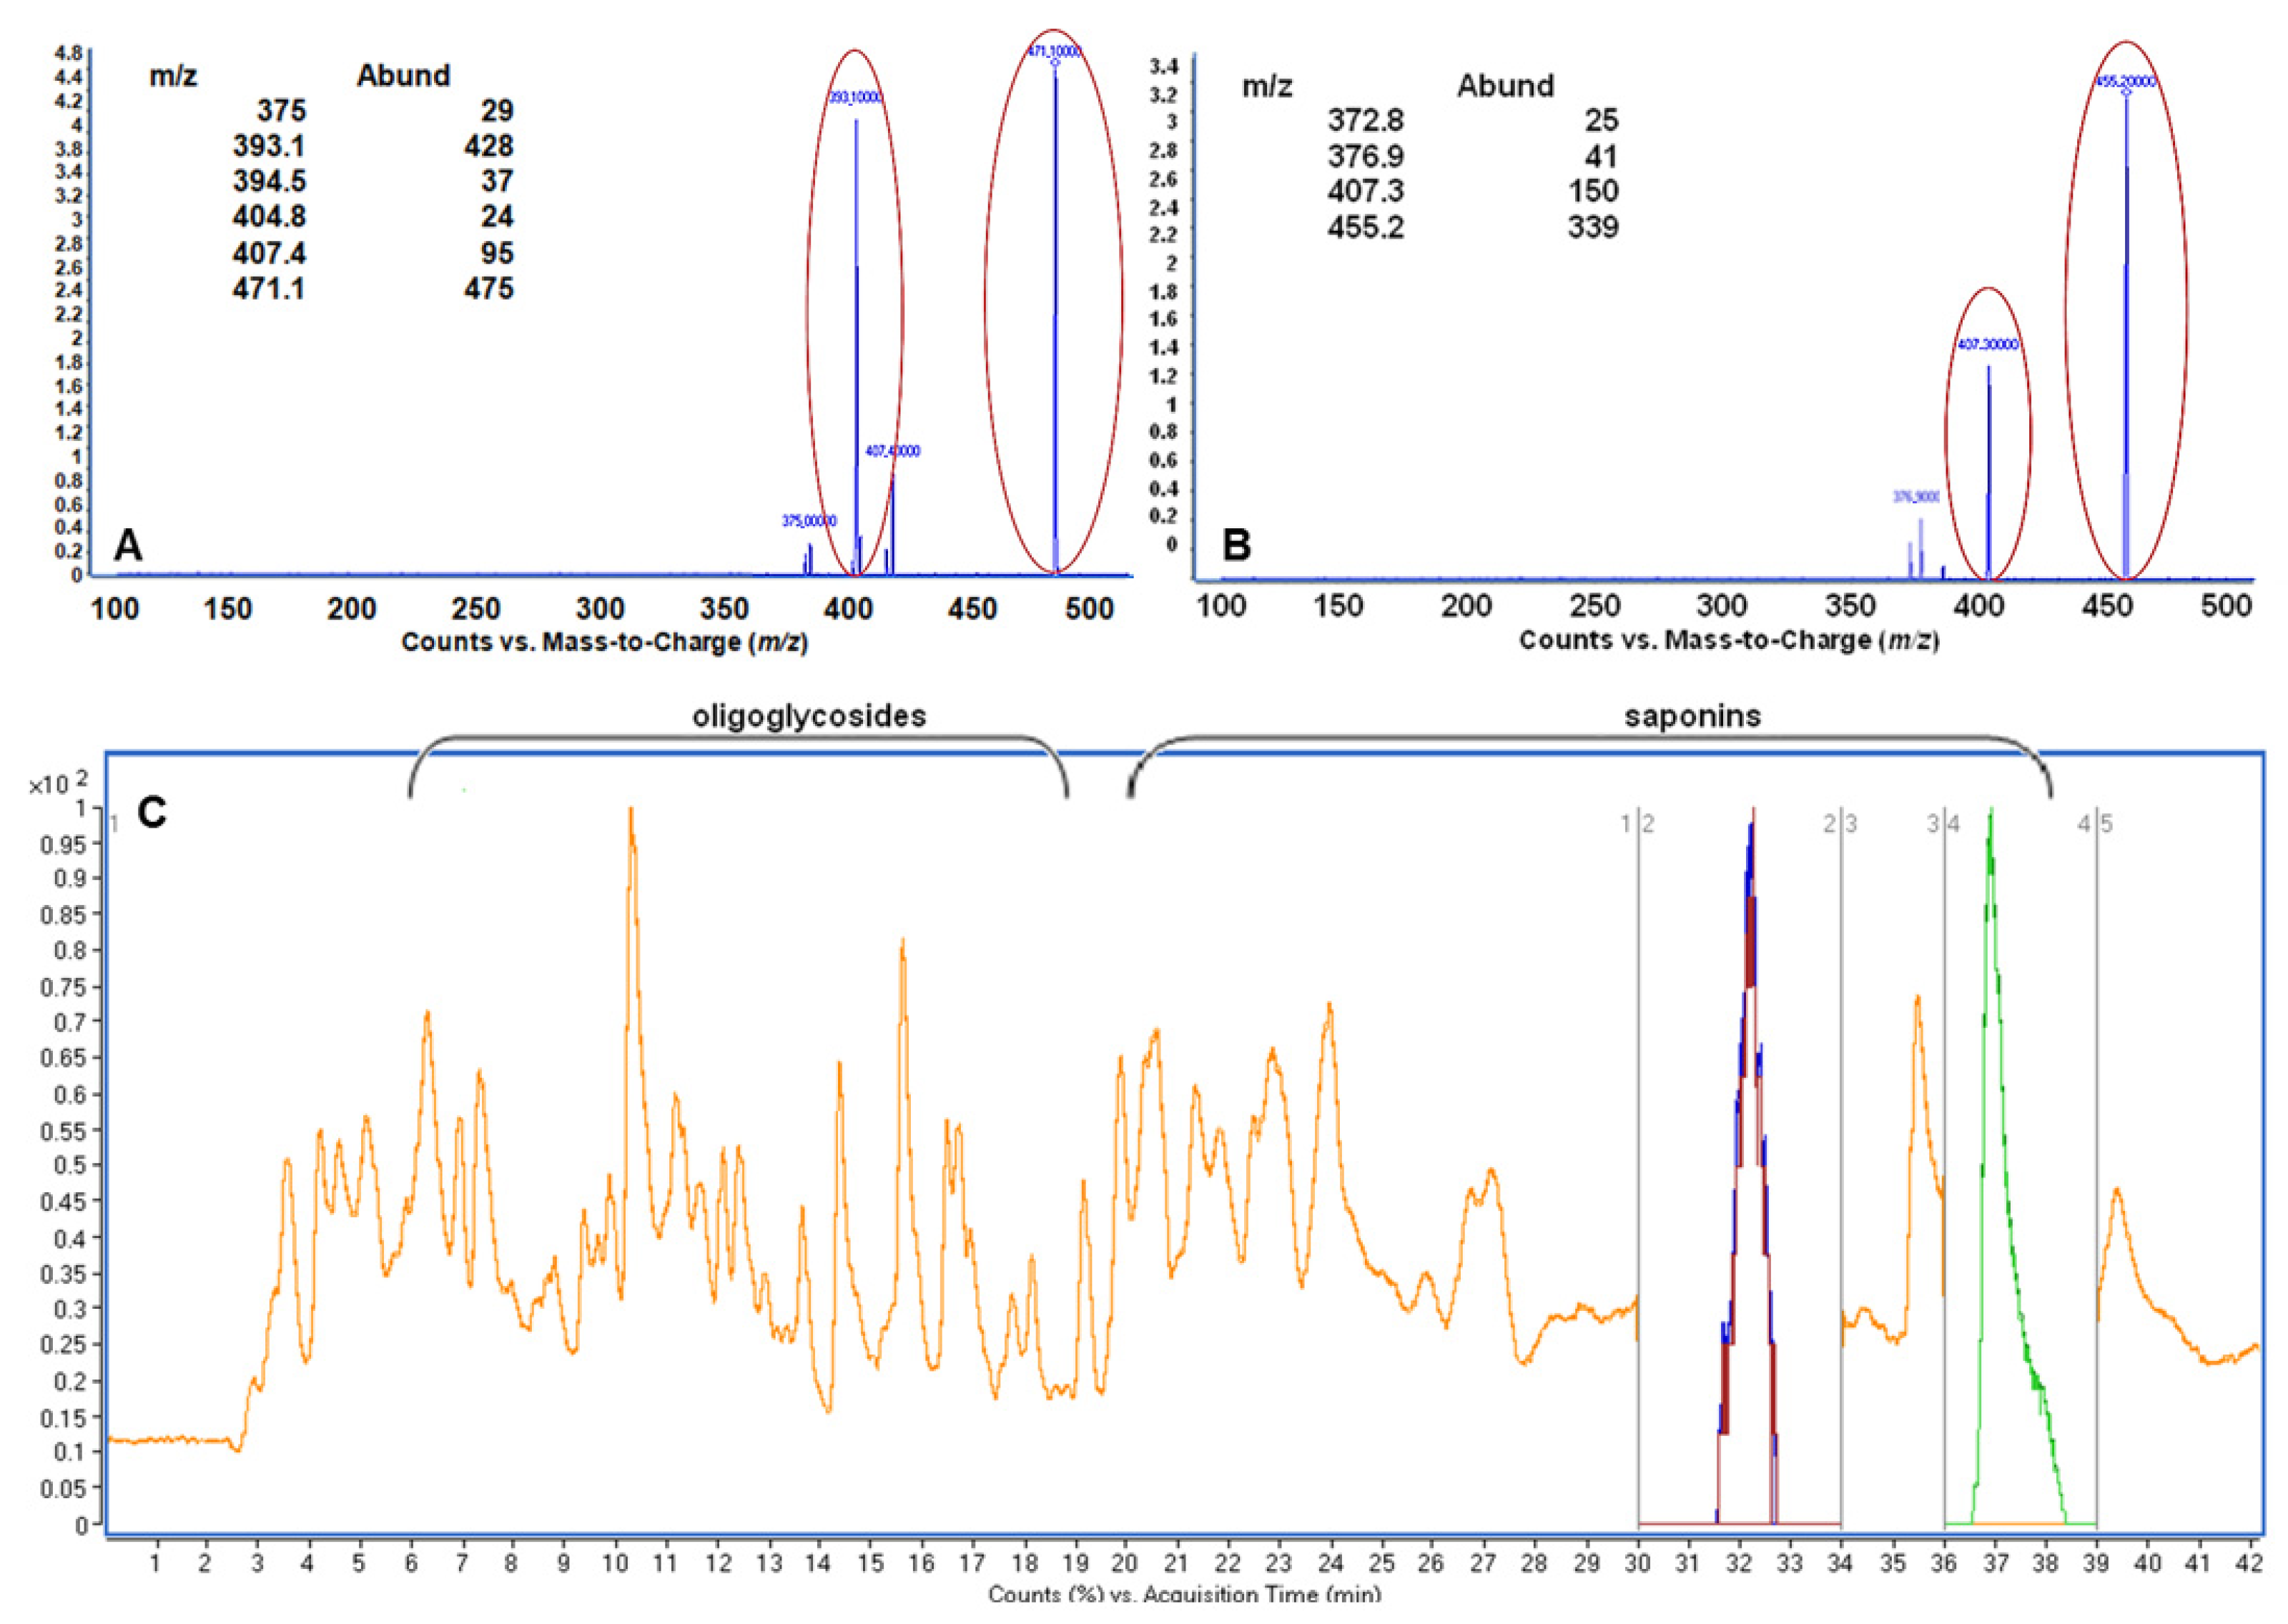
2.3. Qualitative Analysis by Means of LC/MS of the Most Abundant Targets
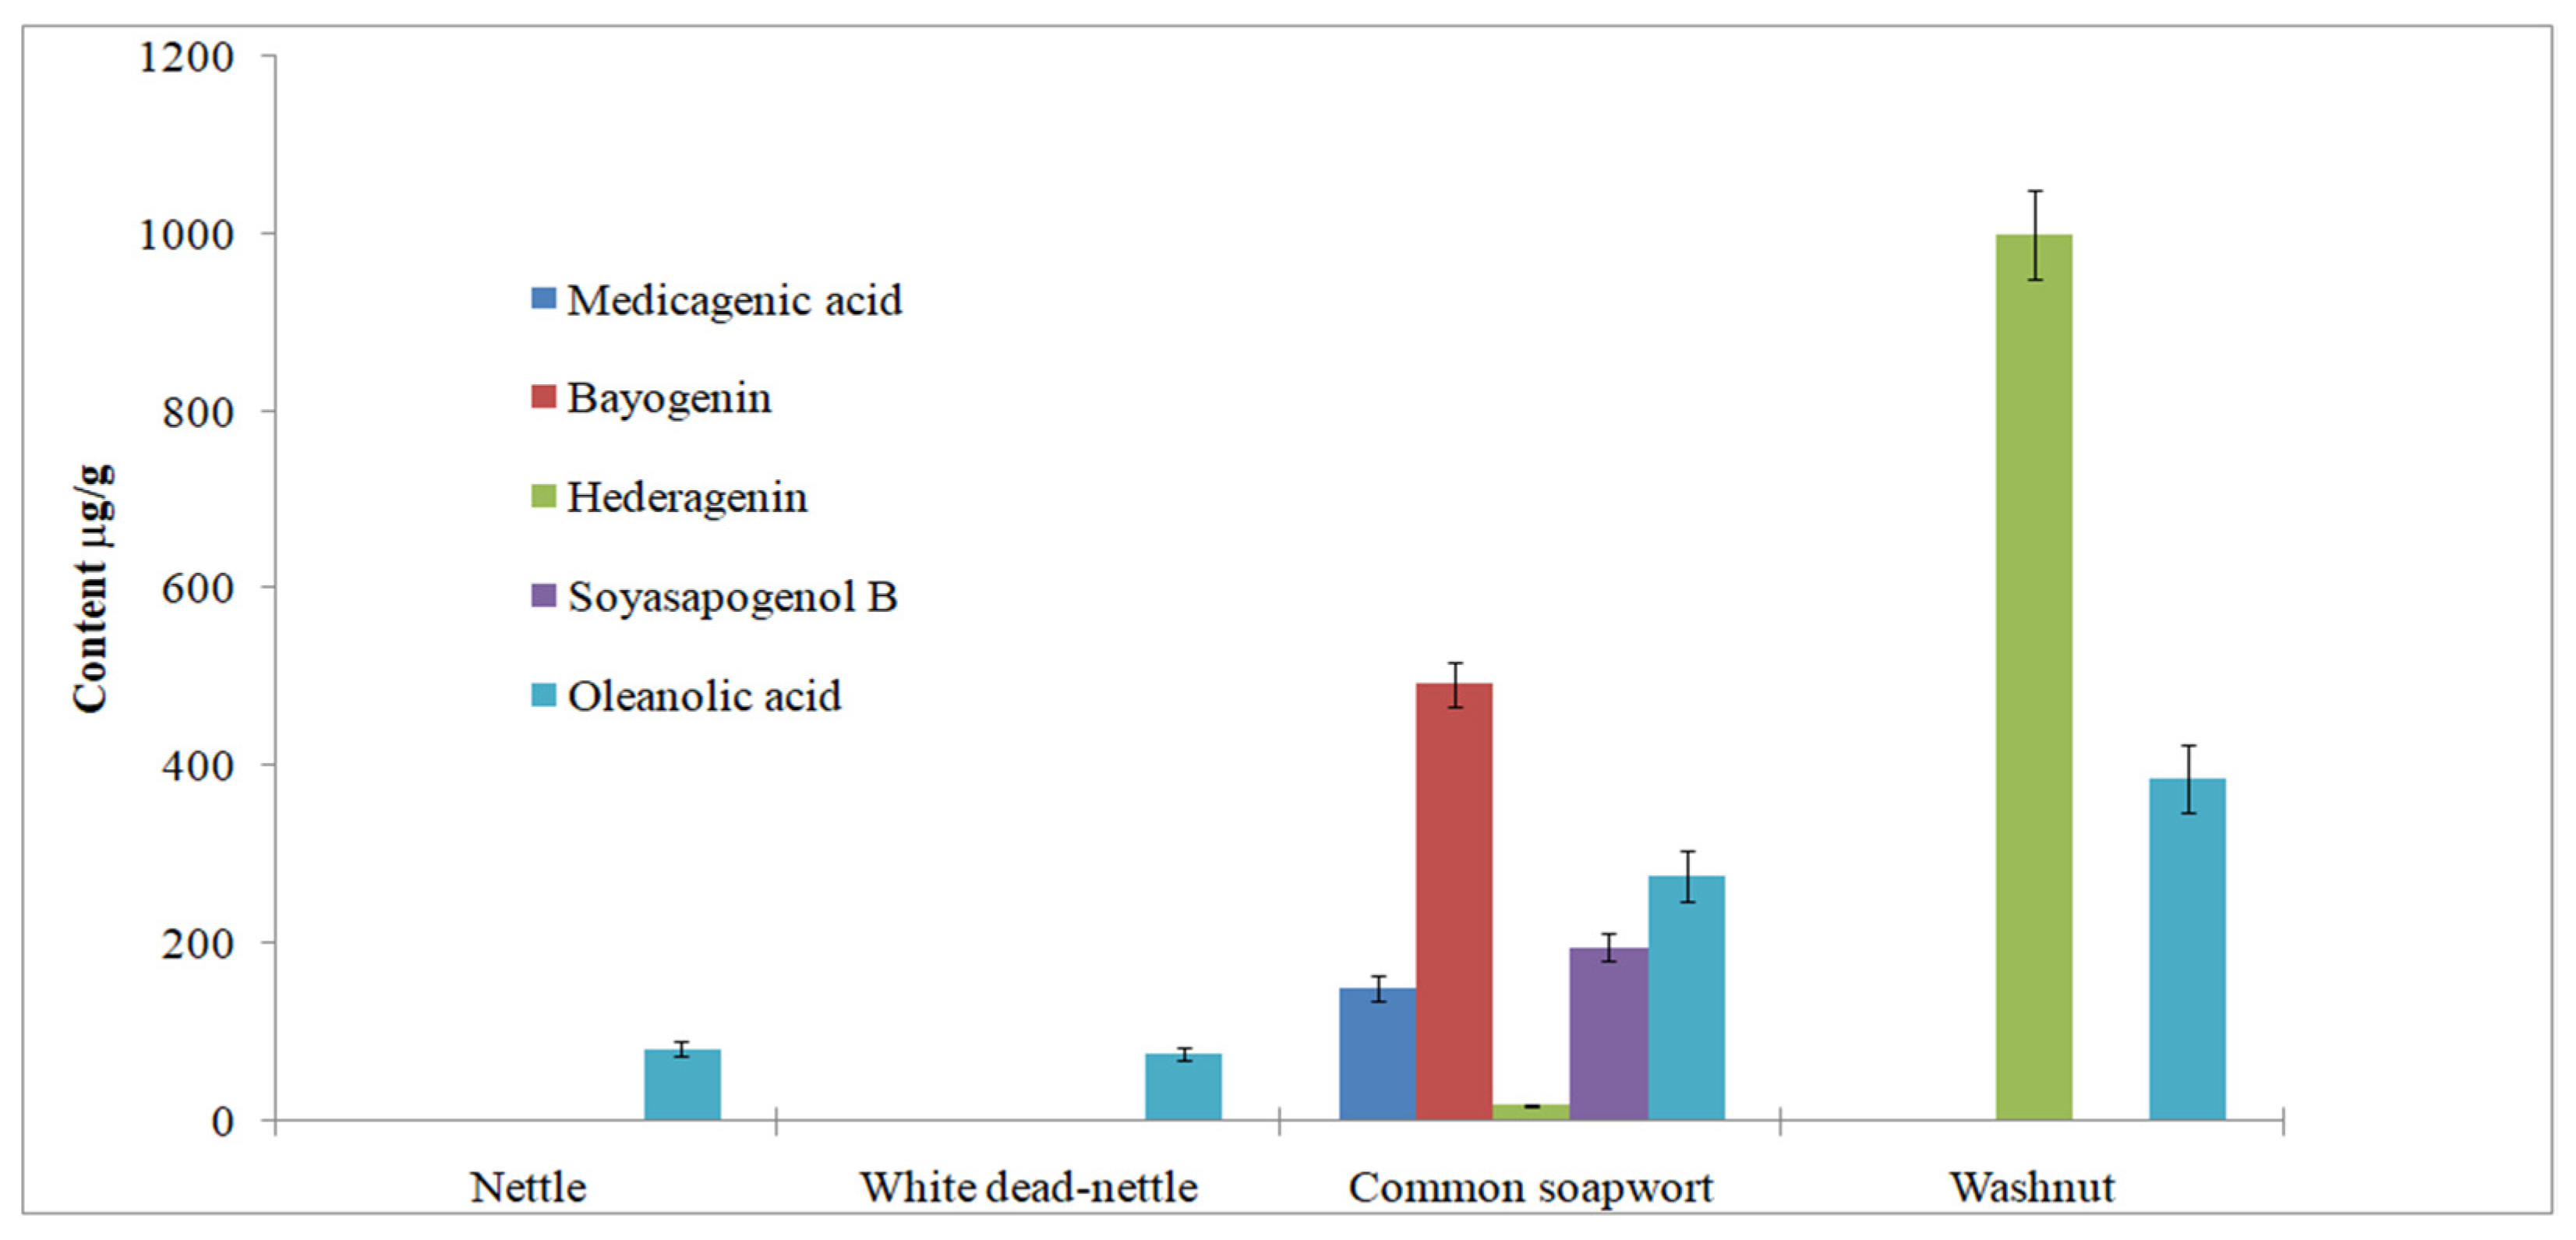
2.4. Quantitative Analysis by Use of UHPLC/ELSD
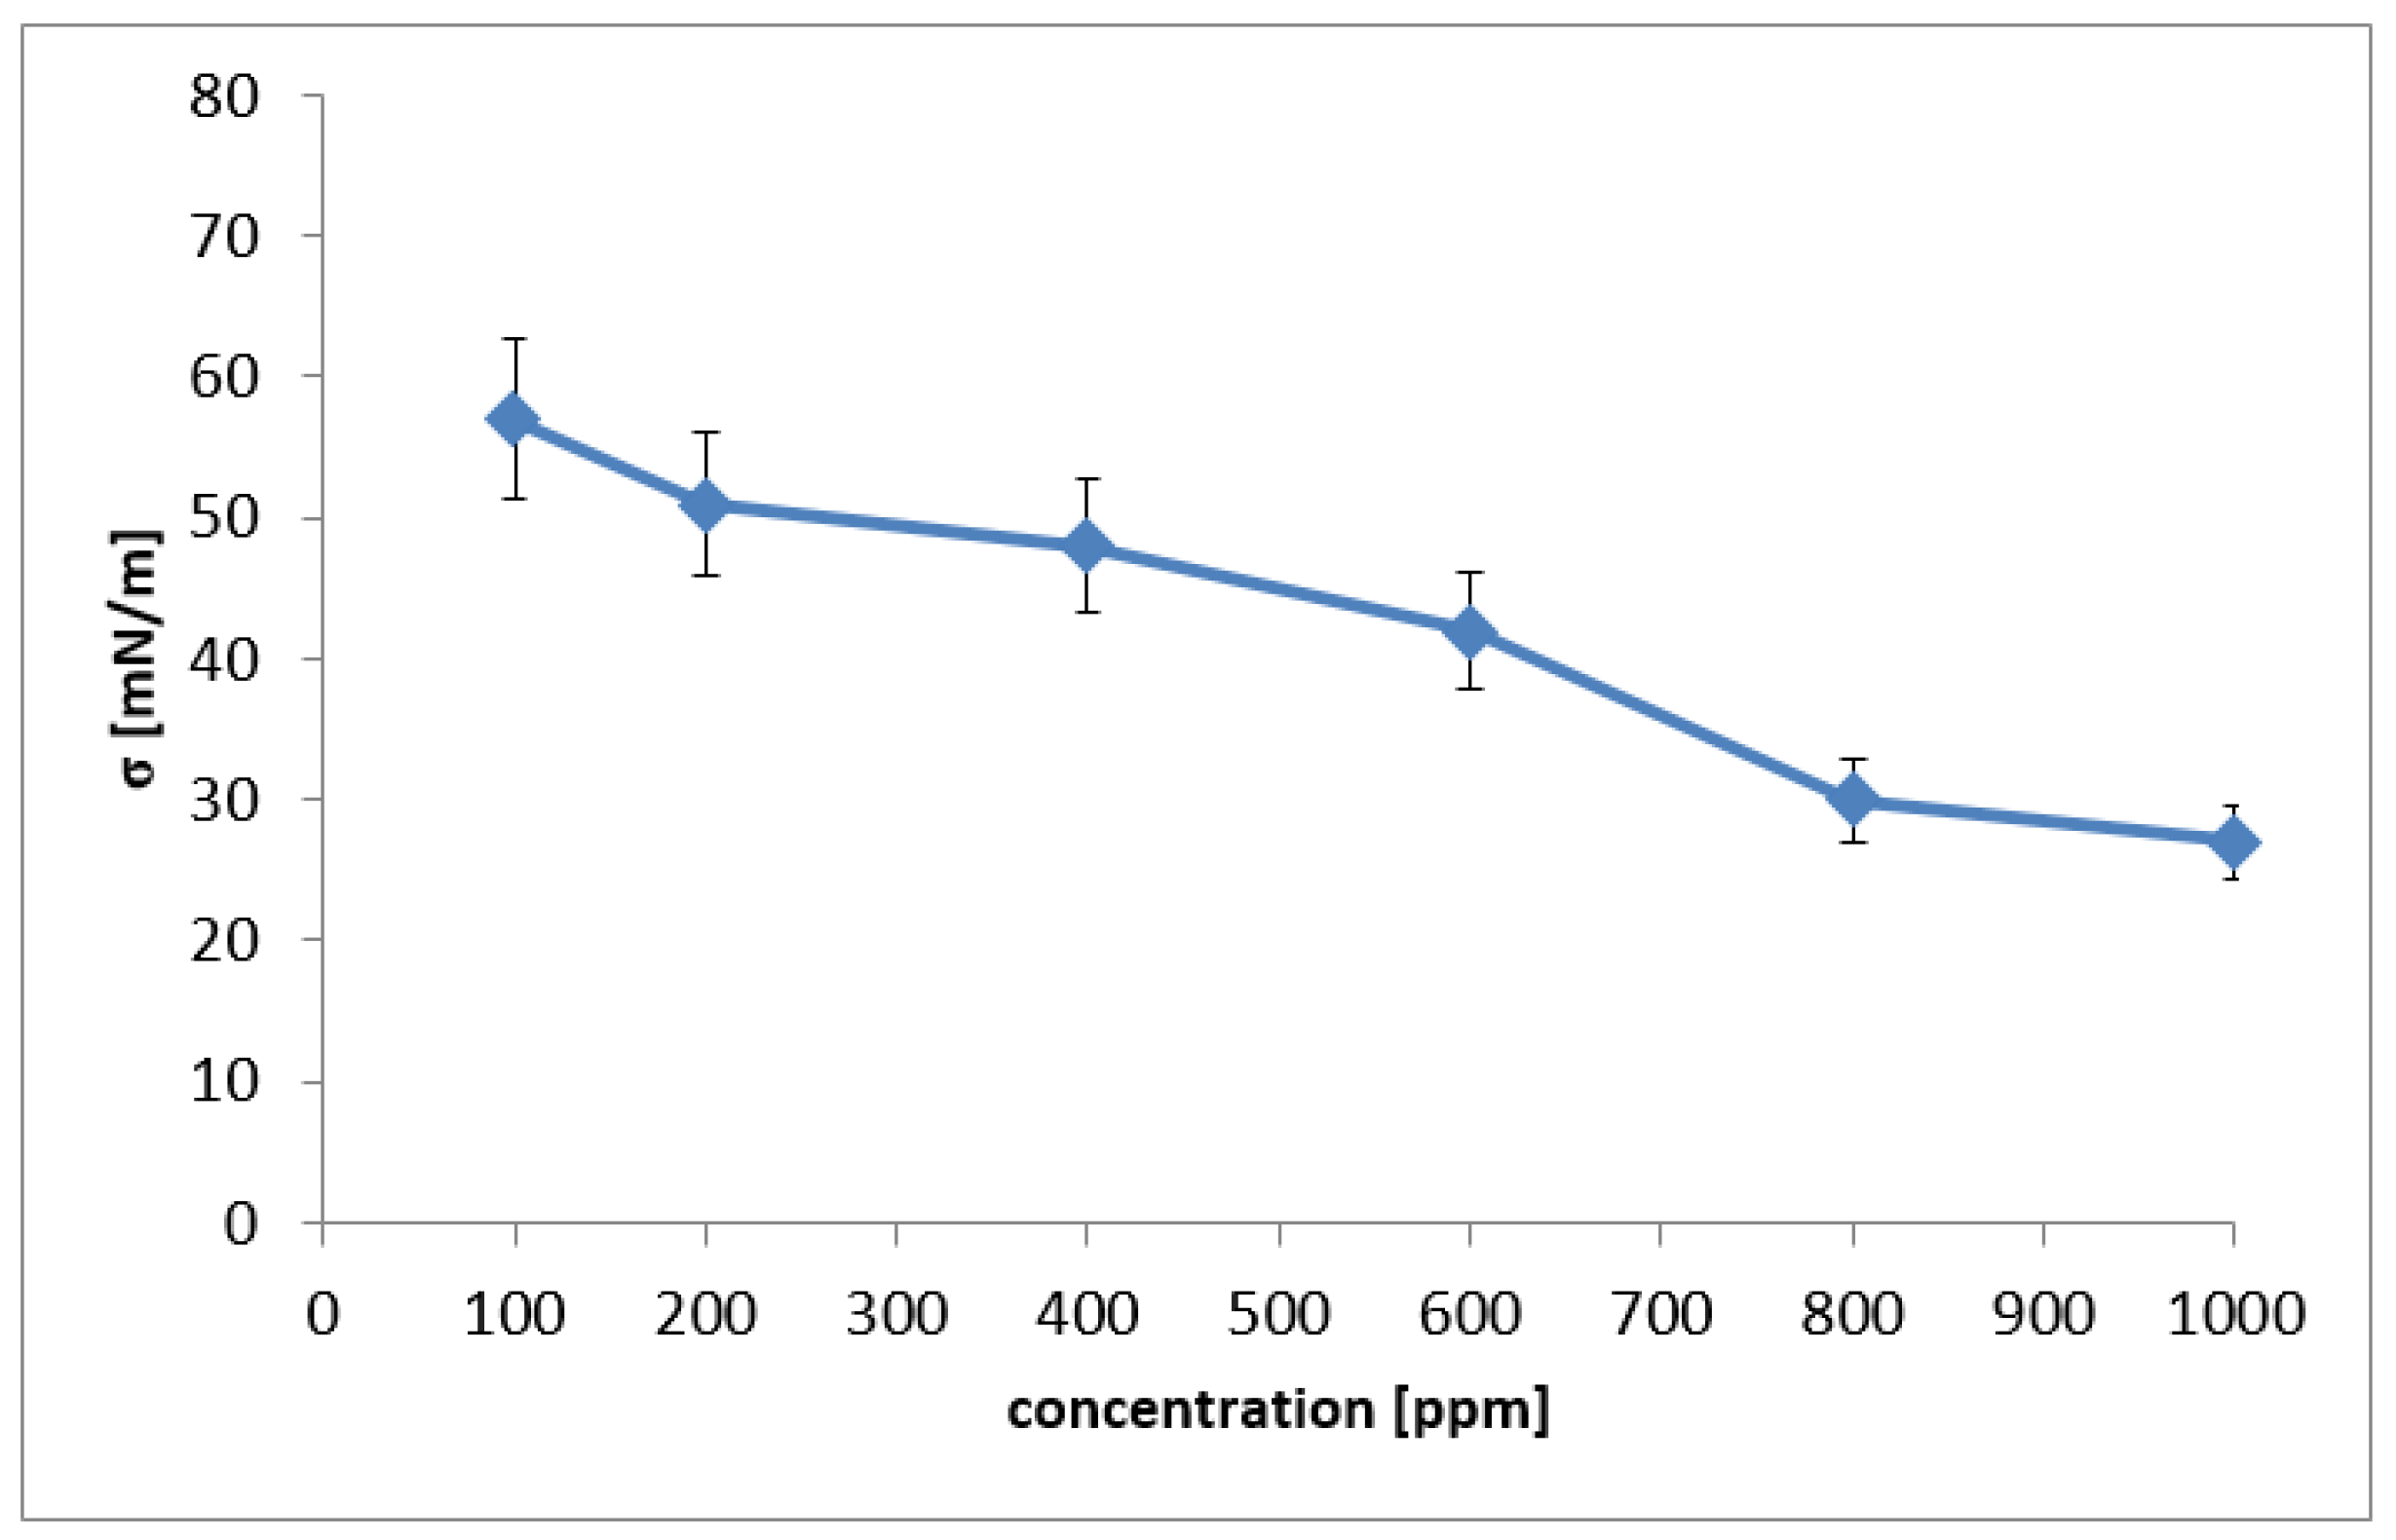
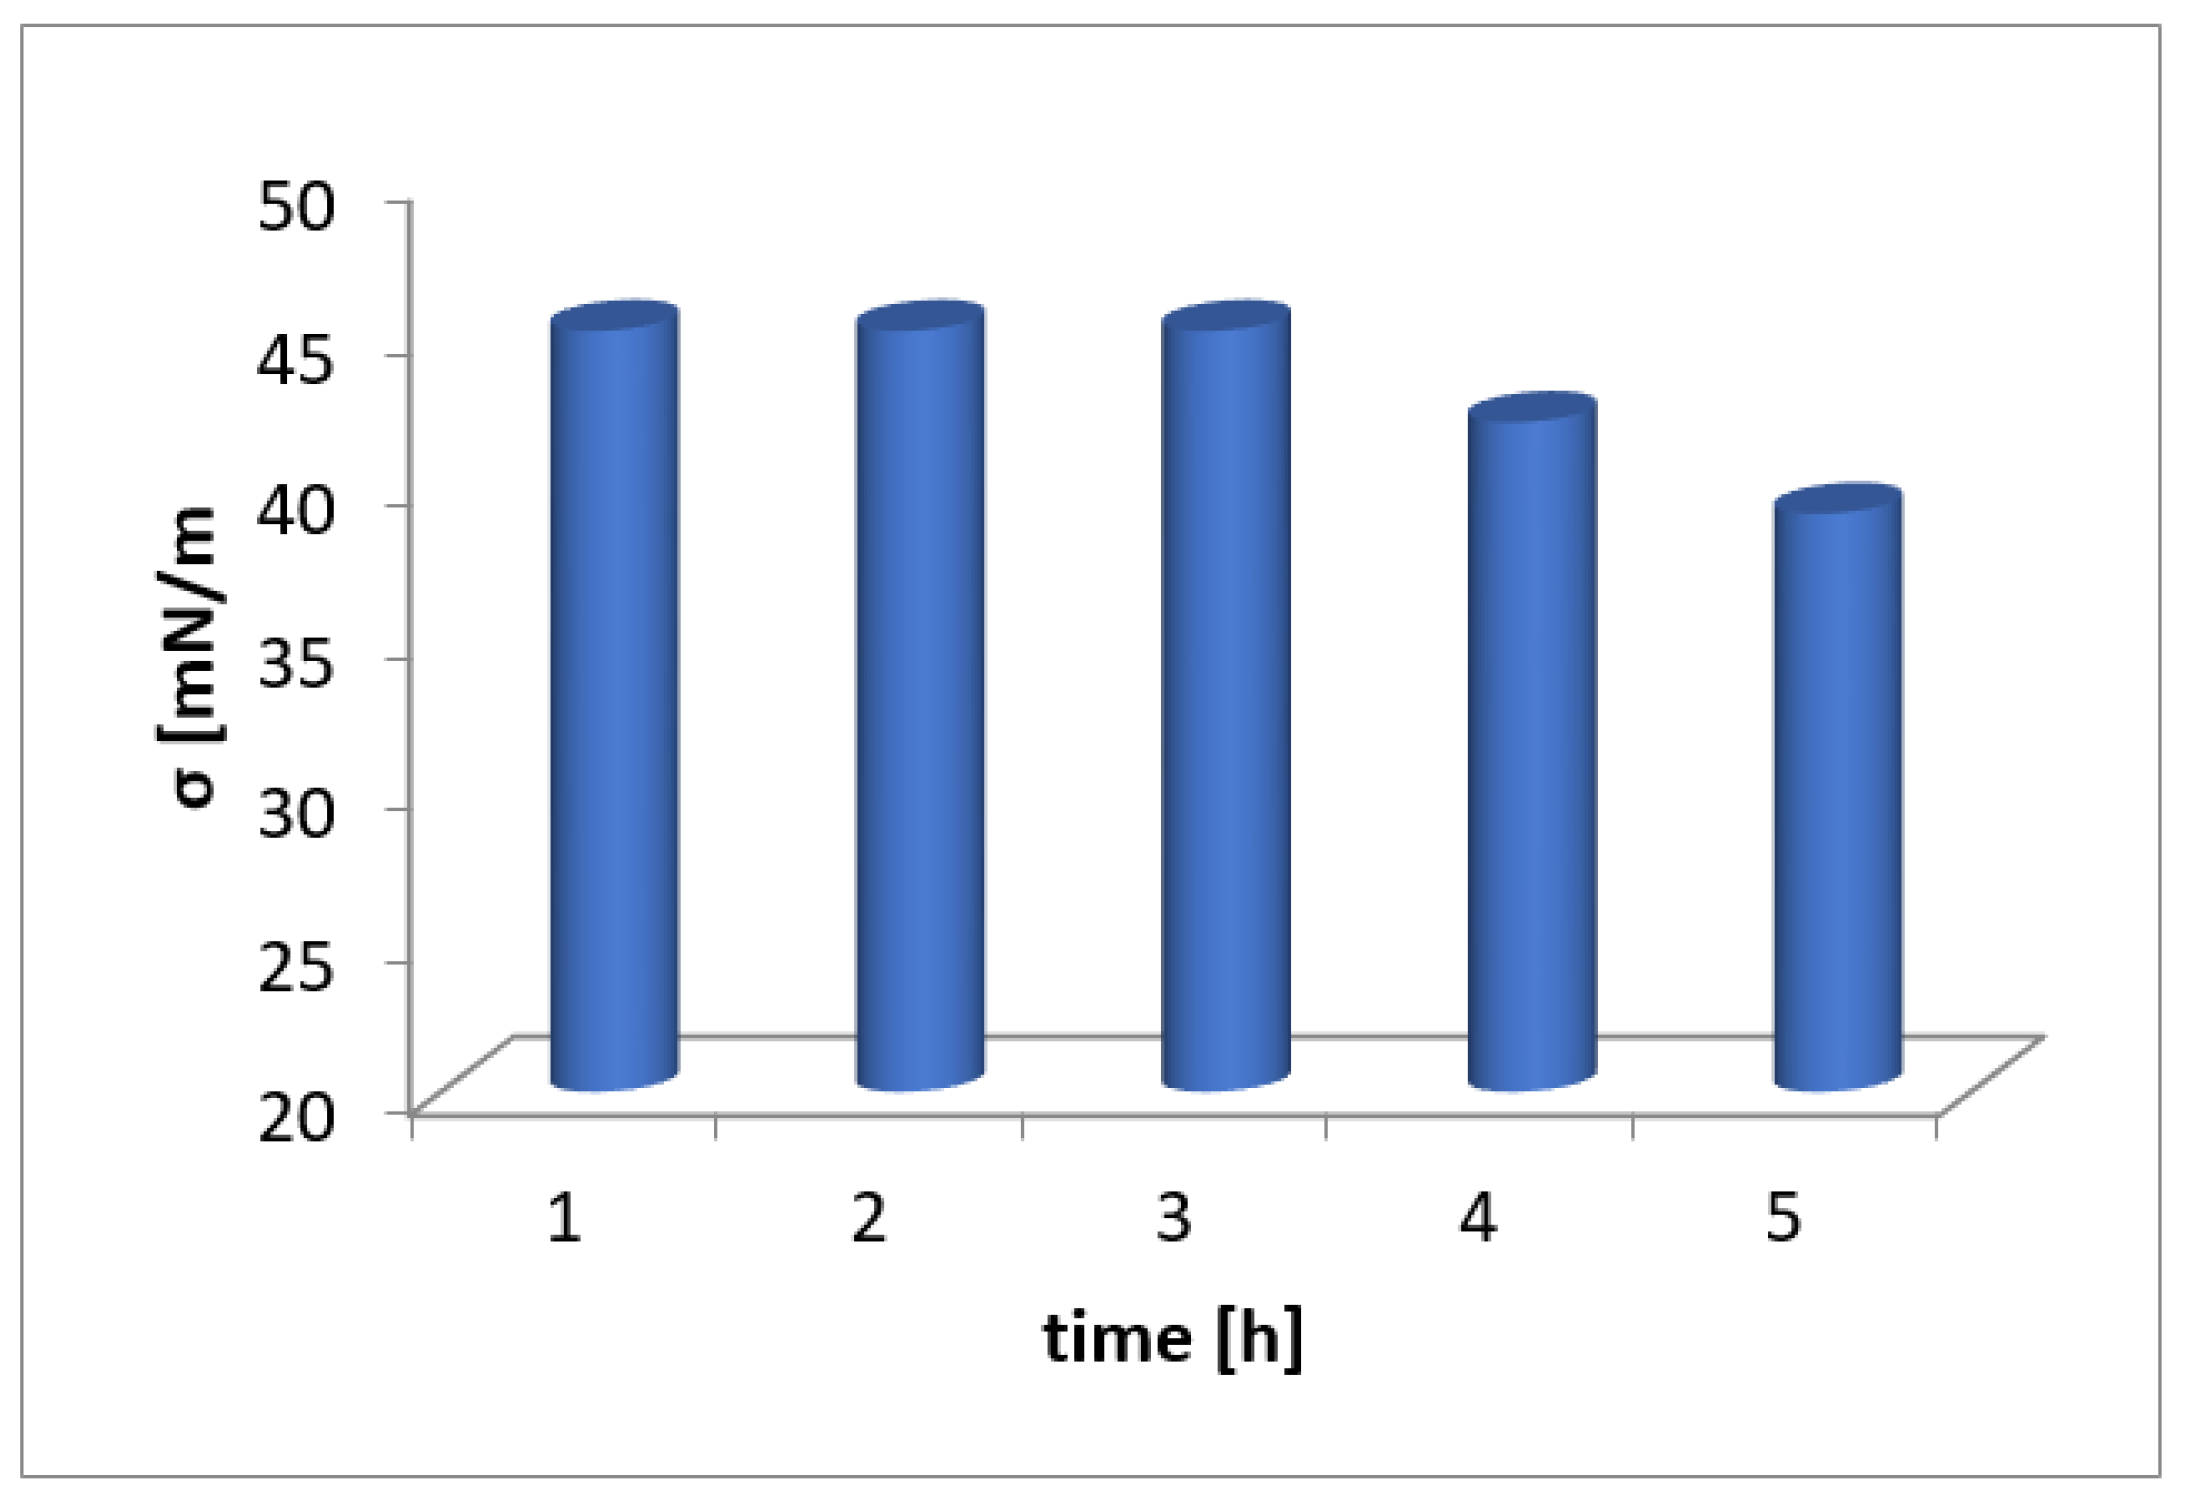
2.5. Surface Tension of Washnut Solution Containing Saponins
3. Materials and Methods
3.1. Plant Material
3.2. Chemicals and Reagents
3.3. Sample Extraction and Purification
3.4. Antioxidant Activity
3.5. Surface Tension Measurements
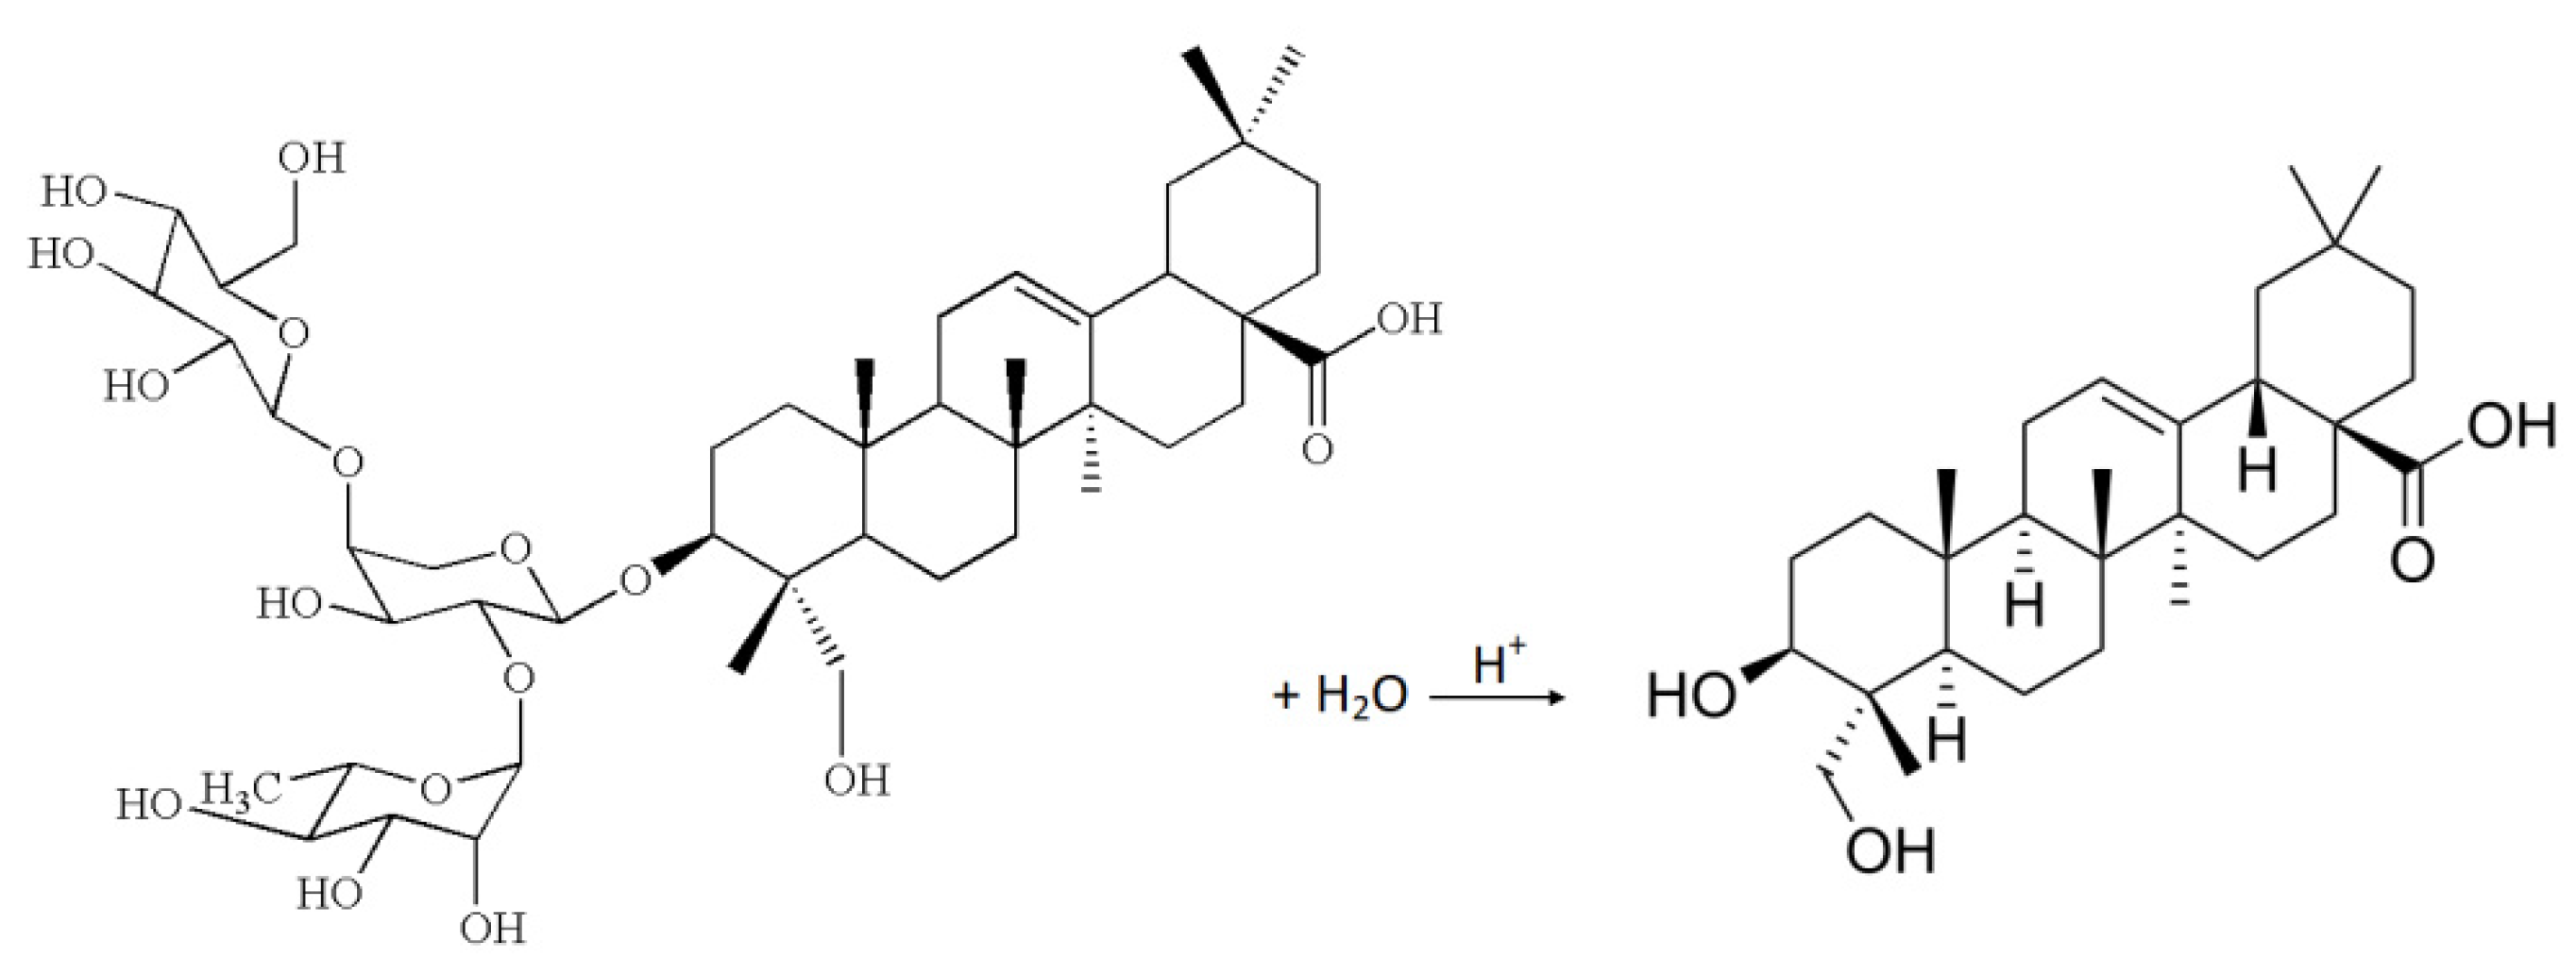
3.6. Procedure of Hydrolysis and Extract Purification
3.7. TLC Analysis
3.8. Instrumentation Used for Sample Analysis
3.9. Quantitative Analysis by Use of UHPLC/ELSD
3.10. Qualitative Analysis by Use of LC/MS
4. Conclusions
Author Contributions
Funding
Institutional Review Board Statement
Informed Consent Statement
Acknowledgments
Conflicts of Interest
Sample Availability
References
- Al-Suod, H.; Ratiu, I.A.; Ligor, M.; Ligor, T.; Buszewski, B. Determination of sugars and cyclitols isolated from various morphological parts of Medicago sativa L. J. Sep. Sci. 2018, 41, 1118–1128. [Google Scholar] [CrossRef] [PubMed]
- Ligor, M.; Ratiu, I.-A.; Kiełbasa, A.; Al-Suod, H.; Buszewski, B. Extraction approaches used for the determination of biologically active compounds (cyclitols, polyphenols and saponins) isolated from plant material. Electrophoresis 2018, 39, 1860–1874. [Google Scholar] [CrossRef] [PubMed]
- Al-Suod, H.; Ratiu, I.A.; Górecki, R.; Buszewski, B. Pressurized liquid extraction of cyclitols and sugars: Optimization of extraction parameters and selective separation. J. Sep. Sci. 2019, 42, 1265–1272. [Google Scholar] [CrossRef]
- Ratiu, I.A.; Al-Suod, H.; Ligor, M.; Ligor, T.; Krakowska, A.; Górecki, R.; Buszewski, B. Simultaneous determination of cyclitols and sugars following a comprehensive investigation of 40 plants. Food Anal. Methods 2019, 12, 1466–1478. [Google Scholar] [CrossRef] [Green Version]
- Asgarpanah, J.; Mohajerani, R. Phytochemistry and pharmacologic properties of Urtica dioica L. J. Med. Plants Res. 2012, 6, 5714–5719. [Google Scholar]
- Khan, A.M.; Qureshi, R.A.; Ullah, F.; Gilani, S.A.; Nosheen, A.; Sahreen, S.; Laghari, M.K.; Laghari, M.Y.; Rehman, S.U.; Hussain, I.; et al. Phytochemical analysis of selected medicinal plants of Margalla Hills and surroundings. J. Med. Plants Res. 2011, 5, 6017–6023. [Google Scholar]
- Paduch, R.; Woźniak, A. The effect of Lamium album extract on cultivated human corneal epithelial cells (10.014 pRSV-T). J. Ophthalmic Vis. Res. 2015, 10, 229–237. [Google Scholar] [CrossRef] [Green Version]
- Budan, A.; Bellenot, D.; Freuze, I.; Gillmann, L.; Chicoteau, P.; Richomme, P.; Guilet, D. Potential of extracts from Saponaria officinalis and Calendula officinalis to modulate in vitro rumen fermentation with respect to their content in saponins. Biosci. Biotechnol. Biochem. 2014, 78, 288–295. [Google Scholar] [CrossRef] [PubMed] [Green Version]
- Szczechowiak, J.; Szumacher-Strabel, M.; El-Sherbiny, M.; Bryszak, M.; Stochmal, A.; Cieslak, A. Effect of dietary supplementation with Saponaria officinalis root on rumen and milk fatty acid proportion in dairy cattle. Anim. Sci. Pap. Rep. 2016, 34, 221–232. [Google Scholar]
- Du, M.; Huang, S.; Zhang, J.; Wang, J.; Hu, L.; Jiang, J. Isolation of total saponins from Sapindus mukorossi Gaerth. Open J. For. 2014, 4, 24–27. [Google Scholar]
- Köse, M.D.; Bayraktar, O. Extraction of saponins from soap nut (Sapindus mukorossi) and their antimicrobial properties. World J. Res. Rev. 2016, 2, 89–93. [Google Scholar]
- Koh, R.; Tay, I. (Eds.) Saponins: Properties, Applications and Health Benefits; Nova Science Publishers Inc.: Hauppauge, NY, USA, 2011. [Google Scholar]
- Madl, T.; Sterk, H.; Mittelbach, M.; Rechberger, G.N. Profiling of saponins by mass spectrometry. J. Am. Soc. Mass Spectrom. 2006, 17, 795–806. [Google Scholar] [PubMed] [Green Version]
- Oleszek, W.; Stochmal, A. High performance liquid chromatography of triterpenes (including saponins). In High Performance Liquid Chromatography in Phytochemical Analysis Phytochemistry; Waksmundzka-Hajnos, M., Sherma, J., Kowalska, T., Eds.; Taylor & Francis Group, LLC: New York, NY, USA, 2010; pp. 633–651. [Google Scholar]
- Kiełbasa, A.; Krakowska, A.; Rafińska, K.; Buszewski, B. Isolation and determination of saponin hydrolysis products from Medicago sativa using supercritical fluid extraction, solid-phase extraction and liquid chromatography with evaporative light scattering detection. J. Sep. Sci. 2019, 42, 465–474. [Google Scholar] [CrossRef] [PubMed]
- Sharma, O.P.; Kumar, N.; Singh, B.; Bhat, T.K. An improved method for thin layer chromatographic analysis of saponins. Food Chem. 2012, 132, 671–674. [Google Scholar] [CrossRef] [PubMed]
- Ratiu, I.A.; Al-Suod, H.; Ligor, M.; Ligor, T.; Railean-Plugaru, V.; Buszewski, B. Complex investigation of extraction techniques applied for cyclitols and sugars isolation from different species of Solidago genus. Electrophoresis 2018, 39, 1966–1974. [Google Scholar] [CrossRef]
- Pecetti, L.; Biazzi, E.; Tava, A. Variation in saponin content during the growing season of spotted medic Medicago arabica (L.) Huds. J. Sci. Food Agric. 2010, 90, 2405–2410. [Google Scholar] [CrossRef]
- Li, H.L.; Qin, Z.M.; Cai, H.D.; Tan, Y.F.; Zhang, X.P.; Luo, Y.C.; Li, B.; Chen, F.; Zhang, J.Q. Determination of α-hederin in rat plasma using liquid chromatography electrospray ionization tandem mass spectrometry (LC-ESI-MS/MS) and its application to a pharmacokinetic study. Anal. Methods 2015, 7, 2155–2161. [Google Scholar] [CrossRef]
- Zhang, R.; Zhu, H.; Ding, L.; Yang, Z. Determination of asperosaponin VI and its active metabolite hederagenin in rat tissues by LC-MS/MS: Application to a tissue distribution study. J. Chromatogr. B 2014, 959, 22–26. [Google Scholar] [CrossRef]
- Zhu, H.; Ding, L.; Shakya, S.; Qia, X.; Hua, L.; Yang, X.; Yang, Z. Simultaneous determination of asperosaponin VI and its active metabolite hederagenin in rat plasma by liquid chromatography-tandem mass spectrometry with positive/negative ion-switching electrospray ionization and its application in pharmacokinetic study. J. Chromatogr. B 2011, 879, 3407–3414. [Google Scholar] [CrossRef]
- Liu, F.; Ma, N.; He, C.; Hu, Y.; Li, P.; Chen, M.; Su, H.; Wan, J.-B. Qualitative and quantitative analysis of the saponins in Panax notoginseng leaves using ultra-performance liquid chromatography coupled with time-of-flight tandem mass spectrometry and high performance liquid chromatography coupled with UV detector. J. Ginseng. Res. 2018, 42, 149–157. [Google Scholar] [CrossRef]
- Chen, Q.; Zhang, Y.; Zhang, W.; Chen, Z. Identification and quantification of oleanolic acid and ursolic acid in Chinese herbs by liquid chromatography–ion trap mass spectrometry. Biomed. Chromatogr. 2011, 25, 1381–1388. [Google Scholar] [CrossRef] [PubMed]
- de Combarieu, E.; Falzoni, M.; Fuzzati, N.; Gattesco, F.; Giori, A.; Lovati, M.; Pace, R. Identification of Ruscus steroidal saponins by HPLC-MS analysis. Fitoterapia 2002, 73, 583–596. [Google Scholar] [CrossRef]
- Gao, W.; Wang, R.; Li, D.; Liu, K.; Chen, J.; Li, H.J.; Xu, X.; Li, P.; Yang, H. Comparison of five Lonicera flowers by simultaneous determination of multi-components with single reference standard method and principal component analysis. J. Pharm. Biomed. Anal. 2015, 117, 345–351. [Google Scholar] [CrossRef]
- Chen, Y.-F.; Yang, C.-H.; Chang, M.-S.; Ciou, Y.-P.; Huang, Y.-C. Foam Properties and detergent abilities of the saponins from Camellia oleifera. Int. J. Mol. Sci. 2010, 11, 4417–4425. [Google Scholar] [CrossRef] [PubMed] [Green Version]
- Huang, H.C.; Liao, S.C.; Chang, F.R.; Kuo, Y.H.; Wu, Y.C. Molluscicidal saponins from Sapindus mukorossi, inhibitory agents of golden apple snails, Pomacea canaliculata. J. Agric. Food Chem. 2003, 51, 4916–4919. [Google Scholar] [CrossRef]
- Oleszek, W.; Marston, A. (Eds.) Saponins in Food, Feedstuffs and Medicinal Plants; Springer: Dordrecht, Germany, 2000. [Google Scholar]
- Sparg, S.G.; Light, M.E.; Staden, J. Biological activities and distribution of plant saponins. J. Ethnopharmacol. 2004, 94, 219–243. [Google Scholar] [CrossRef]
- Takagi, K.; Park, E.H.; Kato, H. Anti-inflammatory activities of hederagenin and crude saponin isolated from Sapindus mukorossi Gaertn. Chem. Pharm. Bull. 1980, 28, 1183–1188. [Google Scholar] [CrossRef] [Green Version]
- Tamura, Y.; Mizutani, K.; Ikeda, T.; Ohtani, K.; Kasai, R.; Yamasaki, K.; Tanaka, O. Antimicrobial activities of saponins of pericarps of Sapindus mukurossi on dermatophytes. Nat. Med. 2001, 55, 11–16. [Google Scholar]
- Tanaka, O.; Tamura, Y.; Masuda, H.; Mizutani, K. Application of saponins in foods and cosmetics: Saponins of Mohave Yucca and Sapindus mukurossi. In Saponins Used in Food and Agriculture; Waller, G.R., Yamasaki, K., Eds.; Plenum Press: New York, NY, USA, 1996; pp. 1–11. [Google Scholar]
- Bajkacz, S.; Ligor, M.; Baranowska, I.; Buszewski, B. Separation and determination of chemopreventive phytochemicals of flavonoids from Brassicaceae plants. Molecules 2021, 26, 4734. [Google Scholar] [CrossRef]
- Ceynowa, J.; Litowska, M.; Nowakowski, R.; Ostrowska-Czubenko, J. Handbook for Laboratory Exercises in Physical Chemistry; Publishing House of Nicolaus Copernicus University: Toruń, Poland, 2006. (In Polish) [Google Scholar]


| Sample | Nettle (Urtica dioica L.) 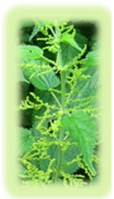 | White Dead-Nettle (Lamium album L.)  | Common Soapwort (Saponaria officinalis L.) 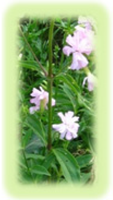 | Washnut (Sapindus mukorossi Gaertn.)  |
| A± SD [%] absorbance at λ = 517 nm | 0.389 ± 0.001 | 0.303 ± 0.001 | 0.230 ± 0.002 | 0.197 ± 0.001 |
| ADPPH± SD [%] absorbance at λ = 517 nm | 0.969 ± 0.002 | |||
| RSA ± SD [%] | 59.82 ± 0.06 | 68.77 ± 0.12 | 76.26 ± 0.21 | 79.70 ± 0.06 |
| Detection | TLC Chromatogram λ = 254 nm | TLC Chromatogram λ = 366 nm | TLC Chromatogram Derivatized by NP λ = 254 nm | TLC Chromatogram Derivatized by NP λ = 366 nm | |
|---|---|---|---|---|---|
| Sample No | |||||
| (1) Nettle (2) White dead-nettle (3) Common soapwort (4) Washnut |  | 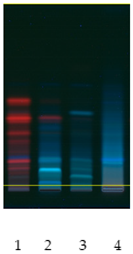 |  | 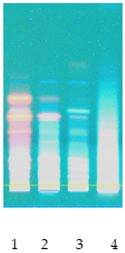 | |
| Compounds | Equation of the Calibration Curve | Correlation Coefficient R2 | LOD [µg/mL] | LOQ [µg/mL] | Recovery ± SD [%] |
|---|---|---|---|---|---|
| Medicagenic acid | y = 1.1026x − 0.6054 | 0.9986 | 0.50 | 1.50 | 71.0 ± 6.0 |
| Bayogenin | y = 1.3236x − 0.9934 | 0.9978 | 0.30 | 0.90 | 83.1 ± 5.0 |
| Hederagenin | y = 1.4434x − 1.0916 | 0.9983 | 0.10 | 0.30 | 87.2 ± 1.7 |
| Soyasapogenol B | y = 1.3884x − 1.1674 | 0.9990 | 0.20 | 0.70 | 99.0 ± 8.0 |
| Oleanolic acid | y = 1.4109x − 1.4243 | 0.9985 | 0.30 | 1.10 | 22.2 ± 0.5 |
| Extract | Nettle Content ± SD [µg/g] | White Dead-Nettle Content ± SD [µg/g] | Common Soapwort Content ± SD [µg/g] | Washnut Content ± SD [µg/g] | |
|---|---|---|---|---|---|
| Compound | |||||
| Medicagenic acid | nd | nd | 149.3 ± 6.3 | nd | |
| Bayogenin | nd | nd | 492.7 ± 19.8 | nd | |
| Hederagenin | nd | nd | 17.9 ± 1.6 | 999.1 ± 6.3 | |
| Soyasapogenol B | nd | nd | 195.3 ± 16.0 | nd | |
| Oleanolic acid | 81.0 ± 0.7 | 76.0 ± 2.7 | 276.2 ± 35.6 | 386.5 ± 27.7 | |
| Concentration [ppm] | hx [mm] | σx [mN/m] |
|---|---|---|
| 100 | 95 | 56.98 |
| 200 | 85 | 50.98 |
| 400 | 80 | 47.98 |
| 600 | 70 | 41.98 |
| 800 | 50 | 29.99 |
| 1000 | 45 | 26.99 |
| Sample No | Mixing Time [h] | hx [mm] | σx [mN/m] |
|---|---|---|---|
| 1 | 1 | 75 | 44.98 |
| 2 | 2 | 75 | 44.98 |
| 3 | 3 | 75 | 44.98 |
| 4 | 4 | 70 | 41.98 |
| 5 | 5 | 65 | 38.98 |
| Column | C18 Column (150 × 4.6 mm; 5.0 μm) | ||
|---|---|---|---|
| Mobile phase | A: water/acetic acid (0.01%) | ||
| B: acetonitrile/acetic acid (0.01%) | |||
| Mobile phase flow rate | 0.6 mL/min | ||
| Gradient elution | Time [min] | A [%] | B [%] |
| 0 | 75 | 25 | |
| 15 | 55 | 45 | |
| 25 | 55 | 45 | |
| 26 | 20 | 80 | |
| 40 | 20 | 80 | |
| Injection | 10 μL | ||
| UV-Vis detector | λ = 205 nm | ||
Publisher’s Note: MDPI stays neutral with regard to jurisdictional claims in published maps and institutional affiliations. |
© 2021 by the authors. Licensee MDPI, Basel, Switzerland. This article is an open access article distributed under the terms and conditions of the Creative Commons Attribution (CC BY) license (https://creativecommons.org/licenses/by/4.0/).
Share and Cite
Ligor, M.; Kiełbasa, A.; Ratiu, I.-A.; Buszewski, B. Separation and Quantification of Selected Sapogenins Extracted from Nettle, White Dead-Nettle, Common Soapwort and Washnut. Molecules 2021, 26, 7705. https://doi.org/10.3390/molecules26247705
Ligor M, Kiełbasa A, Ratiu I-A, Buszewski B. Separation and Quantification of Selected Sapogenins Extracted from Nettle, White Dead-Nettle, Common Soapwort and Washnut. Molecules. 2021; 26(24):7705. https://doi.org/10.3390/molecules26247705
Chicago/Turabian StyleLigor, Magdalena, Anna Kiełbasa, Ileana-Andreea Ratiu, and Bogusław Buszewski. 2021. "Separation and Quantification of Selected Sapogenins Extracted from Nettle, White Dead-Nettle, Common Soapwort and Washnut" Molecules 26, no. 24: 7705. https://doi.org/10.3390/molecules26247705
APA StyleLigor, M., Kiełbasa, A., Ratiu, I.-A., & Buszewski, B. (2021). Separation and Quantification of Selected Sapogenins Extracted from Nettle, White Dead-Nettle, Common Soapwort and Washnut. Molecules, 26(24), 7705. https://doi.org/10.3390/molecules26247705