
AaTs-1: A Tetrapeptide from Androctonus australis Scorpion Venom, Inhibiting U87 Glioblastoma Cells Proliferation by p53 and FPRL-1 Up-Regulations

 , , and
Abstract
:
1. Introduction
2. Results
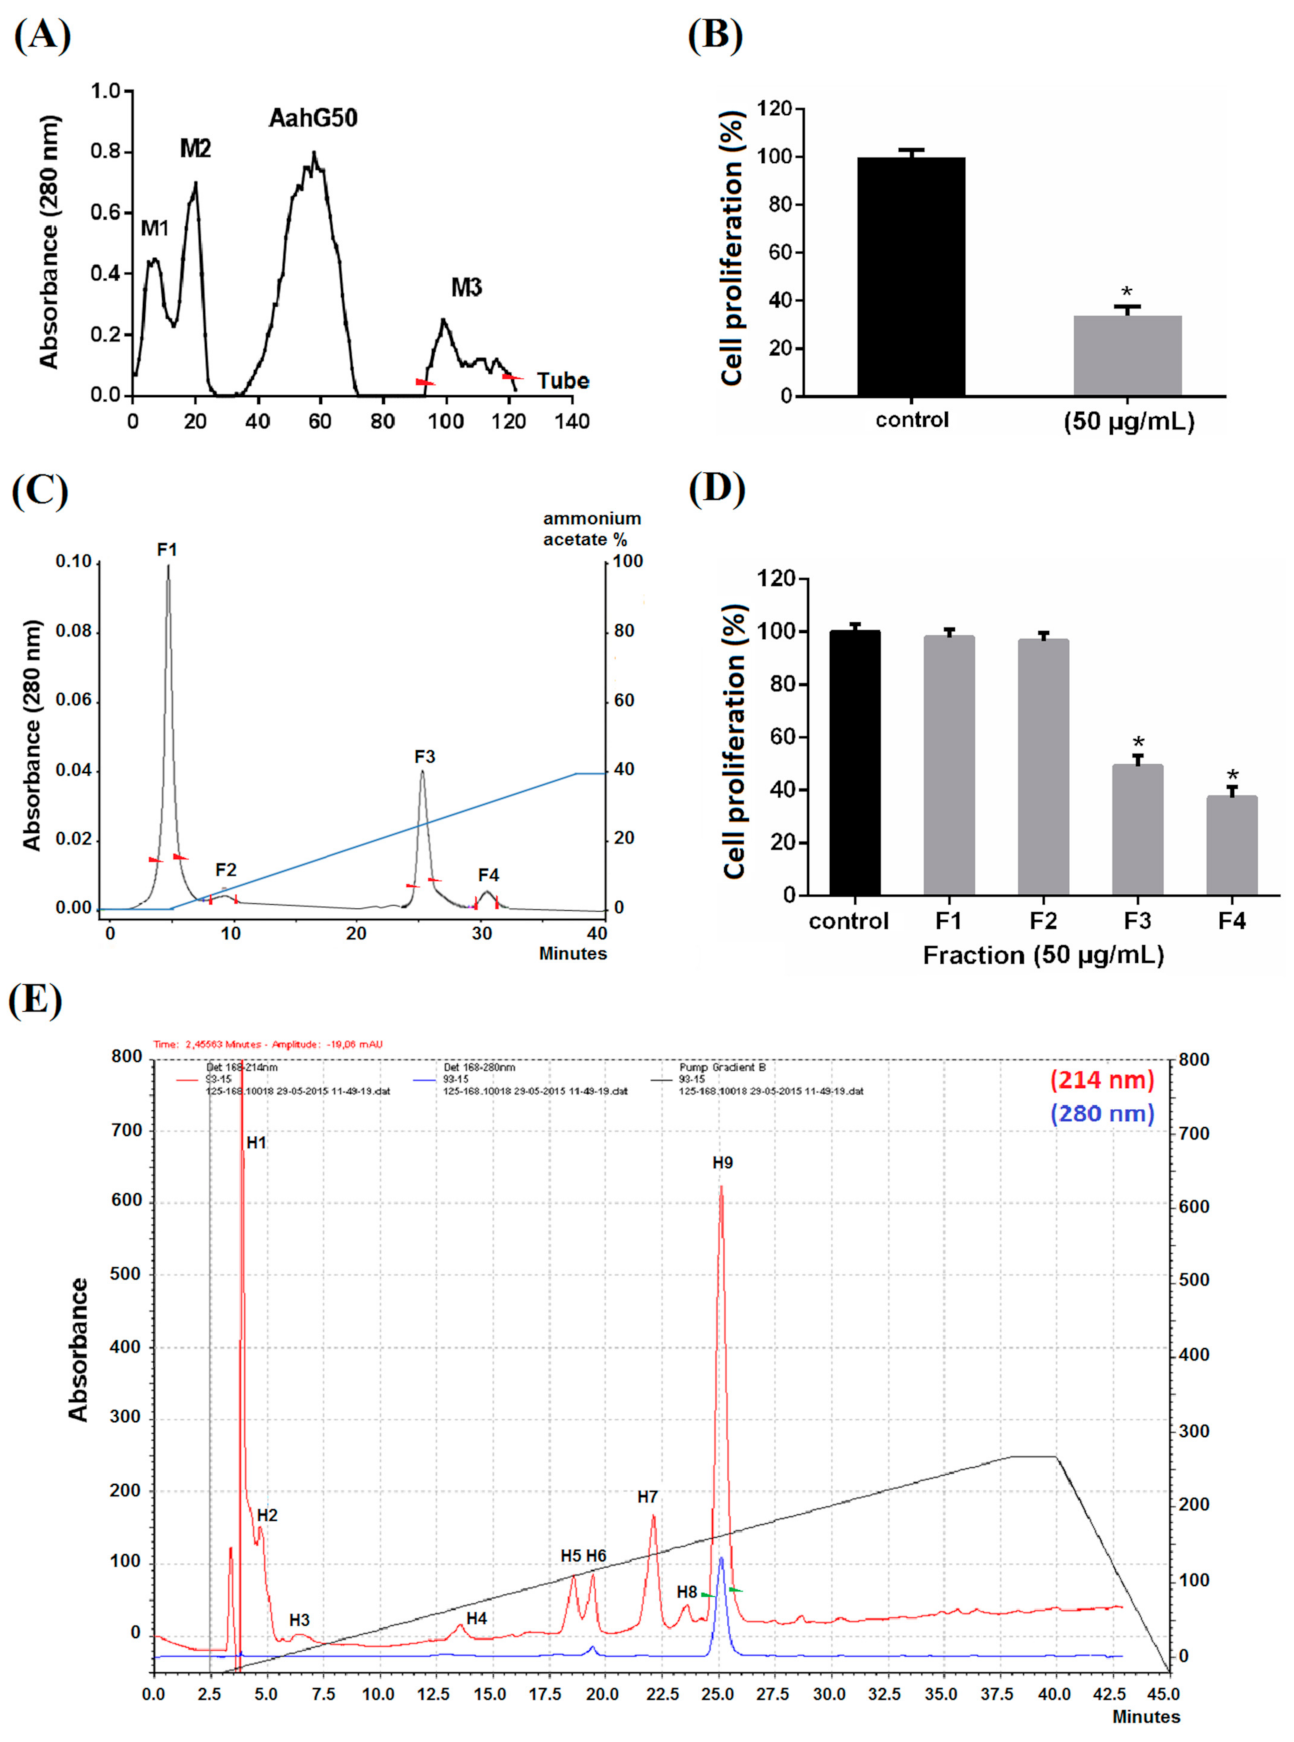
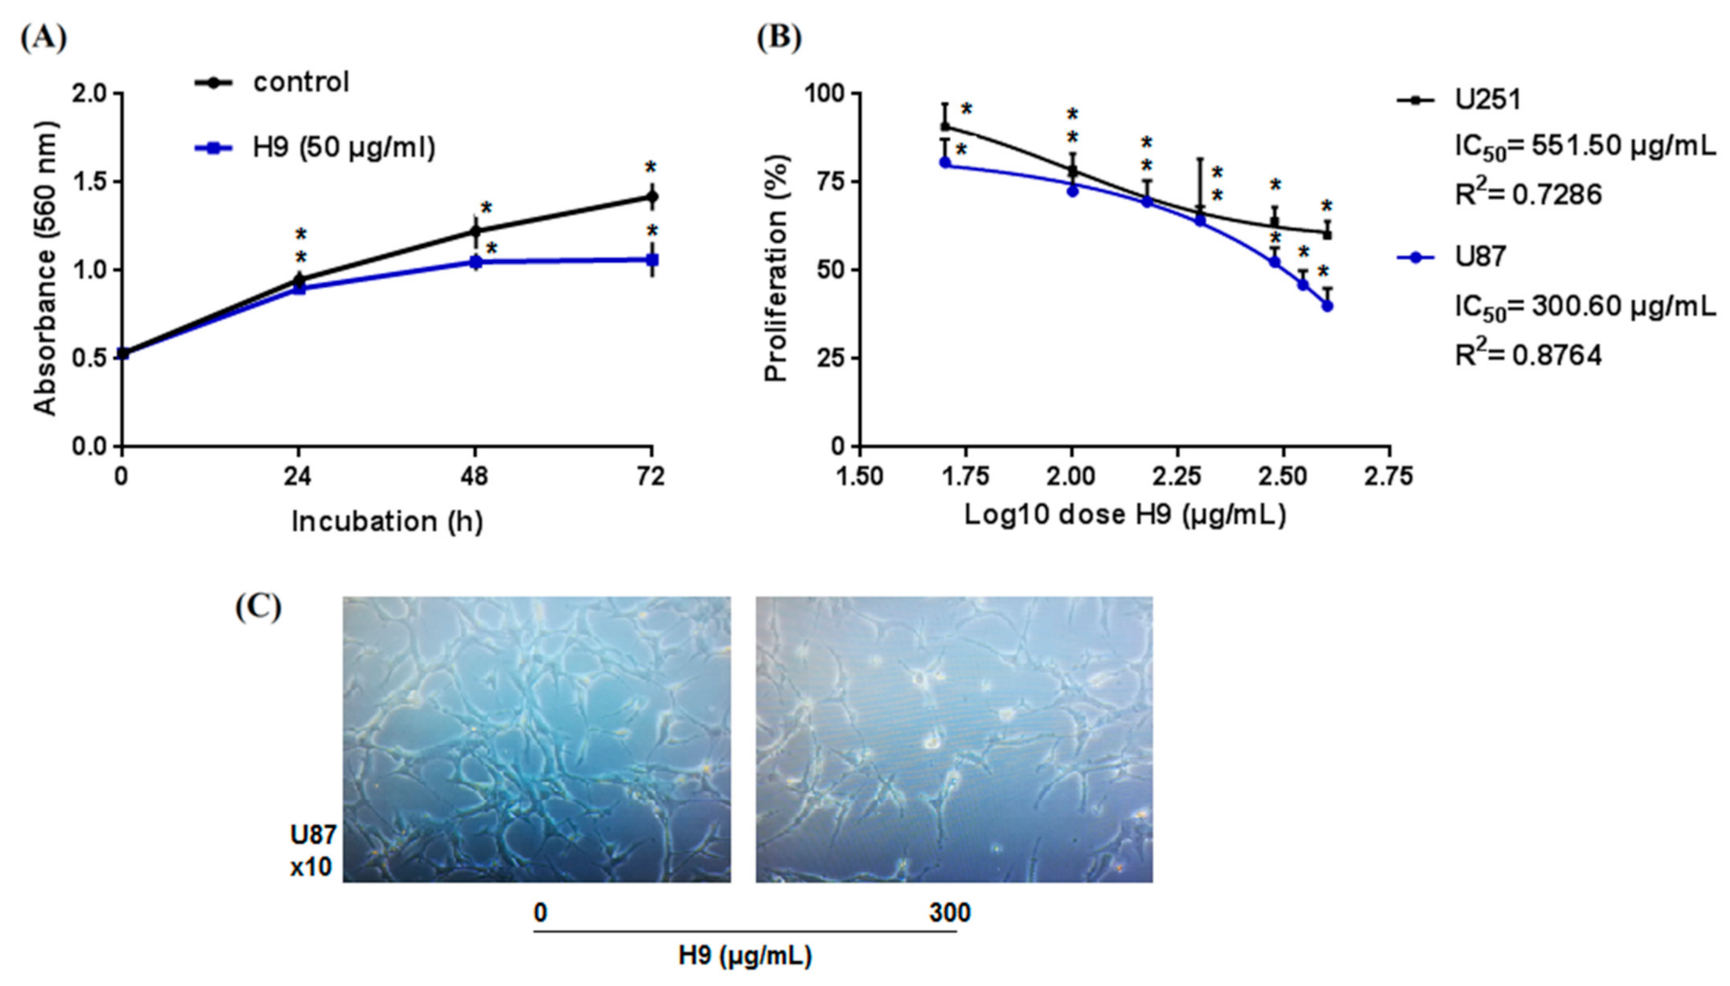
2.1. Purification
2.2. Pharmacological Characterization
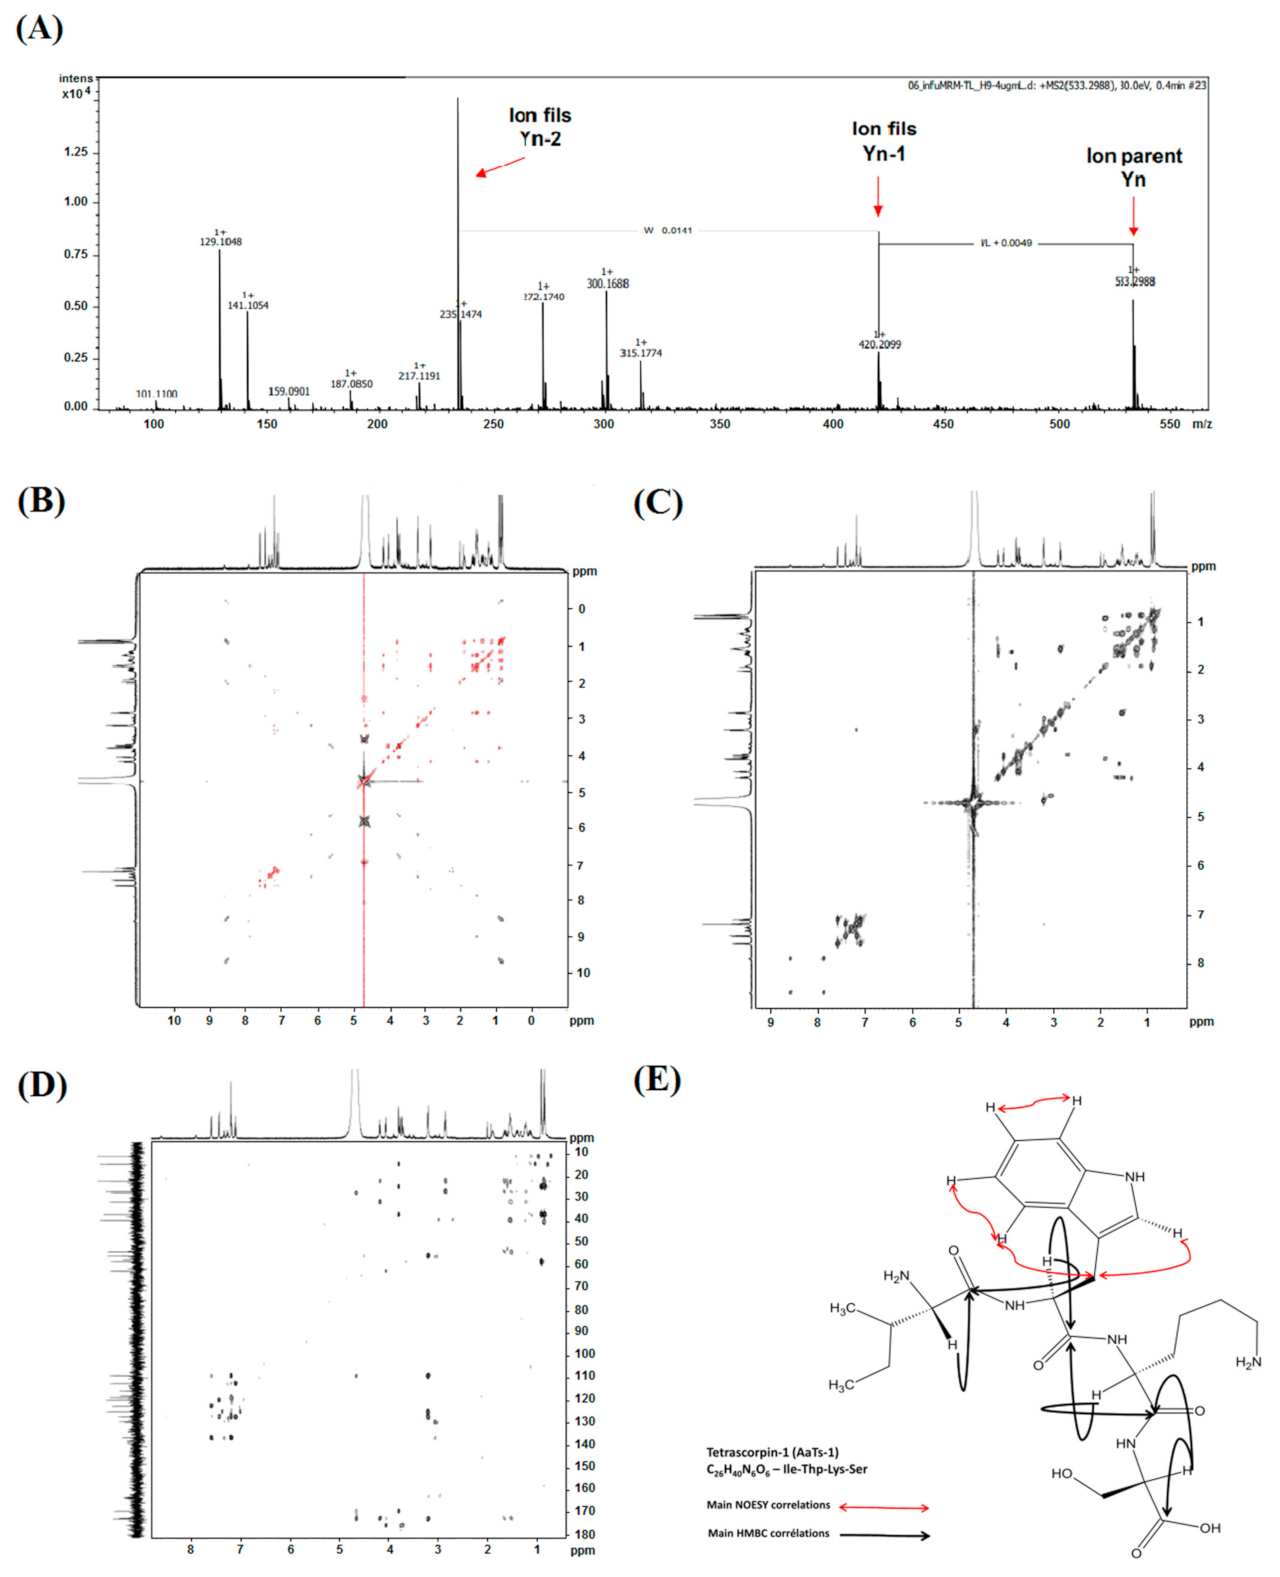
2.3. Structural Characterization and Analysis
2.3.1. Mass Spectrometry Analysis
2.3.2. NMR Analysis
2.3.3. Theoretical Analysis of the AaTs-1 Structure
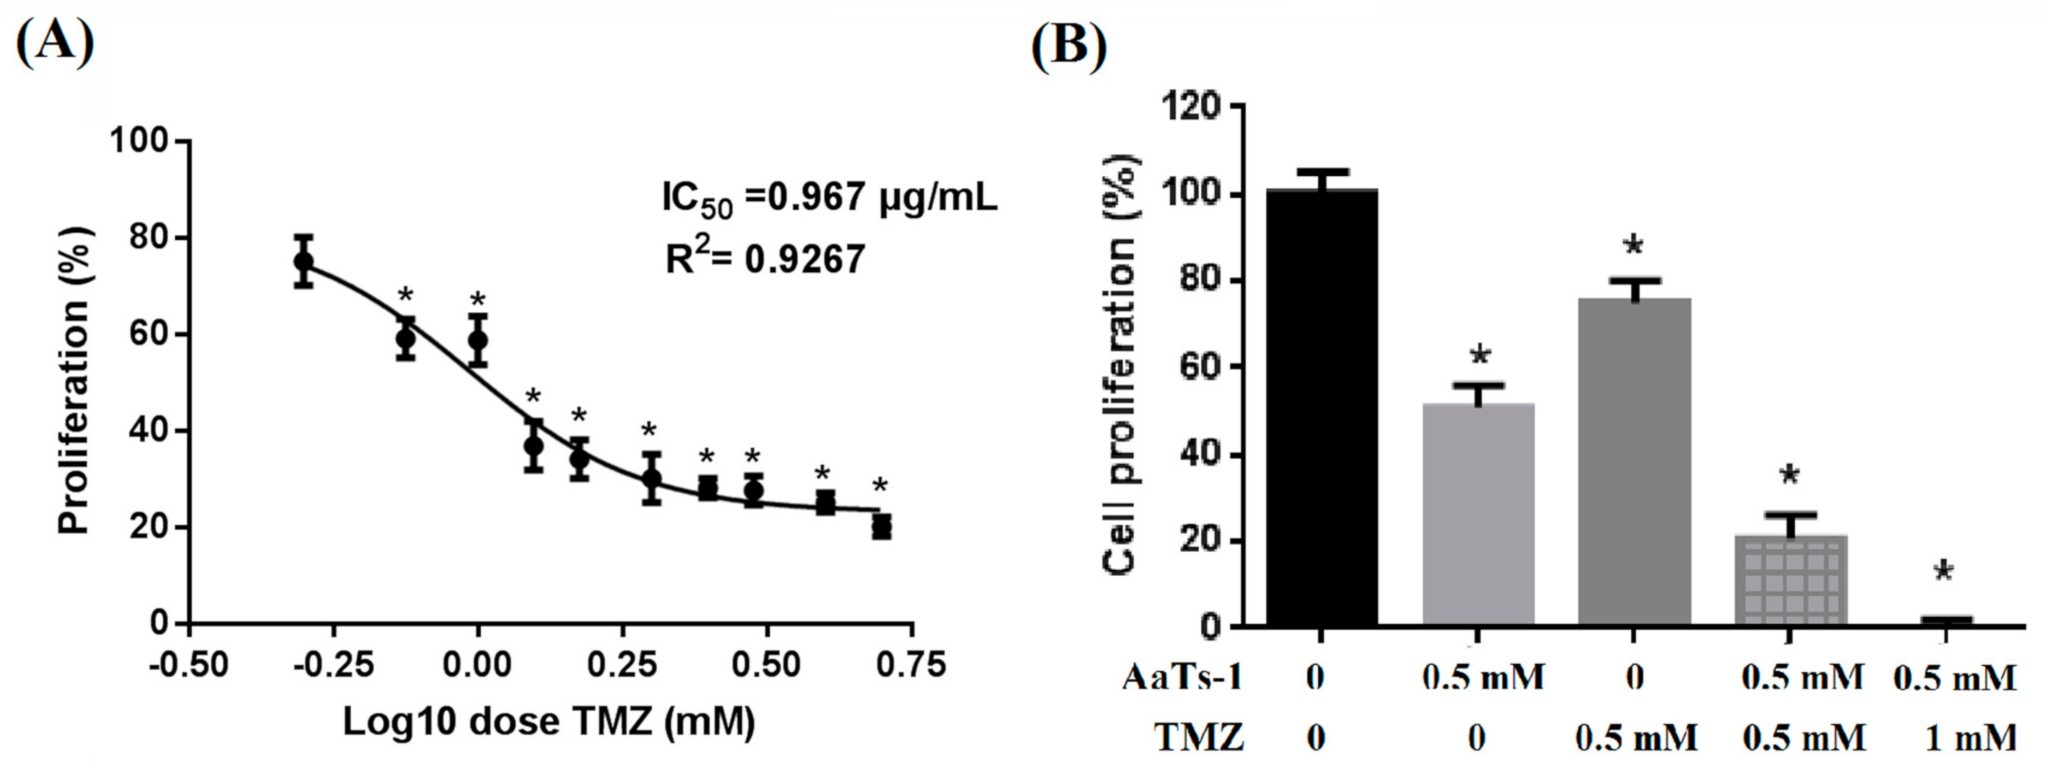
2.4. AaTs-1 Improves the TMZ Effect on U87 Cells
2.5. Analysis of Cellular Responses Involved in the Effect of AaTs-1
- i.
- We first tested the effects of AaTs-1 (at the IC50 dose = 0.56 mM) on DNA fragmentation. The genomic DNA extracted from mock, SAT (at 1 µM as the positive control), and AaTs-1 treated cells, was visualized on agarose gel electrophoresis. For the positive control, DNA fragmentation was highlighted while a single band appeared in mock- and AaTs-1 treated cells (Supplementary Materials Figure S4A). This indicates that AaTs-1 did not affect the integrity of U87 cell DNA;
- ii.
- Double labelling with Annexin V-FITC/IP of the treated cells was carried out at different time points 24, 48, and 72 h. Flow cytometric analysis (FACS) confirmed that AaTs-1 did not induce apoptosis in U87 cells even after 72 h of treatment (Supplementary Materials Figure S4B);
- iii.
- The cell cycle distribution of the mock-treated cells, stained with propidium iodide (PI) and analyzed by FACS, was also found to be similar to that of AaTs-1 treated cells. The number of cells in the G0/G1, S, and G2/M phases was 7.5%, 64%, and 18.5%, respectively (Supplementary Materials Figure S4C).All these results supported that the antiproliferative effect of AaTs-1 on U87 cells is neither due to the induction of apoptosis nor to the cell cycle arrest but rather by another mechanism;
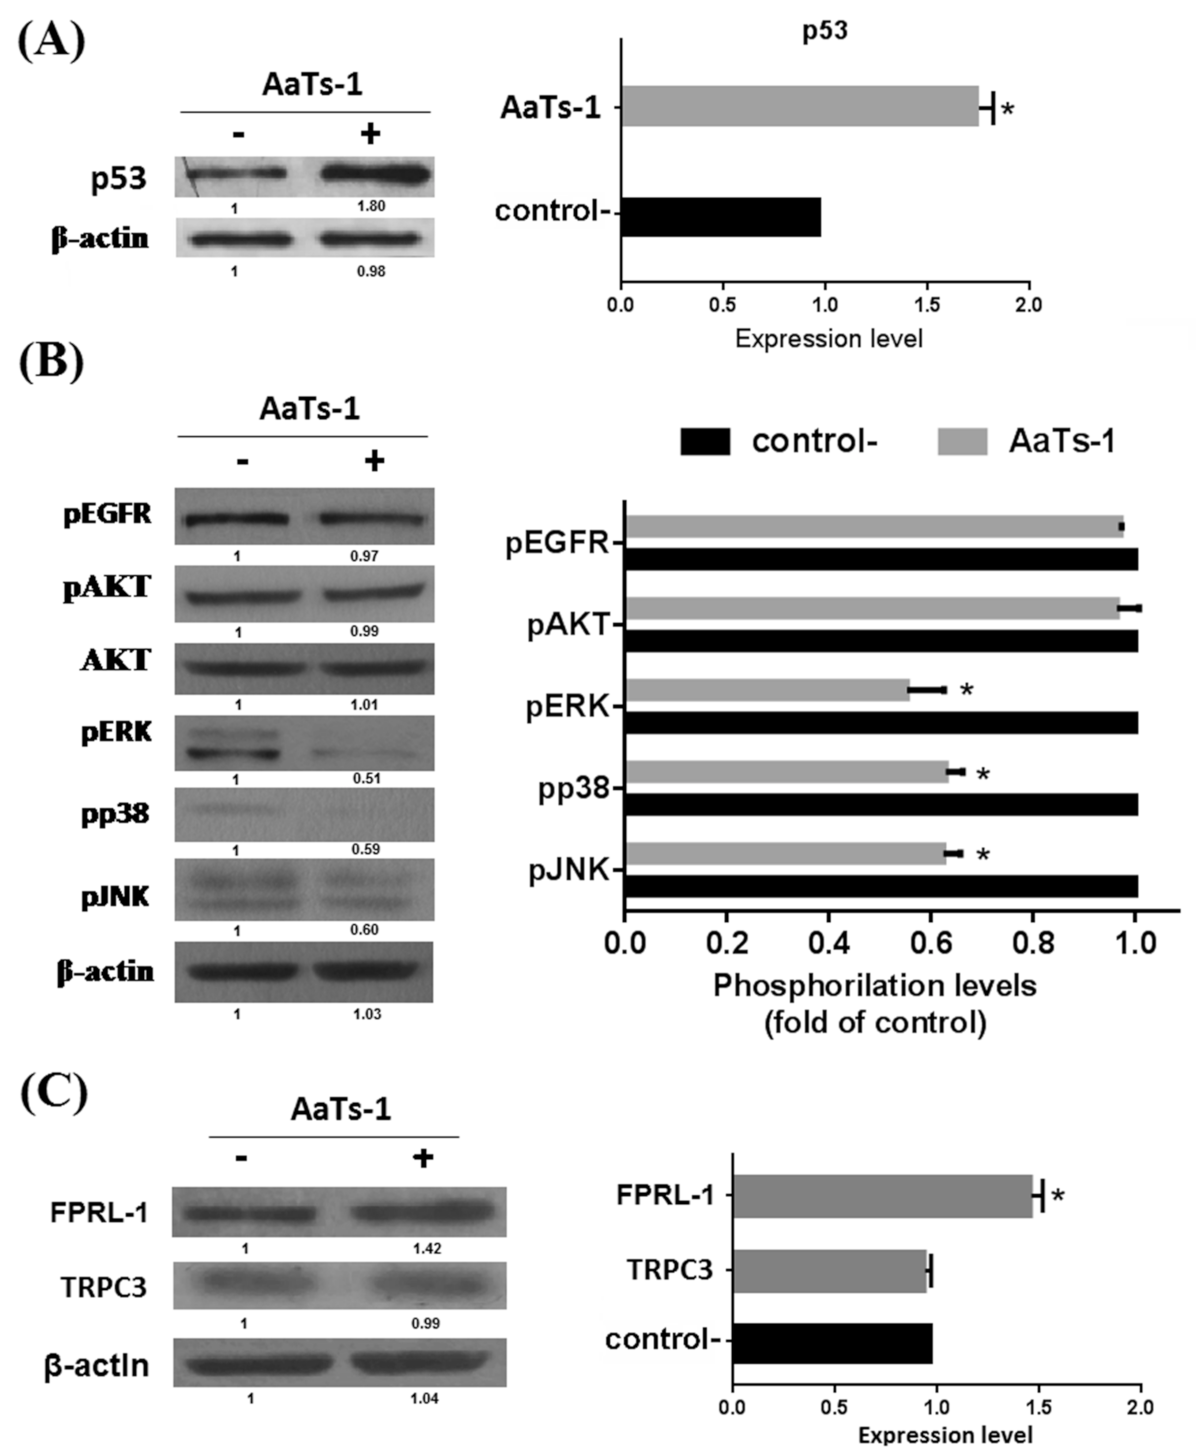
- iv.
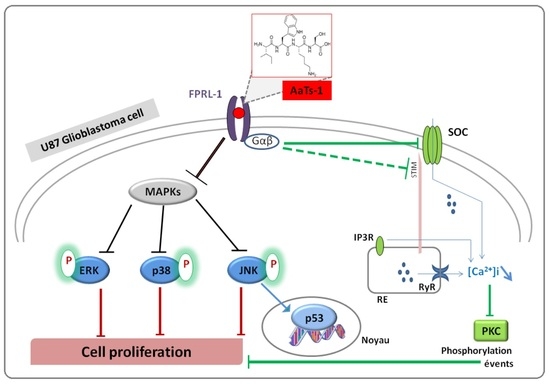
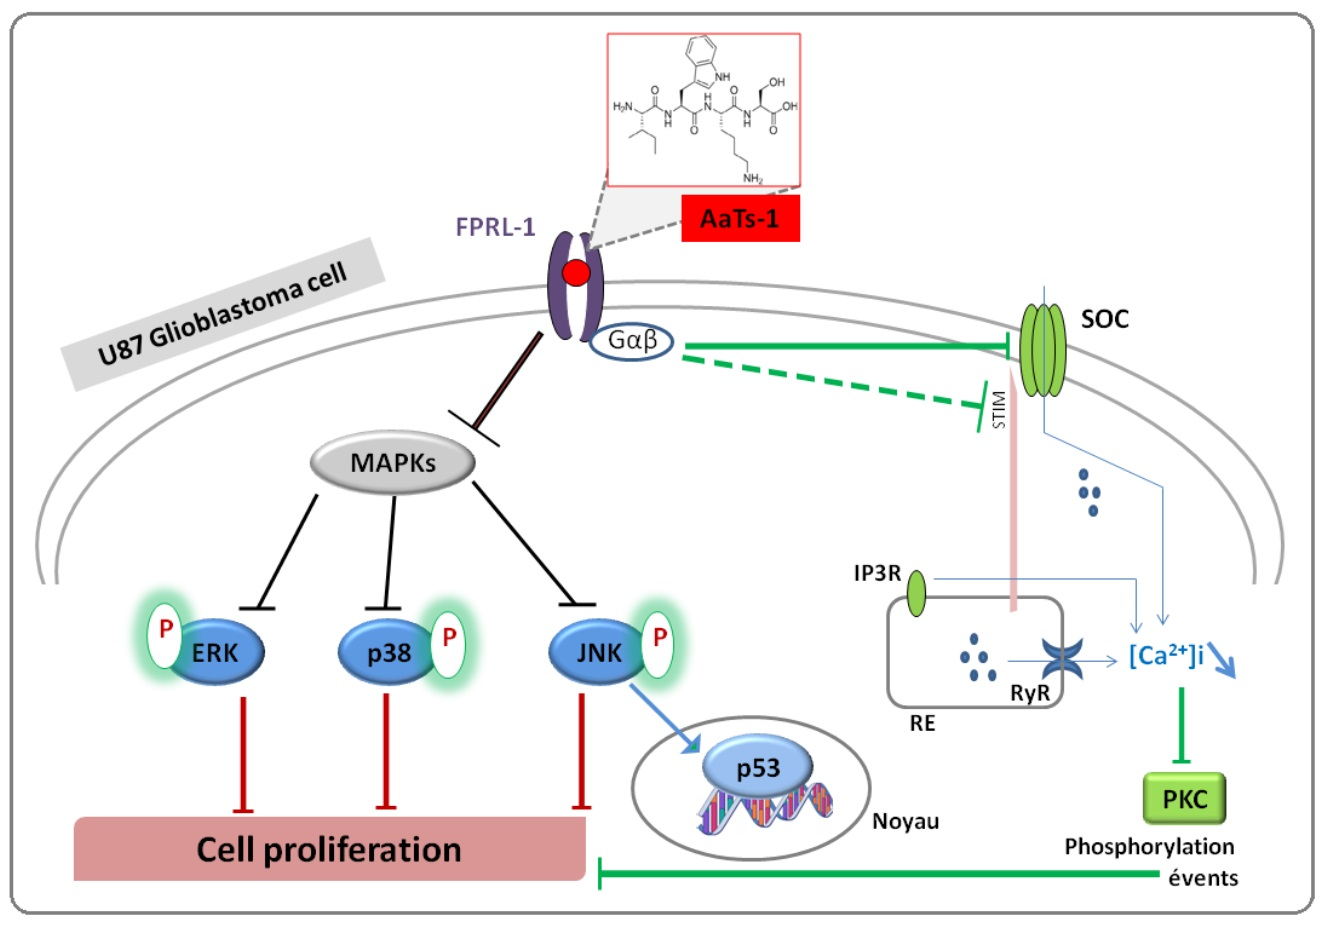
- Finally, we investigated the role of some important and studied markers linked to the growth of U87 glioblastoma cells in vitro such as the epidermal growth factor receptor (EGFR) [23], the tumor suppressor protein p53 [24,25], AKT (Protein kinase B); ERK1/2 (Extracellular-signal-Regulated Kinases 1 and 2); p38 (p38 mitogen-activated protein kinase) and JNK (Jun N-terminal Kinases) [26]. Western blot showed that AaTs-1 (0.56 mM) induced a remarkable increase in the expression of p53 protein (Figure 5A) in U87 cells that was 1.8 times higher than that of mock treated cells. Interestingly, the tetrapeptide AaTs-1 decreased ERK, p38 and JNK phosphorylations by 49%, 41%, and 40%, respectively, while no effect was observed on pAKT and pEGFR (Figure 5B).
2.6. Chemical Synthesis of AaTs-1
2.7. Effect of AaTs-1 in Calcium Influx
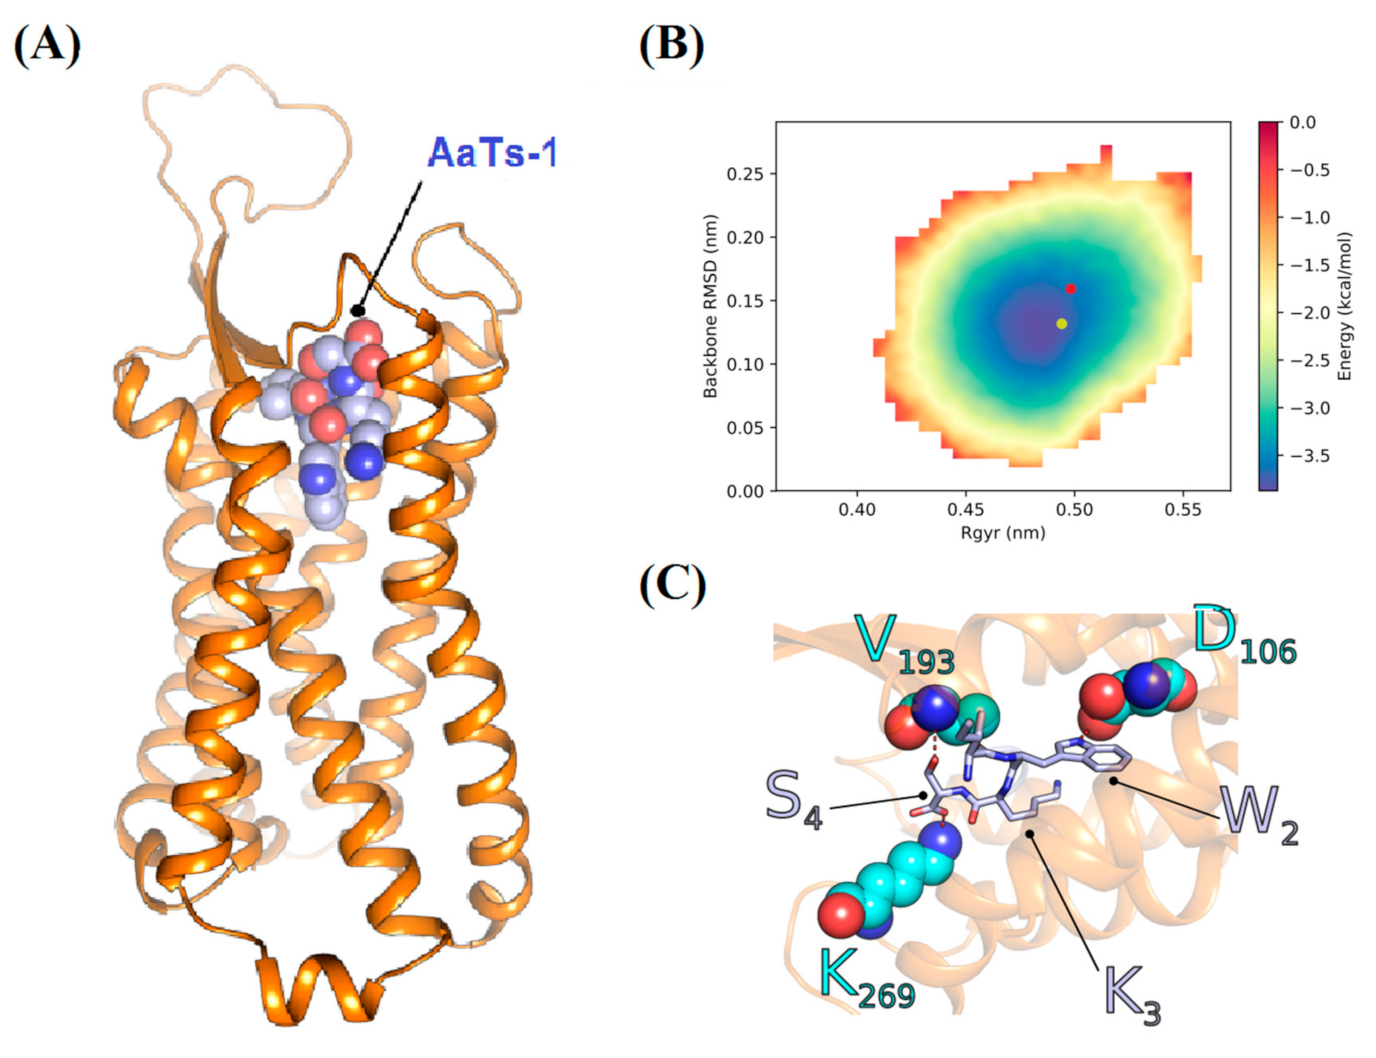
2.8. In Silico Study of AaTs-1/FPRL-1 Interaction
3. Discussion
4. Experimental
4.1. Materials
4.2. Purification
4.3. Pharmacological Characterization
4.3.1. Intracerebro-Ventricular Toxicity Test on Mice
4.3.2. Cell Culture
4.3.3. Cell Viability Test
4.3.4. Cell Proliferation Assay
4.3.5. Cell Adhesion Assay
4.3.6. Cell Migration and Invasion Assays
4.4. Biochemical and Structural Characterization
4.4.1. Mass Spectrometry Analysis
4.4.2. NMR Analysis
4.5. Chemical Synthesis
4.6. In Silico Study
4.6.1. Study of Pharmacokinetic and Pharmacological Properties
4.6.2. Sequence Similarity Search
4.6.3. Homology Based Peptide-Protein Docking
4.7. Functional Characterization
4.7.1. DNA Fragmentation
4.7.2. Analysis of Apoptosis by Flow Cytometry
4.7.3. Cell Cycle Analysis
4.7.4. Western Blot Analysis
4.7.5. Intracellular Ca2+ Measurement
4.8. Image Processing
4.9. Statistics
Supplementary Materials
Author Contributions
Funding
Institutional Review Board Statement
Informed Consent Statement
Data Availability Statement
Acknowledgments
Conflicts of Interest
Sample Availability
Abbreviations
References
- Kleihues, P.; Louis, D.N.; Scheithauer, B.W.; Rorke, L.B.; Reifenberger, G.; Burger, P.C.; Cavenee, W.K. The WHO Classification of Tumors of the Nervous System. J. Neuropathol. Exp. Neurol. 2002, 61, 215–225. [Google Scholar] [CrossRef] [PubMed]
- Lefranc, F.; Sadeghi, N.; Camby, I.; Metens, T.; Dewitte, O.; Kiss, R. Present and potential future issues in glioblastoma treatment. Expert Rev. Anticancer Ther. 2006, 6, 719–732. [Google Scholar] [CrossRef]
- Stupp, R.; Hegi, M.; Neyns, B.; Goldbrunner, R.; Schlegel, U.; Clement, P.M.; Grabenbauer, G.G.; Ochsenbein, A.; Simon, M.; Dietrich, P.-Y.; et al. Phase I/IIa Study of Cilengitide and Temozolomide With Concomitant Radiotherapy Followed by Cilengitide and Temozolomide Maintenance Therapy in Patients with Newly Diagnosed Glioblastoma. J. Clin. Oncol. 2010, 28, 2712–2718. [Google Scholar] [CrossRef] [PubMed] [Green Version]
- Niewald, M.; Berdel, C.; Fleckenstein, J.; Licht, N.; Ketter, R.; Rübe, C. Toxicity after radiochemotherapy for glioblastoma using temozolomide-a retrospective evaluation. Radiat. Oncol. 2011, 6, 141. [Google Scholar] [CrossRef] [PubMed] [Green Version]
- Merck Canada Inc. Monographie de Produit Temodal® Témozolomide. Partie III: Renseignements Pour le Consommateur, Kirkland, Canada. 2017. Available online: http://www.merck.ca/static/pdf/TEMODAL-PM_F.pdf (accessed on 13 May 2021).
- Lan, F.; Yang, Y.; Han, J.; Wu, Q.; Yu, H.; Yue, X. Sulforaphane reverses chemo-resistance to temozolomide in glioblastoma cells by NF-κB-dependent pathway downregulating MGMT expression. Int. J. Oncol. 2016, 48, 559–568. [Google Scholar] [CrossRef] [Green Version]
- Towner, R.A.; Smith, N.; Saunders, D.; Brown, C.A.; Cai, X.; Ziegler, J.; Mallory, S.; Dozmorov, M.; De Souza, P.C.; Wiley, G.; et al. OKN-007 Increases temozolomide (TMZ) Sensitivity and Suppresses TMZ-Resistant Glioblastoma (GBM) Tumor Growth. Transl. Oncol. 2018, 12, 320–335. [Google Scholar] [CrossRef]
- Lee, S.Y. Temozolomide resistance in glioblastoma multiforme. Genes Dis. 2016, 3, 198–210. [Google Scholar] [CrossRef] [PubMed] [Green Version]
- GFME (Glioblastoma Fundation Michèle Esnault): Glioblastome, Origine, Causes, Diagnostic, Pronostic, Traitements, Vaccins. 2016. Available online: http://gfme.free.fr/maladie/glioblastome.html (accessed on 13 May 2021).
- Debin, J.A.; Maggio, J.E.; Strichartz, G.R. Purification and characterization of chlorotoxin, a chloride channel ligand from the venom of the scorpion. Am. J. Physiol. Physiol. 1993, 264, C361–C369. [Google Scholar] [CrossRef]
- Soroceanu, L.; Manning, T.J., Jr.; Sontheimer, H. Modulation of glioma cell migration and invasion using Cl(−) and K(+) ion channel blockers. J. Neurosci. 1999, 19, 5942–5954. [Google Scholar] [CrossRef] [Green Version]
- Abcam. Chlorotoxin Protein (ab60871). Product Datasheet. 2007. Available online: www.abcam.com/Chlorotoxin-protein-ab60871.pdf (accessed on 13 May 2021).
- Deshane, J.; Garner, C.; Sontheimer, H. Chlorotoxin Inhibits Glioma Cell Invasion via Matrix Metalloproteinase-2. J. Biol. Chem. 2003, 278, 4135–4144. [Google Scholar] [CrossRef] [Green Version]
- Lui, V.C.H.; Lung, S.S.S.; Pu, J.K.S.; Hung, K.N.; Leung, G.K.K. Invasion of human glioma cells is regulated by multiple chloride channels including ClC-3. Anticancer Res. 2010, 30, 4515–4524. [Google Scholar] [PubMed]
- Rjeibi, I.; Mabrouk, K.; Mosrati, H.; Berenguer, C.; Mejdoub, H.; Villard, C.; Laffitte, D.; Bertin, D.; Ouafik, L.; Luis, J.; et al. Purification, synthesis and characterization of AaCtx, the first chlorotoxin-like peptide from Androctonus australis scorpion venom. Peptides 2011, 32, 656–663. [Google Scholar] [CrossRef] [PubMed]
- Hackeng, T.M.; Fernandez, J.; Dawson, P.E.; Kent, S.B.H.; Griffin, J. Chemical synthesis and spontaneous folding of a multidomain protein: Anticoagulant microprotein S. Proc. Natl. Acad. Sci. USA 2000, 97, 14074–14078. [Google Scholar] [CrossRef] [Green Version]
- Mlayah-Bellalouna, S.; Dufour, M.; Mabrouk, K.; Mejdoub, H.; Carlier, E.; Othman, H.; Belghazi, M.; Tarbe, M.; Goaillard, J.M.; Gigmes, D.; et al. AaTX1, from Androctonus australis scorpion venom: Purification, synthesis and characterization in dopaminergic neurons. Toxicon 2014, 92, 14–23. [Google Scholar] [CrossRef] [PubMed]
- Martin, M.; Rochat, H. Large scale purification of toxins from the venom of the scorpion Androctonus australis Hector. Toxicon 1986, 24, 1131–1139. [Google Scholar] [CrossRef]
- Clapham, D.E. Calcium signaling. Cell 2007, 131, 1047–1058. [Google Scholar] [CrossRef] [Green Version]
- Kwan, D.H.T.; Kam, A.Y.F.; Wong, Y.H. Activation of the Human FPRL-1 Receptor Promotes Ca2+ Mobilization in U87 Astrocytoma Cells. Neurochem. Res. 2007, 33, 125–133. [Google Scholar] [CrossRef]
- Jacqz-Aigrain, E. Pharmacocinétique des Médicaments ADME (Cours D’enseignement); Service de Pharmacologie Clinique Pédiatrique et Pharmacogénétique Hôpital Robert Debré: Paris, France, 2012. [Google Scholar]
- Vandamme, T.F.; Rival, Y.; Pabst, J.Y.; Heitz, C. Initiation à la Connaissance du Médicament; Edition Médicale Intérnationale; Lavoisier S.A.S.: Paris, France, 2010; p. 303. [Google Scholar]
- Hatanpaa, K.J.; Burma, S.; Zhao, D.; Habib, A.A. Epidermal growth factor receptor in glioma: Signal transduction, neuropathology, imaging, and radioresistance. Neoplasia 2010, 12, 675–684. [Google Scholar] [CrossRef] [Green Version]
- Serrano, M.; Lin, A.W.; McCurrach, M.E.; Beach, D.; Lowe, S.W. Oncogenic ras provokes premature cell senescence associated with accumulation of p53 and p16INK4a. Cell 1997, 88, 593–602. [Google Scholar] [CrossRef] [Green Version]
- Marcotte, R.; Wang, E. Replicative senescence revisited. J. Gerontol. A Biol. Sci. Med. 2002, 57, B257–B269. [Google Scholar] [CrossRef] [Green Version]
- Xia, J.; Yu, X.; Tang, L.; Li, G.; He, T. P2X7 receptor stimulates breast cancer cell invasion and migration via the AKT pathway. Oncol. Rep. 2015, 34, 103–110. [Google Scholar] [CrossRef] [Green Version]
- Merrifield, B. Solid phase synthesis. Science 1986, 232, 341–347. [Google Scholar] [CrossRef] [PubMed] [Green Version]
- Liu, H.; Kim, H.R.; Deepak, R.N.V.K.; Wang, L.; Chung, K.Y.; Fan, H.; Wei, Z.; Zhang, C. Orthosteric and allosteric action of the C5a receptor antagonists. Nat. Struct. Mol. Biol. 2018, 25, 472–481. [Google Scholar] [CrossRef] [PubMed]
- Rabiet, M.-J.; Huet, E.; Boulay, F. The N-formyl peptide receptors and the anaphylatoxin C5a receptors: An overview. Biochimie 2007, 89, 1089–1106. [Google Scholar] [CrossRef]
- Shenouda, G.; Souhami, L.; Petrecca, K.; Owen, S.; Panet-Raymond, V.; Guiot, M.-C.; Corredor, A.G.; Abdulkarim, B. A Phase 2 Trial of Neoadjuvant Temozolomide Followed by Hypofractionated Accelerated Radiation Therapy With Concurrent and Adjuvant Temozolomide for Patients with Glioblastoma. Int. J. Radiat. Oncol. 2017, 97, 487–494. [Google Scholar] [CrossRef]
- Singh, N.; Miner, A.; Hennis, L.; Mittal, S. Mechanisms of temozolomide resistance in glioblastoma—A comprehensive review. Cancer Drug Resist. 2021, 4, 17–43. [Google Scholar] [CrossRef]
- Song, S.; Mao, G.; Du, J.; Zhu, X. Novel RGD containing, temozolomide-loading nanostructured lipid carriers for glioblastoma multiforme chemotherapy. Drug Deliv. 2016, 23, 1404–1408. [Google Scholar] [CrossRef] [PubMed] [Green Version]
- Chen, J.; Nikolovska-Coleska, Z.; Wang, G.; Qiu, S.; Wang, S. Design, synthesis, and characterization of new embelin derivatives as potent inhibitors of X-linked inhibitor of apoptosis protein. Bioorg. Med. Chem. Lett. 2006, 16, 5805–5808. [Google Scholar] [CrossRef]
- Lefranc, F.; Sauvage, S.; Van Goietsenoven, G.; Mégalizzi, V.; Lamoral-Theys, D.; Debeir, O.; Spiegl-Kreinecker, S.; Berger, W.; Mathieu, V.; Decaestecker, C.; et al. Narciclasine, a plant growth modulator, activates Rho and stress fibers in glioblastoma cells. Mol. Cancer Ther. 2009, 8, 1739–1750. [Google Scholar] [CrossRef] [Green Version]
- Merlino, F.; Daniele, S.; La Pietra, V.; Di Maro, S.; Di Leva, F.S.; Brancaccio, D.; Tomassi, S.; Giuntini, S.; Cerofolini, L.; Fragai, M.; et al. Simultaneous Targeting of RGD-Integrins and Dual Murine Double Minute Proteins in Glioblastoma Multiforme. J. Med. Chem. 2018, 61, 4791–4809. [Google Scholar] [CrossRef]
- Cicenas, J.; Zalyte, E.; Rimkus, A.; Dapkus, D.; Noreika, R.; Urbonavicius, S. JNK, p38, ERK, and SGK1 Inhibitors in Cancer. Cancers 2017, 10, 1. [Google Scholar] [CrossRef] [PubMed] [Green Version]
- Kim, S.-S.; Rait, A.; Kim, E.; Pirollo, K.F.; Chang, E.H. A tumor-targeting p53 nanodelivery system limits chemoresistance to temozolomide prolonging survival in a mouse model of glioblastoma multiforme. Nanomed. Nanotechnol. Biol. Med. 2014, 11, 301–311. [Google Scholar] [CrossRef] [Green Version]
- Wang, X.; Chen, J.X.; Liu, Y.H.; You, C.; Mao, Q. Mutant TP53 enhances the resistance of glioblastoma cells to temozolomide by up-regulating O(6)-methylguanine DNA-methyltransferase. Neurol. Sci. 2013, 34, 1421–1428. [Google Scholar] [CrossRef]
- Gomez-Manzano, C.; Fueyo, J.; Kyritsis, A.P.; Steck, P.A.; Levin, V.A.; Alfred Yung, W.K.; McDonnell, T.J. Characterization of p53 and p21 Functional Interactions in Glioma Cells en Route to Apoptosis. J. Natl. Cancer Inst. 1997, 89, 1036–1044. [Google Scholar] [CrossRef] [PubMed] [Green Version]
- Momand, J.; Wu, H.H.; Dasgupta, G. MDM2--master regulator of the p53 tumor suppressor protein. Gene 2000, 242, 15–29. [Google Scholar] [CrossRef]
- Woods, D.B.; Vousden, K.H. Regulation of p53 function. Exp. Cell Res. 2001, 264, 56–66. [Google Scholar] [CrossRef] [PubMed]
- Fuchs, S.Y.; Adler, V.; Pincus, M.R.; Ronai, Z. MEKK1/JNK signaling stabilizes and activates p53. Proc. Natl. Acad. Sci. USA 1998, 95, 10541–10546. [Google Scholar] [CrossRef] [Green Version]
- Costa, B.; Bendinelli, S.; Gabelloni, P.; Da Pozzo, E.; Daniele, S.; Scatena, F.; Vanacore, R.; Campiglia, P.; Bertamino, A.; Gomez-Monterrey, I.; et al. Human Glioblastoma Multiforme: p53 Reactivation by a Novel MDM2 Inhibitor. PLoS ONE 2013, 8, e72281. [Google Scholar] [CrossRef]
- Ubeaud-Sequier, G. Mécanisme et Facteurs Responsables et Influençant les Paramètres Pharmacocinétiques; Laboratoire d’Innovation Thérapeutique (Ouvrage d’enseignement), Université de Strasbourg: Strasbourg, France, 2007. [Google Scholar]
- Shalabi, A.; Zamudio, F.; Wu, X.; Scaloni, A.; Possani, L.D.; Villereal, M.L. Tetrapandins, a New Class of Scorpion Toxins That Specifically Inhibit Store-operated Calcium Entry in Human Embryonic Kidney-293 Cells. J. Biol. Chem. 2004, 279, 1040–1049. [Google Scholar] [CrossRef] [Green Version]
- Bomben, V.C.; Sontheimer, H.W. Inhibition of transient receptor potential canonical channels impairs cytokinesis in human malignant gliomas. Cell Prolif. 2008, 41, 98–121. [Google Scholar] [CrossRef]
- Cattaneo, F.; Guerra, G.; Ammendola, R. Expression and Signaling of Formyl-Peptide Receptors in the Brain. Neurochem. Res. 2010, 35, 2018–2026. [Google Scholar] [CrossRef]
- Le, Y.; Hu, J.; Gong, W.; Shen, W.; Li, B.; Dunlop, N.M.; Halverson, D.O.; Blair, D.G.; Wang, J.M. Expression of functional formyl peptide receptors by human astrocytoma cell lines. J. Neuroimmunol. 2000, 111, 102–108. [Google Scholar] [CrossRef]
- Snapkov, I.; Öqvist, C.O.; Figenschau, Y.; Kogner, P.; Johnsen, J.I.; Sveinbjørnsson, B. The role of formyl peptide receptor 1 (FPR1) in neuroblastoma tumorigenesis. BMC Cancer 2016, 16, 490. [Google Scholar] [CrossRef] [Green Version]
- Bae, Y.-S.; Song, J.Y.; Kim, Y.; He, R.; Ye, R.D.; Kwak, J.-Y.; Suh, P.-G.; Ryu, S.H. Differential Activation of Formyl Peptide Receptor Signaling by Peptide Ligands. Mol. Pharmacol. 2003, 64, 841–847. [Google Scholar] [CrossRef] [PubMed]
- Medecine Sorbonne Universite. Chapitre 6-Mécanisme D’action des Médicaments. Interactions Médicaments-Récepteurs. Relations Doses, Concentration, Récepteurs, Effets. 2021. Available online: http://www.chups.jussieu.fr/polys/pharmaco/poly/POLY.Chp.6.3.3.html (accessed on 27 June 2021).
- Christophe, T.; Karlsson, A.; Dugave, C.; Rabiet, M.J.; Boulay, F.; Dahlgren, C. The synthetic peptide Trp-Lys-Tyr-Met-Val-Met-NH2 specifically activates neutrophils through FPRL1/lipoxin A4 receptors and is an agonist for the orphan monocyte-expressed chemoattractant receptor FPRL2. J. Biol. Chem. 2001, 276, 21585–21593. [Google Scholar] [CrossRef] [Green Version]
- Cattaneo, F.; Russo, R.; Castaldo, M.; Chambery, A.; Zollo, C.; Esposito, G.; Pedone, P.V.; Ammendola, R. Phosphoproteomic analysis sheds light on intracellular signaling cascades triggered by Formyl-Peptide Receptor 2. Sci. Rep. 2019, 9, 17894. [Google Scholar] [CrossRef]
- Chen, Y.F.; Lin, P.C.; Yeh, Y.M.; Chen, L.H.; Shen, M.R. Store-Operated Ca2+ Entry in Tumor Progression: From Molecular Mechanisms to Clinical Implications. Cancers 2019, 11, 899. [Google Scholar] [CrossRef] [Green Version]
- Smyth, J.T.; Hwang, S.-Y.; Tomita, T.; DeHaven, W.I.; Mercer, J.C.; Putney, J.W. Activation and regulation of store-operated calcium entry. J. Cell. Mol. Med. 2010, 14, 2337–2349. [Google Scholar] [CrossRef]
- Serwach, K.; Gruszczynska-Biegala, J. Target Molecules of STIM Proteins in the Central Nervous System. Front. Mol. Neurosci. 2020, 13, 247. [Google Scholar] [CrossRef]
- Wurzinger, B.; Mair, A.; Pfister, B.; Teige, M. Cross-talk of calcium-dependent protein kinase and MAP kinase signaling. Plant Signal. Behav. 2011, 6, 8–12. [Google Scholar] [CrossRef] [PubMed]
- Sekiya, F. Phospholipase C. In Encyclopedia of Biological Chemistry, 2nd ed.; Lennarz, W.J., Lane, M.D., Eds.; Academic Press: Cambridge, MA, USA, 2013; pp. 467–471. [Google Scholar] [CrossRef]
- Liao, H.J.; Carpenter, G. Chapter 110—Phospholipase C. In Handbook of Cell Signaling—Section C: Calcium Mobilization; Bradshaw, R.A., Dennis, E.A., Eds.; Academic Press: Cambridge, MA, USA, 2010; pp. 887–891. [Google Scholar]
- Hou, J.; Diao, Y.; Li, W.; Yang, Z.; Zhang, L.; Chen, Z.; Wu, Y. RGD peptide conjugation results in enhanced antitumor activity of PD0325901 against glioblastoma by both tumor-targeting delivery and combination therapy. Int. J. Pharm. 2016, 505, 329–340. [Google Scholar] [CrossRef]
- Heckmann, D.; Kessler, H. Design and chemical synthesis of integrin ligands. Methods Enzymol. 2007, 426, 463–503. [Google Scholar] [PubMed]
- Miranda, F.; Kupeyan, C.; Rochat, H.; Rochat, C.; Lissitzky, S. Purification of animal neurotoxins. Isolation and characterization of eleven neurotoxins from the venoms of the scorpions Androctonus australis hector, Buthus occitanus tunetanus and Leiurus quinquestriatus quinquestriatus. Eur. J. Biochem. 1970, 16, 514–523. [Google Scholar] [CrossRef] [PubMed]
- Galeotti, N.; Bartolini, A.; Ghelardini, C. Diphenhydramine-induced amnesia is mediated by Gi-protein activation. Neuroscience 2003, 122, 471–478. [Google Scholar] [CrossRef]
- Sarray, S.; Delamarre, E.; Marvaldi, J.; El Ayeb, M.; Marrakchi, N.; Luis, J. Lebectin and lebecetin, two C-type lectins from snake venom, inhibit alpha5beta1 and alphaV-containing integrins. Matrix Biol. 2007, 26, 306–313. [Google Scholar] [CrossRef]
- Šali, A.; Blundell, T.L. Comparative Protein Modelling by Satisfaction of Spatial Restraints. J. Mol. Biol. 1993, 234, 779–815. [Google Scholar] [CrossRef] [PubMed]
- Shen, M.-Y.; Sali, A. Statistical potential for assessment and prediction of protein structures. Protein Sci. 2006, 15, 2507–2524. [Google Scholar] [CrossRef] [Green Version]


Publisher’s Note: MDPI stays neutral with regard to jurisdictional claims in published maps and institutional affiliations. |
© 2021 by the authors. Licensee MDPI, Basel, Switzerland. This article is an open access article distributed under the terms and conditions of the Creative Commons Attribution (CC BY) license (https://creativecommons.org/licenses/by/4.0/).
Share and Cite
Aissaoui-Zid, D.; Saada, M.-C.; Moslah, W.; Potier-Cartereau, M.; Lemettre, A.; Othman, H.; Gaysinski, M.; Abdelkafi-Koubaa, Z.; Souid, S.; Marrakchi, N.; et al. AaTs-1: A Tetrapeptide from Androctonus australis Scorpion Venom, Inhibiting U87 Glioblastoma Cells Proliferation by p53 and FPRL-1 Up-Regulations. Molecules 2021, 26, 7610. https://doi.org/10.3390/molecules26247610
Aissaoui-Zid D, Saada M-C, Moslah W, Potier-Cartereau M, Lemettre A, Othman H, Gaysinski M, Abdelkafi-Koubaa Z, Souid S, Marrakchi N, et al. AaTs-1: A Tetrapeptide from Androctonus australis Scorpion Venom, Inhibiting U87 Glioblastoma Cells Proliferation by p53 and FPRL-1 Up-Regulations. Molecules. 2021; 26(24):7610. https://doi.org/10.3390/molecules26247610
Chicago/Turabian StyleAissaoui-Zid, Dorra, Mohamed-Chiheb Saada, Wassim Moslah, Marie Potier-Cartereau, Aude Lemettre, Houcemeddine Othman, Marc Gaysinski, Zaineb Abdelkafi-Koubaa, Soumaya Souid, Naziha Marrakchi, and et al. 2021. "AaTs-1: A Tetrapeptide from Androctonus australis Scorpion Venom, Inhibiting U87 Glioblastoma Cells Proliferation by p53 and FPRL-1 Up-Regulations" Molecules 26, no. 24: 7610. https://doi.org/10.3390/molecules26247610
APA StyleAissaoui-Zid, D., Saada, M.-C., Moslah, W., Potier-Cartereau, M., Lemettre, A., Othman, H., Gaysinski, M., Abdelkafi-Koubaa, Z., Souid, S., Marrakchi, N., Vandier, C., Essafi-Benkhadir, K., & Srairi-Abid, N. (2021). AaTs-1: A Tetrapeptide from Androctonus australis Scorpion Venom, Inhibiting U87 Glioblastoma Cells Proliferation by p53 and FPRL-1 Up-Regulations. Molecules, 26(24), 7610. https://doi.org/10.3390/molecules26247610