
ICP-MS Measurement of Trace and Rare Earth Elements in Beach Placer-Deposit Soils of Odisha, East Coast of India, to Estimate Natural Enhancement of Elements in the Environment

 ,
,
Abstract
:1. Introduction
- (1)
- To validate analysis of TEs and REEs with certified reference materials using ICP-MS;
- (2)
- Determination of TEs and REEs in Chhatrapur–Gopalpur beach placer-deposit soils;
- (3)
- Estimation of EF and Igeo of TEs to evaluate natural enrichment and anthropogenic contamination in soils;
- (4)
- To understand the origin/source of TEs and REEs in beach placer-deposit soils.
2. Results and Discussion
2.1. Analytical Validation of TEs and REEs
2.2. TEs in Beach Placer-Deposit Soils
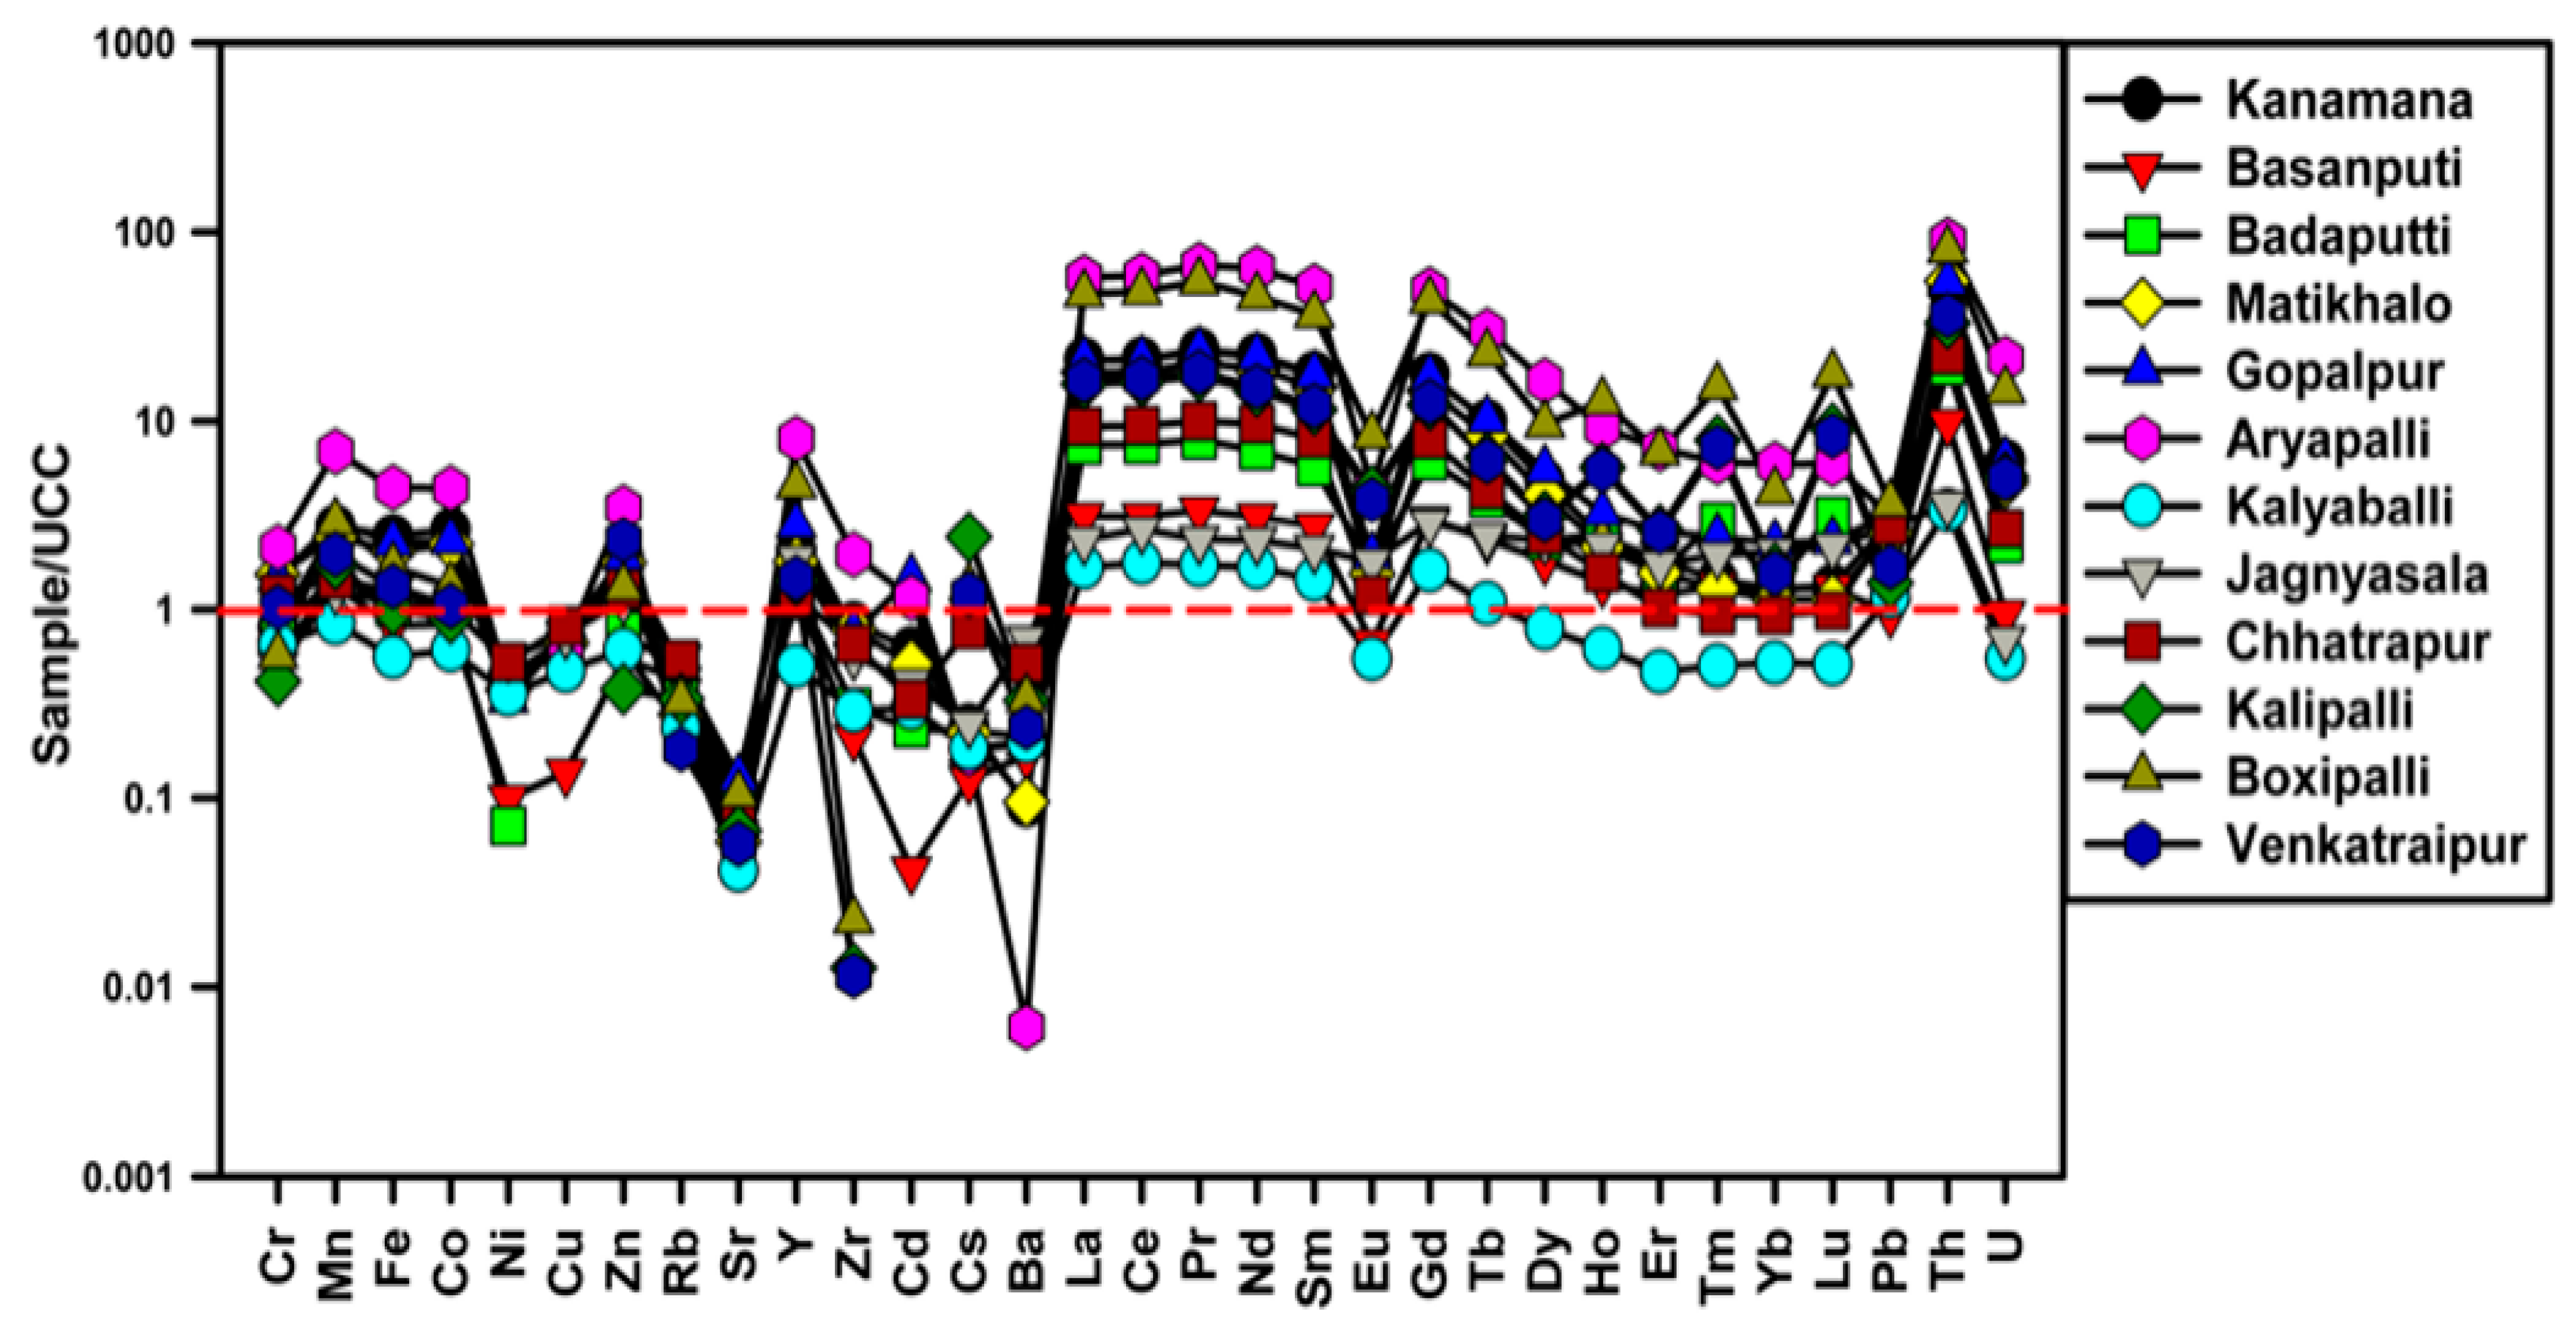
2.3. Enrichment Factor (EF) of TEs in Soil
2.4. Geoaccumulation Index (Igeo) of TEs in Soils
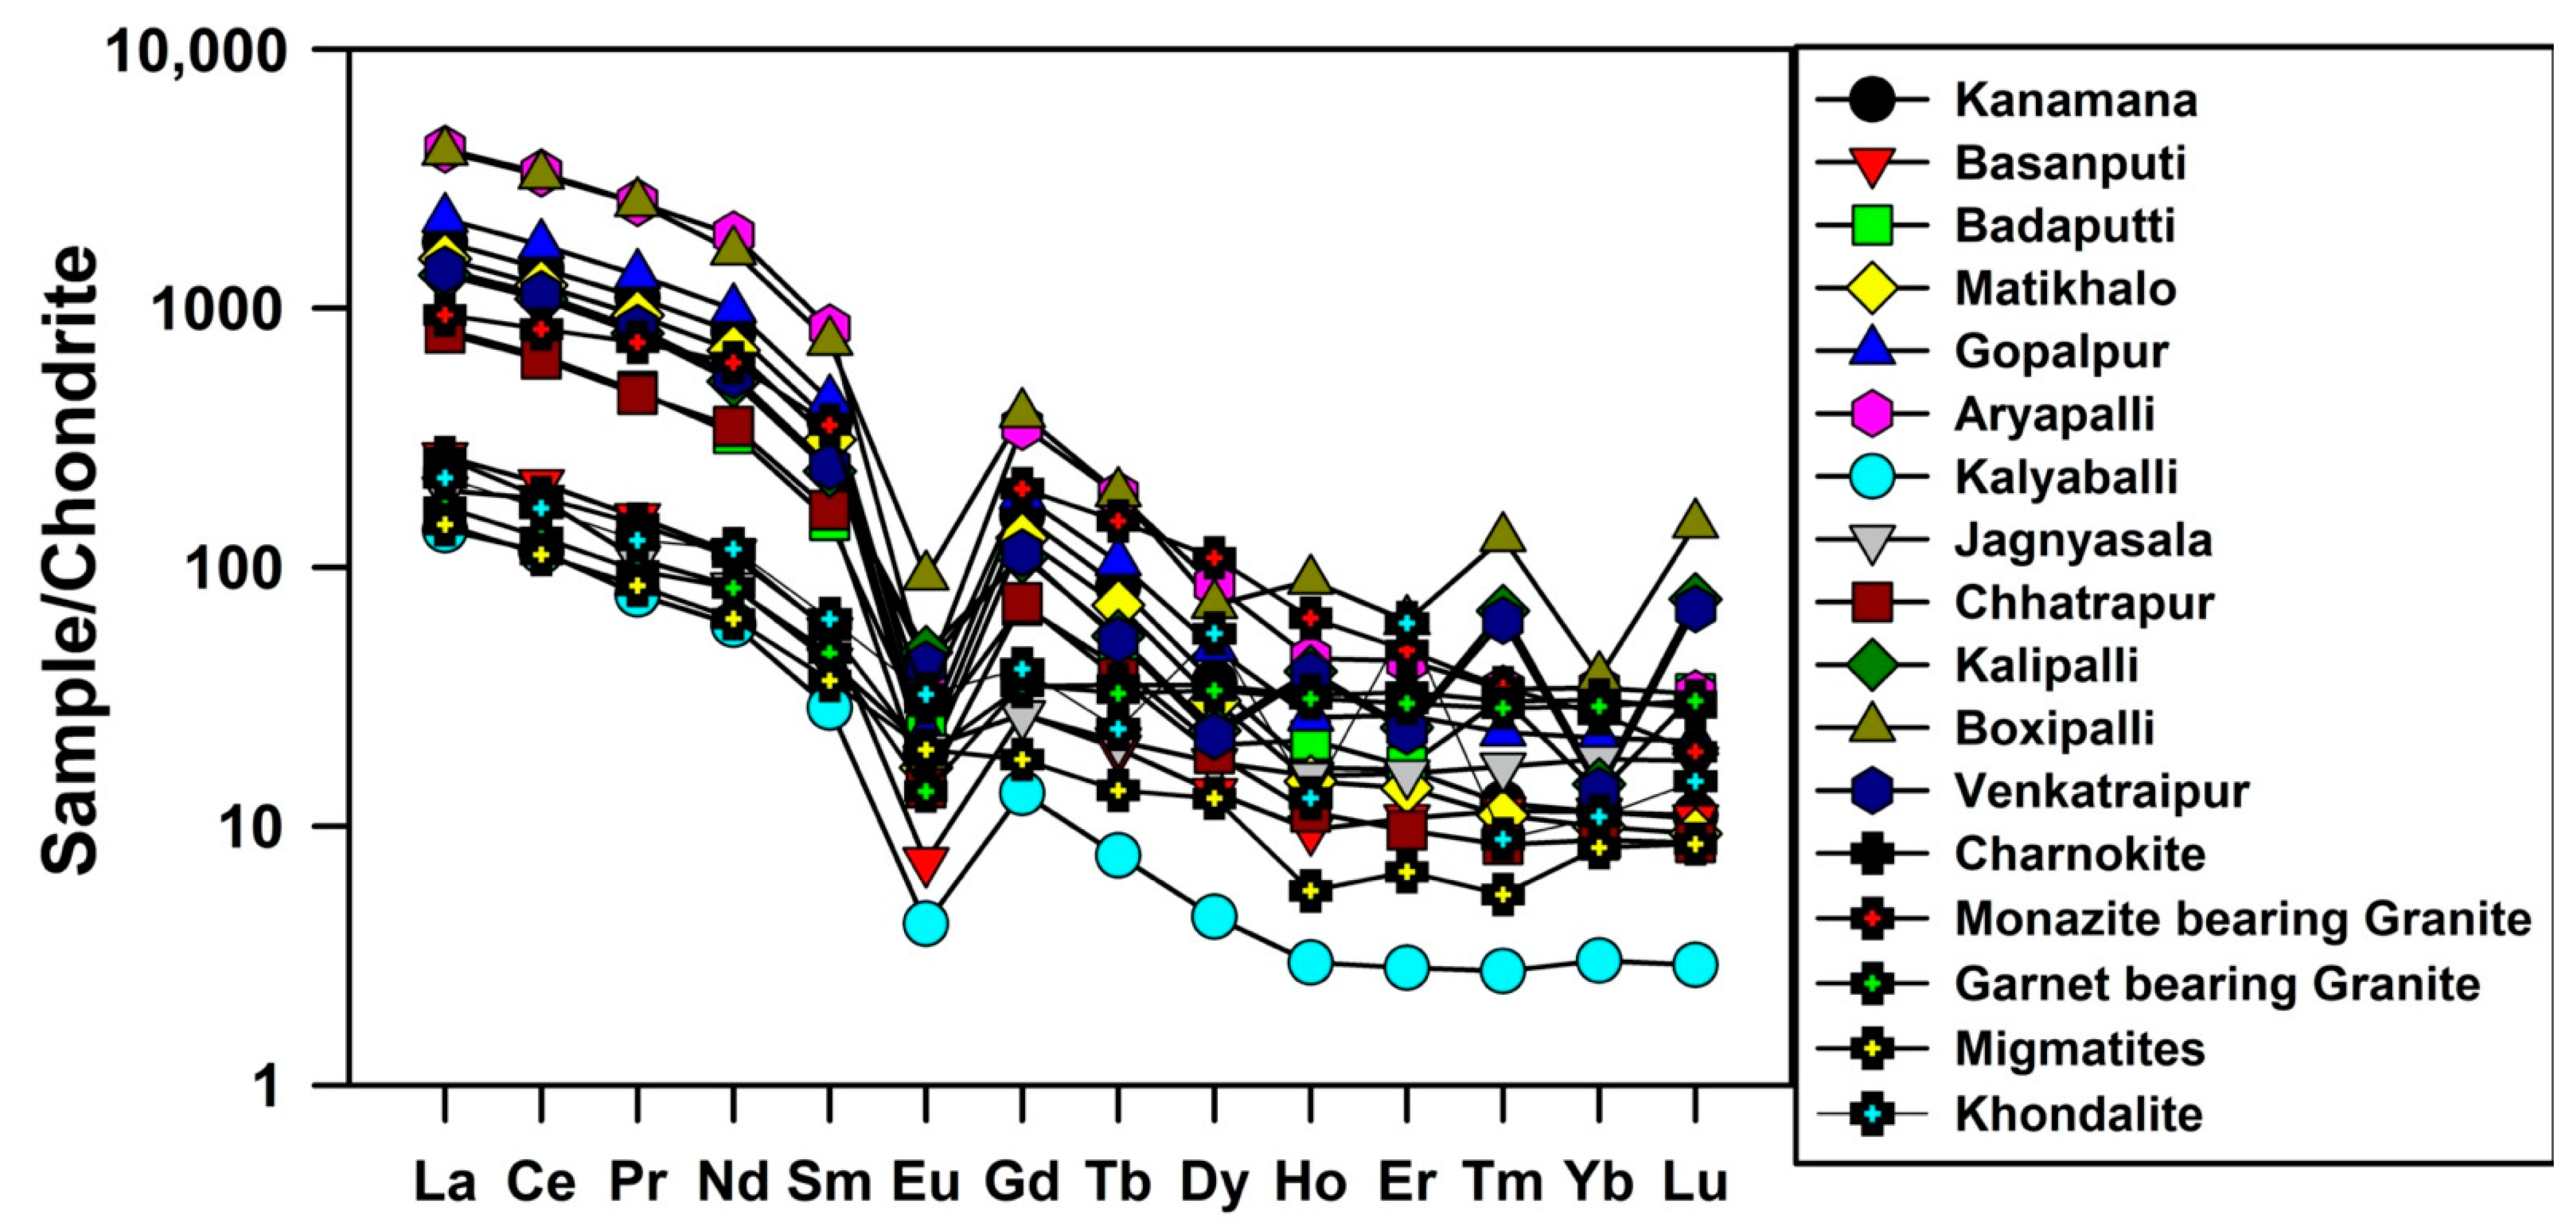
2.5. Geochemistry of REEs in Soils
2.6. Possible Source for TEs and REEs Enrichment in Soils
3. Materials and Methods
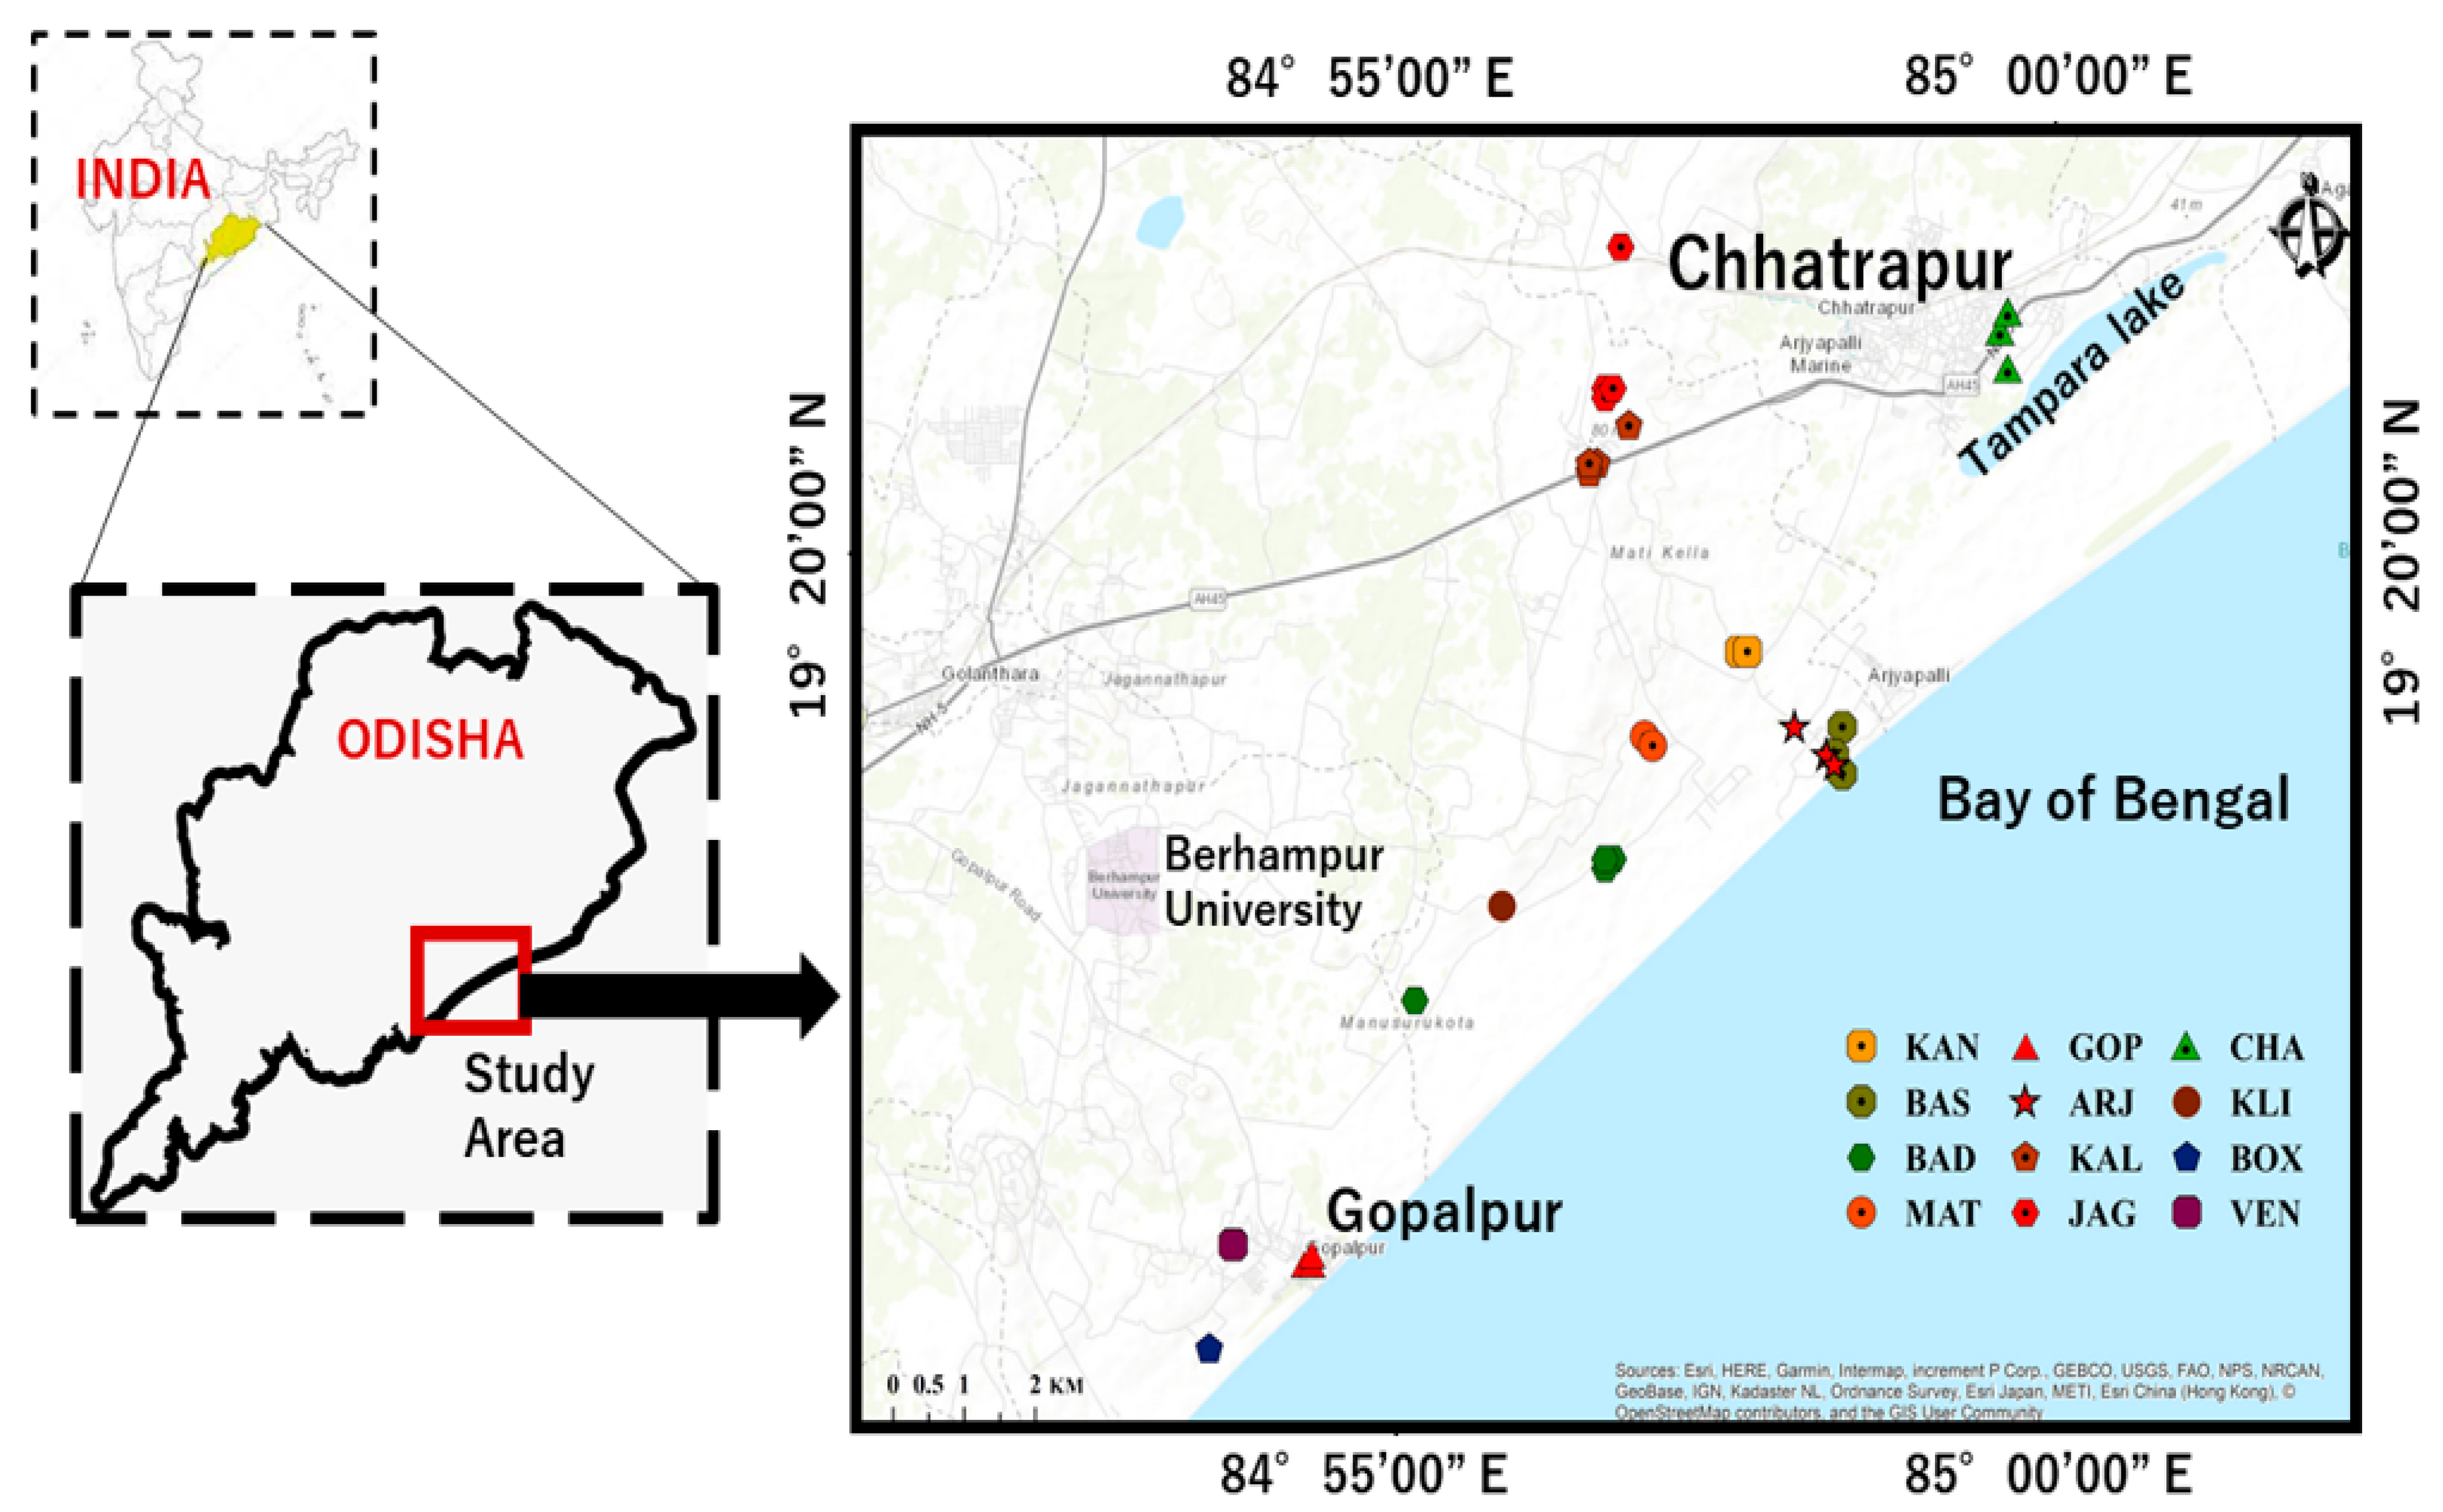
3.1. Study Area
3.2. Sampling and Sample Preparation
3.3. Measurement of Trace Elelements and REEs
3.4. Pollution Indices
4. Conclusions
Author Contributions
Funding
Institutional Review Board Statement
Informed Consent Statement
Data Availability Statement
Acknowledgments
Conflicts of Interest
Sample Availability
References
- Govil, P.K.; Sorlie, J.E.; Murthy, N.N.; Sujatha, D.; Reddy, G.L.N.; Rudolph-Lund, K.; Krishna, A.K.; Mohan, K.R. Soil contamination of trace elements in the Katedan industrial development area, Hyderabad, India. Environ. Monit. Assess. 2008, 140, 313–323. [Google Scholar] [CrossRef]
- Malik, R.N.; Jadoon, W.A.; Husain, S.Z. Metal contamination of surface soils of industrial city Sialkot, Pakistan: A multivariate and GIS approach. Environ. Geochem. Health 2010, 32, 179–191. [Google Scholar] [CrossRef] [PubMed]
- Wang, L.; Liang, T. Geochemical fractions of rare earth elements in soil around a mine tailing in Baotou, China. Sci. Rep. 2015, 5, 12483. [Google Scholar] [CrossRef] [Green Version]
- Hu, Z.; Haneklaus, S.; Sparovek, G.; Schnug, E. Rare earth elements in soils. Commun. Soil Sci. Plant Anal. 2006, 37, 1381–1420. [Google Scholar] [CrossRef]
- Ramos, S.J.; Dinali, G.S.; Oliveira, C.; Martins, G.C.; Moreira, C.G.; Siqueira, J.O.; Guilherme, L.R.G. Rare earth elements in the soil environment. Curr. Pollut. Rep. 2016, 2, 28–50. [Google Scholar] [CrossRef] [Green Version]
- Sá Paye, H.; Mello, J.W.V.; Mascarenhas, G.R.L.; Gasparon, M. Distribution and fractionation of the rare earth elements in Brazilian soils. J. Geochem. Explor. 2016, 161, 27–41. [Google Scholar] [CrossRef] [Green Version]
- Sojka, M.; Choinski, A.; Ptak, M.; Siepak, M. Causes of variation of trace and rare earth elements concentration in lakes bottom sediments in the Bory Tucholskie National Park, Poland. Sci. Rep. 2021, 11, 244. [Google Scholar] [CrossRef] [PubMed]
- Marques, R.; Prudêncio, M.I.; Rocha, F.; Cabral Pinto, M.M.S.; Silva, M.M.V.G.; Ferreira da Silva, E. REE and other trace and major elements in the topsoil layer of Santiago Island, Cape Verde. J. Afr. Earth Sci. 2012, 64, 20–33. [Google Scholar] [CrossRef]
- Kowalska, J.B.; Mazurek, R.; Gąsiorek, M.; Zaleski, T. Pollution indices as useful tools for the comprehensive evaluation of the degree of soil contamination—A review. Environ. Geochem. Health 2018, 40, 2395–2420. [Google Scholar] [CrossRef] [Green Version]
- Behera, P. Heavy minerals in beach sands of Gopalpur and Paradeep along Orissa coastline, east cost of India. Indian J. Mar. Sci. 2003, 32, 172–174. [Google Scholar]
- Rao, N.S.; Misra, S. Sources of monazite sand in southern Orissa beach placer, eastern India. J. Geol. Soc. India 2009, 74, 357–362. [Google Scholar]
- Anitha, J.K.; Joseph, S.; Rejith, R.G.; Sundararajan, M. Monazite chemistry and its distribution along the coast of Neendakara–Kayamkulam belt, Kerala, India. SN Appl. Sci. 2020, 2, 812. [Google Scholar] [CrossRef] [Green Version]
- Withanage, A.P.; Mahawatte, P. Radioactivity of beach sand in the southwestern coast of Sri Lanka. Radiat. Prot. Dosim. 2013, 153, 384–389. [Google Scholar] [CrossRef]
- Papadopoulos, A.; Christofides, G.; Koroneos, A.; Stoulos, S. Natural radioactivity distribution and gamma radiation exposure of beach sands from Sithonia Peninsula. Cent. Eur. J. Geosci. 2014, 6, 229–242. [Google Scholar] [CrossRef]
- Caridi, F.; Marguccio, S.; Belvedere, A.; Belmusto, G.; Marcianò, G.; Sabatino, G.; Mottese, A. Natural radioactivity and elemental composition of beach sands in the Calabria region, south of Italy. Environ. Earth Sci. 2016, 75, 629. [Google Scholar] [CrossRef]
- Shuaibu, H.K.; Khandaker, M.U.; Alrefae, T.; Bradley, D.A. Assessment of natural radioactivity and gamma-ray dose in monazite rich black Sand Beach of Penang Island, Malaysia. Mar. Pollut. Bull. 2017, 119, 423–428. [Google Scholar] [CrossRef]
- Yasmin, S.; Barua, B.S.; Khandaker, M.U.; Kamal, M.; Rashid, M.A.; Sani, S.A.; Ahmed, H.; Nikouravan, B.; Bradley, D.A. The presence of radioactive materials in soil, sand and sediment samples of Potenga sea beach area, Chittagong, Bangladesh: Geological characteristics and environmental implication. Results Phys. 2018, 8, 1268–1274. [Google Scholar] [CrossRef]
- Van Hao, D.; Dinh, C.N.; Jodłowski, P.; Kovacs, T. High-level natural radionuclides from the Mandena deposit, South Madagascar. J. Radioanal. Nucl. Chem. 2019, 319, 1331–1338. [Google Scholar] [CrossRef]
- Radhakrishna, A.P.; Somasekarappa, H.M.; Narayana, Y.; Siddappa, K. A new natural background radiation area on the southwest coast of India. Health Phys. 1993, 65, 390–395. [Google Scholar] [CrossRef] [PubMed]
- Paul, A.C.; Pillai, P.M.B.; Haridasan, P.P.; Radhakrishnan, S.; Krishnamony, S. Population exposure to airborne thorium at the high natural radiation areas in India. J. Environ. Radioact. 1998, 40, 251–259. [Google Scholar] [CrossRef]
- Nair, M.K.; Nambi, K.S.V.; Amma, N.S.; Gangadharan, P.; Jayalekshmi, P.; Jayadevan, S.; Cherian, V.; Reghuram, K.N. Population study in the high natural background radiation area in Kerala, India. Radiat. Res. 1999, 152, 145–148. [Google Scholar] [CrossRef]
- Kannan, V.; Rajan, M.P.; Iyngar, M.A.R.; Ramesh, R. Distribution of natural and anthropogenic radionuclides in soil and beach sand samples of Kalpakkam (India) using hyper pure germanium (HPGe) gamma ray spectrometry. Appl. Radiat. Isot. 2002, 57, 109–119. [Google Scholar] [CrossRef]
- Singh, H.N.; Shanker, D.; Neelakandan, V.N.; Singh, V.P. Distribution patterns of natural radioactivity and delineation of anomalous radioactive zones using in situ radiation observations in southern Tamil Nadu, India. J. Hazard. Mater. 2007, 141, 264–272. [Google Scholar] [CrossRef] [PubMed]
- Perumalsamy, C.; Bhadra, S.; Balakrishnan, S. Decoding evolutionary history of provenance from beach placer monazites: A case study from Kanyakumari coast, southwest India. Chem. Geol. 2016, 427, 83–97. [Google Scholar] [CrossRef]
- Veerasamy, N.; Sahoo, S.K.; Inoue, K.; Arae, H.; Fukushi, M. Geochemical behaviour of uranium and thorium in sand and sandy soil samples from a natural high background radiation area of the Odisha coast, India. Environ. Sci. Pollut. Res. 2020, 27, 31339–31349. [Google Scholar] [CrossRef] [PubMed]
- Mohanty, A.K.; Sengupta, D.; Das, S.K.; Saha, S.K.; Van, K.V. Natural radioactivity and radiation exposure in the high background area at Chhatrapur beach placer deposit of Orissa, India. J. Environ. Radioact. 2004, 75, 15–33. [Google Scholar] [CrossRef]
- Sahoo, S.K.; Kierepko, R.; Sorimachi, A.; Omori, Y.; Ishikawa, T.; Tokonami, S.; Prasad, G.; Gusain, G.S.; Ramola, R.C. Natural radioactivity level and elemental composition of soil samples from a high background radiation area on eastern coast of India (Odisha). Radiat. Prot. Dosim. 2016, 171, 172–178. [Google Scholar] [CrossRef] [PubMed]
- Inoue, K.; Sahoo, S.K.; Veerasamy, N.; Kasahara, S.; Fukushi, M. Distribution patterns of gamma radiation dose rate in the high background radiation area of Odisha, India. J. Radioanal. Nucl. Chem. 2020, 324, 1423–1434. [Google Scholar] [CrossRef]
- Ghosal, S.; Singh, A.; Agrahari, S.; Sengupta, D. Delineation of heavy mineral bearing placers by electrical resistivity and radiometric techniques along coastal Odisha, India. Pure Appl. Geophys. 2020, 177, 4913–4923. [Google Scholar] [CrossRef]
- Mohanty, A.K.; Das, S.K.; Van, K.V.; Sengupta, D.; Saha, S.K. Radiogenic heavy minerals in Chhatrapur beach placer deposit of Orissa, southeastern coast of India. J. Radiaoanal. Nucl. Chem. 2003, 258, 383–389. [Google Scholar] [CrossRef]
- Imai, N.; Terashima, S.; Itoh, S.; Ando, A. 1994 compilation of analytical data for minor and trace elements in seventeen GSJ geochemical reference sample “igneous rock series”. Geostand. Newslett. 1995, 19, 135–213. [Google Scholar] [CrossRef]
- Imai, N.; Terashima, S.; Itoh, S.; Ando, A. 1996 compilation of analytical data on nine GSJ geochemical reference samples “sedimentary rock series”. Geostand. Newslett. 1996, 20, 165–216. [Google Scholar] [CrossRef]
- Kasar, S.; Murugan, R.; Arae, H.; Aono, T.; Sahoo, S.K. A microwave digestion technique for the analysis of rare earth elements, thorium and uranium in geochemical certified reference materials and soils by inductively coupled plasma mass spectrometry. Molecules 2020, 25, 5178. [Google Scholar] [CrossRef] [PubMed]
- World Health Organization (WHO). Permissible Limits of Trace Elements in Soil and Plants; WHO: Geneva, Switzerland, 1996. [Google Scholar]
- Rudnick, R.L.; Gao, S. The composition of the continental crust. In Treatise on Geochemistry; Rudnick, R.L., Ed.; Elsevier Science: New York, NY, USA, 2003; Volume 3, pp. 1–64. [Google Scholar]
- Alfaro, R.M.; Nascimento, C.W.A.; Biondi, C.M.; Silva, Y.J.A.B.; Silva, Y.J.A.B.; Aguiar, A.M.; Montero, A.; Ugarte, O.M.; Estevez, J. Rare-earth-element geochemistry in soils developed in different geological settings of Cuba. Catena 2018, 162, 317–324. [Google Scholar] [CrossRef]
- Nyakairu, G.W.A.; Koeberl, C. Mineralogical and chemical composition and distribution of rare earth elements in clay-rich sediments from central Uganda. Geochem. J. 2001, 35, 13–28. [Google Scholar] [CrossRef] [Green Version]
- Masuda, A.; Nakamura, N.; Tanaka, T. Fine structures of mutually normalized rare-earth patterns of chondrites. Geochim. Cosmochim. Acta 1973, 37, 239–248. [Google Scholar] [CrossRef]
- Armstrong-Altrin, J.S.; Machain-Castillo, M.L.; Rosales-Hoz, L.; Carranza-Edwards, A.; Sanchez-Cabeza, J.A.; Ruíz-Fernández, A.C. Provenance and depositional history of continental slope sediments in the Southwestern Gulf of Mexico unravelled by geochemical analysis. Cont. Shelf Res. 2015, 95, 15–26. [Google Scholar] [CrossRef]
- Papadopoulos, A. Geochemistry and REE content of beach sands along the Atticocycladic coastal zone, Greece. Geosci. J. 2018, 22, 955–973. [Google Scholar] [CrossRef]
- Rollinson, H.R. Using Geochemical Data: Evaluation, Presentation, Interpretation; Longman Scientific & Technical: Harlow, UK, 1993; pp. 133–140. [Google Scholar]
- Narayana, B.L.; Rao, P.R.; Reddy, G.L.N.; Rao, V.D. Geochemistry and origin of megacrystic granitoid rocks from eastern ghats granulite belt. Gondwana Res. 1999, 2, 105–115. [Google Scholar] [CrossRef]
- Bhadra, S.; Das, S.; Bhattacharya, A. Shear zone-hosted migmatites (Eastern India): The role of dynamic melting in the generation of REE-depleted felsic melts, and implications for disequilibrium melting. J. Petrol. 2007, 48, 435–457. [Google Scholar] [CrossRef] [Green Version]
- Bhattacharya, S.; Chaudhary, A.K.; Basei, M. Original nature and source of khondalites in the Eastern Ghats Province, India. In Geological Society; Special Publications: London, UK, 2012; Volume 365, pp. 147–159. [Google Scholar]
- Peter, T.S.; Chandrasekar, N.; Wilson, J.J.S.; Selvakumar, S.; Krishnakumar, S.; Magesh, N.S. A baseline record of trace elements concentration along the beach placer mining areas of Kanyakumari coast, South India. Mar. Pollut. Bull. 2017, 119, 416–422. [Google Scholar] [CrossRef] [PubMed]
- Mohanty, A.K.; Das, S.K.; Vijayan, V.; Sengupta, D.; Saha, S.K. Geochemical studies of monazite sands of Chhatrapur beach placer deposit of Orissa, India by PIXE and EDXRF method. Nucl. Instrum. Methods Phys. Res. B 2003, 211, 145–154. [Google Scholar] [CrossRef]
- Hołtra, A.; Zamorska-Wojdyła, D. The pollution indices of trace elements in soils and plants close to the copper and zinc smelting works in Poland’s Lower Silesia. Environ. Sci. Pollut. Res. 2020, 27, 16086–16099. [Google Scholar] [CrossRef] [Green Version]
- Reimann, C.; Caritat, P. Intrinsic flows of element enrichment factors (EFs) in environmental geochemistry. Environ. Sci. Technol. 2000, 34, 5084–5091. [Google Scholar] [CrossRef]
- Zahra, A.; Hashmi, M.Z.; Malik, R.N.; Ahmed, Z. Enrichment and geo-accumulation of trace elements and risk assessment of sediments of the Kurang Nallah-feeding tributary of the Rawal Lake reservoir, Pakistan. Sci. Total Environ. 2014, 470, 925–933. [Google Scholar] [CrossRef] [PubMed]
- Muller, G. Index of geo-accumulation in sediments of the Rhine River. Geojournal 1969, 2, 108–118. [Google Scholar]

| Elements | JLk-1 | JB-1 | JB-3 | |||||||||
|---|---|---|---|---|---|---|---|---|---|---|---|---|
| Mean (µg g−1) | SD | CV (µg g−1) | Recovery (%) | Mean (µg g−1) | SD | CV (µg g−1) | Recovery (%) | Mean (µg g−1) | SD | CV (µg g−1) | Recovery (%) | |
| Cr | 71.4 | 0.3 | 69 | 103 | 433.3 | 1.3 | 425 | 102 | 55.3 | 0.2 | 58.1 | 95 |
| Mn | 2358 | 7 | 2092 | 103 | 1217 | 4 | 1200 | 101 | 1453 | 3 | 1400 | 104 |
| Fe | 47,538 | 94 | 46,738 | 102 | 63,605 | 362 | 62,900 | 101 | 82,355 | 70 | 82,700 | 100 |
| Co | 18.5 | 0.1 | 18 | 103 | 37.9 | 0.2 | 38.2 | 99 | 34.9 | 0.2 | 34.3 | 102 |
| Ni | 38.0 | 0.2 | 35 | 109 | 133.4 | 1.2 | 133 | 100 | 36.0 | 0.4 | 36.2 | 99 |
| Cu | 69.1 | 0.3 | 62.9 | 110 | 51.3 | 0.3 | 55.1 | 93 | 183.9 | 0.7 | 194 | 95 |
| Zn | 166.2 | 0.3 | 152 | 109 | 83.7 | 4.6 | 85.2 | 98 | 108.0 | 2.2 | 100 | 108 |
| Rb | 160.6 | 0.6 | 147 | 109 | 40.6 | 0.8 | 41.3 | 98 | 15.6 | 0.2 | 15.1 | 103 |
| Sr | 68.8 | 1.6 | 67.5 | 102 | 431.9 | 0.1 | 444 | 97 | 424.7 | 5.3 | 403 | 105 |
| Y | 43.1 | 0.2 | 40 | 108 | 23.5 | 0.7 | 24.3 | 97 | 25.9 | 0.2 | 26.9 | 96 |
| Zr | 125.1 | 0.7 | 137 | 91 | 135.8 | 1.0 | 141 | 96 | 94.1 | 1.0 | 97.8 | 96 |
| Cd | 0.61 | 0.06 | 0.57 | 107 | 0.12 | 0.01 | 0.11 | 109 | 0.082 | 0.008 | 0.081 | 101 |
| Cs | 10.7 | 0.2 | 10.9 | 98 | 1.3 | 0.1 | 1.2 | 108 | 0.92 | 0.09 | 0.94 | 98 |
| Ba | 595.7 | 4.7 | 574 | 104 | 518.2 | 0.5 | 493 | 105 | 254.5 | 3.0 | 245 | 104 |
| Pb | 46.7 | 0.4 | 43.7 | 107 | 10.0 | 0.2 | 10 | 100 | 5.6 | 0.2 | 5.6 | 100 |
| La | 44.0 | 0.2 | 40.6 | 108 | 37.7 | 0.2 | 38.6 | 98 | 8.3 | 0.1 | 8.8 | 94 |
| Ce | 89.8 | 0.6 | 87.9 | 102 | 65.5 | 0.6 | 67.8 | 97 | 21.0 | 0.3 | 21.5 | 98 |
| Pr | 9.3 | 0.2 | 8.5 | 109 | 6.9 | 0.3 | 7 | 99 | 3.1 | 0.3 | 3.1 | 100 |
| Nd | 35.0 | 0.3 | 35.7 | 98 | 25.9 | 0.4 | 26.8 | 97 | 15.1 | 0.2 | 15.6 | 97 |
| Sm | 8.1 | 0.2 | 7.9 | 103 | 5.0 | 0.2 | 5.1 | 98 | 4.3 | 0.1 | 4.3 | 100 |
| Eu | 1.3 | 0.1 | 1.3 | 100 | 1.6 | 0.1 | 1.5 | 107 | 1.3 | 0.1 | 1.3 | 100 |
| Gd | 6.3 | 0.3 | 6 | 105 | 4.5 | 0.4 | 4.9 | 90 | 4.7 | 0.3 | 4.7 | 100 |
| Tb | 1.2 | 0.1 | 1.2 | 100 | 0.80 | 0.02 | 0.82 | 98 | 0.80 | 0.03 | 0.73 | 110 |
| Dy | 6.2 | 0.2 | 6.6 | 94 | 4.0 | 0.2 | 4.1 | 98 | 4.6 | 0.1 | 4.5 | 102 |
| Ho | 1.1 | 0.1 | 1.1 | 100 | 0.80 | 0.04 | 0.79 | 101 | 0.80 | 0.07 | 0.80 | 100 |
| Er | 3.8 | 0.2 | 3.6 | 106 | 2.3 | 0.1 | 2.3 | 100 | 2.6 | 0.2 | 2.5 | 104 |
| Tm | 0.57 | 0.01 | 0.53 | 108 | 0.38 | 0.02 | 0.35 | 109 | 0.46 | 0.02 | 0.42 | 110 |
| Yb | 3.9 | 0.2 | 4 | 98 | 2.1 | 0.1 | 2.1 | 100 | 2.5 | 0.2 | 2.6 | 96 |
| Lu | 0.55 | 0.02 | 0.57 | 96 | 0.31 | 0.02 | 0.31 | 100 | 0.41 | 0.01 | 0.39 | 105 |
| Th | 19.4 | 0.4 | 19.5 | 99 | 9.3 | 0.3 | 9.3 | 100 | 1.3 | 0.1 | 1.3 | 100 |
| U | 3.7 | 0.1 | 3.8 | 97 | 1.7 | 0.1 | 1.7 | 100 | 0.50 | 0.01 | 0.48 | 104 |
| Elements | Aryapalli | Boxipalli | Kanamana | Gopalpur | Chhatrapur | Matikhalo | Kalipalli | Venkatraipur | Badaputti | Basanaputi | Jagnyasala | Kalyaballi |
|---|---|---|---|---|---|---|---|---|---|---|---|---|
| Cr | 180.0 ± 20 | 48.6 ± 4.5 | 68.4 ± 6.5 | 125.0 ± 12 | 103.0 ± 11 | 130.0 ± 15 | 35.6 ± 3.4 | 87.1 ± 7.9 | 61.8 ± 6.3 | 51.4 ± 5.1 | 43.1 ± 3.8 | 55.3 ± 5.3 |
| Mn | 3700 ± 43 | 1600 ± 18 | 1500 ± 16 | 1600 ± 18 | 780 ± 9 | 1300 ± 14 | 940 ± 10 | 1060 ± 11 | 830 ± 9 | 700 ± 8 | 690 ± 7 | 460 ± 5 |
| Fe | 1.5 × 10⁵ ± 1533 | 58,000 ± 777 | 85,000 ± 870 | 77,700 ± 787 | 43,000 ± 428 | 70,000 ± 661 | 34,000 ± 348 | 46,000 ± 458 | 36,000 ± 359 | 28,000 ± 261 | 37,000 ± 362 | 19,000 ± 189 |
| Co | 75.0 ± 7.3 | 22.5 ± 2.9 | 44.9 ± 4.6 | 39.2 ± 4.2 | 17.4 ± 1.7 | 37.6 ± 3.2 | 15.3 ± 1.4 | 17.8 ± 1.6 | 17.4 ± 1.6 | 14.3 ± 1.3 | 16.8 ± 1.7 | 10.4 ± 1.0 |
| Ni | 17.3 ± 1.6 | 1.1 ± 0.1 | 19.5 ± 1.9 | 14.7 ± 1.5 | 23.2 ± 2.3 | 16.6 ± 1.5 | 1.2 ± 0.1 | 1.1 ± 0.1 | 3.1 ± 0.3 | 4.4 ± 0.3 | 24.5 ± 2.2 | 15.7 ± 1.3 |
| Cu | 15.7 ± 1.4 | 2.1 ± 0.2 | 17.5 ± 1.6 | 18.3 ± 1.7 | 20.5 ± 1.9 | 16.6 ± 1.5 | 1.3 ± 0.1 | 1.8 ± 0.2 | 2.0 ± 0.2 | 3.4 ± 0.3 | 18.5 ± 1.4 | 11.9 ± 0.9 |
| Zn | 250.0 ± 25 | 93 ± 9.0 | 135.0 ± 12 | 135.0 ± 13 | 91.0 ± 9.0 | 125.0 ± 12 | 27.0 ± 3.0 | 165.0 ± 16 | 55.0 ± 4.0 | 39 ± 4.0 | 80 ± 8.0 | 43.0 ± 4.0 |
| Rb | 21.9 ± 0.8 | 36.6 ± 1.2 | 31.5 ± 1.1 | 54.6 ± 1.6 | 60.9 ± 1.7 | 31.3 ± 1.1 | 37.6 ± 1.3 | 20.4 ± 0.7 | 52.3 ± 1.5 | 47.5 ± 1.4 | 61.9 ± 1.8 | 26.6 ± 0.9 |
| Sr | 23.9 ± 1.5 | 36.6 ± 2.1 | 22.5 ± 1.4 | 44.6 ± 2.7 | 28.0 ± 1.4 | 20.5 ± 1.1 | 23.5 ± 2.0 | 20.0 ± 1.8 | 34.7 ± 1.6 | 36.3 ± 1.8 | 22.6 ± 1.3 | 14.5 ± 0.9 |
| Y | 180.0 ± 15 | 101.0 ± 9.0 | 44.8 ± 4.1 | 61.6 ± 6.4 | 25.7 ± 2.3 | 39.4 ± 3.2 | 31.2 ± 2.9 | 32.1 ± 2.6 | 28.4 ± 2.4 | 26.1 ± 2.3 | 40.8 ± 3.5 | 11.1 ± 0.9 |
| Zr | 370.0 ± 28 | 4.3 ± 0.1 | 160.0 ± 14 | 143.0 ± 13 | 125.0 ± 11 | 150.0 ± 15 | 2.4 ± 0.2 | 2.2 ± 0.2 | 57.8 ± 4.5 | 39.9 ± 3.3 | 110.0 ± 10 | 55.2 ± 4.4 |
| Cd | 0.11 ± 0.02 | 0.05 ± 0.01 | 0.12 ± 0.02 | 0.14 ± 0.02 | 0.05 ± 0.01 | 0.11 ± 0.02 | 0.05 ± 0.01 | 0.05 ± 0.01 | 0.05 ± 0.01 | 0.05 ± 0.01 | 0.05 ± 0.01 | 0.05 ± 0.01 |
| Cs | 0.8 ± 0.1 | 6.0 ± 0.5 | 1.1 ± 0.2 | 0.8 ± 0.1 | 3.6 ± 0.3 | 1.0 ± 0.1 | 11.1 ± 0.6 | 5.5 ± 0.4 | 1.1 ± 0.2 | 0.6 ± 0.1 | 1.1 ± 0.2 | 0.8 ± 0.1 |
| Ba | 13.5 ± 1.1 | 185.0 ± 15 | 50.0 ± 3.0 | 107.0 ± 6.0 | 285.0 ± 7.0 | 52.3 ± 4.1 | 181.0 ± 17.0 | 130.0 ± 7.0 | 117.0 ± 6.0 | 92.0 ± 7.0 | 385.0 ± 19 | 110.0 ± 7.0 |
| Pb | 65.0 ± 8.0 | 62.0 ± 6.0 | 49.0 ± 5.0 | 54.0 ± 5.0 | 47.4 ± 4.3 | 43.0 ± 4.2 | 23.5 ± 1.9 | 28.5 ± 1.9 | 23.2 ± 2.1 | 16.2 ± 1.3 | 46.2 ± 3.6 | 19.8 ± 1.7 |
| Th | 930 ± 87 | 830 ± 75 | 500 ± 49 | 560 ± 62 | 200 ± 23 | 560 ± 63 | 300 ± 31 | 370 ± 41 | 200 ± 25 | 100 ± 15 | 37 ± 7.0 | 35 ± 6.0 |
| U | 53.2 ± 4.8 | 36.3 ± 3.1 | 15.3 ± 1.8 | 15.4 ± 1.9 | 6.7 ± 0.4 | 11.8 ± 1.7 | 12.7 ± 1.3 | 12.4 ± 1.1 | 5.6 ± 0.3 | 2.4 ± 0.2 | 1.7 ± 0.1 | 1.4 ± 0.1 |
| Elements | Kanamana | Basanaputi | Badaputti | Matikhalo | Gopalpur | Aryapalli | Kalyaballi | Jagnyasala | Chhatrapur | Kalipalli | Boxipalli | Venkatraipur |
|---|---|---|---|---|---|---|---|---|---|---|---|---|
| Cr | 1.8 | 1.2 | 1.8 | 2.9 | 2.8 | 7.7 | 1.1 | 1.1 | 4.2 | 0.6 | 1.1 | 1.5 |
| Mn | 2.4 | 1.1 | 1.5 | 1.8 | 2.2 | 10.0 | 0.6 | 1.1 | 2.0 | 1.0 | 2.2 | 1.2 |
| Fe | 2.5 | 0.8 | 1.2 | 1.8 | 2.0 | 8.7 | 0.5 | 1.0 | 2.0 | 0.7 | 1.5 | 0.9 |
| Co | 3.0 | 0.9 | 1.3 | 2.1 | 2.2 | 9.3 | 0.5 | 1.0 | 1.8 | 0.7 | 1.3 | 0.8 |
| Ni | 0.9 | 0.2 | 0.2 | 0.7 | 0.6 | 1.6 | 0.6 | 1.0 | 1.8 | −0.4 | −1.2 | −0.3 |
| Cu | 1.0 | 0.2 | −0.4 | 0.9 | 1.0 | 1.8 | 0.6 | 1.0 | 2.0 | −2.3 | −5.5 | −2.0 |
| Zn | 1.9 | 0.5 | 0.9 | 1.5 | 1.6 | 6.3 | 0.5 | 1.0 | 2.0 | 0.3 | 1.1 | 1.6 |
| Rb | 0.6 | 0.8 | 1.0 | 0.5 | 0.9 | 0.9 | 0.4 | 1.0 | 1.6 | 0.5 | 0.6 | 0.2 |
| Sr | 1.1 | 1.7 | 1.9 | 0.9 | 2.0 | 2.2 | 0.6 | 1.0 | 2.0 | 0.8 | 1.6 | 0.7 |
| Y | 1.2 | 0.6 | 0.9 | 0.9 | 1.4 | 7.6 | 0.2 | 1.0 | 1.1 | 0.6 | 2.4 | 0.6 |
| Zr | 1.7 | 0.4 | 0.7 | 1.2 | 1.3 | 6.5 | 0.4 | 1.0 | 1.9 | 0.0 | 0.0 | 0.0 |
| Cd | 1.7 | 0.1 | 0.8 | 1.2 | 3.5 | 5.1 | 0.4 | 1.0 | 1.6 | 0.0 | 0.0 | 0.0 |
| Cs | 1.0 | 0.5 | 1.1 | 0.8 | 0.7 | 1.9 | 0.5 | 1.1 | 4.6 | 7.4 | 5.1 | 3.7 |
| Ba | 0.1 | 0.2 | 0.4 | 0.1 | 0.3 | 0.0 | 0.2 | 1.0 | 1.2 | 0.4 | 0.5 | 0.3 |
| Pb | 1.2 | 0.4 | 0.6 | 0.9 | 1.1 | 1.0 | 0.4 | 1.1 | 1.8 | 0.4 | 1.3 | 0.5 |
| Th | 15.5 | 2.7 | 6.9 | 13.5 | 14.0 | 52.4 | 0.8 | 1.0 | 10.7 | 6.8 | 21.7 | 7.5 |
| U | 10.0 | 1.4 | 4.0 | 6.1 | 8.4 | 51.3 | 0.7 | 1.1 | 6.7 | 5.5 | 20.4 | 5.4 |
| Elements | Kanamana | Basanaputi | Badaputti | Matikhalo | Gopalpur | Aryapalli | Kalyaballi | Jagnyasala | Chhatrapur | Kalipalli | Boxipalli | Venkatraipur |
|---|---|---|---|---|---|---|---|---|---|---|---|---|
| Cr | −1.0 | −1.5 | −1.4 | −0.1 | −0.4 | 0.3 | −1.2 | −1.9 | −0.3 | −2.0 | −1.5 | −0.7 |
| Mn | 0.3 | −0.9 | −0.6 | 0.2 | 0.1 | 1.8 | −1.3 | −0.5 | −0.5 | −0.3 | 0.4 | −0.1 |
| Fe | −0.5 | −2.3 | −1.9 | −0.8 | −1.1 | 0.4 | −2.5 | −1.9 | −1.4 | −1.8 | −1.0 | −1.4 |
| Co | 0.8 | −1.0 | −0.6 | 0.5 | 0.2 | 1.6 | −1.2 | −0.5 | −0.5 | −0.8 | −0.2 | −0.5 |
| Ni | −1.9 | −4.1 | −3.1 | −2.1 | −2.4 | −2.0 | −2.2 | −1.9 | −1.7 | 0.0 | 0.0 | 0.0 |
| Cu | −1.3 | −3.8 | −2.9 | −1.4 | −1.4 | −1.4 | −1.8 | −1.4 | −1.1 | 0.0 | 0.0 | 0.0 |
| Zn | 0.4 | −1.6 | −0.9 | 0.3 | 0.1 | 1.4 | −1.1 | −0.3 | −0.1 | −1.9 | −0.1 | 0.7 |
| Rb | −2.1 | −1.4 | −1.2 | −2.0 | −1.1 | −3.6 | −2.2 | −0.7 | −1.4 | −1.7 | −1.8 | −2.6 |
| Sr | −4.6 | −3.8 | −3.6 | −4.5 | −3.3 | −4.4 | −5.1 | −4.2 | −4.3 | −4.4 | −3.7 | −4.6 |
| Y | 0.5 | −0.5 | −0.3 | 0.3 | 0.4 | 2.5 | −1.5 | 0.6 | −0.2 | 0.0 | 1.7 | 0.0 |
| Zr | −0.9 | −3.1 | −2.3 | −1.0 | −1.5 | 0.5 | −2.5 | −1.3 | −1.1 | −6.9 | −6.1 | −7.0 |
| Cd | −1.2 | 0.0 | 0.0 | −2.1 | −0.9 | 0.4 | −2.4 | −1.6 | −1.8 | 0.0 | 0.0 | 0.0 |
| Cs | −2.9 | −3.7 | −3.1 | −2.9 | −2.7 | −5.1 | −2.5 | −2.6 | −2.1 | −0.1 | 0.6 | −0.4 |
| Ba | −4.3 | −3.4 | −3.2 | −4.2 | −3.1 | 0.0 | −3.2 | −1.0 | −2.0 | −2.4 | −2.3 | −2.8 |
| Pb | 0.9 | −0.7 | −0.2 | 0.7 | 0.6 | 0.0 | −0.3 | 0.9 | 0.9 | −0.1 | 1.3 | 0.2 |
| Th | 5.0 | 2.2 | 2.6 | 5.1 | 4.3 | 5.8 | 1.3 | 1.5 | 4.0 | 4.4 | 5.7 | 4.6 |
| U | 1.9 | −1.1 | −0.7 | 1.4 | 0.7 | 3.6 | −1.4 | −1.2 | 0.9 | 1.6 | 3.2 | 1.6 |
| Element | Mean | Min | Median | Max | Skewness | Kurtosis | CV |
|---|---|---|---|---|---|---|---|
| La | 540.76 | 17.65 | 334.97 | 2770.36 | 1.86 | 3.67 | 1.16 |
| Ce | 1121.56 | 40.62 | 687.72 | 5797.34 | 1.90 | 3.81 | 1.16 |
| Pr | 119.09 | 3.91 | 68.66 | 638.91 | 1.94 | 4.09 | 1.20 |
| Nd | 458.58 | 16.10 | 269.25 | 2557.04 | 2.06 | 4.78 | 1.22 |
| Sm | 66.88 | 2.74 | 41.37 | 389.59 | 2.25 | 6.12 | 1.22 |
| Eu | 1.96 | 0.31 | 1.49 | 7.96 | 2.06 | 4.78 | 0.88 |
| Gd | 39.97 | 1.96 | 24.16 | 228.39 | 2.25 | 6.05 | 1.19 |
| Tb | 4.23 | 0.34 | 2.46 | 26.18 | 2.67 | 8.97 | 1.21 |
| Dy | 13.44 | 1.40 | 7.70 | 89.13 | 3.32 | 13.93 | 1.19 |
| Ho | 2.05 | 0.23 | 1.23 | 11.03 | 2.62 | 8.22 | 1.07 |
| Er | 5.37 | 0.64 | 3.67 | 32.50 | 3.23 | 13.28 | 1.08 |
| Tm | 0.93 | 0.09 | 0.51 | 4.99 | 2.37 | 5.71 | 1.19 |
| Yb | 4.30 | 0.65 | 3.12 | 26.32 | 3.61 | 16.44 | 1.05 |
| Lu | 0.95 | 0.10 | 0.46 | 5.66 | 2.50 | 6.65 | 1.26 |
| ΣREE | 2431.19 | 101.31 | 1469.72 | 12,911.35 | 1.98 | 4.32 | 1.17 |
| ΣLREE | 2308.82 | 85.40 | 1403.06 | 12,160.34 | 1.94 | 4.04 | 1.18 |
| ΣHREE | 71.24 | 6.48 | 44.25 | 421.50 | 2.65 | 8.88 | 1.14 |
| Eu/Eu* | 0.21 | 0.06 | 0.11 | 0.78 | 1.59 | 1.39 | 0.95 |
| Ce/Ce* | 1.46 | 0.98 | 1.04 | 4.51 | 2.51 | 4.66 | 0.75 |
| (La/Sm) N | 5.31 | 2.87 | 4.92 | 10.06 | 2.29 | 4.58 | 0.29 |
| (La/Yb) N | 84.35 | 5.40 | 82.44 | 211.66 | 0.28 | −1.15 | 0.70 |
| (Gd/Yb) N | 7.23 | 1.27 | 7.25 | 18.59 | 0.39 | −0.70 | 0.64 |
| La | Ce | Pr | Nd | Sm | Eu | Gd | Tb | Dy | Ho | Er | Tm | Yb | Lu | Th | U | |
|---|---|---|---|---|---|---|---|---|---|---|---|---|---|---|---|---|
| La | 1.00 | |||||||||||||||
| Ce | 1.00 | 1.00 | ||||||||||||||
| Pr | 1.00 | 1.00 | 1.00 | |||||||||||||
| Nd | 1.00 | 1.00 | 1.00 | 1.00 | ||||||||||||
| Sm | 1.00 | 1.00 | 1.00 | 1.00 | 1.00 | |||||||||||
| Eu | 0.79 | 0.80 | 0.79 | 0.77 | 0.77 | 1.00 | ||||||||||
| Gd | 0.99 | 0.99 | 1.00 | 0.99 | 1.00 | 0.81 | 1.00 | |||||||||
| Tb | 0.98 | 0.98 | 0.99 | 0.99 | 0.99 | 0.79 | 1.00 | 1.00 | ||||||||
| Dy | 0.95 | 0.95 | 0.95 | 0.96 | 0.97 | 0.75 | 0.97 | 0.99 | 1.00 | |||||||
| Ho | 0.88 | 0.89 | 0.89 | 0.87 | 0.88 | 0.95 | 0.91 | 0.91 | 0.89 | 1.00 | ||||||
| Er | 0.91 | 0.91 | 0.91 | 0.91 | 0.93 | 0.86 | 0.94 | 0.96 | 0.97 | 0.97 | 1.00 | |||||
| Tm | 0.67 | 0.68 | 0.68 | 0.64 | 0.65 | 0.96 | 0.70 | 0.68 | 0.64 | 0.92 | 0.80 | 1.00 | ||||
| Yb | 0.85 | 0.85 | 0.86 | 0.86 | 0.88 | 0.77 | 0.89 | 0.92 | 0.96 | 0.91 | 0.98 | 0.70 | 1.00 | |||
| Lu | 0.61 | 0.62 | 0.62 | 0.58 | 0.58 | 0.95 | 0.64 | 0.61 | 0.57 | 0.87 | 0.74 | 0.99 | 0.63 | 1.00 | ||
| Th | 0.90 | 0.90 | 0.90 | 0.89 | 0.87 | 0.64 | 0.86 | 0.83 | 0.75 | 0.68 | 0.69 | 0.50 | 0.60 | 0.46 | 1.00 | |
| U | 0.95 | 0.95 | 0.95 | 0.96 | 0.97 | 0.78 | 0.97 | 0.99 | 0.99 | 0.91 | 0.96 | 0.69 | 0.93 | 0.62 | 0.75 | 1.00 |
Publisher’s Note: MDPI stays neutral with regard to jurisdictional claims in published maps and institutional affiliations. |
© 2021 by the authors. Licensee MDPI, Basel, Switzerland. This article is an open access article distributed under the terms and conditions of the Creative Commons Attribution (CC BY) license (https://creativecommons.org/licenses/by/4.0/).
Share and Cite
Veerasamy, N.; Sahoo, S.K.; Murugan, R.; Kasar, S.; Inoue, K.; Fukushi, M.; Natarajan, T. ICP-MS Measurement of Trace and Rare Earth Elements in Beach Placer-Deposit Soils of Odisha, East Coast of India, to Estimate Natural Enhancement of Elements in the Environment. Molecules 2021, 26, 7510. https://doi.org/10.3390/molecules26247510
Veerasamy N, Sahoo SK, Murugan R, Kasar S, Inoue K, Fukushi M, Natarajan T. ICP-MS Measurement of Trace and Rare Earth Elements in Beach Placer-Deposit Soils of Odisha, East Coast of India, to Estimate Natural Enhancement of Elements in the Environment. Molecules. 2021; 26(24):7510. https://doi.org/10.3390/molecules26247510
Chicago/Turabian StyleVeerasamy, Nimelan, Sarata Kumar Sahoo, Rajamanickam Murugan, Sharayu Kasar, Kazumasa Inoue, Masahiro Fukushi, and Thennaarassan Natarajan. 2021. "ICP-MS Measurement of Trace and Rare Earth Elements in Beach Placer-Deposit Soils of Odisha, East Coast of India, to Estimate Natural Enhancement of Elements in the Environment" Molecules 26, no. 24: 7510. https://doi.org/10.3390/molecules26247510
APA StyleVeerasamy, N., Sahoo, S. K., Murugan, R., Kasar, S., Inoue, K., Fukushi, M., & Natarajan, T. (2021). ICP-MS Measurement of Trace and Rare Earth Elements in Beach Placer-Deposit Soils of Odisha, East Coast of India, to Estimate Natural Enhancement of Elements in the Environment. Molecules, 26(24), 7510. https://doi.org/10.3390/molecules26247510