
Transport of Carbamazepine, Ciprofloxacin and Sulfamethoxazole in Activated Carbon: Solubility and Relationships between Structure and Diffusional Parameters

Abstract
:1. Introduction
2. Results and Discussion
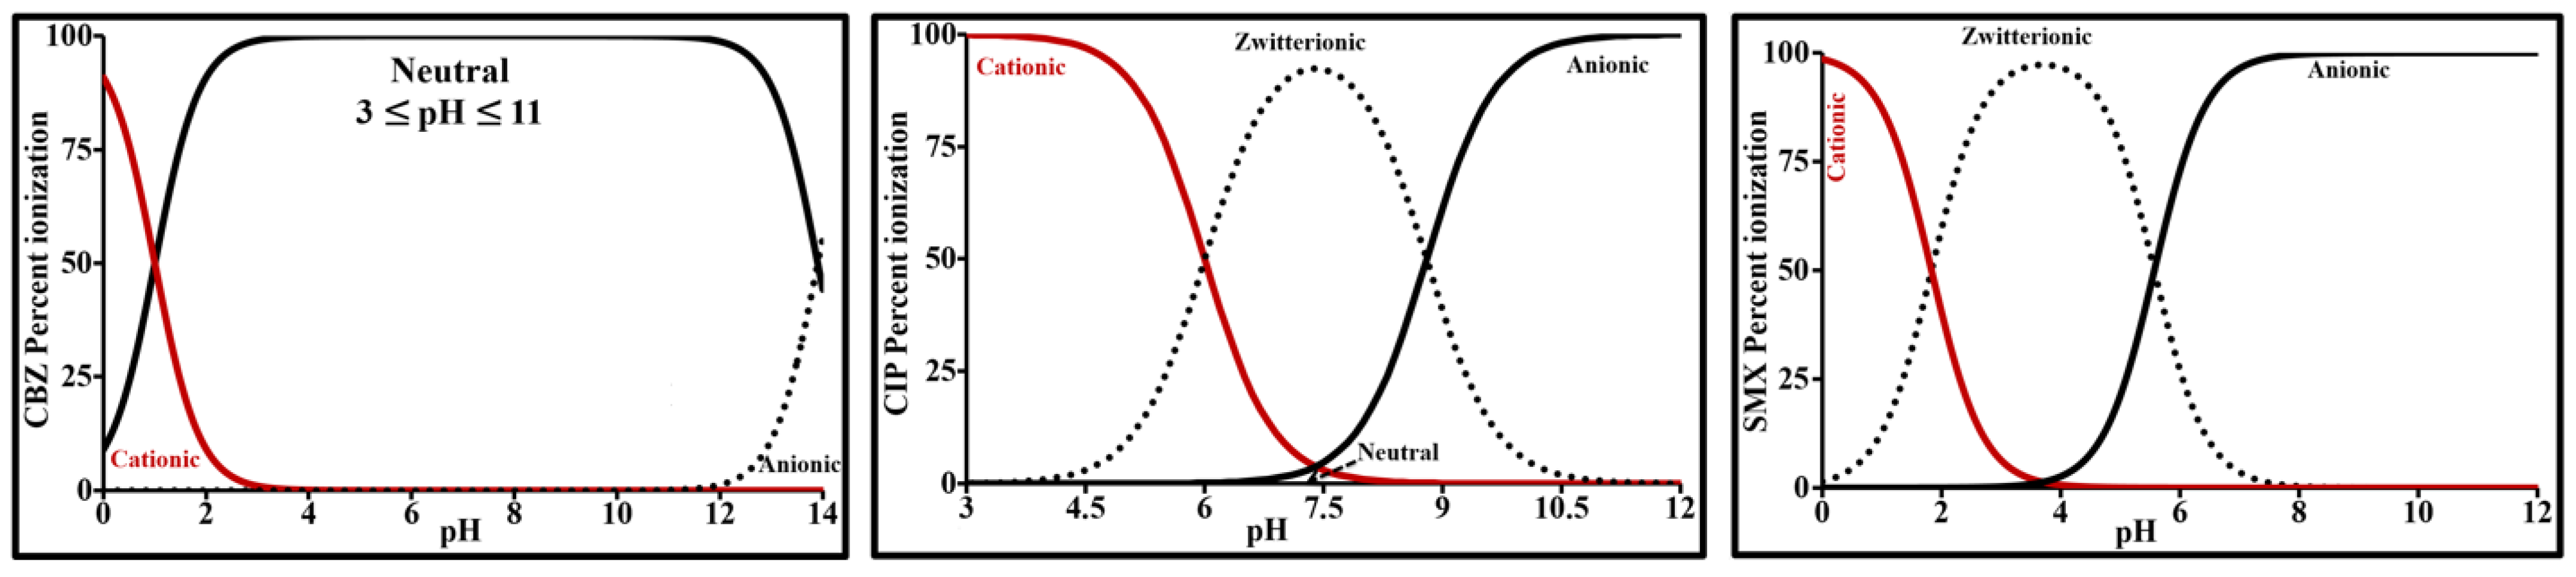
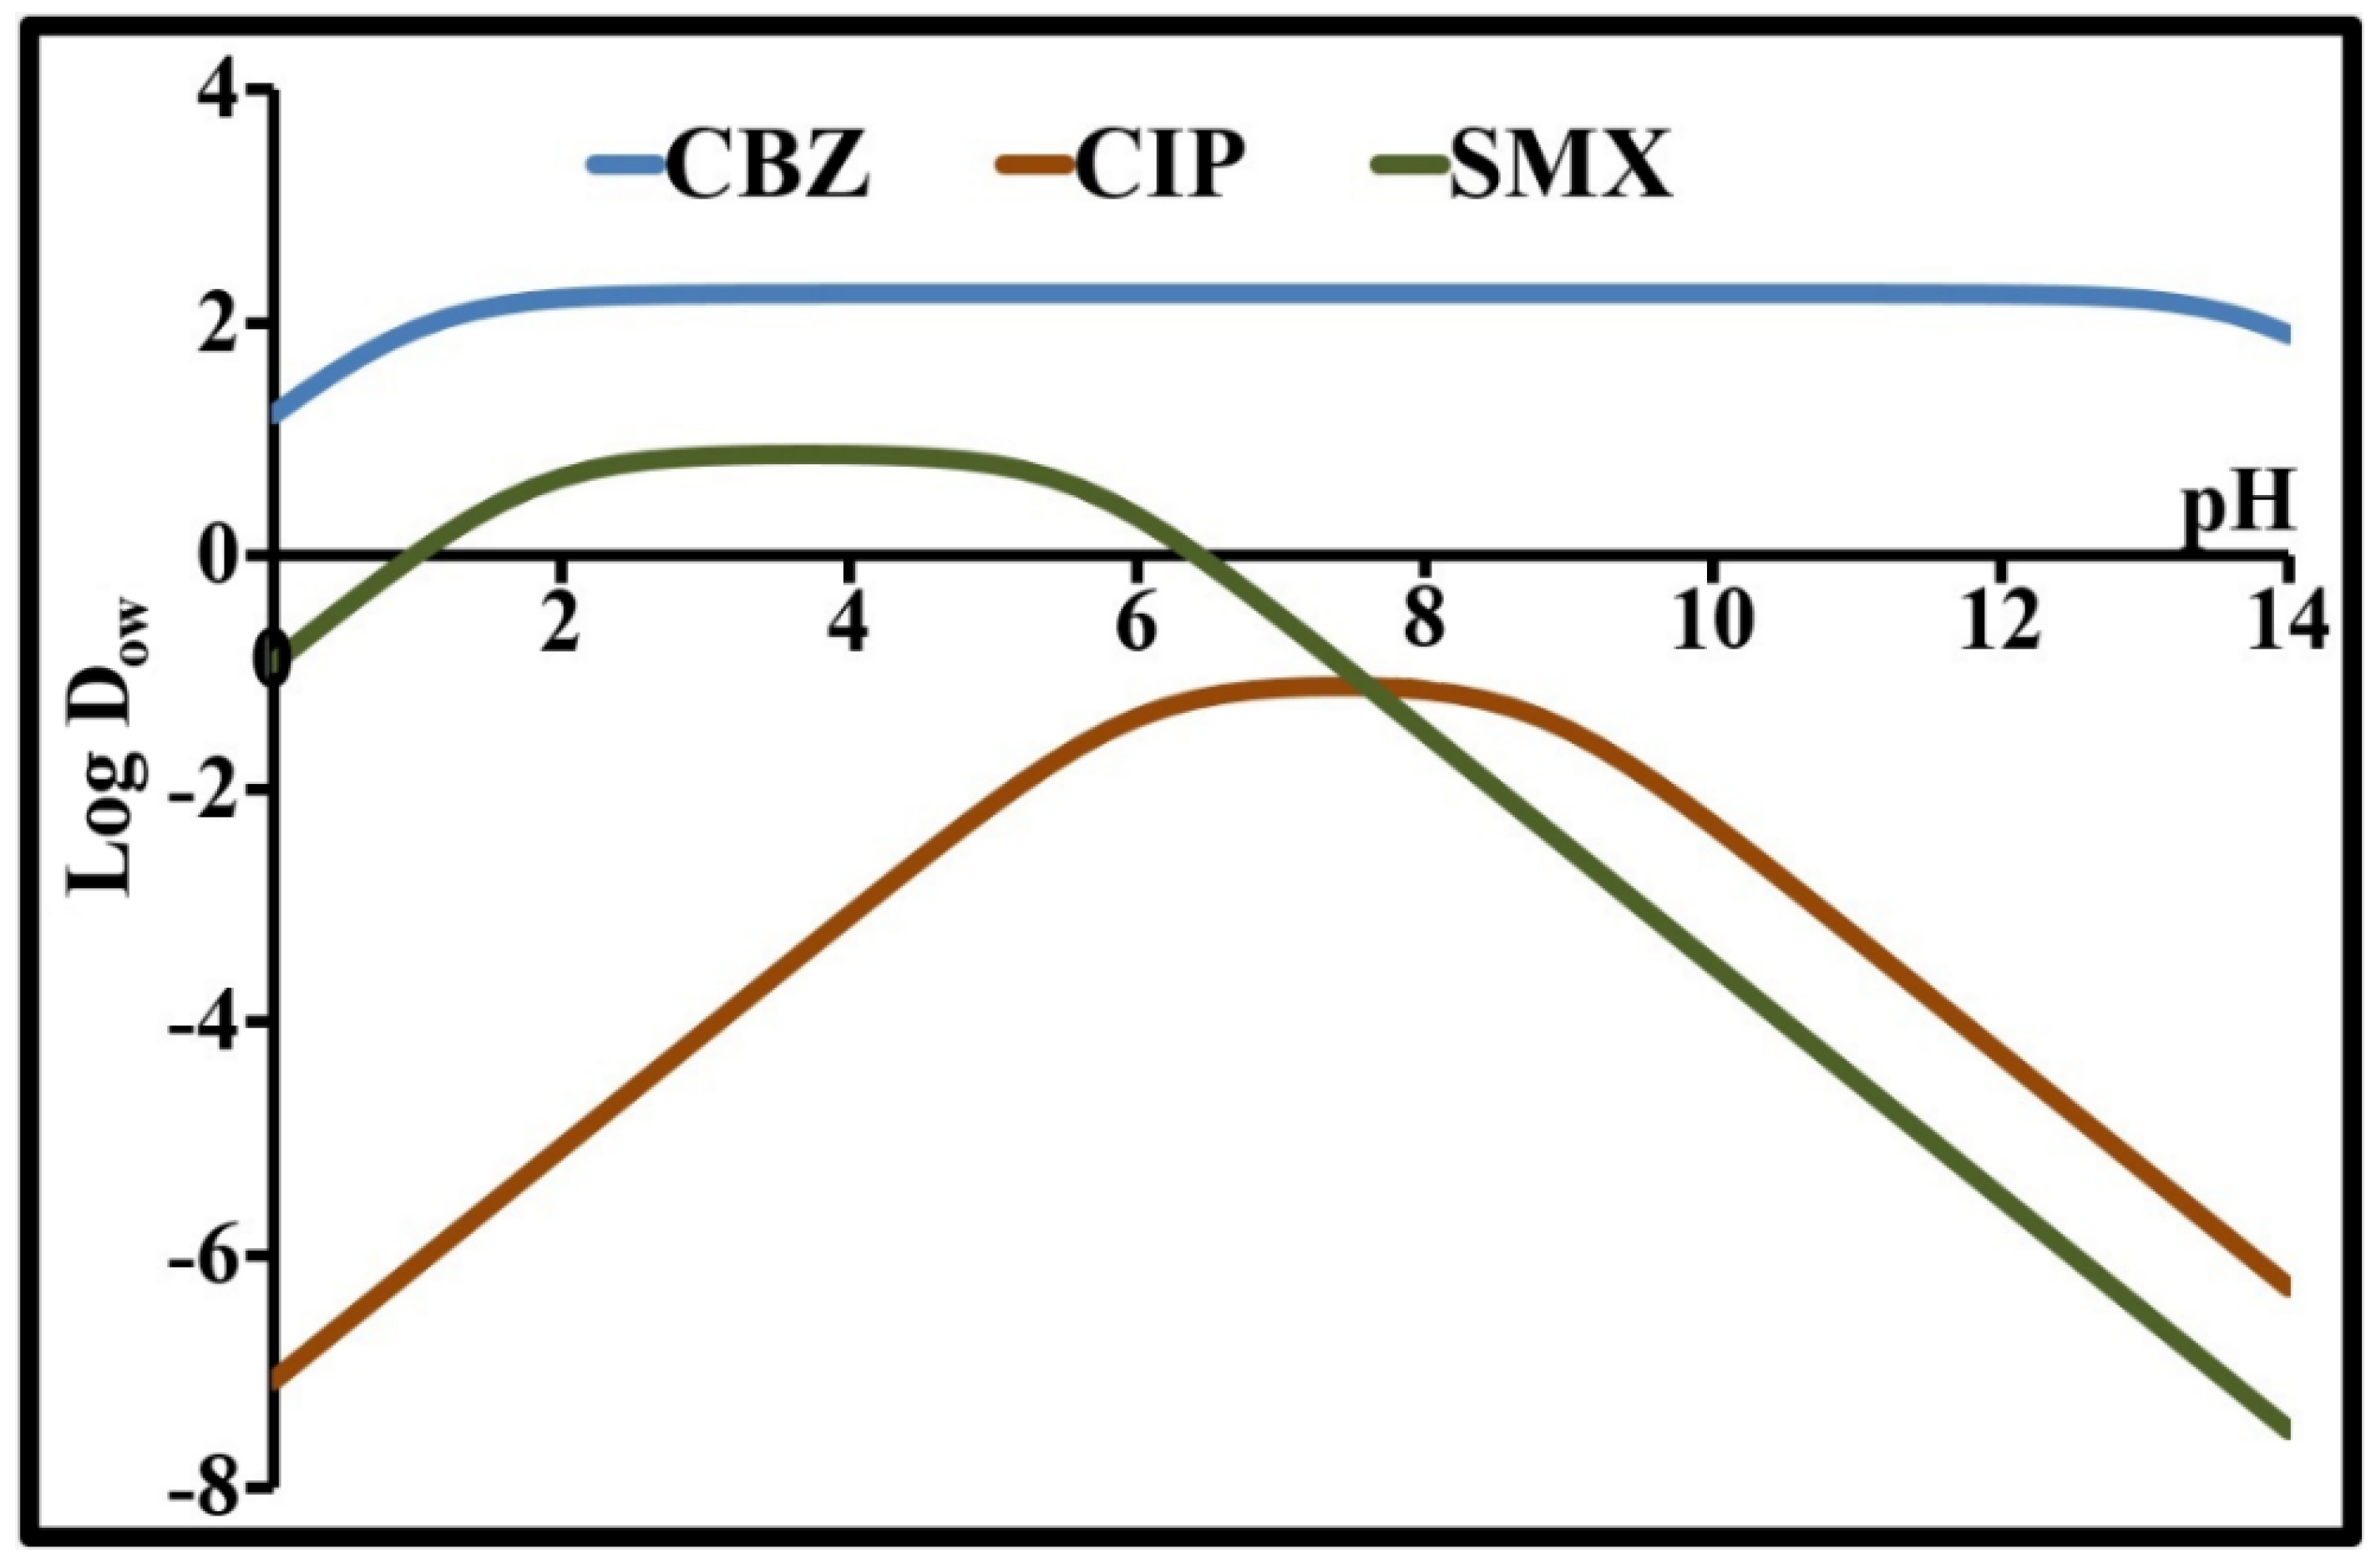
2.1. Characterization of PhACs
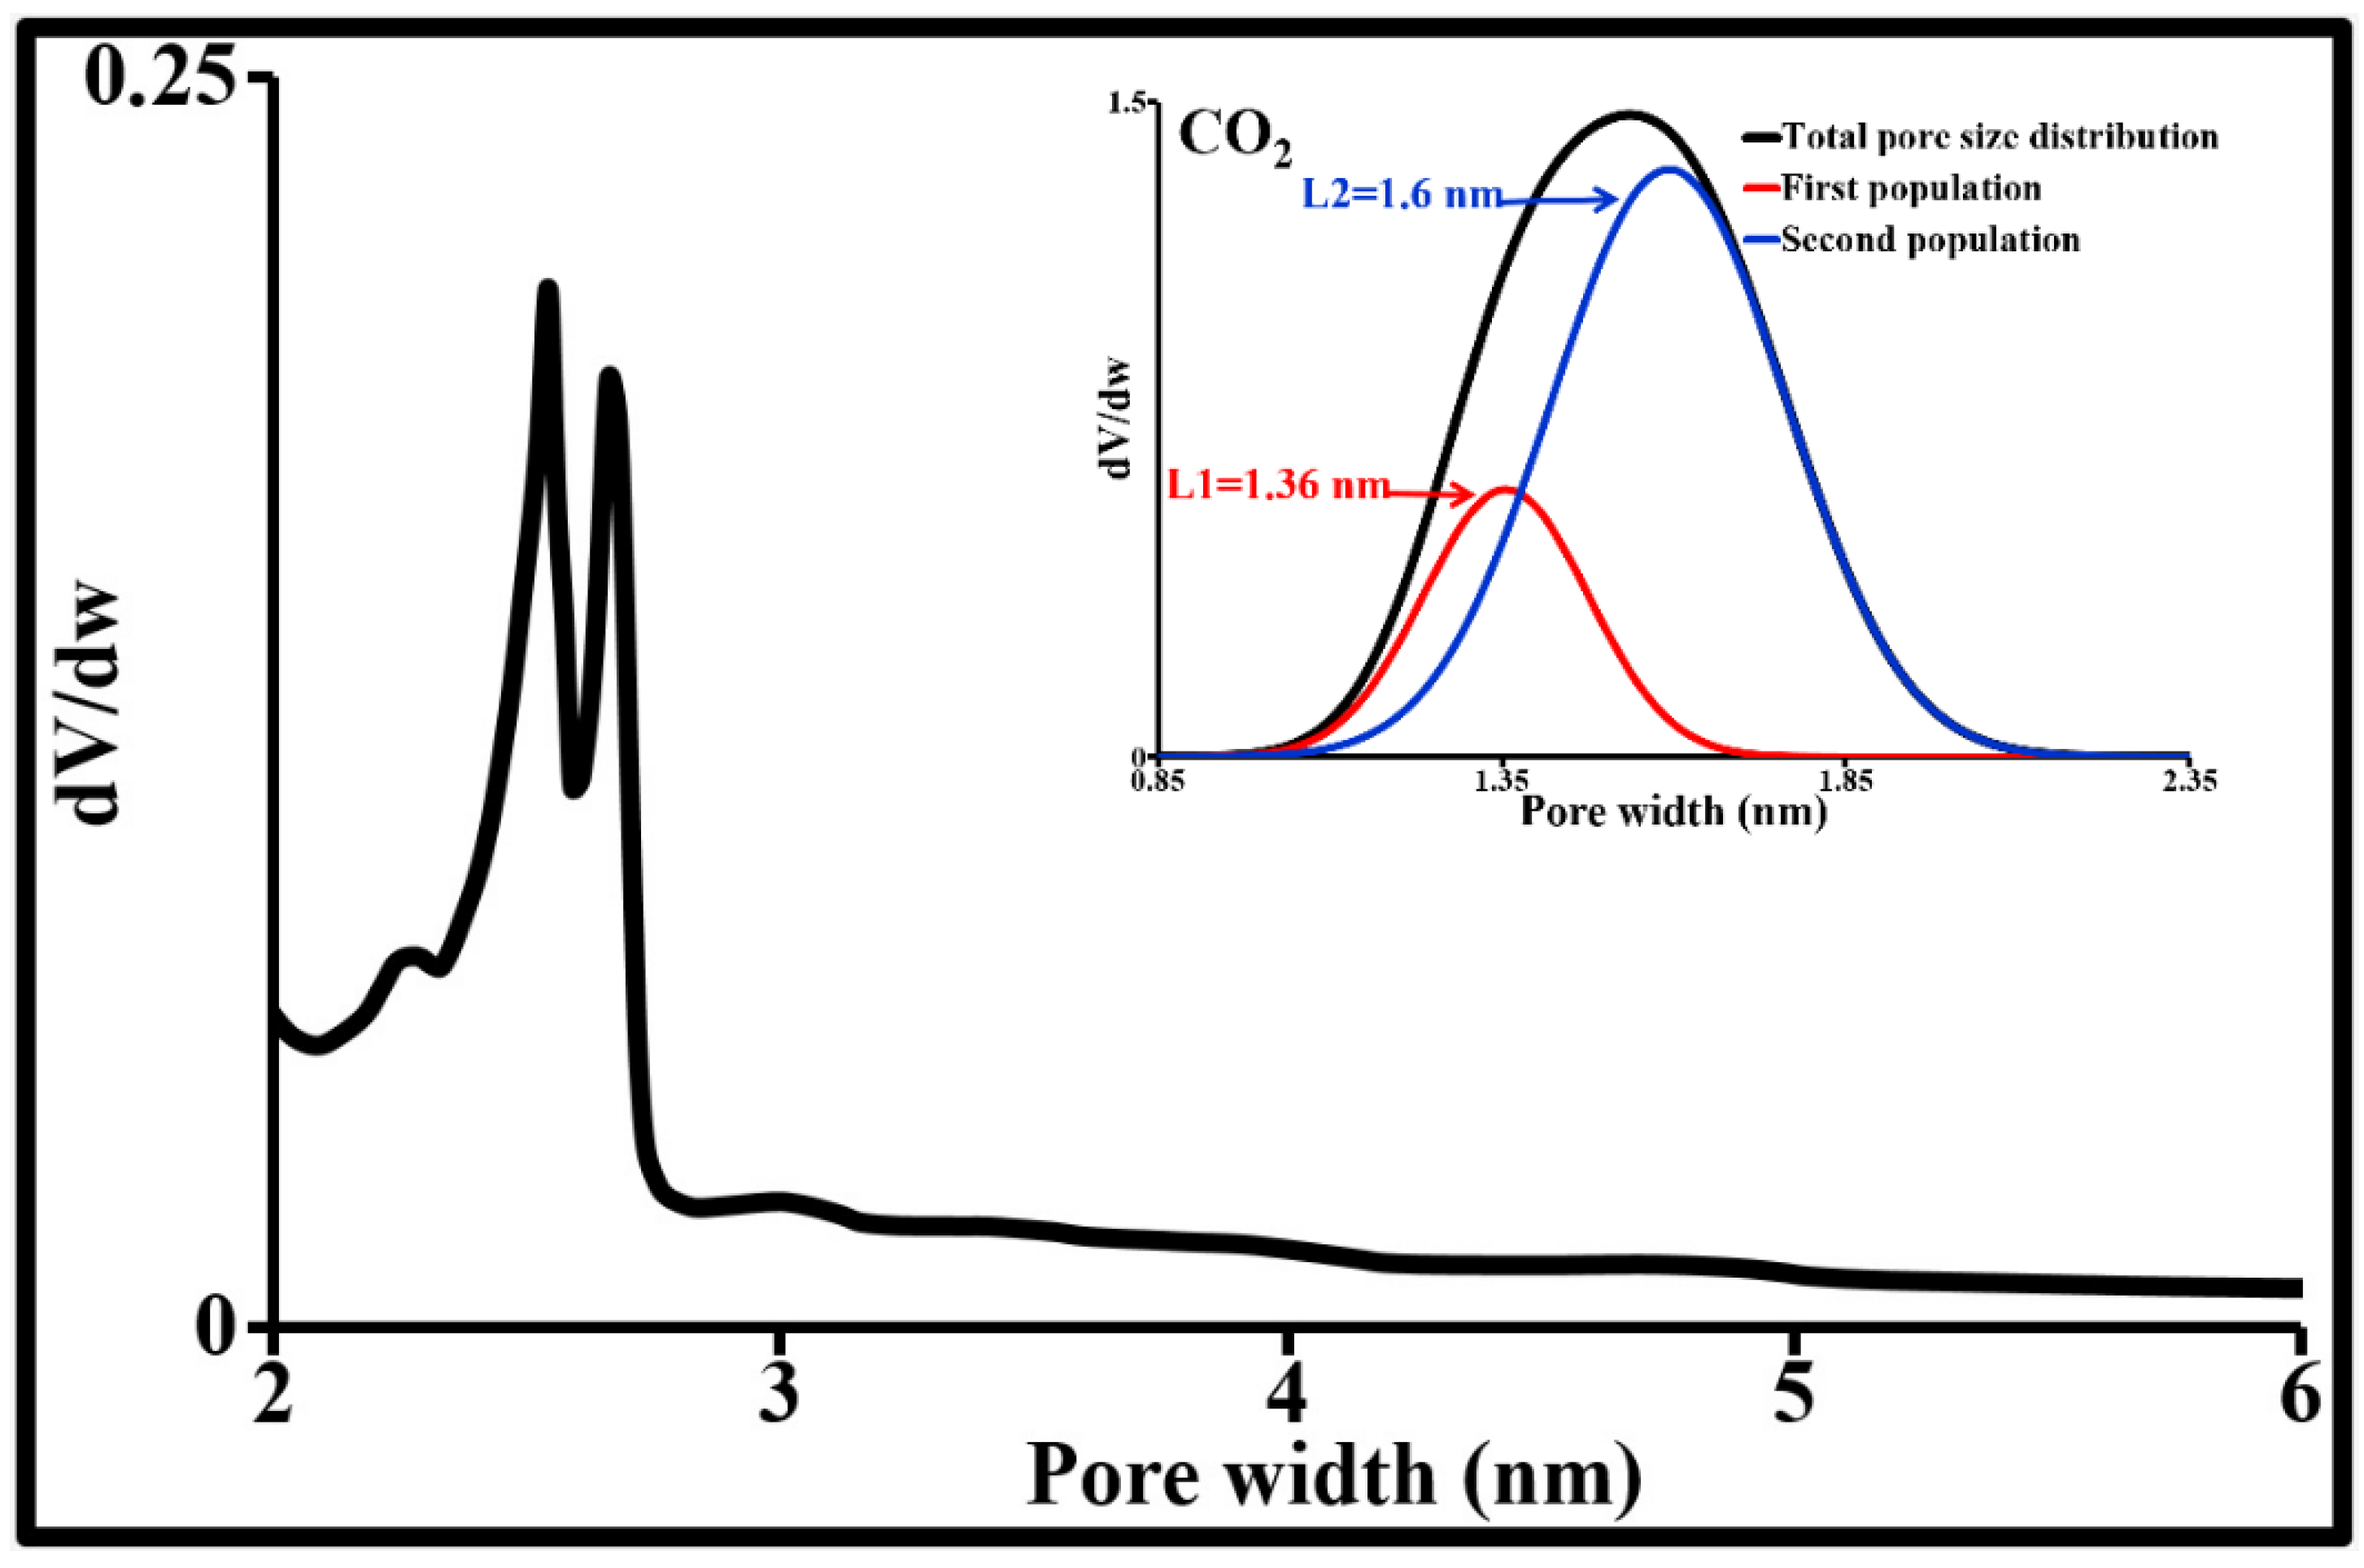
2.2. Activated Carbon Characterization
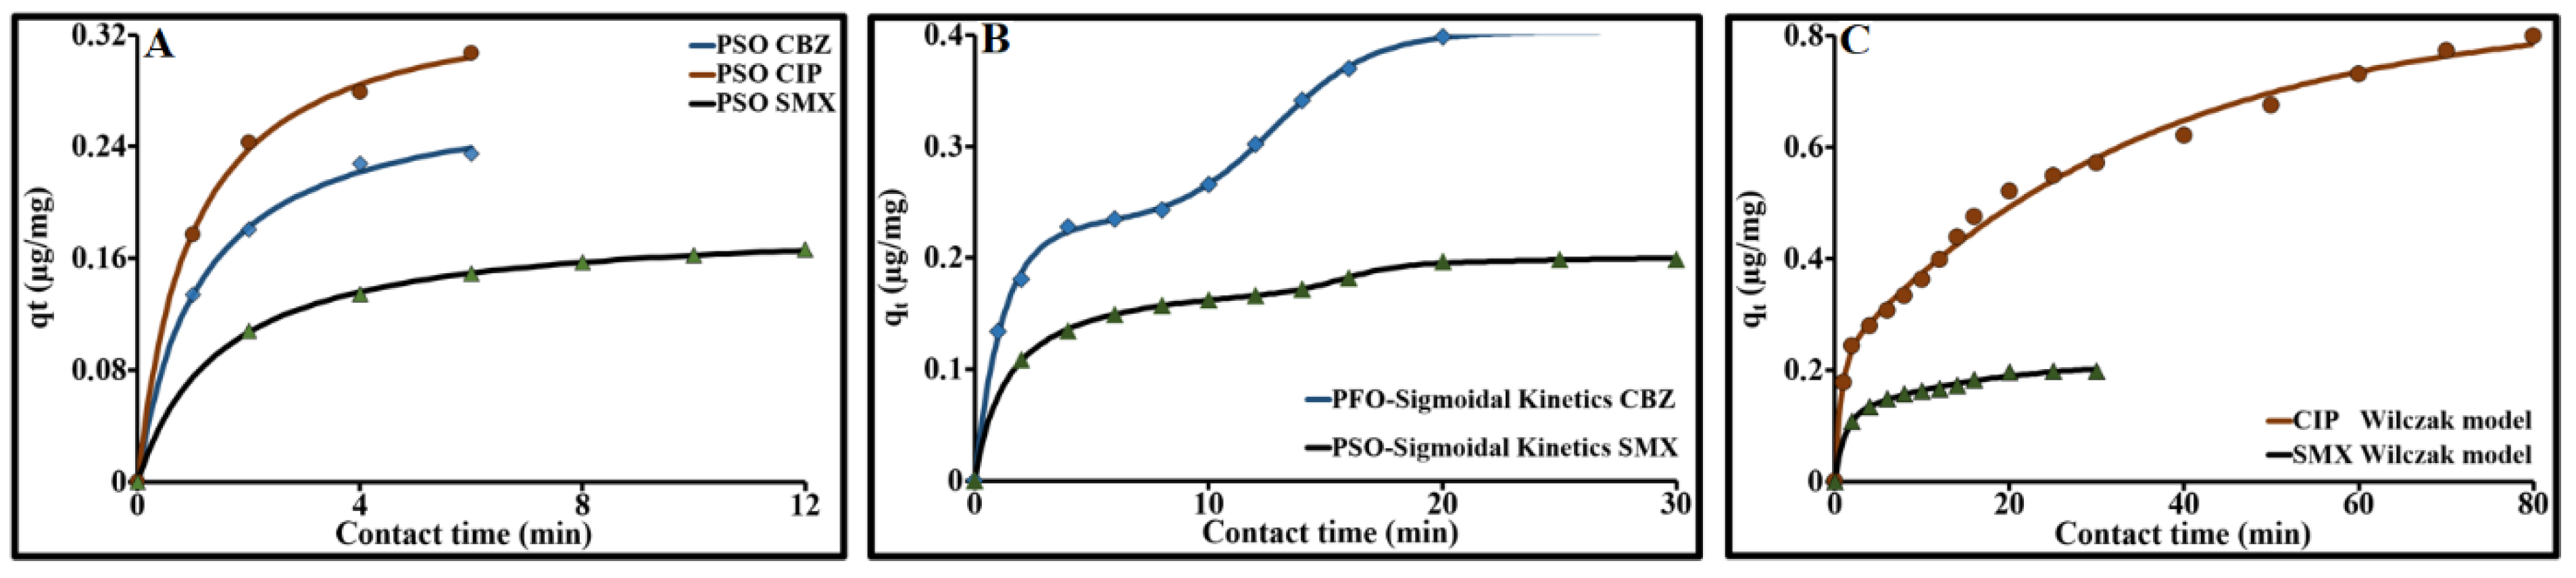
2.3. Sorption Kinetics of the Three Target Contaminants
2.3.1. Applied Sorption Models
External Diffusion
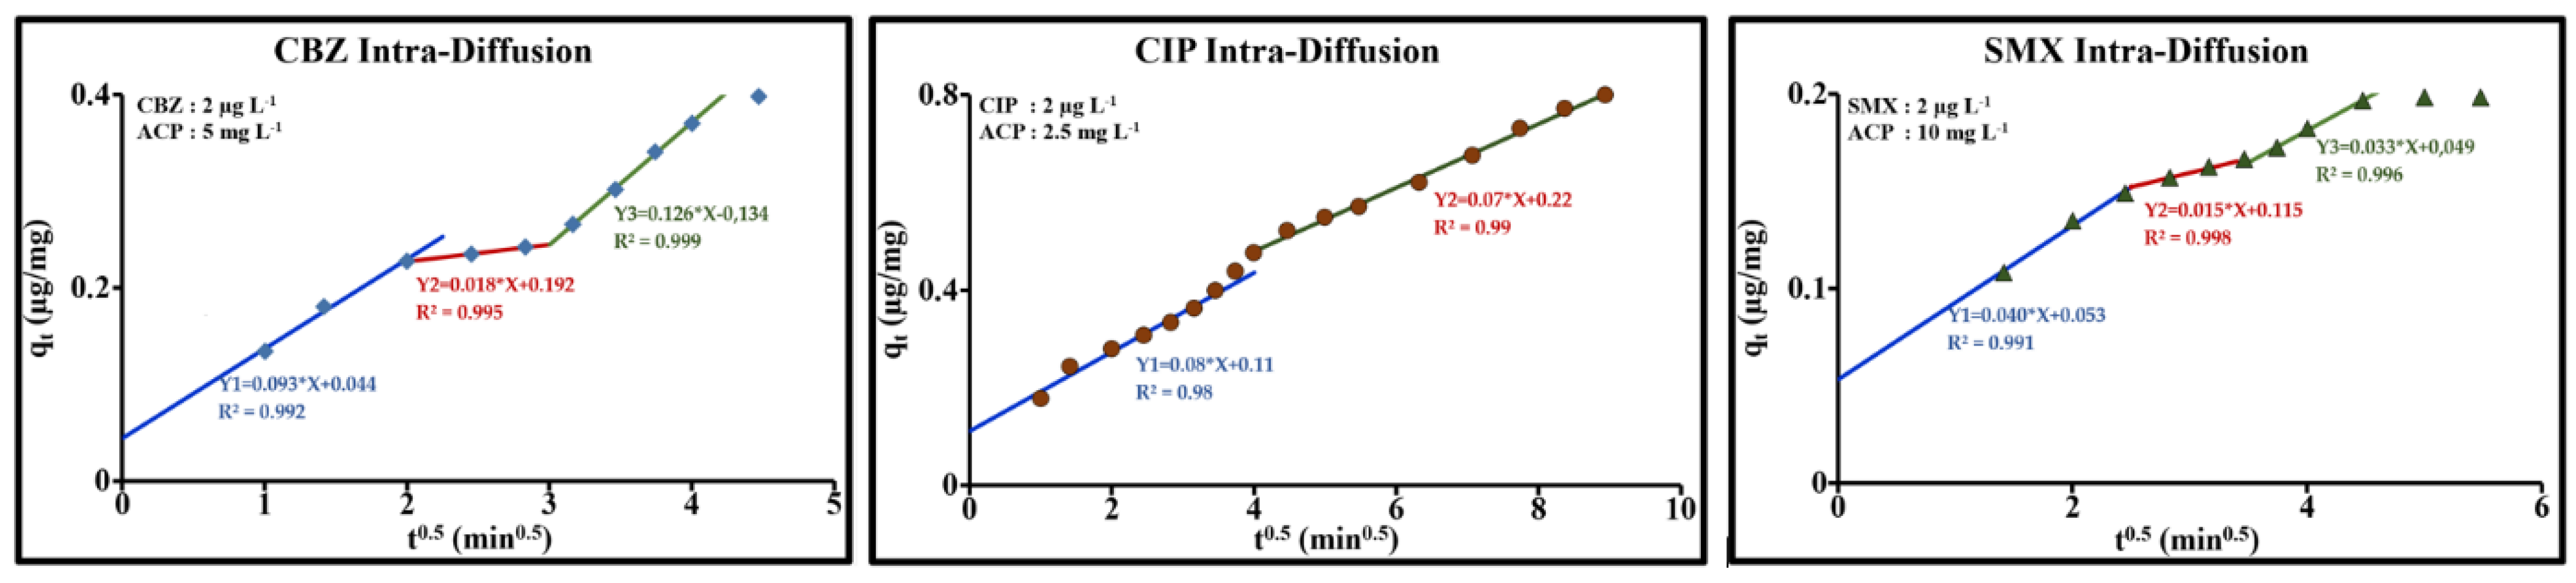
Intraparticle Diffusion
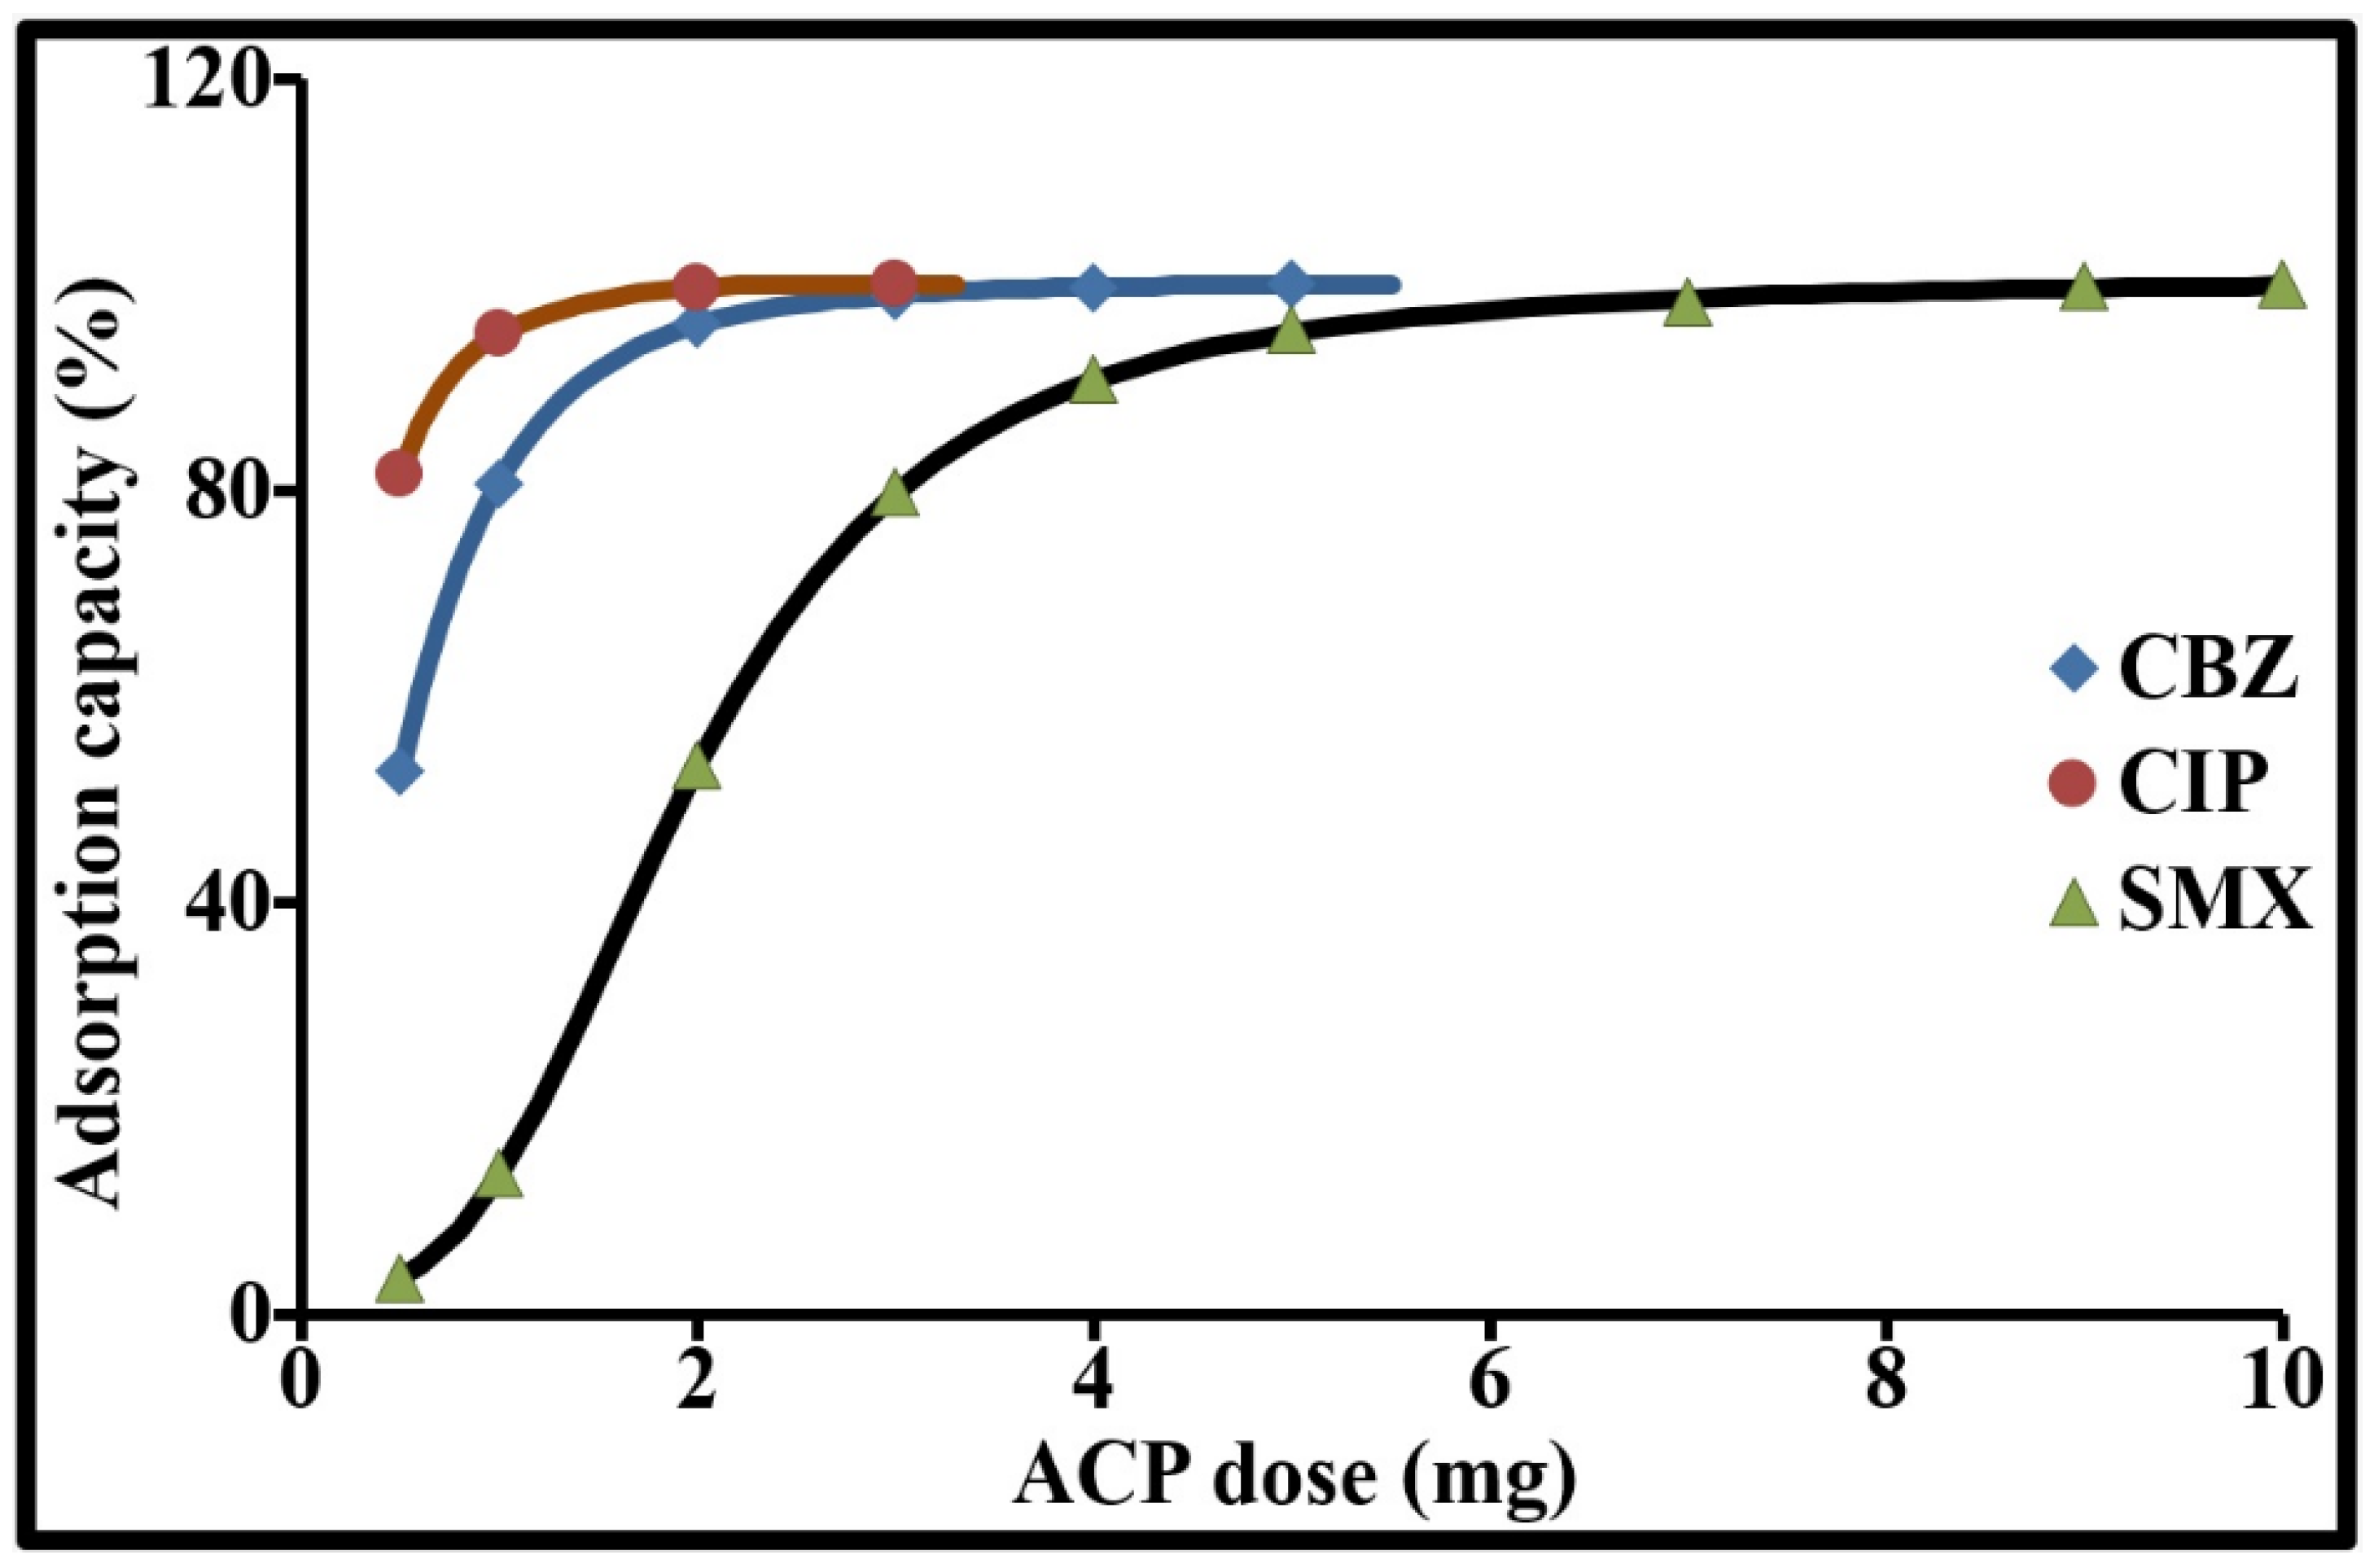
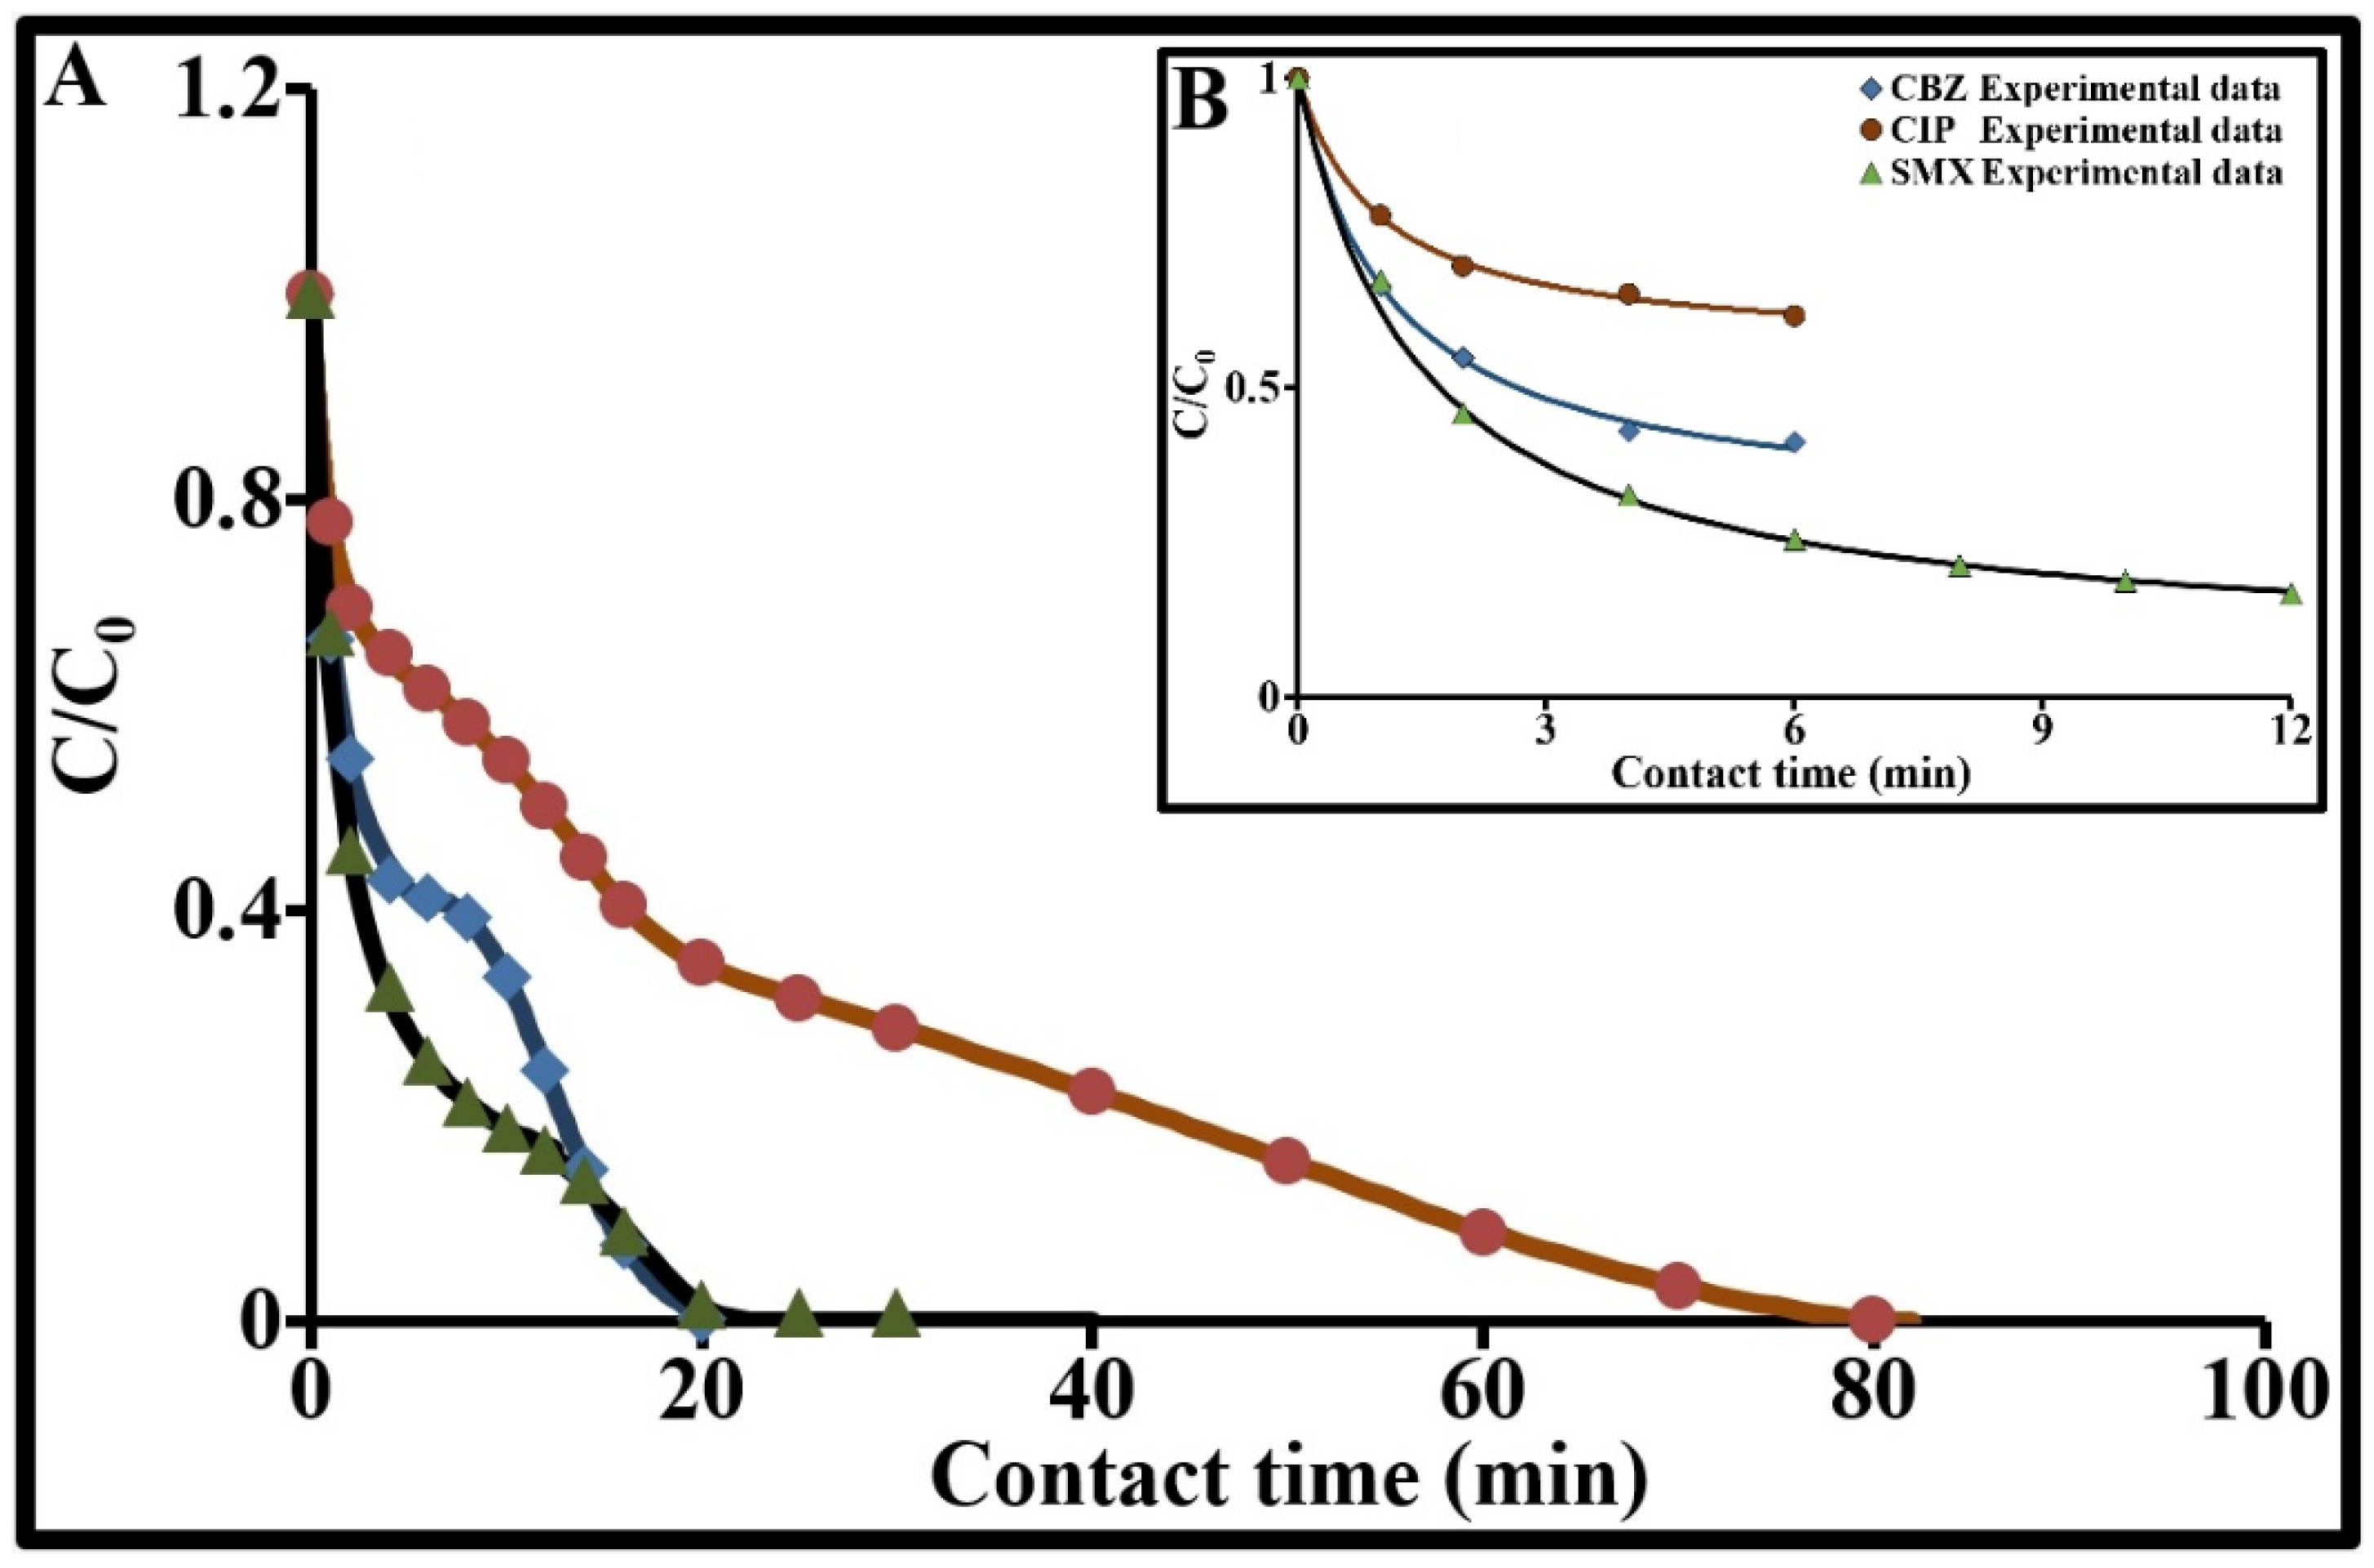
2.3.2. Impact of the Dosage of ACP on the Elimination Rate of Each Pollutant
2.3.3. Degradation Kinetics
2.3.4. Intraparticle Diffusion
2.3.5. External Diffusion
2.3.6. Diffusion Prediction with HSDM Model
2.3.7. Effective Diffusivity Prediction
2.3.8. Individual Adsorption Kinetics of CBZ, CIP et SMX
2.3.9. Possible Adsorption Mechanisms
3. Materials and Methods
3.1. Materials
3.2. Methods
4. Conclusions
Author Contributions
Funding
Institutional Review Board Statement
Informed Consent Statement
Data Availability Statement
Acknowledgments
Conflicts of Interest
Sample Availability
References
- Hartmann, A.; Alder, A.C.; Koller, T.; Widmer, R.M. Identification of fluoroquinolone antibiotics as the main source of umuC genotoxicity in native hospital wastewater. Environ. Toxicol. Chem. 1998, 17, 377–382. [Google Scholar] [CrossRef]
- Hughes, S.R.; Kay, P.; Brown, L.E. Global synthesis and critical evaluation of pharmaceutical data sets collected from river systems. Environ. Sci. Technol. 2013, 47, 661–677. [Google Scholar] [CrossRef] [PubMed]
- aus der Beek, T.; Weber, F.A.; Bergmann, A.; Hickmann, S.; Ebert, I.; Hein, A.; Küster, A. Pharmaceuticals in the Environment: Global Occurrence and Perspectives. Environ. Toxicol. Chem. 2016, 35, 823–835. [Google Scholar] [CrossRef] [PubMed]
- Glassmeyer, S.T.; Furlong, E.T.; Kolpin, D.W.; Batt, A.L.; Bensond, R.; Boone, J.S.; Conerly, O.; Donohue, M.J.; King, D.N.; Kostich, M.S.; et al. Nationwide reconnaissance of contaminants of emerging concern in source and treated drinking waters of the United States. Sci. Total Environ. 2017, 581, 909–922. [Google Scholar] [CrossRef]
- Paíga, P.; Correia, M.; Fernandes, M.J.; Silva, A.; Carvalho, M.; Vieira, J.S.; Jorge, S.; Silva, J.G.; Freire, C.; Delerue-Matos, C. Assessment of 83 pharmaceuticals in WWTP influent and euent samples by UHPLC-MS/MS: Hourly variation. Sci. Total Environ. 2019, 648, 582–600. [Google Scholar] [CrossRef]
- Kibuye, F.A.; Gall, H.E.; Elkin, K.R.; Ayers, B.; Veith, T.L.; Miller, M.; Jacob, S.; Hayden, K.R.; Watson, J.E.; Elliott, H.A. Fate of pharmaceuticals in a spray-irrigation system: From wastewater to groundwater. Sci. Total Environ. 2019, 654, 197–208. [Google Scholar] [CrossRef]
- Verlicchi, P.; Al Aukidy, M.; Zambello, E. Occurrence of pharmaceutical compounds in urban wastewater: Removal, mass load and environmental risk after a secondary treatment-A review. Sci. Total Environ. 2012, 429, 123–155. [Google Scholar] [CrossRef]
- Hai, F.I.; Yang, S.; Asif, M.B.; Sencadas, V.; Shawkat, S.; Sanderson-Smith, M.; Gorman, J.; Xu, Z.Q.; Yamamoto, K. Carbamazepine as a Possible Anthropogenic Marker in Water: Occurrences, Toxicological Effects, Regulations and Removal by Wastewater Treatment Technologies. Water 2018, 10, 107. [Google Scholar] [CrossRef] [Green Version]
- Björlenius, B.; Ripszám, M.; Haglund, P.; Lindberg, R.H.; Tysklind, M.; Fick, J. Pharmaceutical residues arewidespread in Baltic Sea coastal and offshore waters—Screening for pharmaceuticals and modelling of environmental concentrations of carbamazepine. Sci. Total Environ. 2018, 633, 1496–1509. [Google Scholar] [CrossRef]
- Ternes, T.A. Occurrence of drugs in german sewage treatment plants and rivers. Water Res. 1998, 32, 3245–3260. [Google Scholar] [CrossRef]
- Ternes, T.A. Pharmaceuticals and Metabolites as Contaminants of the Aquatic Environment. In Pharmaceuticals and Personal Care Products in the Environment: Scientific and Regulatory Issues; Symposium Series, 791; Daughton, C.G., Jones-Lepp, T., Eds.; American Chemical Society: Washington, DC, USA, 2001; pp. 39–54. [Google Scholar]
- Ferrari, B.; Paxéus, N.; Lo, G.R.; Pollio, A.; Garric, J. Ecotoxicological impact of pharmaceuticals found in treated wastewaters: Study of carbamazepine, clofibric acid, and diclofenac. Ecotoxicol. Environ. Saf. 2003, 55, 359–370. [Google Scholar] [CrossRef]
- Andreozzi, R.; Marotta, R.; Pinto, G.; Pollio, A. Carbamazepine in water: Persistence in the environment, ozonation treatment and preliminary assessment on algal toxicity. Water Res. 2002, 36, 2869–2877. [Google Scholar] [CrossRef]
- Paz, A.; Tadmor, G.; Malchi, T.; Blotevogel, J.; Borch, T.; Polubesova, T.; Chefetz, B. Fate of carbamazepine, its metabolites, and lamotrigine in soils irrigated with reclaimed wastewater: Sorption, leaching and plant uptake. Chemosphere 2016, 160, 22–29. [Google Scholar] [CrossRef]
- Riemenschneider, C.; Seiwert, B.; Moeder, M.; Schwarz, D.; Reemtsma, T. Extensive Transformation of the Pharmaceutical Carbamazepine Following Uptake into Intact Tomato Plants. Environ. Sci. Technol. 2017, 51, 6100–6109. [Google Scholar] [CrossRef]
- Watkinson, A.J.; Murby, E.J.; Costanzo, S.D. Removal of antibiotics in conventional and advanced wastewater treatment: Implications for environmental discharge and wastewater recycling. Water Res. 2007, 41, 4164–4176. [Google Scholar] [CrossRef]
- Larsson, D.G.J. Pollution from drug manufacturing: Review and perspectives. Philos. Trans. R. Soc. B 2014, 369, 20130571. [Google Scholar] [CrossRef] [Green Version]
- Khadra, A.; Pinelli, E.; Lacroix, M.Z.; Bousquet-Melou, A.; Hamdi, H.; Merlina, G.; Guiresse, M.; Hafidi, M. Assessment of the genotoxicity of quinolone and fluoroquinolones contaminated soil with the Vicia faba micronucleus test, Ecotoxicol. Environ. Saf. 2012, 76, 187–192. [Google Scholar] [CrossRef]
- Kristiansson, E.; Fick, J.; Janzon, A.; Grabic, R.; Rutgersson, C.; Weidegard, B.; Söderström, H.; Larsson, D.G.J. Pyrosequencing of antibiotic contaminated river sediments reveals high levels of resistance and genre transfer elements. PLoS ONE 2011, 6, e17038. [Google Scholar] [CrossRef]
- Verlicchi, P.; Galletti, A.; Petrovic, M.; Barceló, D. Hospital effluents as a source of emerging pollutants: An overview of micropollutants and sustainable treatment options. J. Hydrol. 2010, 389, 416–428. [Google Scholar] [CrossRef]
- Deblonde, T.; Cossu-Leguille, C.; Hartemanna, P. Emerging pollutants in wastewater: A review of the literature. Int. J. Hyg. Environ. Health 2011, 214, 442–448. [Google Scholar] [CrossRef]
- Furlong, E.T.; Batt, A.L.; Glassmeyer, S.T.; Noriega, M.C.; Kolpin, D.W.; Mash, H.; Schenck, K.M. Nationwide reconnaissance of contaminants of emerging concern in source and treated drinking waters of the United States: Pharmaceuticals. Sci Total Environ. 2017, 579, 1629–1642. [Google Scholar] [CrossRef]
- Kibuye, F.A.; Gall, H.E.; Elkin, K.R.; Swistock, B.; Veith, T.L.; Watson, J.E.; Elliott, H.A. Occurrence, concentrations, and risks of pharmaceutical compounds in private wells in central Pennsylvania. J. Environ. Qual. 2019, 48, 1057–1066. [Google Scholar] [CrossRef] [Green Version]
- Barnes, K.K.; Kolpin, D.W.; Furlong, E.T.; Zaugg, S.D.; Meyer, M.T.; Barber, L.B. A national reconnaissance of pharmaceuticals and other organic wastewater contaminants in the United States—I) Groundwater. Sci. Total Environ. 2008, 402, 192–200. [Google Scholar] [CrossRef]
- Wu, X.; Ernst, F.; Conkle, J.L.; Gan, J. Comparative uptake and translocation of pharmaceutical and personal care products (PPCPs) by common vegetables. Environ. Int. 2013, 60, 15–22. [Google Scholar] [CrossRef]
- Bizi, M. Activated Carbon and the Principal Mineral Constituents of a Natural Soil in the Presence of Carbamazepine. Water 2019, 11, 2290. [Google Scholar] [CrossRef] [Green Version]
- Bizi, M.; El Bachra, F. Evaluation of the ciprofloxacin adsorption capacity of common industrial minerals and application to tap water treatment. Powder Technol. 2020, 362, 323–333. [Google Scholar] [CrossRef]
- Himes, V.; Mighell, A.D.; DE Camp, W.H. Structure of Carbamazepine: 5H-Dibenz[b,f]azepine-5-carboxamide. Acta Cryst. 1981, B37, 2242–2245. [Google Scholar] [CrossRef] [Green Version]
- Mahapatra, S.; Venugopala, K.N.; Row, T.N.G. Device to Crystallize Organic Solids: Structure of Ciprofloxacin, Midazolam, and Ofloxacin as Targets. Cryst. Growth Des. 2010, 10, 1866–1870. [Google Scholar] [CrossRef]
- Das, D.; Sahu, N.; Roy, S.; Dutta, P.; Mondal, S.; Torres, E.L.; Sinha, C. The crystal structure of sulfamethoxazole, interaction with DNA, DFT calculation, and molecular docking studies. Spectrochim. Acta Part A Mol. Biomol. Spectrosc. 2015, 137, 560–568. [Google Scholar] [CrossRef] [PubMed]
- Nghiem, L.D.; Hawkes, S. Effects of membrane fouling on the nanofiltration of pharmaceutically active compounds (PhACs): Mechanisms and role of membrane pore size. Sep. Purif. Technol. 2007, 57, 176–184. [Google Scholar] [CrossRef]
- Balarak, D.; Mostafapour, F.K.; Azarpira, H. Adsorption kinetics and equilibrium of ciprofloxacin from aqueous solutions using Corylusavellana (hazelnut) activated carbon. Br. J. Pharm. Res. 2016, 13, 1–14. [Google Scholar]
- Oppel, J.; Broll, G.; Löffer, D.; Meller, M.; Römbke, J.; Ternes, T. Leaching behaviour of pharmaceuticals in soil-testing-systems: A part of an environmental risk assessment for groundwater protection. Sci. Total Environ. 2004, 265–273. [Google Scholar] [CrossRef] [PubMed]
- Lin, C.E.; Chang, C.C.; Lin, W.C. Migration behavior and separation of sulfonamides in capillary zone electrophoresis III. Citrate buffer as a background electrolyte. J. Chromatogr. A 1997, 768, 105–112. [Google Scholar] [CrossRef]
- Loftsson, T.; Hreinsdottir, D.; Masson, M. Evaluation of cyclodextrin solubilization of drugs. Int. J. Pharm. 2005, 302, 18–28. [Google Scholar] [CrossRef]
- Takacs-Novak, K.; Jozan, M.; Hermecz, I.; Szasz, G. Lipophilicity of antibacterial fluoroquinolones. Int. J. Pharm. 1992, 79, 89–96. [Google Scholar] [CrossRef]
- Roden, N.M. Cumulative Risk of Pharmaceuticals in NJ Surface Water to Human Health; University of Medicine and Dentistry of New Jersey: Newark, NJ, USA, 2013. [Google Scholar]
- Chadha, R.; Singh, P.; Khullar, S.; Mandal, S.K. Ciprofloxacin Hippurate Salt: Crystallization Tactics, Structural Aspects, and Biopharmaceutical Performance. Cryst. Growth Des. 2016, 16, 4960–4967. [Google Scholar] [CrossRef]
- Ross, D.L.; Riley, C.M. Dissociation and complexation of the fluoroquinolone antimicrobials—An update. J. Pharm. Biomed Anal. 1994, 12, 1325–1331. [Google Scholar] [CrossRef]
- Mandić, Z. (Ed.) Physico-Chemical Methods in Drug Discovery and Development; IAPC Publishing: Zagreb, Croatia, 2012; pp. 20–22. [Google Scholar]
- Brittain, H.G. Fluorescence Studies of the Transformation of Carbamazepine Anhydrate Form III to its Dihydrate Phase. J. Pharm. Sci. 2004, 93, 375–383. [Google Scholar] [CrossRef]
- Zhang, C.L.; Wang, F.A.; Wang, Y. Solubilities of Sulfadiazine, Sulfamethazine, Sulfadimethoxine, Sulfamethoxydiazine, Sulfamonomethoxine, Sulfamethoxazole, and Sulfachloropyrazine in Water from (298.15 to 333.15 K). J. Chem. Eng. Data 2007, 52, 1563–1566. [Google Scholar] [CrossRef]
- Zhang, C.L.; Wang, Y. Aqueous Solubilities for Ofloxacin, Norfloxacin, Lomefloxacin, Ciprofloxacin, Pefloxacin, and Pipemidic Acid from (293.15 to 323.15 K). J. Chem. Eng. Data 2008, 53, 1295–1297. [Google Scholar] [CrossRef]
- Boehm, H.P.; Diehl, E.; Heck, W.; Sappok, R. Surface oxides de carbon. Angew. Chem. Int. Ed. Engl. 1964, 3, 667–677. [Google Scholar] [CrossRef]
- Boehm, H.P. Chemical Identification of Surface Groups, Advances in Catalysis; Eley, D.D., Pines, H., Weisz, P.B., Eds.; Academic Press: New York, NY, USA, 1966; Volume 16, pp. 179–274. [Google Scholar]
- Boehm, H.P. Some aspects of the surface chemistry of carbon blacks and other carbons. Carbon 1994, 32, 759–769. [Google Scholar] [CrossRef]
- Finqueneisel, G.; Zimny, T.; Albiniak, A.; Siemieniewska, T.; Vogt, D.; Weber, J.V. Cheap adsorbent. Part 1: Active cokes from lignites and improvement of their adsorptive properties by mild oxidation. Fuel 1998, 77, 549–556. [Google Scholar] [CrossRef]
- Weber, W.J., Jr.; Morris, J.C. Kinetics of adsorption on carbon from solution. J. Sanit. Eng. Div. Am. Soc. Civ. Eng. 1963, 89, 31–60. [Google Scholar] [CrossRef]
- Bedia, J.; Peñas-Garzón, M.; Gómez-Avilés, A.; Rodriguez, J.J.; Belver, C. Review: A Review on the Synthesis and Characterization of Biomass-Derived Carbons for Adsorption of Emerging Contaminants from Water. J. Carbon Res. C 2018, 4, 63. [Google Scholar] [CrossRef] [Green Version]
- Crank, J. The Mathematics of Diffusion, 2nd ed.; Clarendon Press: Oxford, UK, 1975. [Google Scholar]
- Peel, R.G.; Benedek, A.; Crowe, C.M. A Branched Pore Kinetic Model for Activated Carbon Adsorption. AIChE J. 1981, 27, 26–32. [Google Scholar] [CrossRef]
- Harrison, L.G. Influence of dislocation on diffusion kinetics in solides with particular reference to the Alkali Halides. Trans. Faraday Soc. 1961, 57, 1191–1199. [Google Scholar] [CrossRef]
- Rosen, J.B. Kinetics of a Fixed Bed System for Solid Diffusion into Spherical Particles. J. Chem. Phys. 1952, 20, 387–394. [Google Scholar] [CrossRef]
- Mathews, A.P.; Weber, W.J.J. Effects of external mass transfer and intraparticle diffusion on adsorption rates in slurry reactors. AIChE Symp. Ser. 1976, 166, 91–107. [Google Scholar]
- Crittenden, J.C.; Weber, W.J., Jr. A Predictive Model for Design of Fixed-bed Adsorbers: Model Development and Parameter Estimation. J. Environ. Eng. 1978, 104, 185–197. [Google Scholar] [CrossRef]
- Ding, L. Mechanisms of Competitive Adsorption between Trace Organic Contaminants and Natural Organic Matter on Activated Carbon; University of Illinois at Urbana-Champaign: Champaign, IL, USA, 2010. [Google Scholar]
- Skidmore, G.L.; Horstmann, B.J.; Chase, H.A. Modelling single-component protein adsorption to the cation exchanger S Sepharose FF. J. Chromatogr. 1990, 498, 113–128. [Google Scholar] [CrossRef]
- Boyd, G.E.; Adamson, A.W.; Myers, L.S., Jr. The exchange adsorption of ions from aqueous solutions by organic zeolites: II. Kinetics. J. Am. Chem. Soc. 1947, 69, 2836–2848. [Google Scholar] [CrossRef]
- Reichenberg, D. Properties of ion exchange resins in relation to their structure. III. Kinetics of exchange. J. Am. Chem. Soc. 1953, 75, 589–598. [Google Scholar] [CrossRef]
- Ho, F.-G.; Strieder, W. A variational calculation of the effective surface diffusion coefficient and tortuosity. Chem. Eng. Sci. 1981, 36, 253–258. [Google Scholar] [CrossRef]
- Chen, B.; Hui, C.W.; McKay, G. Pore-Surface Diffusion Modeling for Dyes from Effluent on Pith. Langmuir 2001, 17, 740–748. [Google Scholar] [CrossRef]
- Coughlin, R.W.; Ezra, F.S. Role of Surface Acidity in the Adsorption of Organic Pollutants on the Surface of Carbon. Environ. Sci. Technol. 1968, 2, 291–293. [Google Scholar] [CrossRef]
- Moreno-Castilla, C. Adsorption of organic molecules from aqueous solutions on carbon materials. Carbon 2004, 42, 83–94. [Google Scholar] [CrossRef] [Green Version]
- Derylo-Marczewska, A.; Swiatkowski, A.; Biniak, S.; Walczyk, M. Effect of properties of chemically modified activated carbon and aromatic adsorbate molecule on adsorption from liquid phase. Colloids Surf. A Phys. Eng. Asp. 2008, 327, 1–8. [Google Scholar] [CrossRef]
- Hunter, C.A.; Singh, J.; Thornton, J.M. π-π interactions: The geometry and energetics of phenylalanine-phenylalanine interactions in proteins. J. Mol. Biol. 1991, 218, 837–846. [Google Scholar] [CrossRef]
- Haydar, S.; Ferro-García, M.A.; Rivera-Utrilla, J.; Joly, J.P. A dsorption of p-nitrophenol on an activated carbon with di_erent oxidations. Carbon 2003, 41, 387–395. [Google Scholar] [CrossRef]
- Nishio, M.; Hirota, M.; Umezawa, Y. The CH/π Interaction. In Evidence, Nature, and Consequences; Wiley-VCH: New York, NY, USA, 1998. [Google Scholar]
- Aristilde, L.; Sposito, G. Molecular modeling of metal complexation by a fluoroquinolone antibiotic. Environ. Toxicol. Chem. 2008, 27, 2307–2310. [Google Scholar] [CrossRef] [PubMed]
- Veclani, D.; Melchior, A. Adsorption of ciprofloxacin on carbon nanotubes: Insights from molecular dynamics simulations. J. Mol. Liq. 2020, 298, 111977. [Google Scholar] [CrossRef]
- Sompornpailin, D.; Ratanatawanate, C.; Chantanavorakunchai, N.; Punyapalakul, P. Effects of electrolytes and fractionated dissolved organic matter on selective adsorption of pharmaceuticals on terephthalic acid-based metal-organic frameworks. Environ. Res. 2021, 196, 110335. [Google Scholar] [CrossRef] [PubMed]
- Dubinin, M.M.; Stoeckli, H.F. Homogeneous and heterogeneous micropore structures in carbonaceous adsorbents. J. Colloid Interface Sci. 1980, 75, 34–42. [Google Scholar] [CrossRef] [Green Version]
- Mular, A.L.; Roberts, R.B. A Simplified method to determine isoelectric points of oxides. Trans. Can. Inst. Min. Metall. 1966, 69, 438–439. [Google Scholar]


| Parameter | Carbamazepine | Ciprofloxacin | Sulfamethoxazole |
|---|---|---|---|
| CAS number | 298-46-4 | 85721-33-1 | 723-46-6 |
| Molecular formula | C15H12N2O | C17H18FN3O3 | C10H11N3O3S |
| Molecular weight(g mol−1) | 236.27 | 331.34 | 253.28 |
| BCS (class drug) | II | IV | IV |
| Melting point (°C) | 175 | 268 | 167 |
| Density (g cm−3) | 1.343 | 1.453 | 1.462 |
| Crystal system (anhydrous form) | P-monoclinic [28] a = 7.537 Å, b = 11.156 Å, c = 13.912 Å, α = γ = 90°, β = 92.862° & Z = 4 | Triclinic [29] a = 8.062 Å, b = 9.730 Å, c = 10.321 Å, α = 99.927°, β = 104.541°, γ = 98.073 & Z = 2 | Monoclinic [30] a = 24.719 Å, b = 7.204 Å, c = 14.663 Å, α = γ = 90°, β = 118.217° & Z = 8 |
| Molecular width (nm) | 0.507 [31] | 0.82 [32] | 0.526 [31] |
| Molecular height (nm) | 0.529 [31] | 0.25 [32] | 0.587 [31] |
| Molecular length (nm) | 0.891 [31] | 1.31 [32] | 1.031 [31] |
| Acid dissociation constant | pKa1≈1; pKa2 = 13.9 [33] | pKa1 = 6.0; pKa2 = 8.8 [32] | pKa1 = 1.8; pKa2 = 5.6 [34] |
| Log PIEP | 2.25 [35] | −1.08 [36] | 0.89 [31] |
| Log D8 (*) | 2.25 | −1.15 | −1.54 |
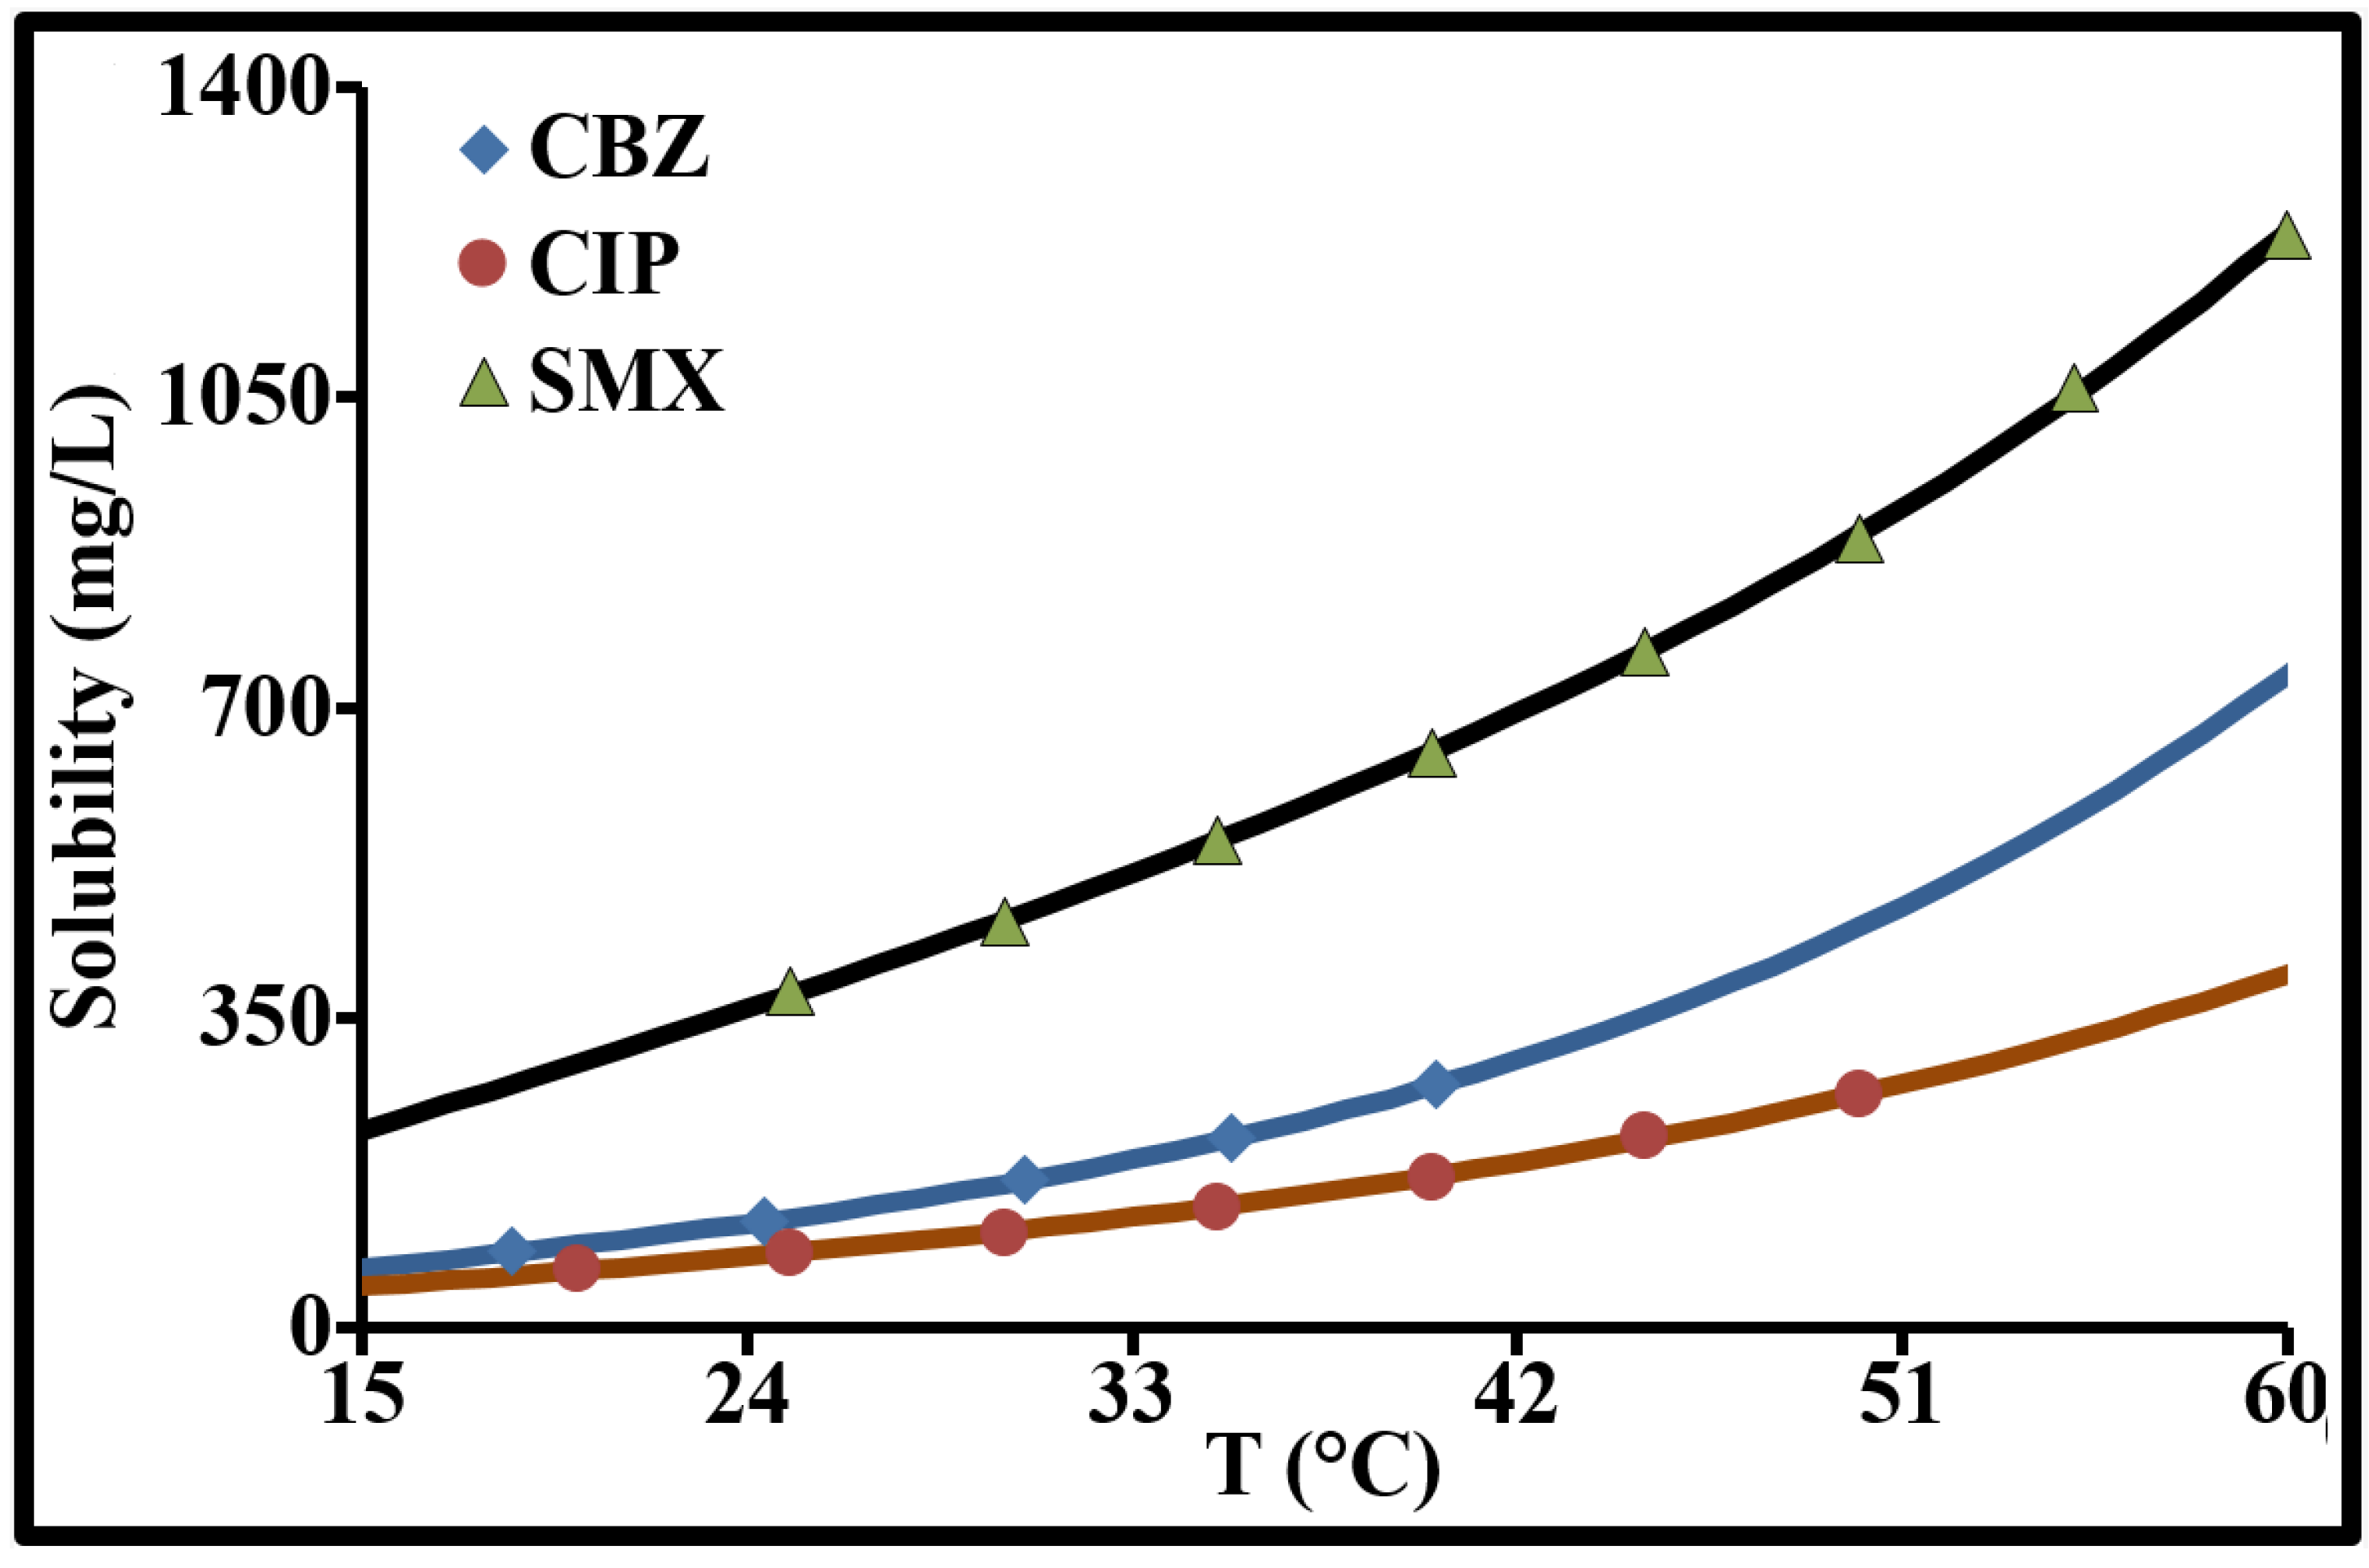
| Hydrosolubility (solute in MQ-water), S (mg L−1), T(°C) < 60 (*) | S = P1T + P2TP3 P1 = 4.35, P2 = 6.09 × 10⁻⁵, P3 = 3.88 | S = P1T + P2TP3 P1 = 3.04, P2 = 7.64 × 10⁻⁵, P3 = 3.63 | S = P1T + P2TP3 P1 = 14.81, P2 = 4.66 × 10⁻⁶, P3 = 4.43 |
| Acceptable daily intakes for human (µg kg−1 day−1) [37] | 11 | 2 | 24 |
| da | IEP | PZC | SSBET | SSµP-t | SSmP-t | SSMP-t | Lµ-t | VµP-t | VmP-t | VMP-t | SSµP-DA* | VµP-DA * |
|---|---|---|---|---|---|---|---|---|---|---|---|---|
| µm | m2 g−1 | m2 g−1 | m2 g−1 | m2 g−1 | nm | cm3 g−1 | cm3 g−1 | cm3 g−1 | m2 g−1 | cm3 g−1 | ||
| 24 | 3.6 | 6.8 | 957 | 695 | 203 | 60 | 1.75 | 0.30 | 0.17 | 0.10 | 711 | 0.31 |
| Functional Group | Density µmol m−2 | Number of Sites per nm2 |
|---|---|---|
| Carboxylic | 0.28 | 0.17 |
| Carbonyl | 0.46 | 0.28 |
| Anhydride | 0.17 | 0.10 |
| Lactone | 0.06 | 0.03 |
| Phenol | 0.53 | 0.32 |
| Total electron donor | 0.96 | |
| Total electron acceptor | 0.80 |
| Pollutant | mp/mACP µg mg−1 | kf cm min−1 | CS µg mg−1 | DS cm2 min−1 | De cm2 min−1 |
|---|---|---|---|---|---|
| SMX | 0.2 | 0.20 | 0.09 | 12.3 10−10 | 3.1 10−8 |
| CBZ | 0.4 | 0.51 | 0.11 | 3.4 10−10 | 1.7 10−8 |
| CIP | 0.8 | 1.14 | 0.14 | 0.9 10−10 | 1.1 10−8 |
| (a) | |||||||||||||||
| Variables | MW | Log1/MW | LxW | LxH | WxH | LxWxH | kf | Cs | De | Ds | Logkf | LogCS | LogDe | LogDS | qe,exp |
| MW | 1 | ||||||||||||||
| Log1/MW | 1.000 | 1 | |||||||||||||
| LxW | 0.999 | 0.998 | 1 | ||||||||||||
| LxH | −0.783 | −0.766 | −0.803 | 1 | |||||||||||
| WxH | −0.844 | −0.829 | −0.861 | 0.995 | 1 | ||||||||||
| LxWxH | 0.023 | 0.050 | −0.011 | 0.604 | 0.518 | 1 | |||||||||
| kf | 0.879 | 0.865 | 0.894 | −0.985 | −0.998 | −0.457 | 1 | ||||||||
| CS | 0.820 | 0.804 | 0.839 | −0.998 | −0.999 | −0.553 | 0.994 | 1 | |||||||
| De | −0.625 | −0.603 | −0.651 | 0.975 | 0.946 | 0.766 | −0.922 | −0.959 | 1 | ||||||
| Ds | −0.539 | −0.516 | −0.567 | 0.946 | 0.907 | 0.830 | −0.876 | −0.924 | 0.994 | 1 | |||||
| Logkf | 0.741 | 0.723 | 0.763 | −0.998 | −0.986 | −0.654 | 0.972 | 0.992 | −0.987 | −0.965 | 1 | ||||
| LogCs | 0.782 | 0.764 | 0.802 | −1.000 | −0.994 | −0.606 | 0.985 | 0.998 | −0.975 | −0.947 | 0.998 | 1 | |||
| LogDe | −0.731 | −0.712 | −0.753 | 0.997 | 0.983 | 0.666 | −0.968 | −0.990 | 0.990 | 0.969 | −1.000 | −0.997 | 1 | ||
| LogDs | −0.781 | −0.763 | −0.801 | 1.000 | 0.994 | 0.607 | −0.984 | −0.998 | 0.976 | 0.947 | −0.998 | −1.000 | 0.997 | 1 | |
| qe,exp | 0.778 | 0.760 | 0.799 | −1.000 | −0.994 | −0.611 | 0.984 | 0.998 | −0.977 | −0.949 | 0.998 | 1.000 | −0.997 | −1.000 | 1 |
| (b) | |||||||||||||||
| Variables | MW | Log1/MW | LxW | LxH | WxH | LxWxH | kf | Cs | De | Ds | Logkf | LogCs | LogDe | LogDs | qe,exp |
| MW | 0 | ||||||||||||||
| Log1/MW | 0.017 | 0 | |||||||||||||
| LxW | 0.021 | 0.039 | 0 | ||||||||||||
| LxH | 0.427 | 0.445 | 0.406 | 0 | |||||||||||
| WxH | 0.361 | 0.378 | 0.340 | 0.067 | 0 | ||||||||||
| LxWxH | 0.986 | 0.968 | 0.993 | 0.587 | 0.654 | 0 | |||||||||
| kf | 0.317 | 0.334 | 0.296 | 0.111 | 0.044 | 0.698 | 0 | ||||||||
| Cs | 0.388 | 0.405 | 0.366 | 0.040 | 0.027 | 0.627 | 0.071 | 0 | |||||||
| De | 0.570 | 0.588 | 0.549 | 0.143 | 0.210 | 0.444 | 0.254 | 0.183 | 0 | ||||||
| Ds | 0.637 | 0.655 | 0.616 | 0.210 | 0.276 | 0.377 | 0.320 | 0.250 | 0.067 | 0 | |||||
| Logkf | 0.469 | 0.486 | 0.447 | 0.041 | 0.108 | 0.546 | 0.152 | 0.081 | 0.102 | 0.169 | 0 | ||||
| LogCs | 0.429 | 0.446 | 0.407 | 0.001 | 0.068 | 0.586 | 0.112 | 0.041 | 0.142 | 0.209 | 0.040 | 0 | |||
| LogDe | 0.478 | 0.496 | 0.457 | 0.051 | 0.117 | 0.536 | 0.161 | 0.090 | 0.092 | 0.159 | 0.010 | 0.049 | 0 | ||
| LogDs | 0.430 | 0.447 | 0.408 | 0.002 | 0.069 | 0.585 | 0.113 | 0.042 | 0.141 | 0.208 | 0.039 | 0.001 | 0.049 | 0 | |
| qe,exp | 0.433 | 0.450 | 0.411 | 0.005 | 0.072 | 0.582 | 0.116 | 0.045 | 0.138 | 0.205 | 0.036 | 0.004 | 0.046 | 0.003 | 0 |
| (c) | |||||||||||||||
| Variables | MW | Log1/MW | LxW | LxH | WxH | LxWxH | kf | Cs | De | Ds | Logkf | LogCs | LogDe | LogDs | qe,exp |
| MW | 1 | ||||||||||||||
| Log1/MW | 0.999 | 1 | |||||||||||||
| LxW | 0.999 | 0.996 | 1 | ||||||||||||
| LxH | 0.613 | 0.586 | 0.645 | 1 | |||||||||||
| WxH | 0.712 | 0.687 | 0.742 | 0.989 | 1 | ||||||||||
| LxWxH | 0.001 | 0.002 | 0.000 | 0.365 | 0.268 | 1 | |||||||||
| kf | 0.772 | 0.749 | 0.800 | 0.970 | 0.995 | 0.209 | 1 | ||||||||
| CS | 0.673 | 0.647 | 0.704 | 0.996 | 0.998 | 0.306 | 0.988 | 1 | |||||||
| De | 0.390 | 0.364 | 0.423 | 0.950 | 0.896 | 0.587 | 0.850 | 0.920 | 1 | ||||||
| Ds | 0.291 | 0.267 | 0.322 | 0.895 | 0.823 | 0.688 | 0.767 | 0.854 | 0.989 | 1 | |||||
| Logkf | 0.549 | 0.522 | 0.583 | 0.996 | 0.972 | 0.428 | 0.944 | 0.984 | 0.975 | 0.931 | 1 | ||||
| LogCs | 0.611 | 0.584 | 0.643 | 1.000 | 0.989 | 0.367 | 0.969 | 0.996 | 0.951 | 0.897 | 0.996 | 1 | |||
| LogDe | 0.534 | 0.507 | 0.568 | 0.994 | 0.966 | 0.443 | 0.937 | 0.980 | 0.979 | 0.939 | 1.000 | 0.994 | 1 | ||
| LogDs | 0.610 | 0.583 | 0.642 | 1.000 | 0.988 | 0.368 | 0.969 | 0.996 | 0.952 | 0.897 | 0.996 | 1.000 | 0.994 | 1 | |
| qe,exp | 0.605 | 0.578 | 0.638 | 1.000 | 0.987 | 0.373 | 0.967 | 0.995 | 0.954 | 0.900 | 0.997 | 1.000 | 0.995 | 1.000 | 1 |
| Pseudo-First-Order(PFO) | Pseudo-Second-Order (PSO) | ||||||||||||||
| Pollutant | mp/mACP | N | Interval | kf | qe,exp | qe,calc | k1 | R2 | ∆q | qe,calc | h | k2 | k2qe | R2 | ∆q |
| mg g−1 | mol g−1 | time (min) | cm min−1 | mg g−1 | mg g−1 | min−1 | % | mg g−1 | mg g−1 min−1 | g mg−1 min−1 | min−1 | % | |||
| SMX | 0.2 | 7.90 10−7 | 0–12 | 0.20 | 0.166 | 0.162 | 0.503 | 0.994 | 4.07 | 0.186 | 0.126 | 3.653 | 0.680 | 0.999 | 0.76 |
| CBZ | 0.4 | 1.69 10−6 | 0–6 | 0.50 | 0.235 | 0.236 | 0.786 | 0.998 | 2.85 | 0.283 | 0.256 | 3.190 | 0.904 | 0.998 | 2.26 |
| CIP | 0.8 | 2.41 10-6 | 0–6 | 1.12 | 0.307 | 0.299 | 0.864 | 0.996 | 3.93 | 0.353 | 0.365 | 2.924 | 1.033 | 0.999 | 2.32 |
| PFO/Sigmoid | PSO/Sigmoid | ||||||||||||||
| Pollutant | mp/mACP | Interval | qe,exp | qe,calc | qe,sig | k1 | R2 | ∆q | qe,calc | qe,sig | h | k2 | k2qe | R2 | ∆q |
| mg g−1 | time (min) | mg g−1 | mg g−1 | mg g−1 | min−1 | % | mg g−1 | mg g−1 | mg g−1 min−1 | g mg−1 min−1 | min−1 | % | |||
| SMX | 0.2 | 0–30 | 0.198 | 0.200 | 0.049 | 0.601 | 0.999 | 2.05 | 0.208 | 0.023 | 0.128 | 3.724 | 0.690 | 1.000 | 0.75 |
| CBZ | 0.4 | 0–20 | 0.398 | 0.403 | 0.174 | 0.832 | 0.999 | 2.58 | 0.413 | 0.139 | 0.273 | 3.660 | 1.000 | 0.999 | 2.69 |
| Double-Exponential Model | |||||||||||||||
| Pollutant | mp/mACP | Interval | qe,exp | q0 | qe,r | qe,s | qe1 + qe2 | ks | kr | R2 | ∆q | ||||
| mg g−1 | time (min) | mg g−1 | mg g−1 | mg g−1 | mg g−1 | mg g−1 | min−1 | min−1 | % | ||||||
| SMX | 0.2 | 0–30 | 0.198 | −8.8 10−4 | 0.100 | 0.119 | 0.220 | 0.061 | 0.770 | 0.996 | 2.3 | ||||
| CIP | 0.8 | 0–80 | 0.798 | −2.7 10−4 | 0.630 | 0.216 | 0.847 | 0.029 | 1.381 | 0.995 | 3.6 | ||||
Publisher’s Note: MDPI stays neutral with regard to jurisdictional claims in published maps and institutional affiliations. |
© 2021 by the authors. Licensee MDPI, Basel, Switzerland. This article is an open access article distributed under the terms and conditions of the Creative Commons Attribution (CC BY) license (https://creativecommons.org/licenses/by/4.0/).
Share and Cite
Bizi, M.; EL Bachra, F.-E. Transport of Carbamazepine, Ciprofloxacin and Sulfamethoxazole in Activated Carbon: Solubility and Relationships between Structure and Diffusional Parameters. Molecules 2021, 26, 7318. https://doi.org/10.3390/molecules26237318
Bizi M, EL Bachra F-E. Transport of Carbamazepine, Ciprofloxacin and Sulfamethoxazole in Activated Carbon: Solubility and Relationships between Structure and Diffusional Parameters. Molecules. 2021; 26(23):7318. https://doi.org/10.3390/molecules26237318
Chicago/Turabian StyleBizi, Mohamed, and Fatima-Ezzahra EL Bachra. 2021. "Transport of Carbamazepine, Ciprofloxacin and Sulfamethoxazole in Activated Carbon: Solubility and Relationships between Structure and Diffusional Parameters" Molecules 26, no. 23: 7318. https://doi.org/10.3390/molecules26237318
APA StyleBizi, M., & EL Bachra, F.-E. (2021). Transport of Carbamazepine, Ciprofloxacin and Sulfamethoxazole in Activated Carbon: Solubility and Relationships between Structure and Diffusional Parameters. Molecules, 26(23), 7318. https://doi.org/10.3390/molecules26237318