
Validated Simple HPLC-UV Method for Mycophenolic Acid (MPA) Monitoring in Human Plasma. Internal Standardization: Is It Necessary?


Abstract
1. Introduction
2. Results
2.1. Method Development
2.1.1. Extraction
2.1.2. Chromatographic Separation
2.2. Method Validation
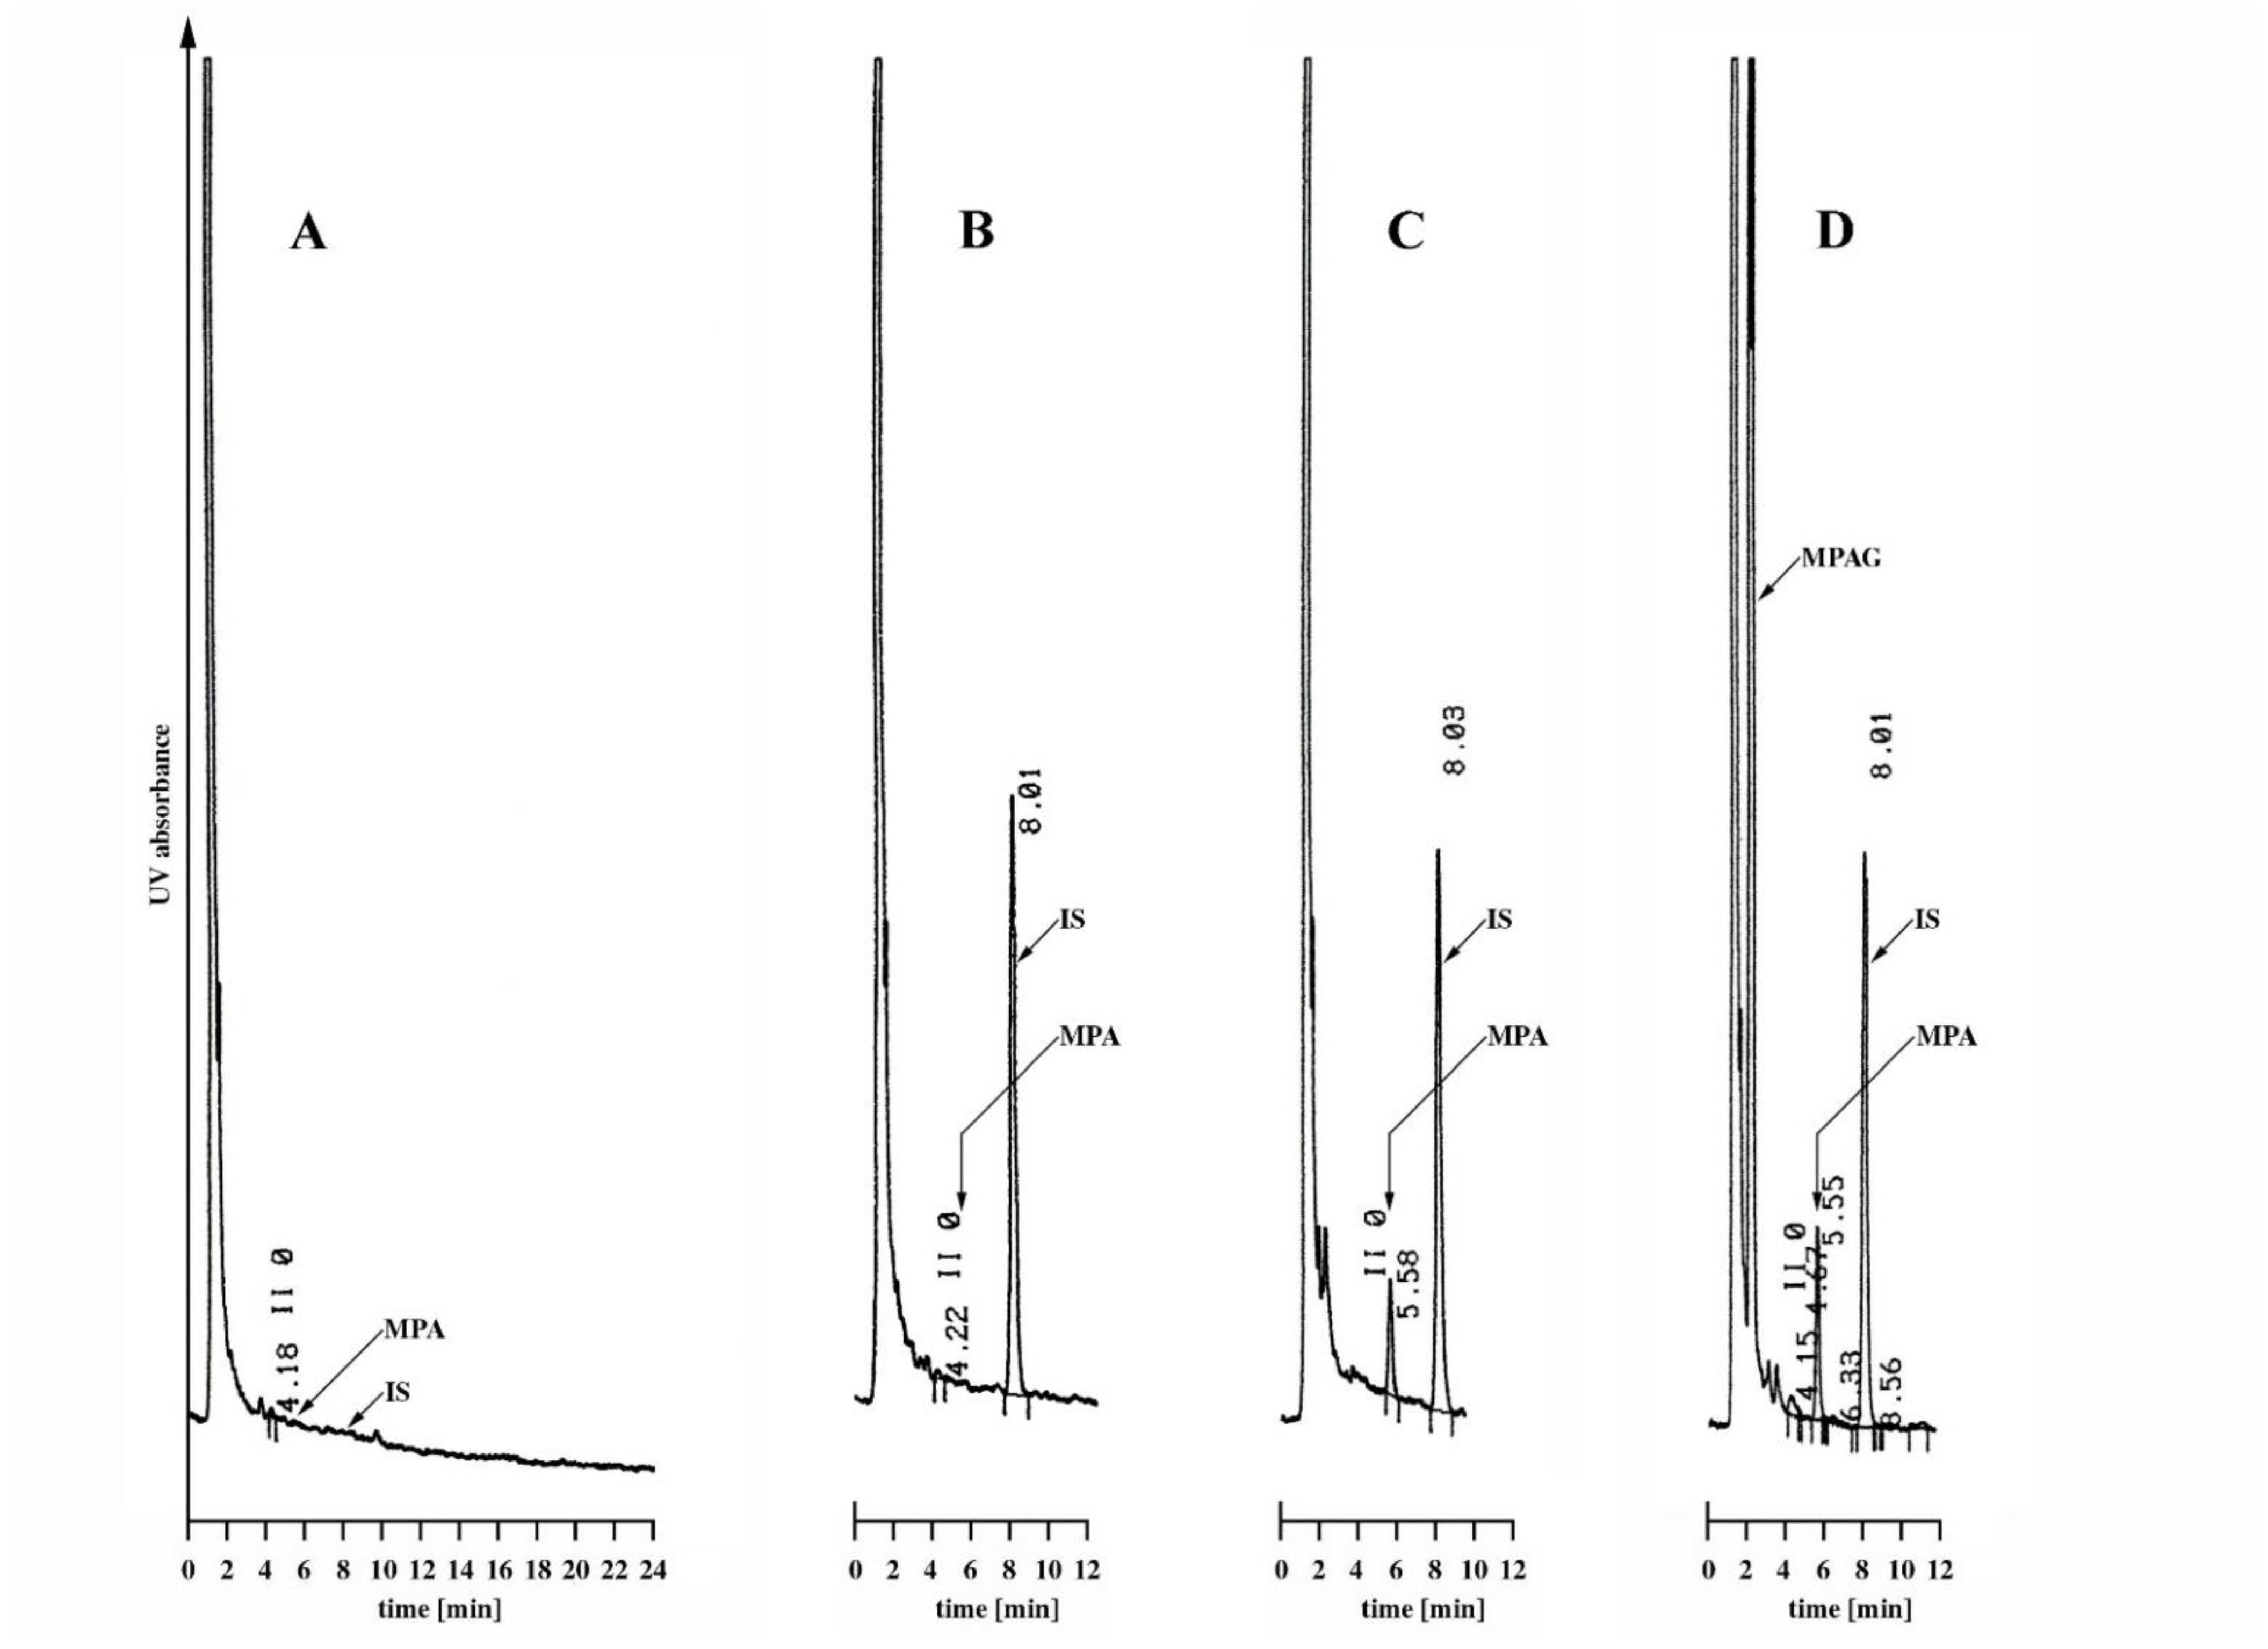
2.2.1. Specificity
2.2.2. Calibration and Linearity
2.2.3. Precision and Accuracy
2.2.4. Limit of Quantification, Range, and Carry-Over
2.3. Stability
2.3.1. Long-Term Stability
2.3.2. Freeze-Thaw Stability
2.3.3. Short-Term Stability
2.4. Comparison of the Measures for Internal and External Standardization
2.4.1. Validation Parameters
2.4.2. Stability Results
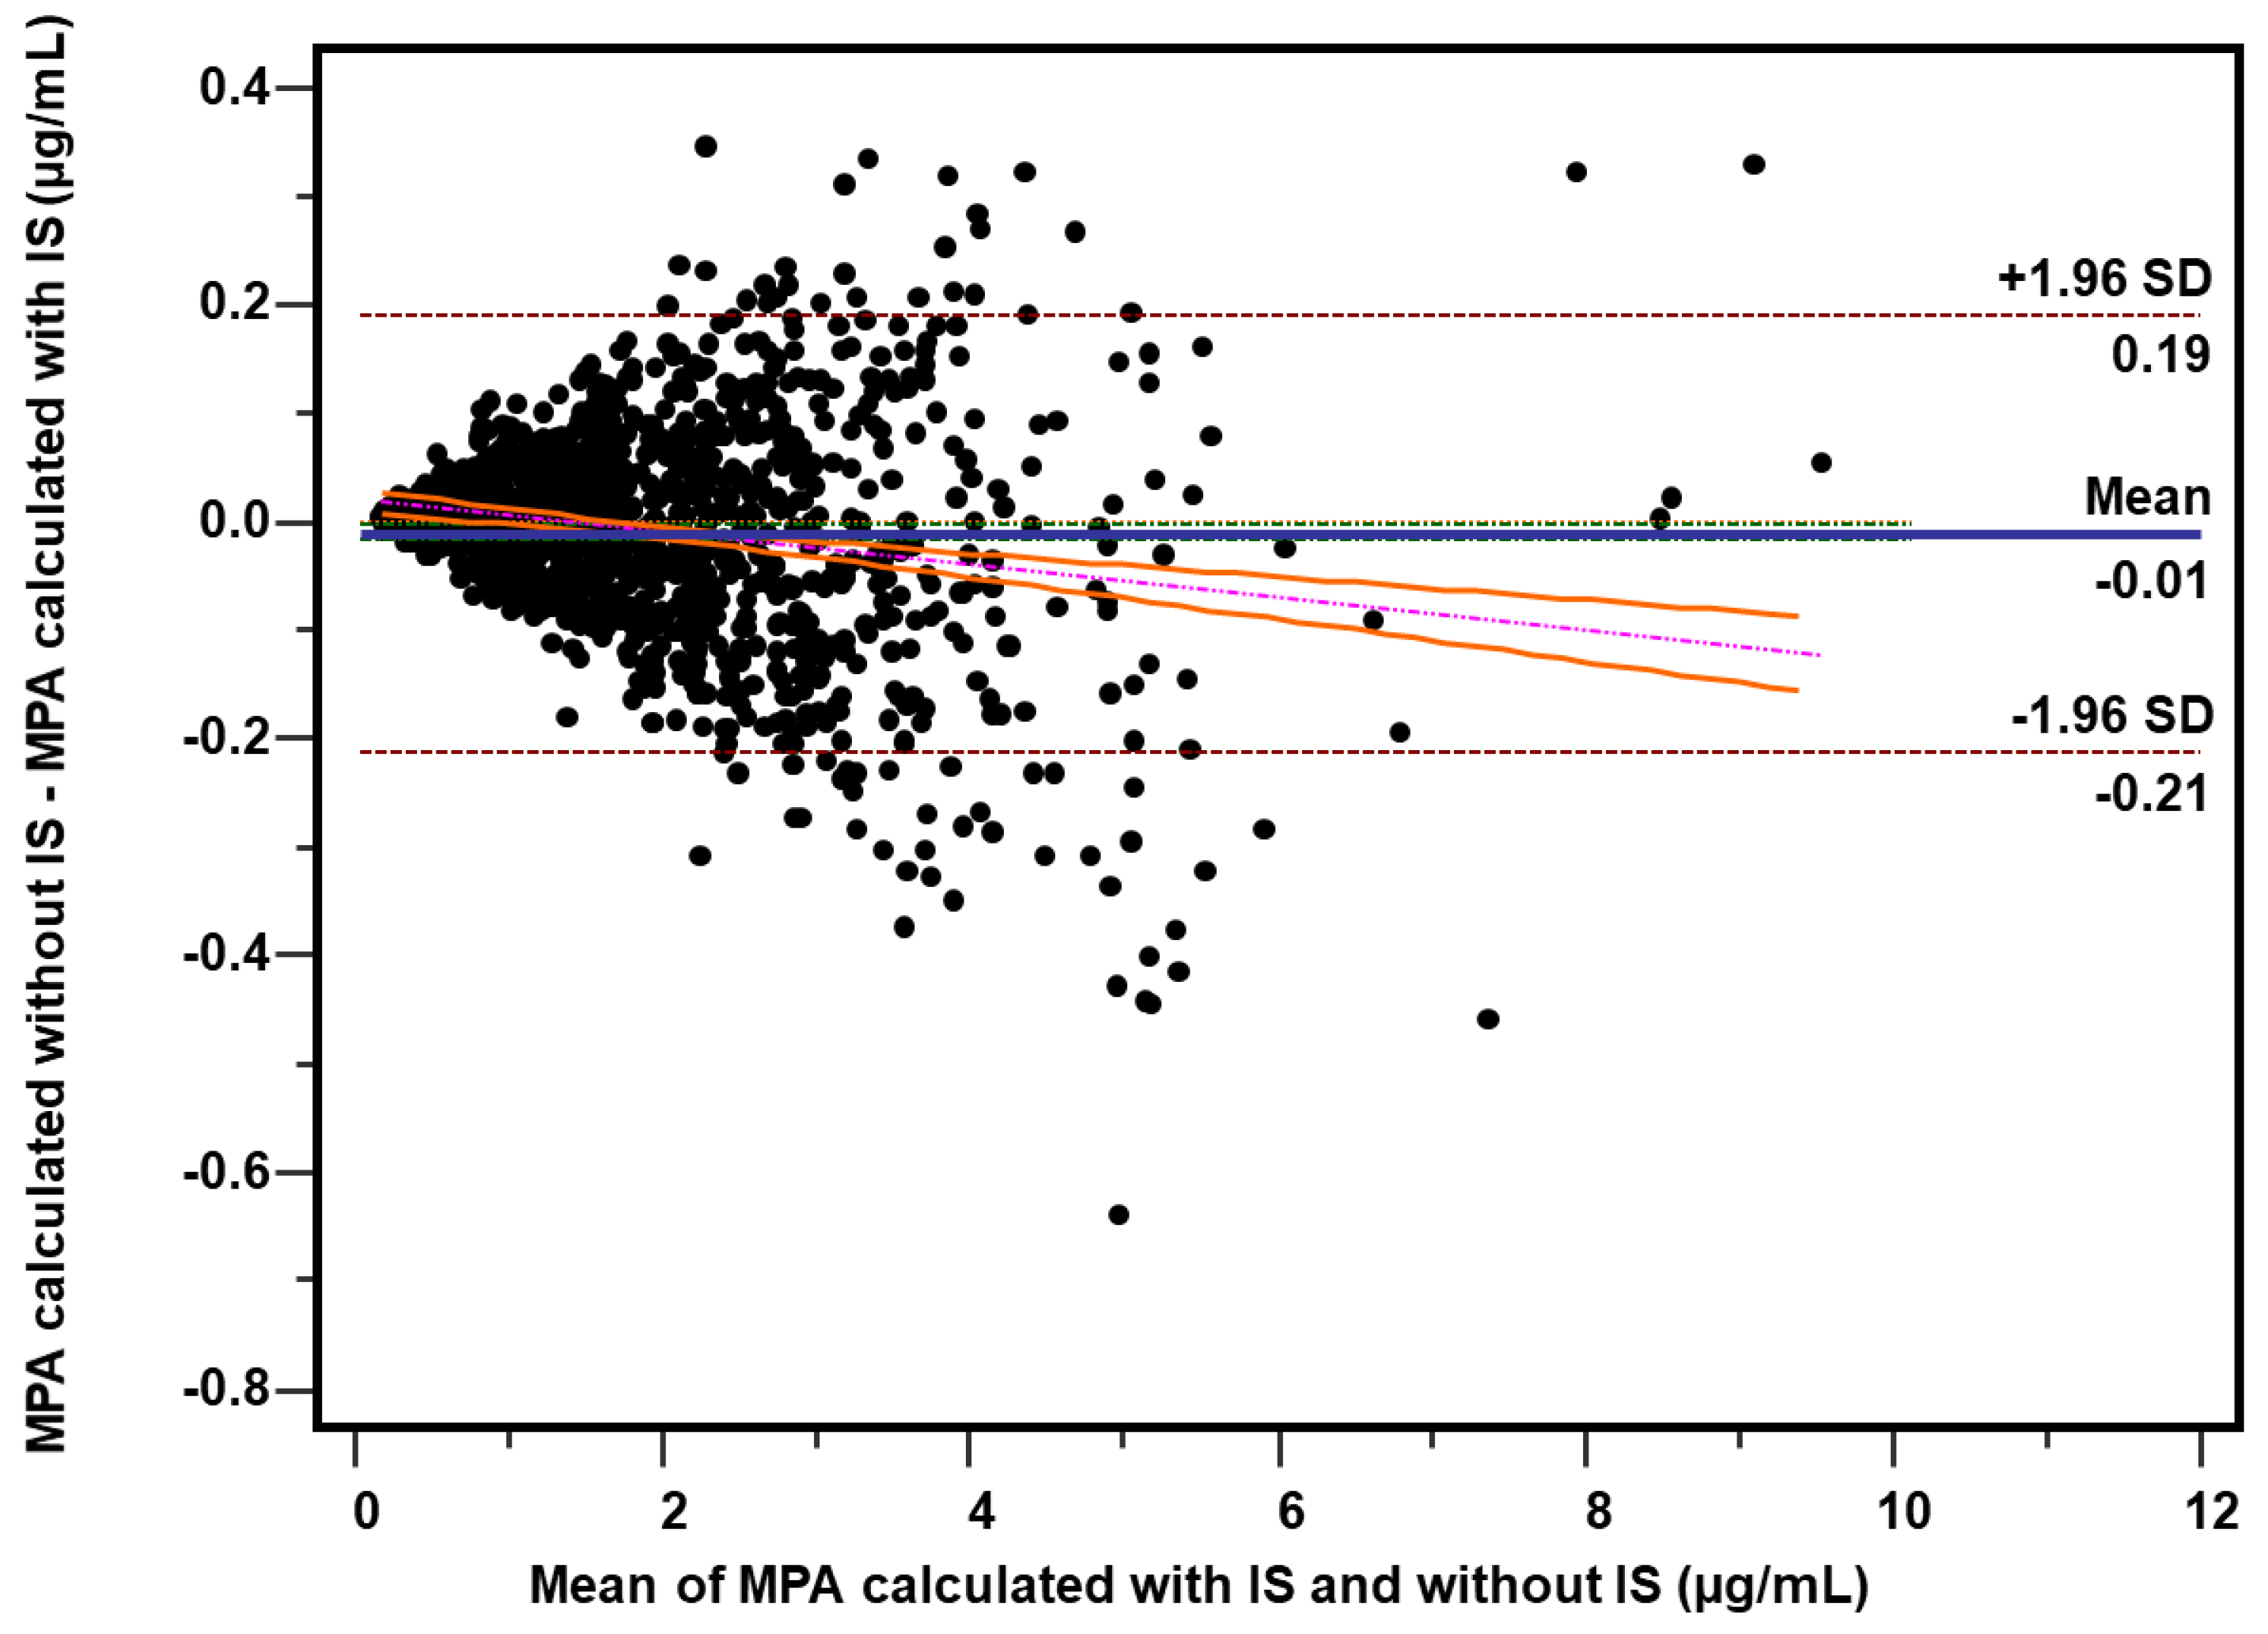
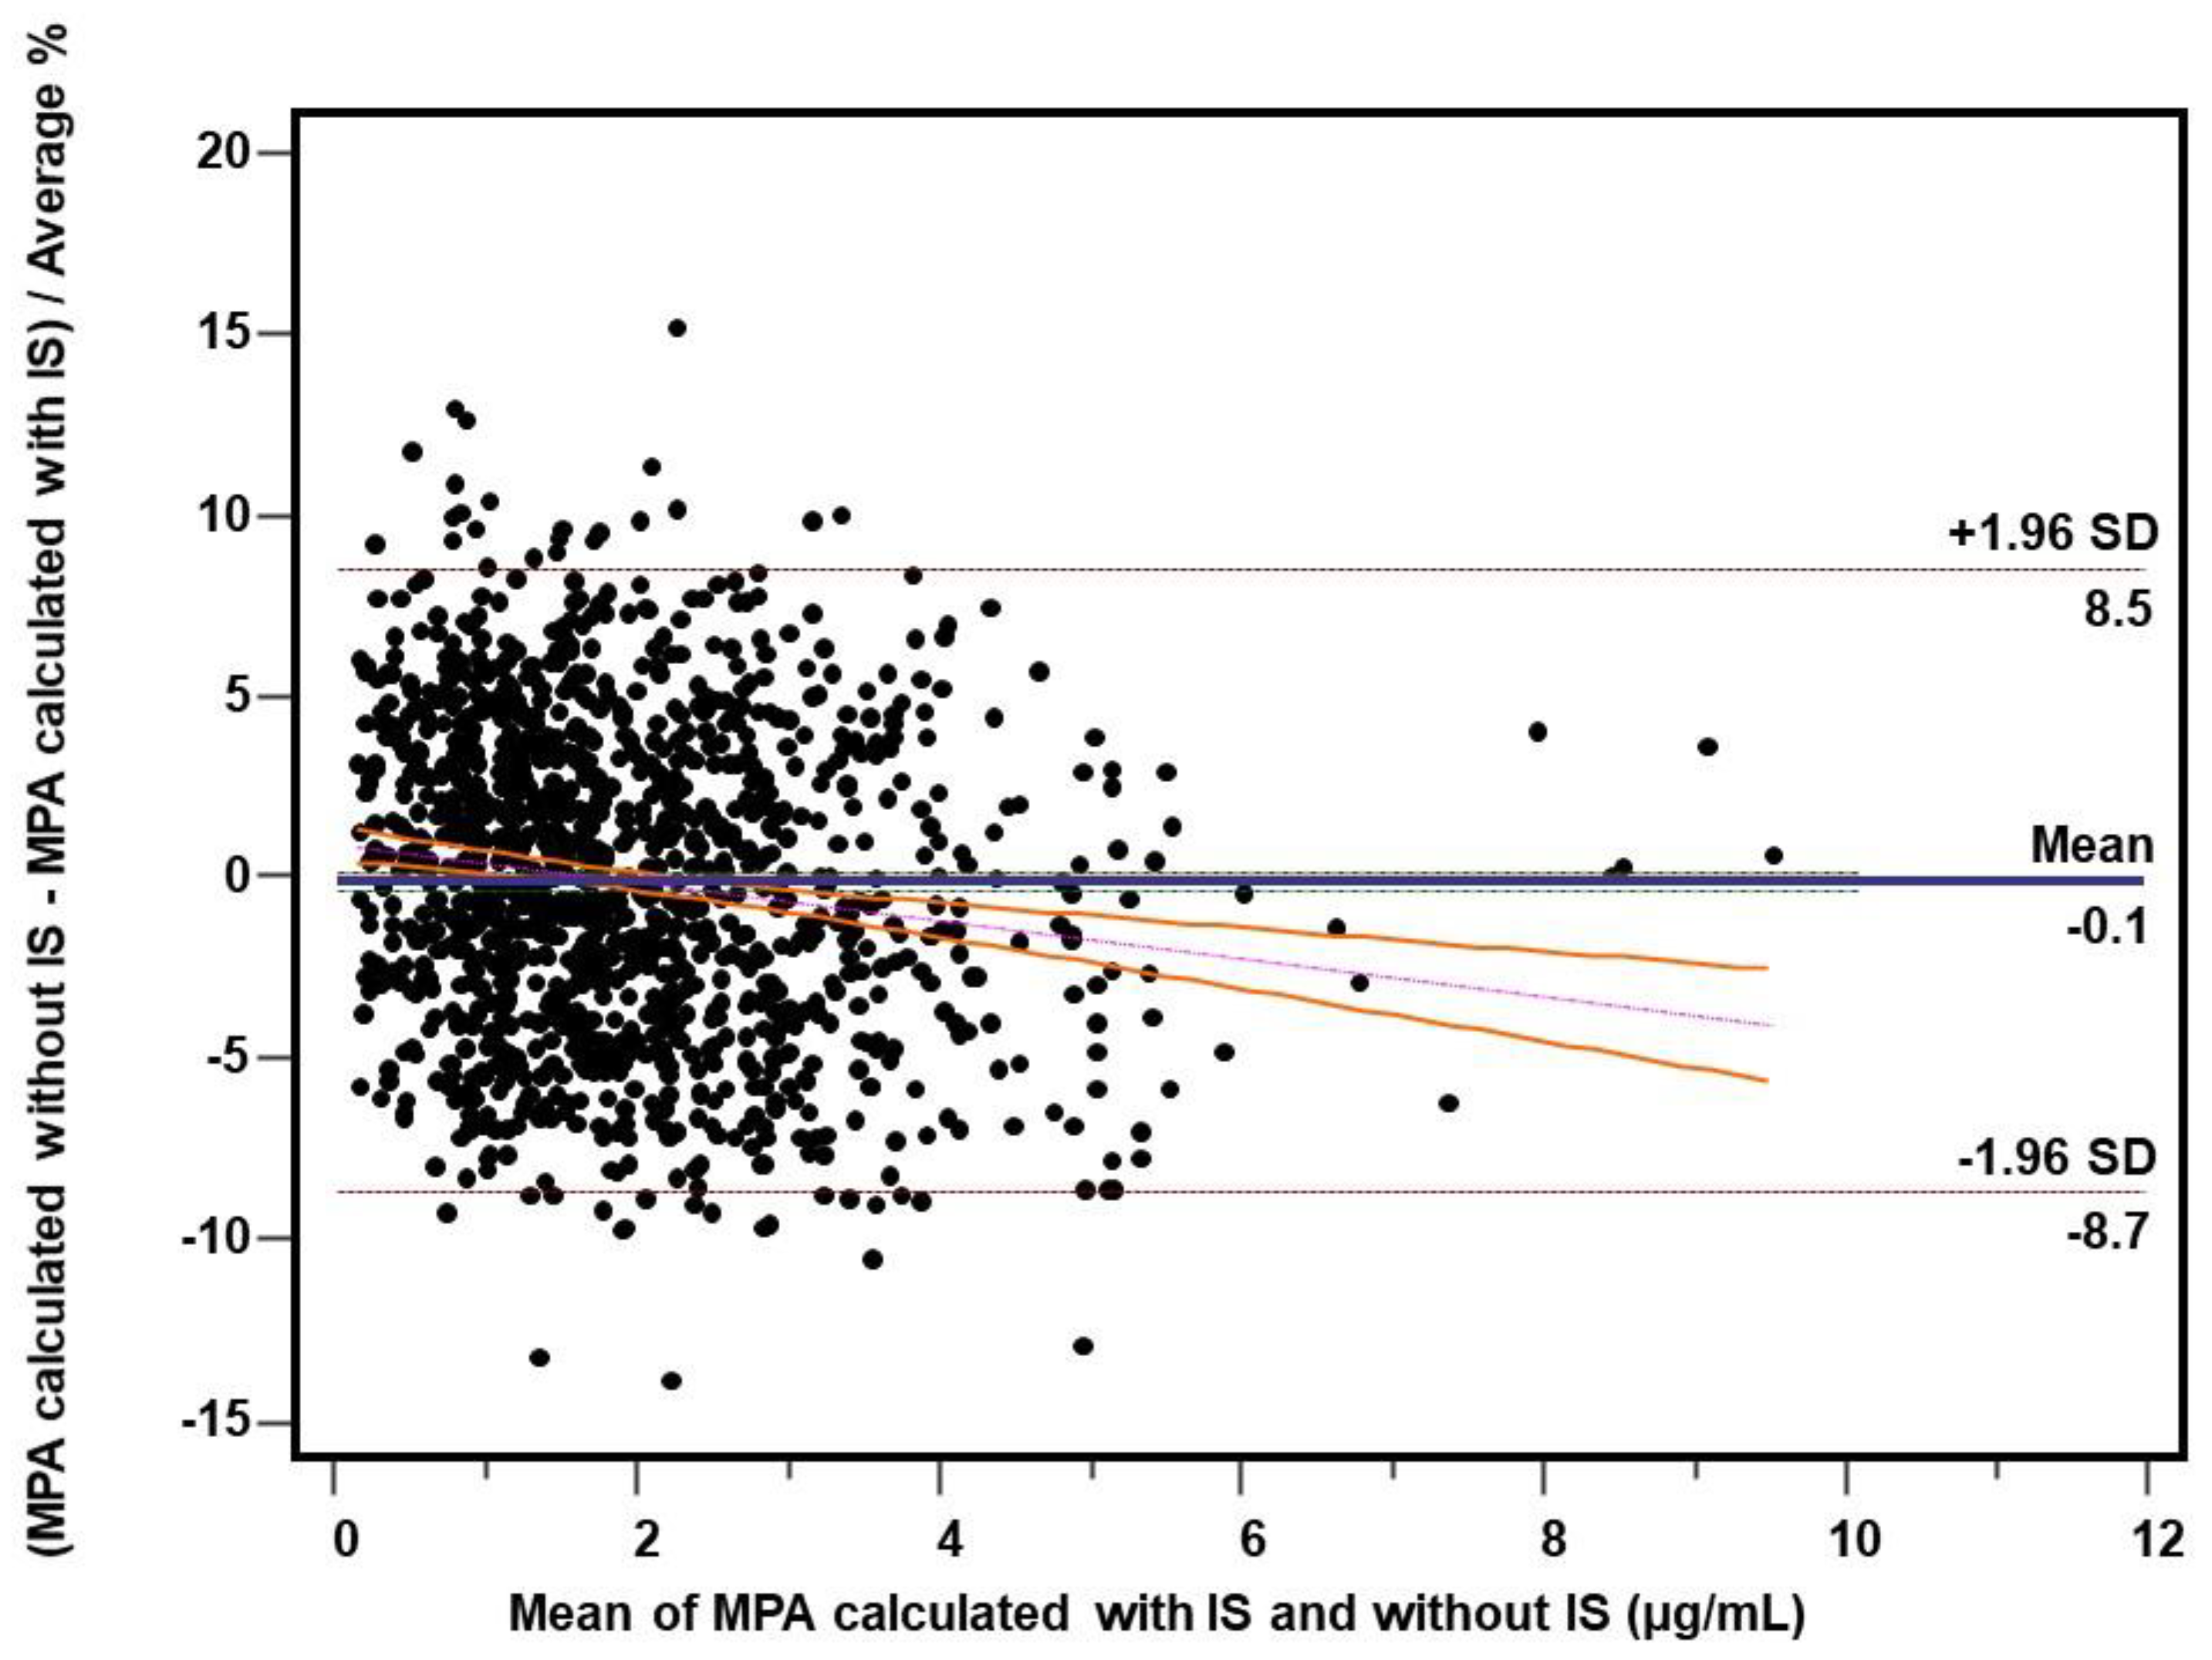
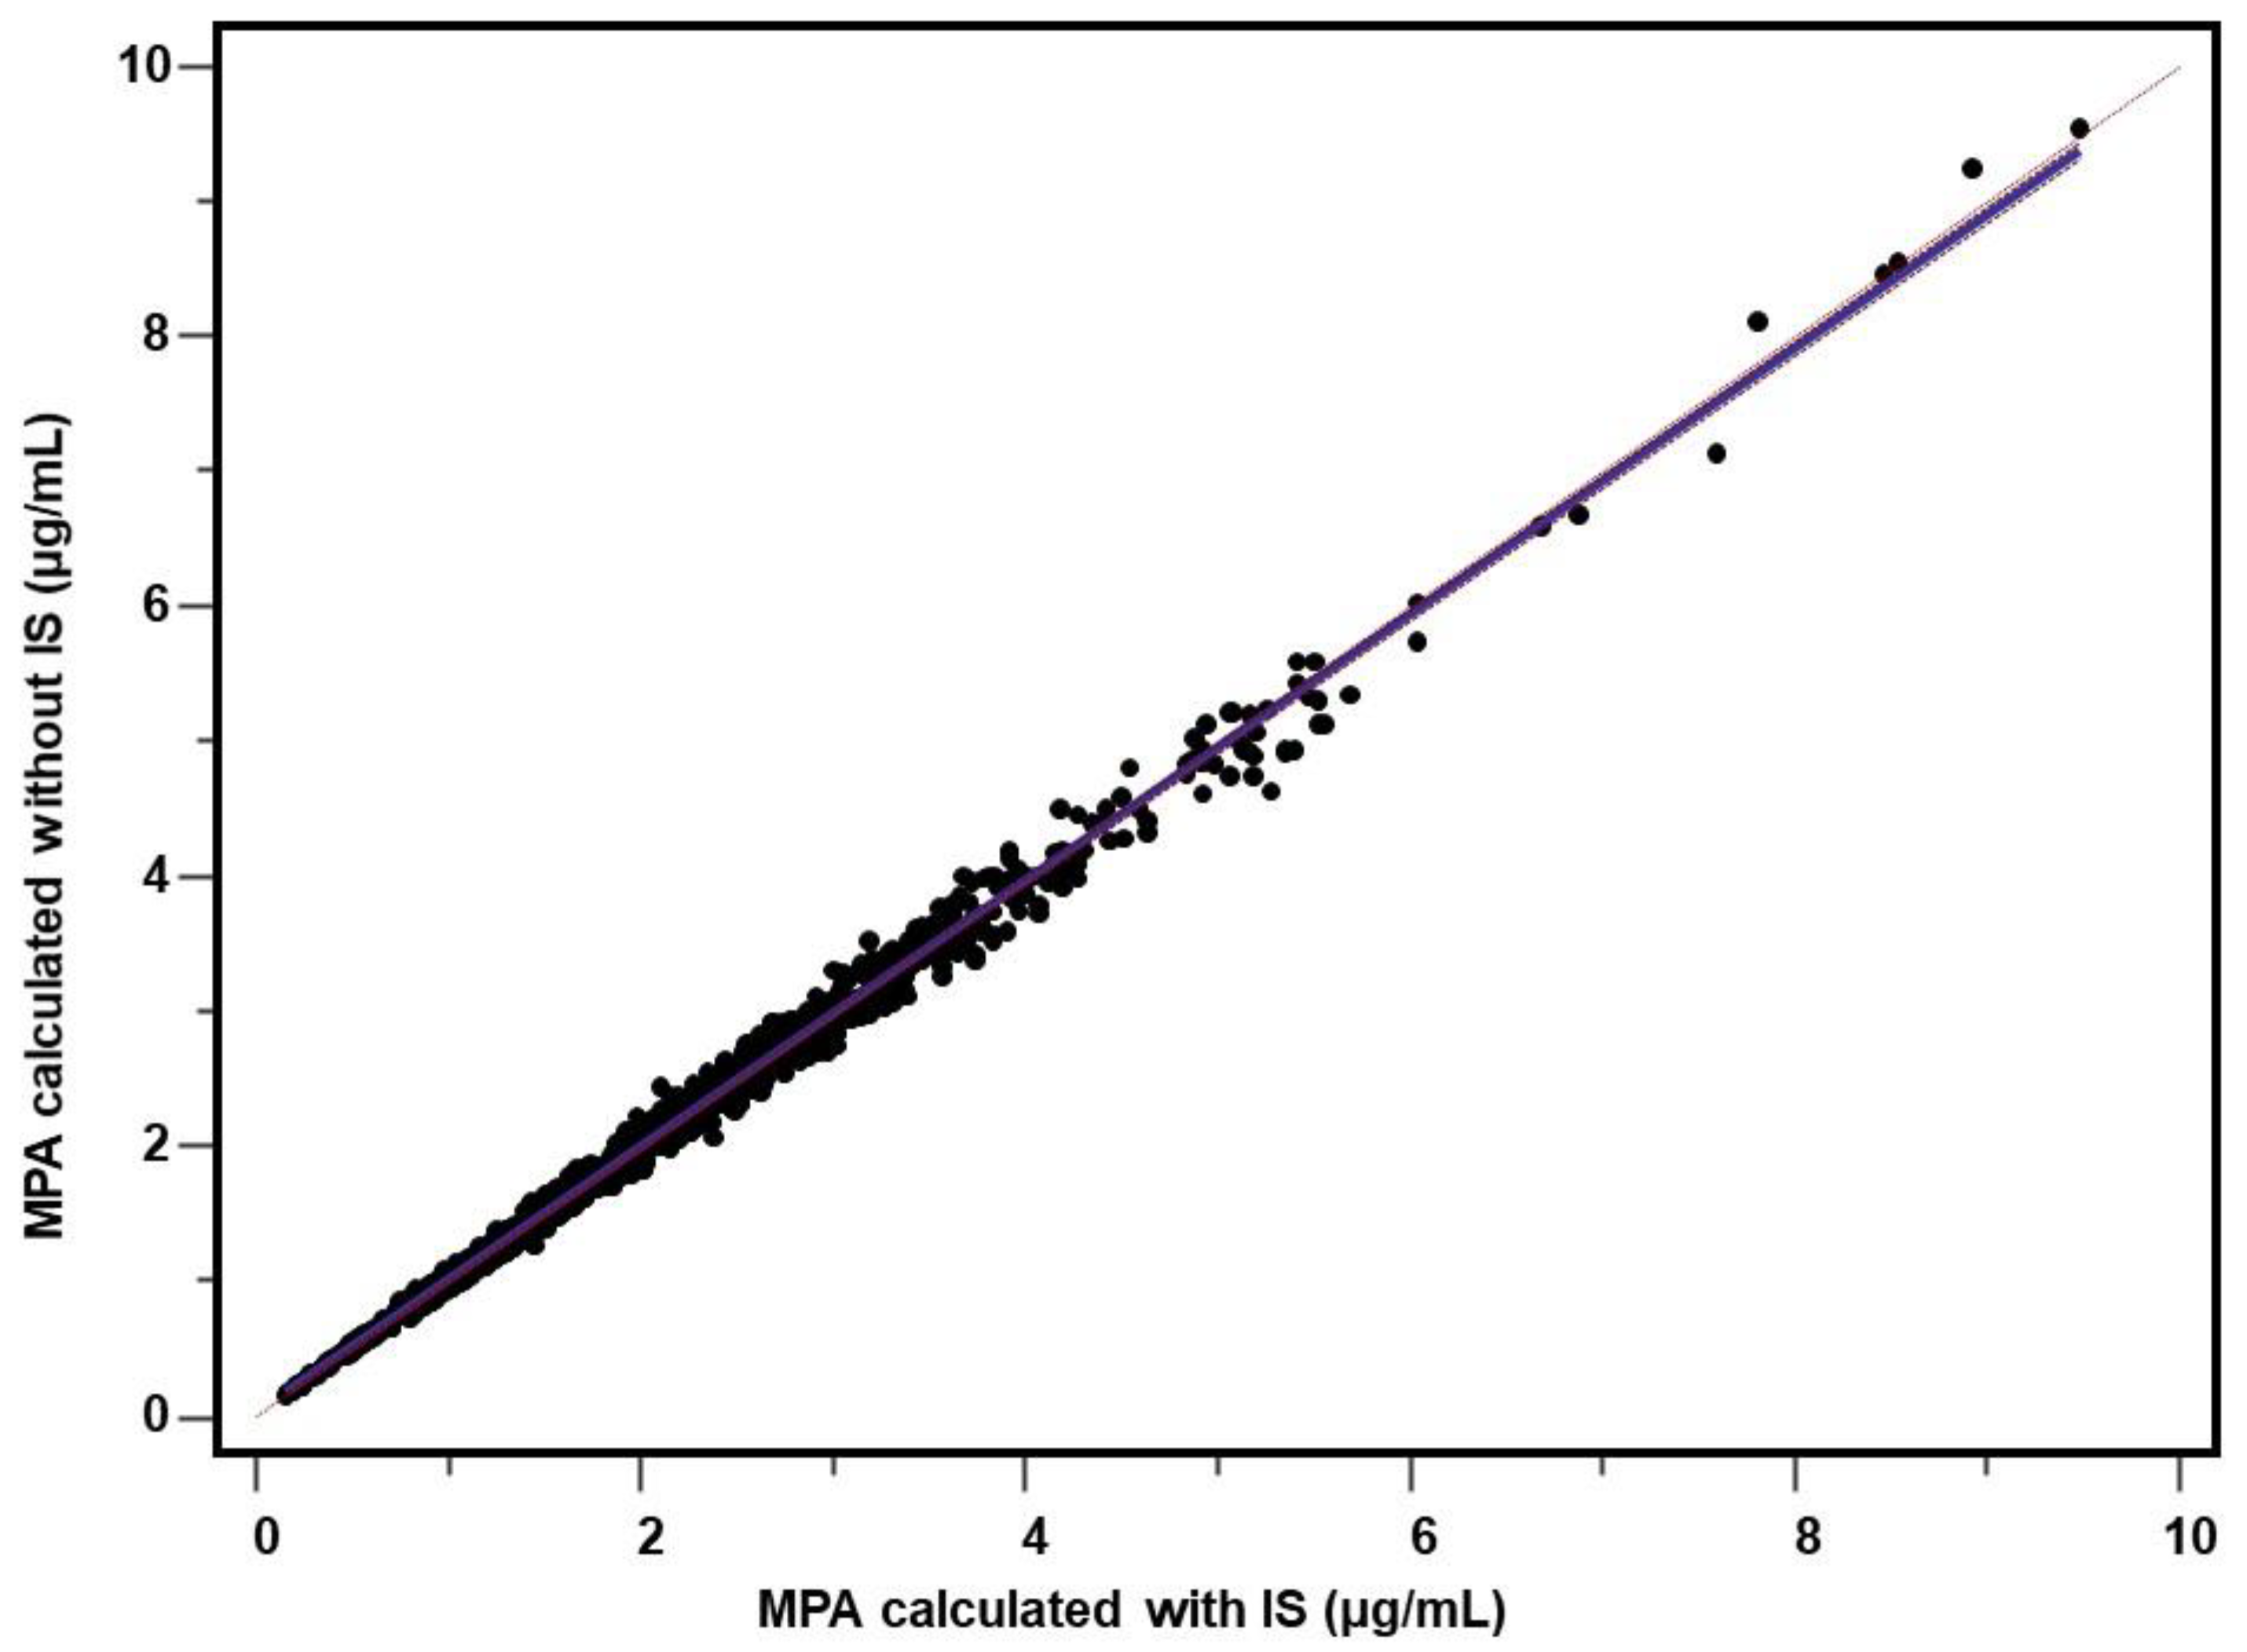
2.4.3. Patient’s Samples
2.4.4. Spiked Samples
3. Discussion
4. Materials and Methods
4.1. Chemicals
4.2. Instrumentation
4.3. Chromatographic Conditions
4.4. Stock and Working Solutions, Calibration, and Quality Controls
4.5. Sample Preparation
4.6. Method Validation
4.7. Stability
4.8. Internal and External Standardization
5. Conclusions
Author Contributions
Funding
Institutional Review Board Statement
Informed Consent Statement
Data Availability Statement
Acknowledgments
Conflicts of Interest
Sample Availability
References
- Shaw, L.M.; Korecka, M.; Venkataramanan, R.; Goldberg, L.; Bloom, R.; Brayman, K.L. Mycophenolic acid pharmacodynamics and pharmacokinetics provide a basis for rational monitoring strategies. Am. J. Transplant. 2003, 3, 534–542. [Google Scholar] [CrossRef]
- Dasgupta, A. Therapeutic Drug Monitoring of Mycophenolic Acid. Adv. Clin. Chem. 2016, 76, 165–184. [Google Scholar]
- Bergan, S.; Brunet, M.; Hesselink, D.A.; Johnson-Davis, K.L.; Kunicki, P.K.; Lemaitre, F.; Marquet, P.; Molinaro, M.; Noceti, O.; Pattanaik, S.; et al. Personalized Therapy for Mycophenolate: Consensus Report by the International Association of Therapeutic Drug Monitoring and Clinical Toxicology. Ther. Drug Monit. 2021, 43, 150–200. [Google Scholar] [CrossRef] [PubMed]
- van Gelder, T. Mycophenolate blood level monitoring: Recent progress. Am. J. Transplant. 2009, 9, 1495–1499. [Google Scholar] [CrossRef]
- Le Meur, Y.; Buchler, M.; Thierry, A.; Caillard, S.; Villemain, F.; Lavaud, S.; Etienne, I.; Westeel, P.F.; Hurault de Ligny, B.; Rostaing, L.; et al. Individualized mycophenolate mofetil dosing based on drug exposure significantly improves patient outcomes after renal transplantation. Am. J. Transplant. 2007, 7, 2496–2503. [Google Scholar] [CrossRef]
- Kunicki, P.K.; Pawiński, T.; Boczek, A.; Waś, J.; Bodnar-Broniarczyk, M. A comparison of the immunochemical methods, PETINIA and EMIT, with that of HPLC-UV for the routine monitoring of mycophenolic acid in heart transplant patients. Ther. Drug Monit. 2015, 37, 311–318. [Google Scholar] [CrossRef] [PubMed]
- Zhang, Y.; Zhang, R. Recent advances in analytical methods for the therapeutic drug monitoring of immunosuppressive drugs. Drug Test Anal. 2018, 10, 81–94. [Google Scholar] [CrossRef]
- Mika, A.; Stepnowski, P. Current methods of the analysis of immunosuppressive agents in clinical materials: A review. J. Pharm. Biomed. Anal. 2016, 127, 207–231. [Google Scholar] [CrossRef]
- Paal, M.; Habler, K.; Northoff, B.; Vogeser, M. Comparative routine therapeutic drug monitoring of mycophenolic acid in human plasma with HPLC-UV and isotope dilution LC-MS/MS. Clin. Lab. 2020, 66. [Google Scholar] [CrossRef]
- Zeng, L.; Nath, C.E.; Shaw, P.J.; Earl, J.W.; McLachlan, A.J. HPLC-UV assay for monitoring total and unbound mycophenolic acid concentrations in children. Biomed. Chromatogr. 2009, 23, 92–100. [Google Scholar] [CrossRef] [PubMed]
- Syed, M.; Srinivas, N.R. A comprehensive review of the published assays for the quantitation of the immunosuppressant drug mycophenolic acid and its glucuronidated metabolites in biological fluids. Biomed. Chromatogr. 2016. [Google Scholar] [CrossRef]
- Klepacki, J.; Klawitter, J.; Bendrick-Peart, J.; Schniedewind, B.; Heischmann, S.; Shokati, T.; Christians, U.; Klawitter, J. A high-throughput U-HPLC-MS/MS assay for the quantification of mycophenolic acid and its major metabolites mycophenolic acid glucuronide and mycophenolic acid acyl-glucuronide in human plasma and urine. J. Chromatogr. B 2012, 883–884, 113–119. [Google Scholar] [CrossRef] [PubMed]
- Benoit-Biancamano, M.O.; Caron, P.; Lévesque, E.; Delage, R.; Couture, F.; Guillemette, C. Sensitive high-performance liquid chromatography-tandem mass spectrometry method for quantitative analysis of mycophenolic acid and its glucuronide metabolites in human plasma and urine. J. Chromatogr. B 2007, 858, 159–167. [Google Scholar] [CrossRef]
- Brandhorst, G.; Streit, F.; Goetze, S.; Oellerich, M.; Armstrong, V.W. Quantification by liquid chromatography tandem mass spectrometry of mycophenolic acid and its phenol and acyl glucuronide metabolites. Clin. Chem. 2006, 52, 1962–1964. [Google Scholar] [CrossRef] [PubMed]
- Annesley, T.M.; Clayton, L.T. Quantification of mycophenolic acid and glucuronide metabolite in human serum by HPLC-tandem mass spectrometry. Clin. Chem. 2005, 51, 872–877. [Google Scholar] [CrossRef] [PubMed][Green Version]
- Prémaud, A.; Rousseau, A.; Le Meur, Y.; Lachâtre, G.; Marquet, P. Comparison of liquid chromatography-tandem mass spectrometry with a commercial enzyme-multiplied immunoassay for the determination of plasma MPA in renal transplant recipients and consequences for therapeutic drug monitoring. Ther. Drug Monit. 2004, 26, 609–619. [Google Scholar] [CrossRef] [PubMed]
- Ceglarek, U.; Casetta, B.; Lembcke, J.; Baumann, S.; Fiedler, G.M.; Thiery, J. Inclusion of MPA and in a rapid multi-drug LC-tandem mass spectrometric method for simultaneous determination of immunosuppressants. Clin. Chim. Acta 2006, 373, 168–171. [Google Scholar] [CrossRef] [PubMed]
- Buchwald, A.; Winkler, K.; Epting, T. Validation of an LC-MS/MS method to determine five immunosuppressants with deuterated internal standards including MPA. BMC Clin. Pharmacol. 2012, 12, 2. [Google Scholar] [CrossRef] [PubMed]
- Tszyrsznic, W.; Borowiec, A.; Pawlowska, E.; Jazwiec, R.; Zochowska, D.; Bartlomiejczyk, I.; Zegarska, J.; Paczek, L.; Dadlez, M. Two rapid ultra performance liquid chromatography/tandem mass spectrometry (UPLC/MS/MS) methods with common sample pretreatment for therapeutic drug monitoring of immunosuppressants compared to immunoassay. J. Chromatogr. B 2013, 928, 9–15. [Google Scholar] [CrossRef]
- Figurski, M.J.; Korecka, M.; Fields, L.; Waligórska, T.; Shaw, L.M. High-performance liquid chromatography-mass spectroscopy/mass spectroscopy method for simultaneous quantification of total or free fraction of mycophenolic acid and its glucuronide metabolites. Ther. Drug Monit. 2009, 31, 717–726. [Google Scholar] [CrossRef]
- Reséndiz-Galván, J.E.; Romano-Aguilar, M.; Medellín-Garibay, S.E.; Milán-Segovia, R.D.C.; Chevaile-Ramos, A.; Romano-Moreno, S. Determination of mycophenolic acid in human plasma by ultra-performance liquid chromatography-tandem mass spectrometry and its pharmacokinetic application in kidney transplant patients. Biomed. Chromatogr. 2019, 33, e4681. [Google Scholar] [CrossRef]
- Shen, J.; Jiao, Z.; Yu, Y.Q.; Zhang, M.; Zhong, M.K. Quantification of total and free mycophenolic acid in human plasma by liquid chromatography with fluorescence detection. J. Chromatogr. B 2005, 817, 207–213. [Google Scholar] [CrossRef]
- Hosotsubo, H.; Takahara, S.; Kokado, Y.; Permpongkosol, S.; Wang, J.D.; Tanaka, T.; Matsumiya, K.; Kitamura, M.; Okuyama, A.; Sugimoto, H. Rapid and simple determination of mycophenolic acid in human plasma by ion-pair RP-LC with fluorescence detection. J. Pharm. Biomed. Anal. 2001, 24, 555–560. [Google Scholar] [CrossRef]
- Indjova, D.; Kassabova, L.; Svinarov, D. Simultaneous determination of mycophenolic acid and its phenolic glucuronide in human plasma using an isocratic high-performance liquid chromatography procedure. J. Chromatogr. B 2005, 817, 327–330. [Google Scholar] [CrossRef]
- Patel, C.G.; Akhlaghi, F. High-performance liquid chromatography method for the determination of mycophenolic acid and its acyl and phenol glucuronide metabolites in human plasma. Ther. Drug Monit. 2006, 28, 116–122. [Google Scholar] [CrossRef] [PubMed]
- Tsina, I.; Chu, F.; Hama, K.; Kaloostian, M.; Tam, Y.L.; Tarnowski, T.; Wong, B. Manual and automated (robotic) high-performance liquid chromatography methods for the determination of mycophenolic acid and its glucuronide conjugate in human plasma. J. Chromatogr. B 1996, 675, 119–129. [Google Scholar]
- Barzoki, M.A.; Rouini, M.; Gholami, K.; Lessan-Pezeshki, M.; Rezaee, S. Determination of mycophenolic acid in human plasma by high-performance liquid chromatography. DARU J. Pharm. Sci. 2005, 13, 120–126. [Google Scholar]
- Khoschsorur, G.; Erwa, W. Liquid chromatographic method for simultaneous determination of mycophenolic acid and its phenol- and acylglucuronide metabolites in plasma. J. Chromatogr. B 2004, 799, 355–360. [Google Scholar] [CrossRef]
- Svensson, J.O.; Brattström, C.; Säwe, J. A simple HPLC method for simultaneous determination of mycophenolic acid and mycophenolic acid glucuronide in plasma. Ther. Drug Monit. 1999, 21, 322–324. [Google Scholar] [CrossRef]
- Pastore, A.; Lo Russo, A.; Piemonte, F.; Mannucci, L.; Federici, G. Rapid determination of mycophenolic acid in plasma by reversed phase high-performance liquid chromatography. J. Chromatogr. B 2002, 776, 251–254. [Google Scholar] [CrossRef]
- Westley, I.S.; Sallustio, B.C.; Morris, R.G. Validation of a high-performance liquid chromatography method for the measurement of mycophenolic acid and its glucuronide metabolites in plasma. Clin. Biochem. 2005, 38, 824–829. [Google Scholar] [CrossRef]
- Elbarbry, F.A.; Shoker, A. Simple high performance liquid chromatographic assay for mycophenolic acid in renal transplant patients. J. Pharm. Biomed. Anal. 2007, 43, 788–792. [Google Scholar] [CrossRef]
- Jones, C.E.; Taylor, P.J.; Johnson, A.G. High-performance liquid chromatography determination of mycophenolic acid and its glucuronide metabolite in human plasma. J. Chromatogr. B 1998, 708, 229–234. [Google Scholar] [CrossRef]
- Wiwattanawongsa, K.; Heinzen, E.L.; Kemp, D.C.; Dupuis, R.E.; Smith, P.C. Determination of mycophenolic acid and its phenol glucuronide metabolite in human plasma and urine by high-performance liquid chromatography. J. Chromatogr. B 2001, 763, 35–45. [Google Scholar] [CrossRef]
- Daurel-Receveur, M.; Titier, K.; Picard, S.; Ducint, D.; Moore, N.; Molimard, M. Fully automated analytical method for mycophenolic acid quantification in human plasma using on-line solid phase extraction and high performance liquid chromatography with diode array detection. Ther. Drug Monit. 2006, 28, 505–511. [Google Scholar] [CrossRef]
- Elbarbry, F.A.; Shoker, A.S. Liquid chromatographic determination of mycophenolic acid and its metabolites in human kidney transplant plasma: Pharmacokinetic application. J. Chromatogr. B 2007, 859, 276–281. [Google Scholar] [CrossRef]
- Shipkova, M.; Niedmann, P.D.; Armstrong, V.W.; Schütz, E.; Wieland, E.; Shaw, L.M.; Oellerich, M. Simultaneous determination of mycophenolic acid and its glucuronide in human plasma using a simple high-performance liquid chromatography procedure. J. Clin. Chem. 1998, 44, 1481–1488. [Google Scholar] [CrossRef]
- Watson, D.G.; Araya, F.G.; Galloway, P.J.; Beattie, T.J. Development of a high pressure liquid chromatography method for the determination of mycophenolic acid and its glucuronide metabolite in small volumes of plasma from paediatric patients. J. Pharm. Biomed. Anal. 2004, 35, 87–92. [Google Scholar] [CrossRef]
- Li, S.; Yatscoff, R.W. Improved high-performance chromatographic assay for the measurement of mycophenolic acid in human plasma. Transplant. Proc. 1996, 28, 938–940. [Google Scholar] [PubMed]
- Huang, J.J.Z.; Kiang, H.; Tarnowski, T.L. Simultaneous determination of mycophenolic acid and its glucuronide conjugate in human plasma by a single-run ion-paring method. J. Chromatogr. B 1997, 698, 293–300. [Google Scholar] [CrossRef]
- Hosotsubo, H.; Takahara, S.; Kokado, Y.; Permpongkosol, S.; Wang, J.D.; Tanaka, T.; Matsumiya, K.; Kitamura, M.; Okuyama, A.; Sugimoto, H. Rapid and simultaneous determination of mycophenolic acid and its glucuronide conjugate in human plasma by ion-pair reversed-phase high-performance liquid chromatography using isocratic elution. J. Chromatogr. B 2001, 753, 315–320. [Google Scholar] [CrossRef]
- Chen, B.; Zhang, W.; Yu, Z.; Cai, W. Determination of mycophenolic acid (MPA) and its acyl and phenol glucuronide metabolits simultaneously in human plasma by a simplified HPLC method. Anal. Lett. 2007, 40, 2465–2475. [Google Scholar] [CrossRef]
- Srivatsan, V.; Dasgupta, A.K.; Kale, P.; Verma, R.; Joshi, P.; Soni, D.; Patel, M.; Soni, G.; Patel, J.; Modi, H. Determination of mycophenolic acid in human plasma by high-performance liquid chromatography. J. Chromatogr. A 2004, 1031, 259–264. [Google Scholar] [CrossRef]
- Shaw, L.M.; Korecka, M.; van Breeman, R.; Nowak, I.; Brayman, K.L. Analysis, pharmacokinetics and therapeutic drug monitoring of mycophenolic acid. Clin. Biochem. 1998, 31, 323–328. [Google Scholar] [CrossRef]
- Mino, Y.; Naito, T.; Matsushita, T.; Kagawa, Y.; Kawakami, J. Simultaneous determination of mycophenolic acid and its glucuronides in human plasma using isocratic ion pair high-performance liquid chromatography. J. Pharm. Biomed. Anal. 2008, 46, 603–608. [Google Scholar] [CrossRef] [PubMed]
- Bahrami, G.; Mohammadi, B. An isocratic high performance liquid chromatographic method for quantification of mycophenolic acid and its glucuronide metabolite in human serum using liquid-liquid extraction: Application to human pharmacokinetic studies. Clin. Chim. Acta 2006, 370, 185–190. [Google Scholar] [CrossRef] [PubMed]
- Yau, W.P.; Vathsala, A.; Lou, H.X.; Chan, E. Simple reversed-phase ion-pair liquid chromatography assay for the simultaneous determination of mycophenolic acid and its glucuronide metabolite in human plasma and urine. J. Chromatogr. B 2004, 805, 101–112. [Google Scholar] [CrossRef]
- Musuamba, F.T.; Di Fazio, V.; Vanbinst, R.; Wallemacq, P. A fast ultra-performance liquid chromatography method for simultaneous quantification of mycophenolic acid and its phenol- and acyl-glucuronides in human plasma. Ther. Drug Monit. 2009, 31, 110–115. [Google Scholar] [CrossRef] [PubMed]
- Sugioka, N.; Odani, H.; Ohta, T.; Kishimoto, H.; Yasumura, T.; Takada, K. Determination of a new immunosuppressant, mycophenolate mofetil, and its active metabolite, mycophenolic acid, in rat and human body fluids by high-performance liquid chromatography. J. Chromatogr. B 1994, 654, 249–256. [Google Scholar] [CrossRef]
- Rissling, O.; Bauer, S.; Shipkova, M.; Glander, P.; Mai, M.; Hambach, P.; Budde, K. Simultaneous determination of mycophenolate and its metabolite mycophenolate-7-o-glucuronide with an isocratic HPLC-UV-based method in human plasma and stability evaluation. Scand. J. Clin. Lab. Investig. 2016, 76, 612–619. [Google Scholar] [CrossRef]
- Guideline on Bioanalytical Method Validation. EMEA/CHMP/EWP/192217/2009 Rev.1 Corr.2. European Medicines Agency. 2011. Available online: https://www.ema.europa.eu/en/documents/scientific-guideline/guideline-bioanalytical-method-validation_en.pdf (accessed on 11 September 2021).
- Bioanalytical Method Validation Guidance for Industry. U.S. Department of Health and Human Services Food and Drug Administration Center for Drug Evaluation and Research (CDER) Center for Veterinary Medicine (CVM) May 2018. Available online: https://www.fda.gov/files/drugs/published/Bioanalytical-Method-Validation-Guidance-for-Industry.pdf (accessed on 11 September 2021).
- Seger, C.; Shipkova, M.; Christians, U.; Billaud, E.M.; Wang, P.; Holt, D.W.; Brunet, M.; Kunicki, P.K.; Pawiński, T.; Langman, L.; et al. Assuring the proper analytical performance of measurement procedures for immunosuppressive drug concentrations in clinical practice: Recommendations of the IATDMCT Immunosuppressive Drugs Scientific Committee. Ther. Drug Monit. 2016, 38, 170–189. [Google Scholar] [CrossRef] [PubMed]
- Srinivas, N.R. Should commonly prescribed drugs be avoided as internal standard choices in new assays for clinical samples? Bioanalysis 2016, 8, 607–610. [Google Scholar] [CrossRef]
- Dewitte, K.; Fierens, C.; Stöckl, D.; Thienpont, L.M. Application of the Bland-Altman plot for interpretation of method-comparison studies: A critical investigation of its practice. Clin. Chem. 2002, 48, 799–801. [Google Scholar] [CrossRef] [PubMed]
- Altman, D.G.; Bland, J.M. Commentary on quantifying agreement between two methods of measurement. Clin. Chem. 2002, 48, 801–802. [Google Scholar] [CrossRef]


| MPA Concentration Added (µg/mL) | INTRA-ASSAY | INTER-ASSAY | ||||
|---|---|---|---|---|---|---|
| Concentration Determined (Mean ± SD) (µg/mL) | Imprecision (RSD) (%) | Inaccuracy (%) | Concentration Determined (Mean ± SD) (µg/mL) | Imprecision (RSD) (%) | Inaccuracy (%) | |
| 0.1 (LLOQ) | 0.115 ± 0.008 0.114 ± 0.010 | 6.63 8.42 | +15.40 +14.30 | 0.119 ± 0.003 0.119 ± 0.004 | 2.62 3.32 | +19.00 +18.72 |
| 0.3 (QC-L) | - | - | - | 0.316 ± 0.010 0.307 ± 0.019 | 3.02 6.09 | +5.31 +2.27 |
| 0.5 | 0.504 ± 0.036 0.482 ± 0.035 | 7.06 7.27 | +0.86 −3.59 | 0.482 ± 0.020 0.479 ± 0.008 | 4.12 1.58 | −3.63 −4.12 |
| 1 | 0.943 ± 0.026 0.980 ± 0.028 | 2.79 2.86 | −5.72 −2.05 | 0.912 ± 0.047 0.922 ± 0.047 | 5.15 5.14 | −8.82 −7.81 |
| 2 | 1.898 ± 0.034 1.971 ± 0.042 | 1.82 2.11 | −5.09 −1.47 | 1.837 ± 0.077 1.856 ± 0.091 | 4.17 4.89 | −8.15 −7.20 |
| 4 (QC-M) | - | - | - | 3.832 ± 0.121 3.781 ± 0.121 | 3.17 3.20 | −4.21 −5.47 |
| 5 | 4.875 ± 0.113 4.929 ± 0.044 | 2.31 0.90 | −2.51 −1.42 | 4.848 ± 0.112 4.855 ± 0.101 | 2.31 2.07 | −3.03 −2.90 |
| 10 | 9.735 ± 0.094 9.961 ± 0.150 | 0.97 1.51 | −2.65 −0.39 | 9.882 ± 0.302 9.858 ± 0.076 | 3.06 0.77 | −1.18 −1.42 |
| 20 | 19.708 ± 0.501 19.918 ± 0.449 | 2.54 2.26 | −1.46 −0.41 | 20.054 ± 0.530 20.061 ± 0.096 | 2.64 0.48 | +0.27 +0.30 |
| 25 (QC-H) | - | - | - | 25.299 ± 0.658 24.702 ± 0.516 | 2.60 2.09 | +1.20 −1.19 |
| 40 (ULOQ) | 41.184 ± 0.852 40.884 ± 0.451 | 2.07 1.10 | +2.96 +2.21 | 40.424 ± 0.774 40.448 ± 0.415 | 1.92 1.03 | +1.06 +1.12 |
| Storage Time at −24 °C (Weeks) | Low Concentration Calculated with and without IS (Mean ± SD) (µg/mL) | Stability for Low Concentration Calculated with and without IS (%) | High Concentration Calculated with and without IS (Mean ± SD) (µg/mL) | Stability for High Concentration Calculated with and without IS (%) |
|---|---|---|---|---|
| 0 (initial) | 1.135 ± 0.052 1.142 ± 0.034 | 100.00 100.00 | 24.492 ± 0.693 25.211 ± 0.692 | 100.00 100.00 |
| 1 | 1.166 ± 0.011 1.185 ± 0.019 | 102.80 103.77 | 24.487 ± 0.376 24.515 ± 0.447 | 99.98 97.24 |
| 2 | 1.132 ± 0.053 1.149 ± 0.025 | 99.74 100.61 | 23.874 ± 0.817 25.080 ± 0.580 | 97.47 99.48 |
| 3 | 1.294 ± 0.032 1.195 ± 0.017 | 114.07 104.69 | 25.797 ± 0.424 24.894 ± 0.909 | 105.33 98.74 |
| 4 | 1.169 ± 0.013 1.125 ± 0.018 | 103.03 98.57 | 25.248 ± 0.314 24.518 ± 0.341 | 103.08 97.25 |
| 5 | 1.297 ± 0.059 1.198 ± 0.061 | 114.31 104.95 | 25.506 ± 0.408 24.828 ± 0.421 | 104.14 98.48 |
| 6 | 1.276 ± 0.028 1.211 ± 0.039 | 112.46 106.07 | 26.161 ± 1.380 25.397 ± 0.790 | 106.81 100.74 |
| Cycle/Storage Time (hours) | Low Concentration Calculated with and without IS (Mean ± SD) (µg/mL) | Stability for Low Concentration Calculated with and without IS (%) | High Concentration Calculated with and without IS (Mean ± SD) (µg/mL) | Stability for High Concentration Calculated with and without IS (%) |
|---|---|---|---|---|
| 0 (initial) | 1.334 ± 0.031 1.282 ± 0.037 | 100.00 100.00 | 26.504 ± 0.633 25.290 ± 0.802 | 100.00 100.00 |
| 72 | 1.320 ± 0.016 1.256 ± 0.038 | 98.93 98.00 | 26.518 ± 0.501 25.309 ± 0.576 | 100.05 100.07 |
| 144 | 1.301 ± 0.013 1.248 ± 0.043 | 97.51 97.30 | 26.028 ± 1.100 25.581 ± 1.028 | 98.21 101.15 |
| 216 | 1.221 ± 0.038 1.276 ± 0.061 | 91.48 99.55 | 24.399 ± 0.841 26.072 ± 0.904 | 92.06 103.09 |
| Procedure Description | Low Concentration Calculated with and without IS (Mean ± SD) (µg/mL) | Stability for Low Concentration Calculated with and without IS (%) | High Concentration Calculated with and without IS (Mean ± SD) (µg/mL) | Stability for High Concentration Calculated with and without IS (%) |
|---|---|---|---|---|
| Standard analytical procedure | 1.227 ± 0.070 1.196 ± 0.015 | 100.00 100.00 | 24.637 ± 0.796 25.209 ± 0.434 | 100.00 100.00 |
| Supernatant stability | 1.201 ± 0.049 1.199 ± 0.024 | 97.83 100.25 | 24.883 ± 0.567 24.991 ± 0.541 | 101.00 99.14 |
| Dried extract stability | 1.197 ± 0.029 1.212 ± 0.045 | 97.54 101.32 | 24.416 ± 0.808 24.881 ± 0.747 | 99.11 98.70 |
| Reconstituted sample stability | 1.239 ± 0.013 1.205 ± 0.047 | 100.93 100.76 | 25.634 ± 1.211 25.256 ± 0.594 | 104.05 100.19 |
| Parameter | MPA Concentration Calculated with IS (µg/mL) | MPA Concentration Calculated without IS (µg/mL) |
|---|---|---|
| Range | 0.16–9.49 | 0.16–9.54 |
| Mean ± SD | 1.99 ± 1.24 | 1.98 ± 1.22 |
| Median | 1.73 | 1.72 |
| Parameter | Spiked Low MPA Concentration Calculated with IS (µg/mL) | Spiked Low MPA Concentration Calculated without IS (µg/mL) | Spiked High MPA Concentration Calculated with IS (µg/mL) | Spiked High MPA Concentration Calculated without IS (µg/mL) |
|---|---|---|---|---|
| Range | 1.07–1.35 | 1.11–1.33 | 22.99–27.63 | 23.85–26.77 |
| Mean ± SD | 1.23 ± 0.07 | 1.21 ± 0.05 | 25.24 ± 1.05 | 25.14 ± 0.69 |
| Median | 1.23 | 1.21 | 25.10 | 25.19 |
| RSD (%) | 5.91 | 4.55 | 4.18 | 2.73 |
Publisher’s Note: MDPI stays neutral with regard to jurisdictional claims in published maps and institutional affiliations. |
© 2021 by the authors. Licensee MDPI, Basel, Switzerland. This article is an open access article distributed under the terms and conditions of the Creative Commons Attribution (CC BY) license (https://creativecommons.org/licenses/by/4.0/).
Share and Cite
Kunicki, P.K.; Wróbel, A. Validated Simple HPLC-UV Method for Mycophenolic Acid (MPA) Monitoring in Human Plasma. Internal Standardization: Is It Necessary? Molecules 2021, 26, 7252. https://doi.org/10.3390/molecules26237252
Kunicki PK, Wróbel A. Validated Simple HPLC-UV Method for Mycophenolic Acid (MPA) Monitoring in Human Plasma. Internal Standardization: Is It Necessary? Molecules. 2021; 26(23):7252. https://doi.org/10.3390/molecules26237252
Chicago/Turabian StyleKunicki, Paweł K., and Aleksandra Wróbel. 2021. "Validated Simple HPLC-UV Method for Mycophenolic Acid (MPA) Monitoring in Human Plasma. Internal Standardization: Is It Necessary?" Molecules 26, no. 23: 7252. https://doi.org/10.3390/molecules26237252
APA StyleKunicki, P. K., & Wróbel, A. (2021). Validated Simple HPLC-UV Method for Mycophenolic Acid (MPA) Monitoring in Human Plasma. Internal Standardization: Is It Necessary? Molecules, 26(23), 7252. https://doi.org/10.3390/molecules26237252