
Preparation, Characterization, and Bioavailability of Host-Guest Inclusion Complex of Ginsenoside Re with Gamma-Cyclodextrin

Abstract
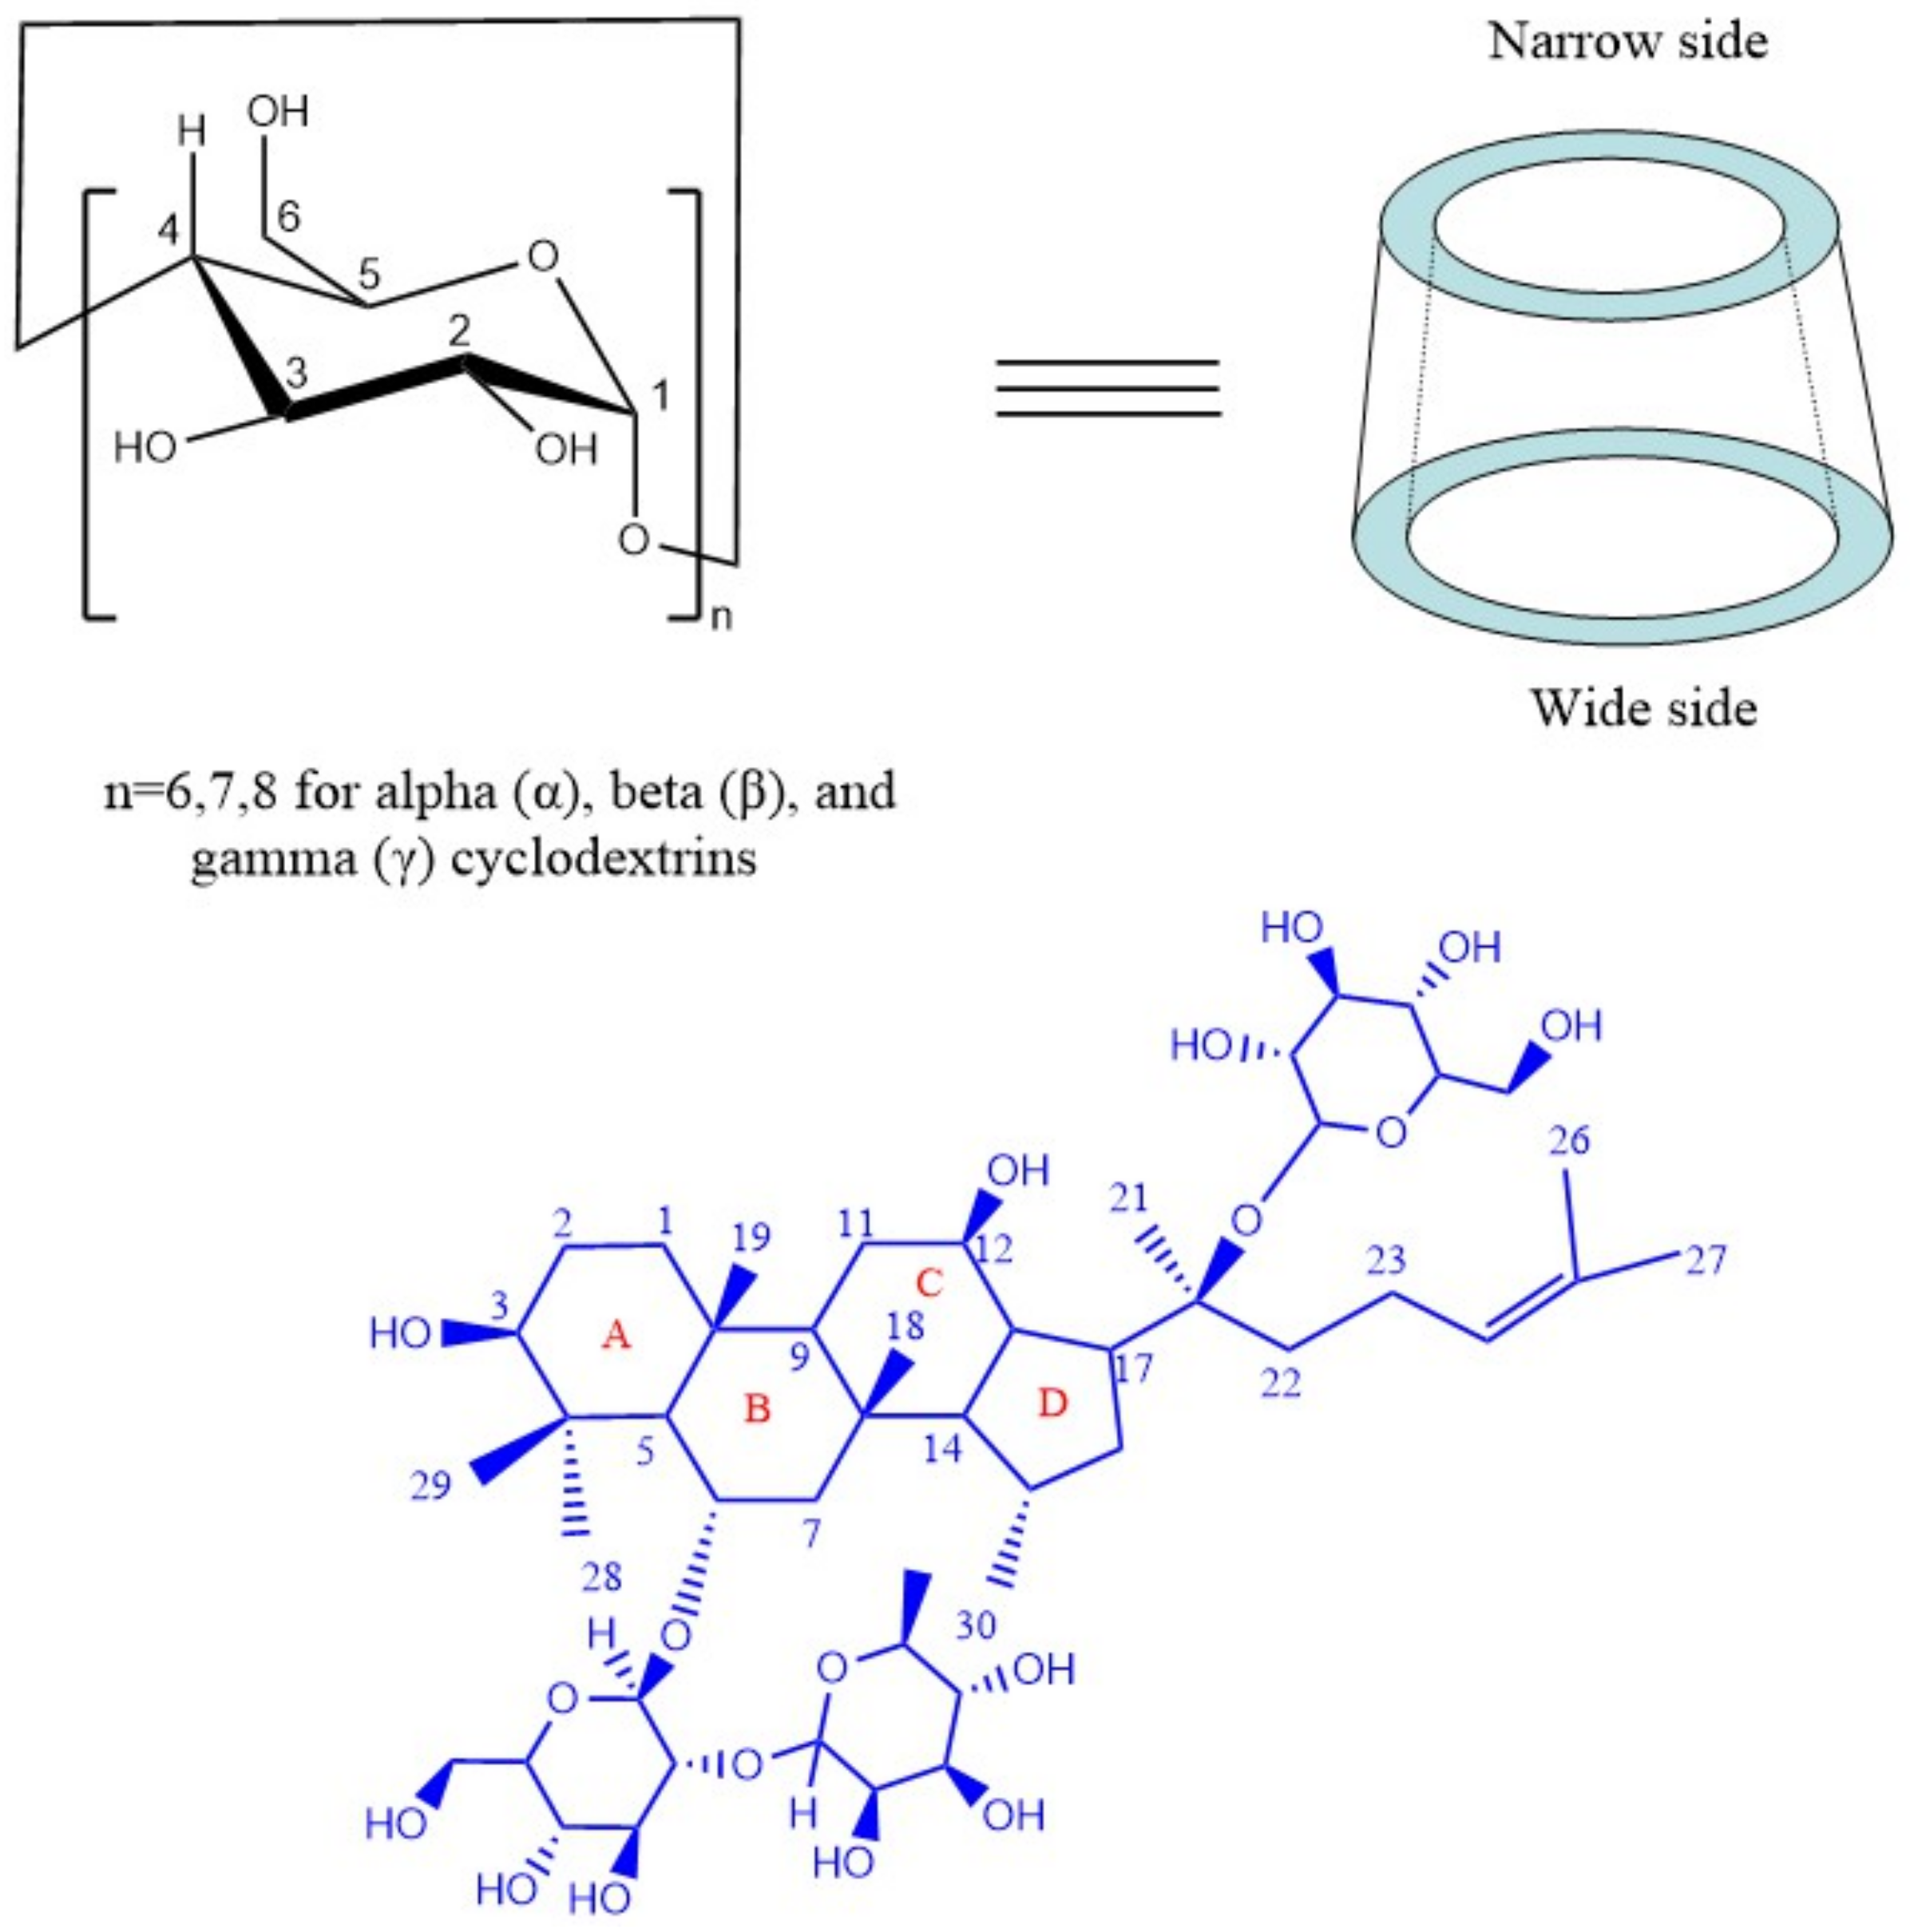
:1. Introduction
2. Results and Discussion
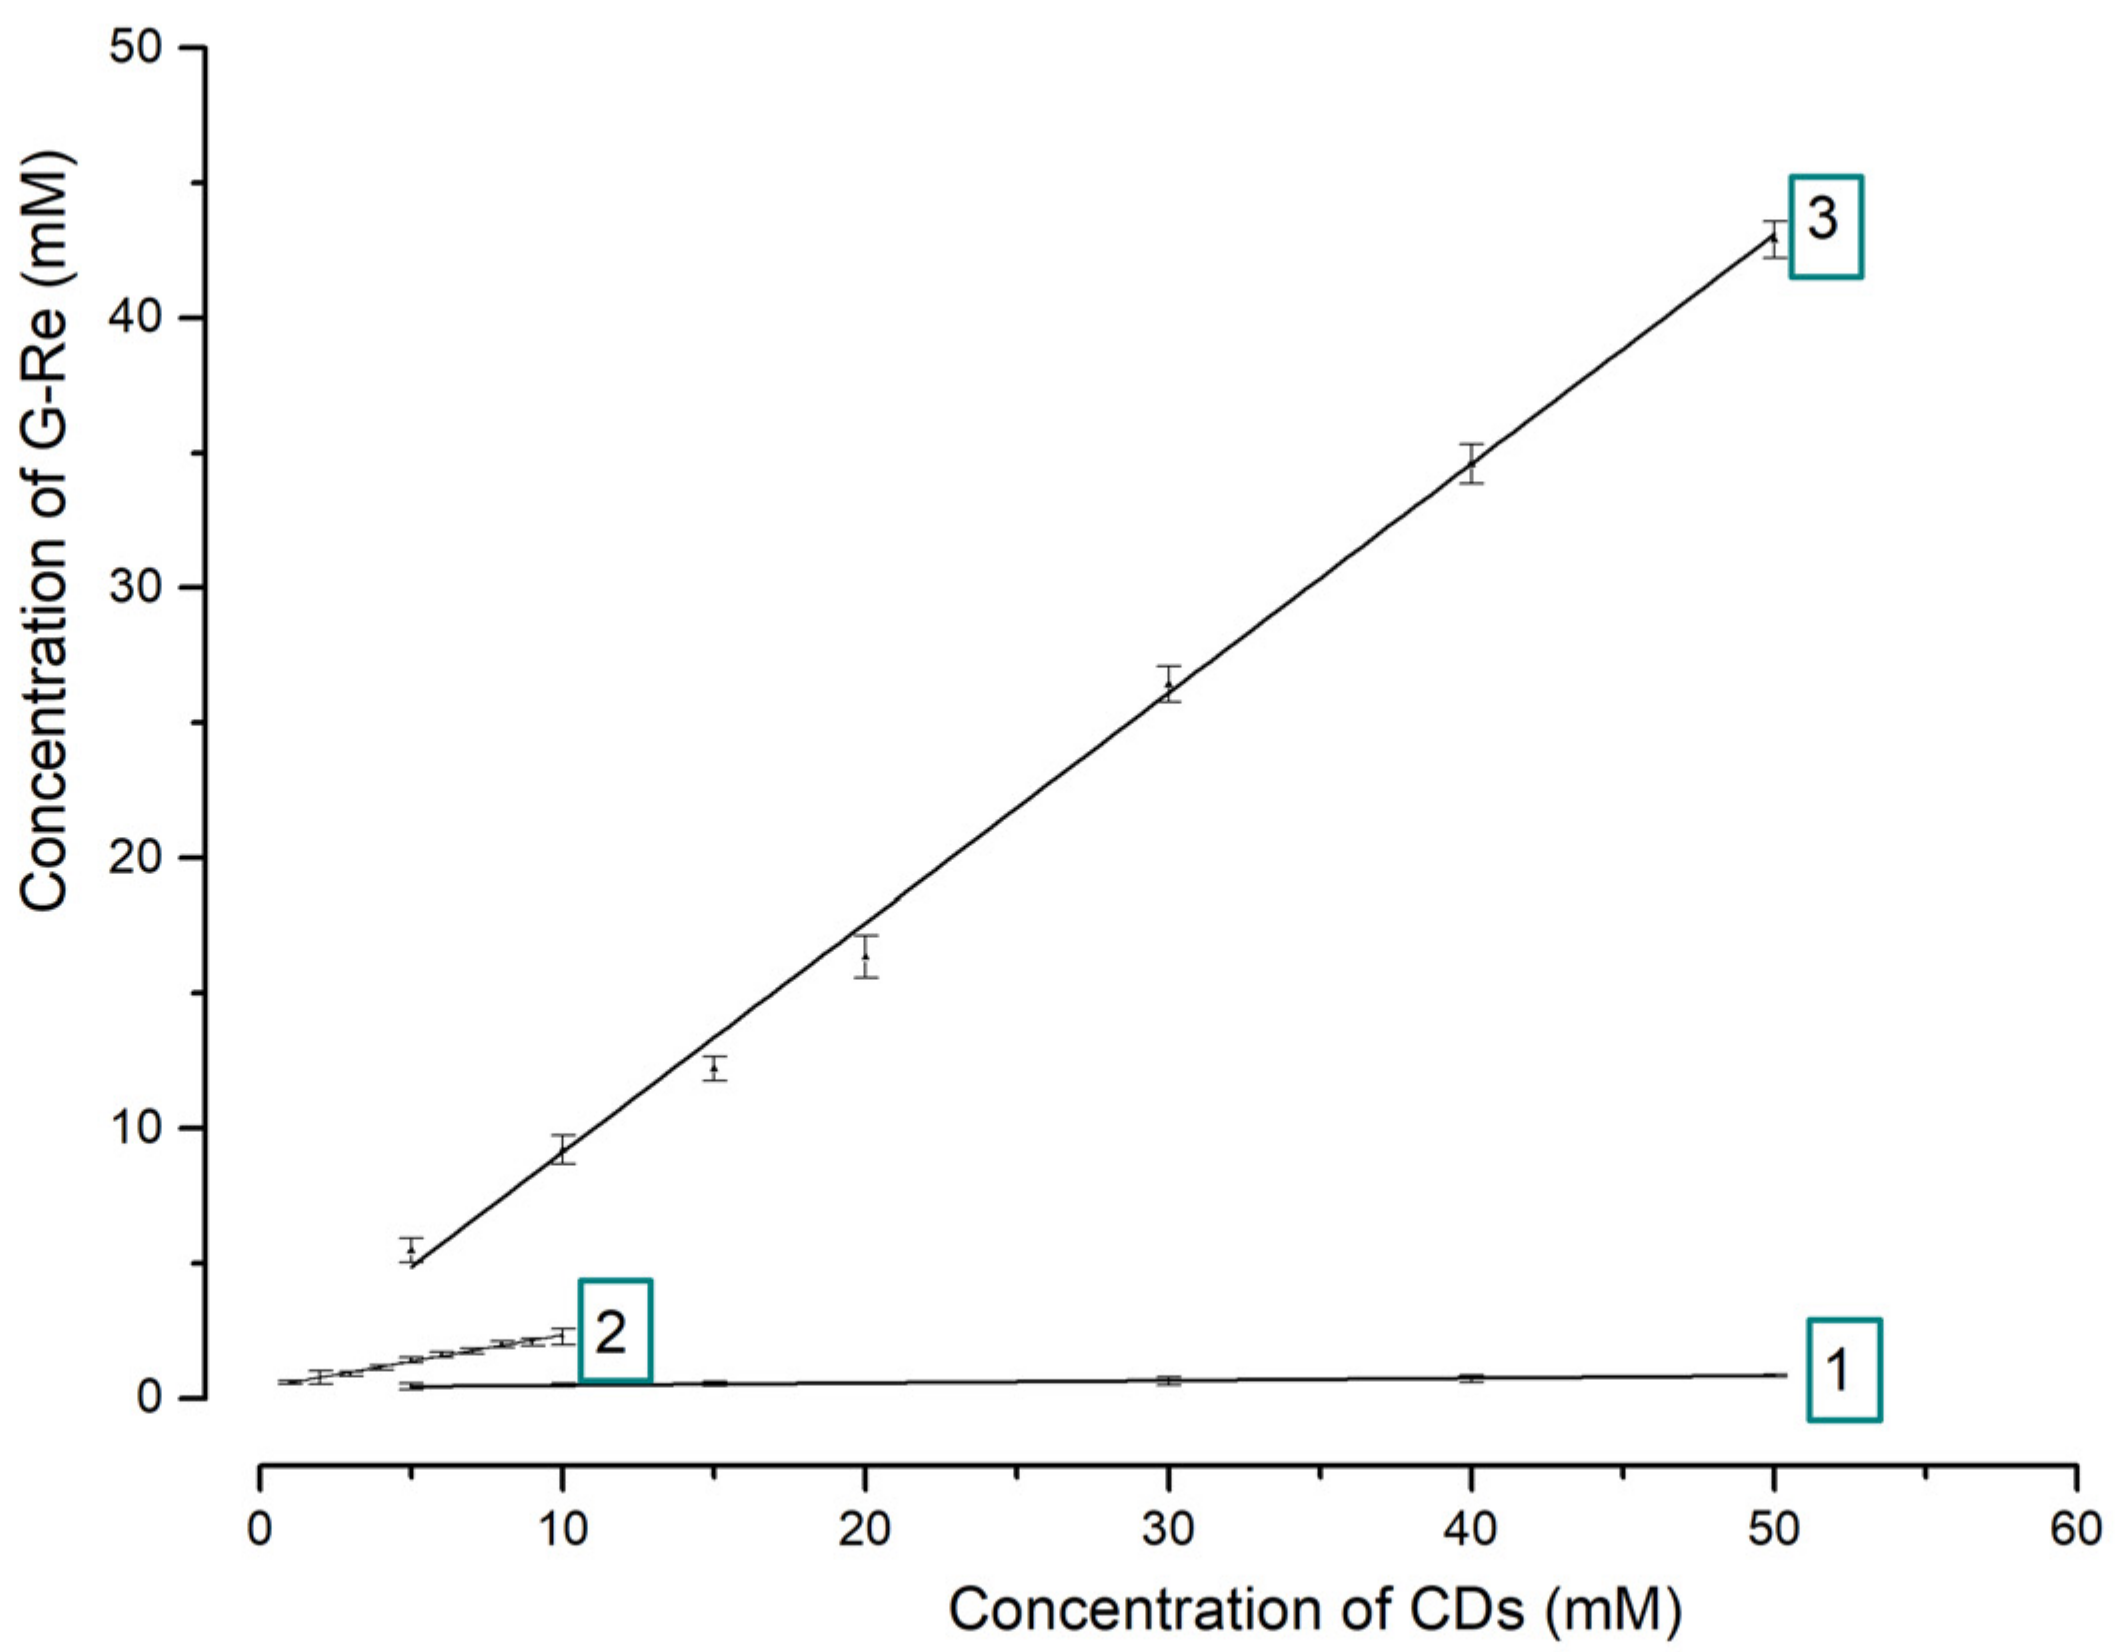
2.1. Phase Solubility Studies
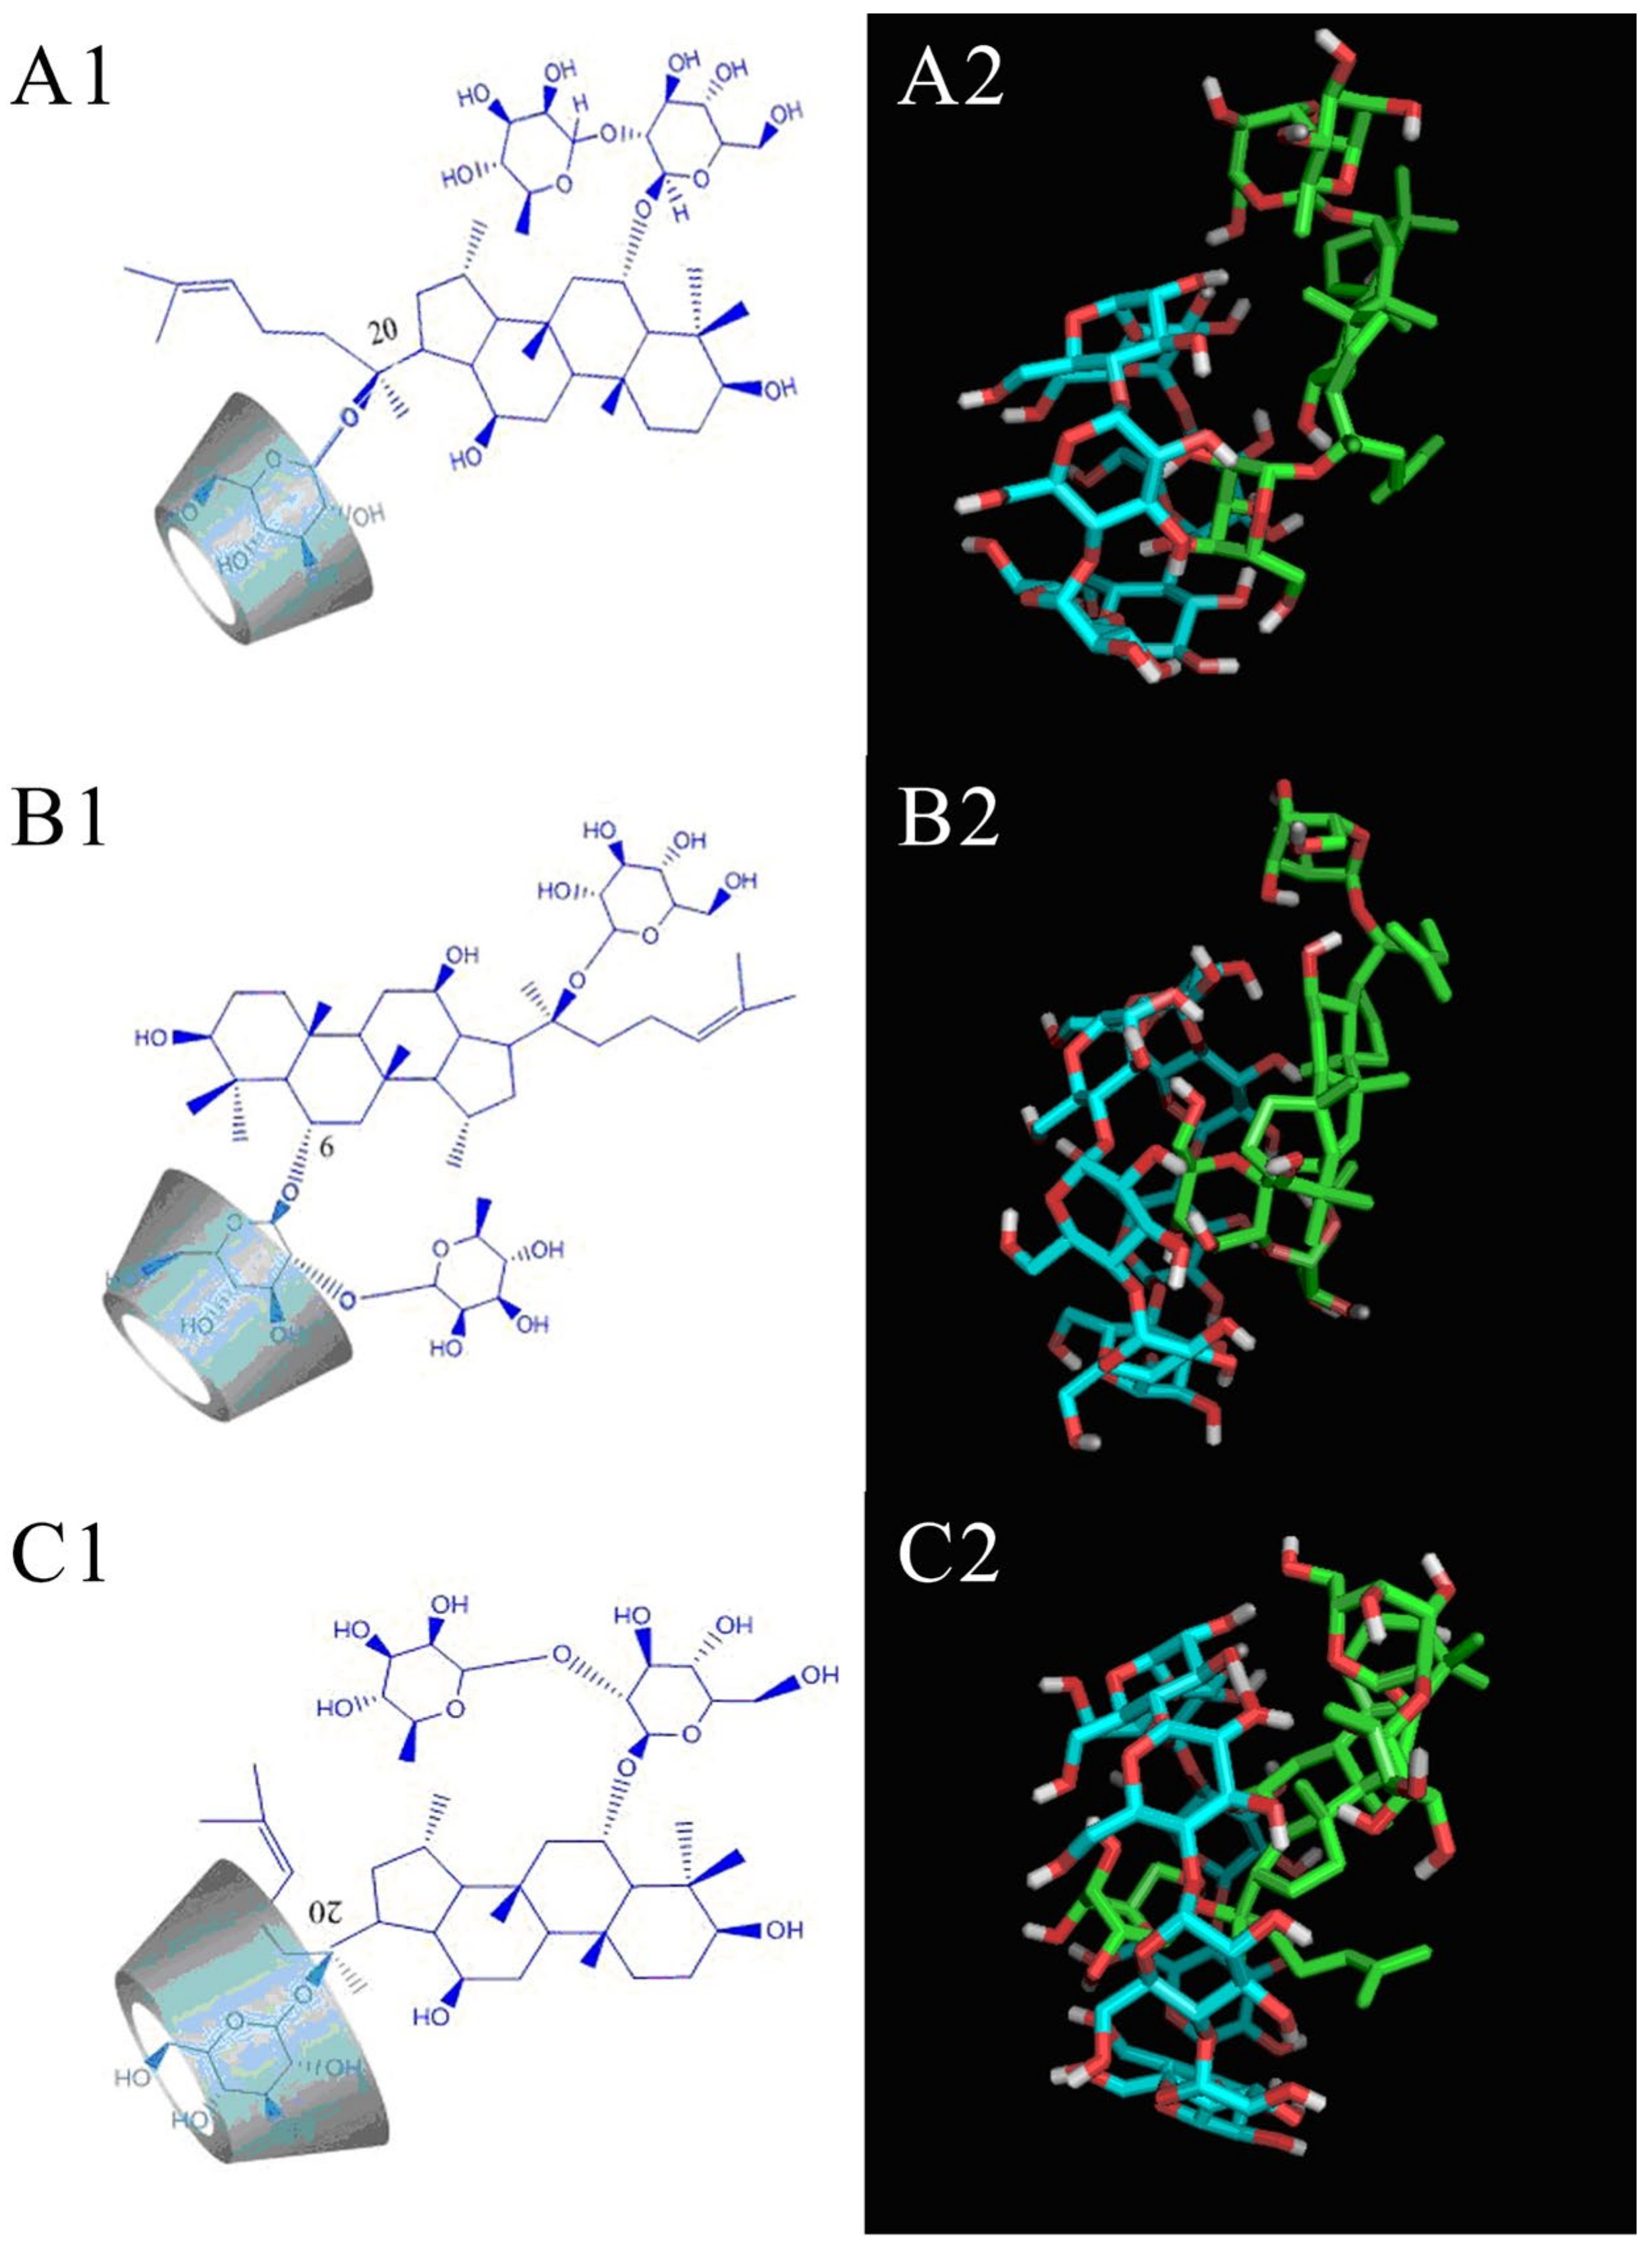
2.2. Molecular Docking Simulation
2.3. G-Re Content Test
2.4. Physicochemical Characterization for the Confirmation of Inclusion Complex
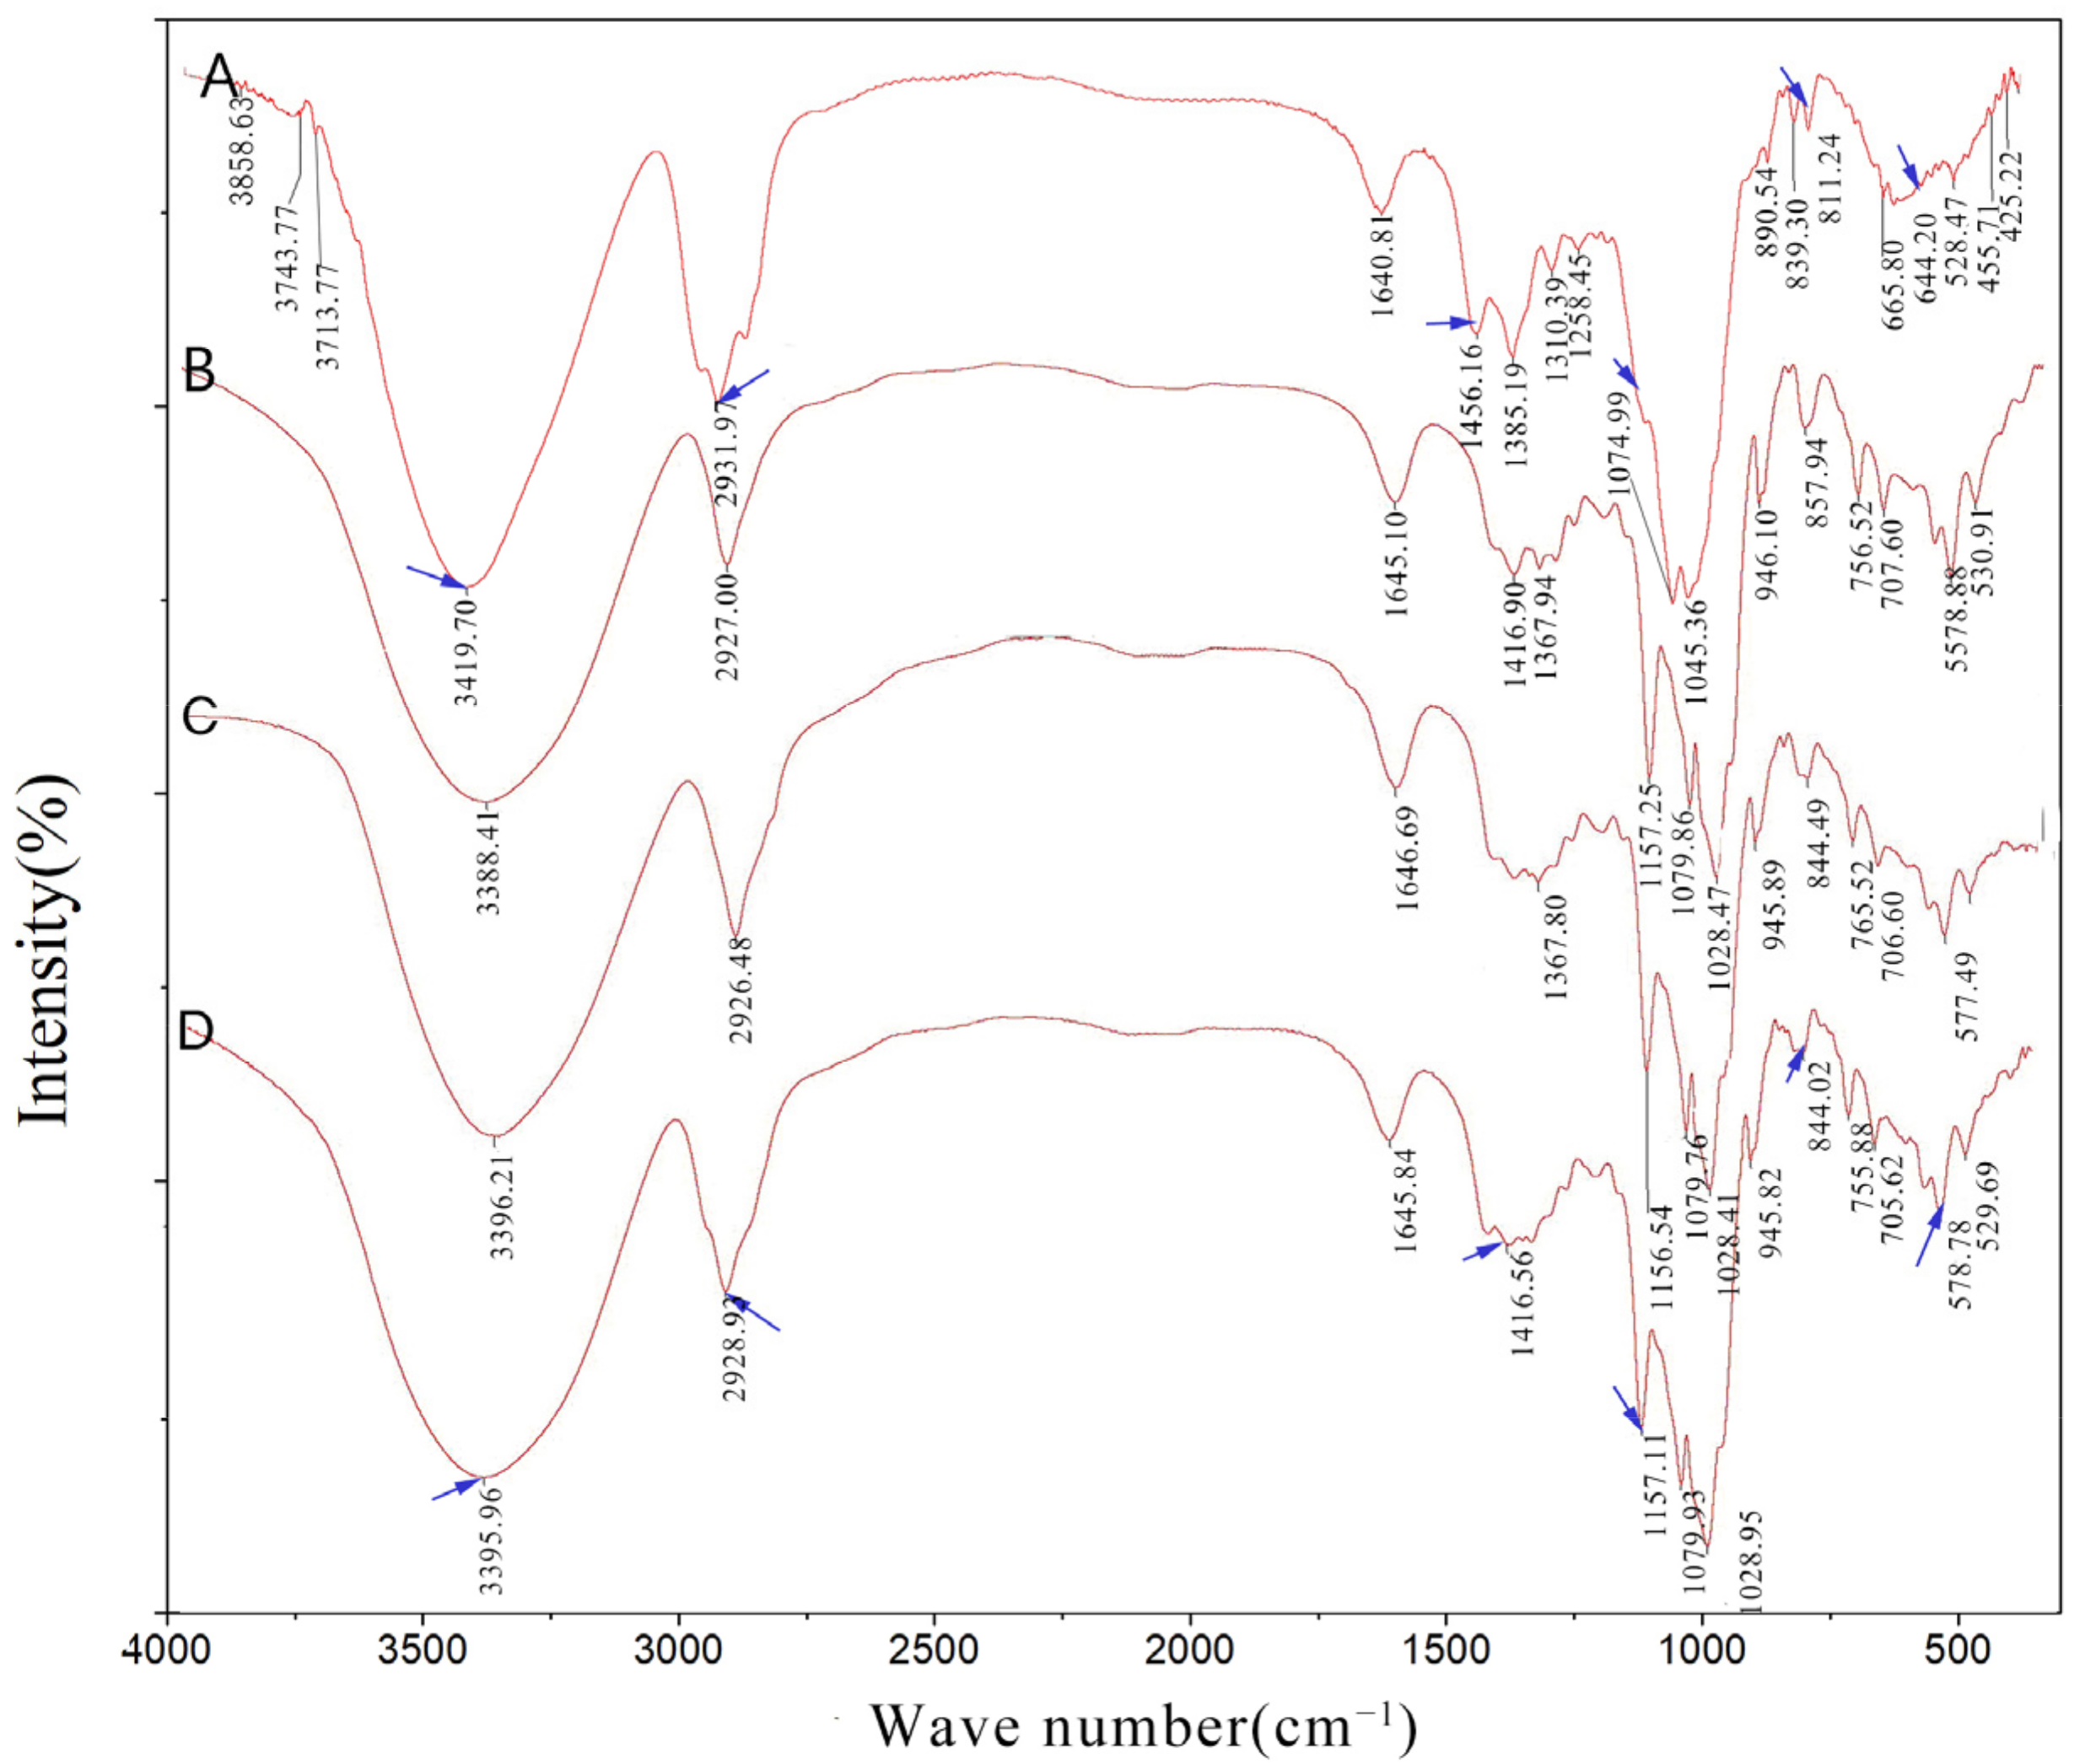
2.4.1. Fourier-Transform Infrared (FT-IR)
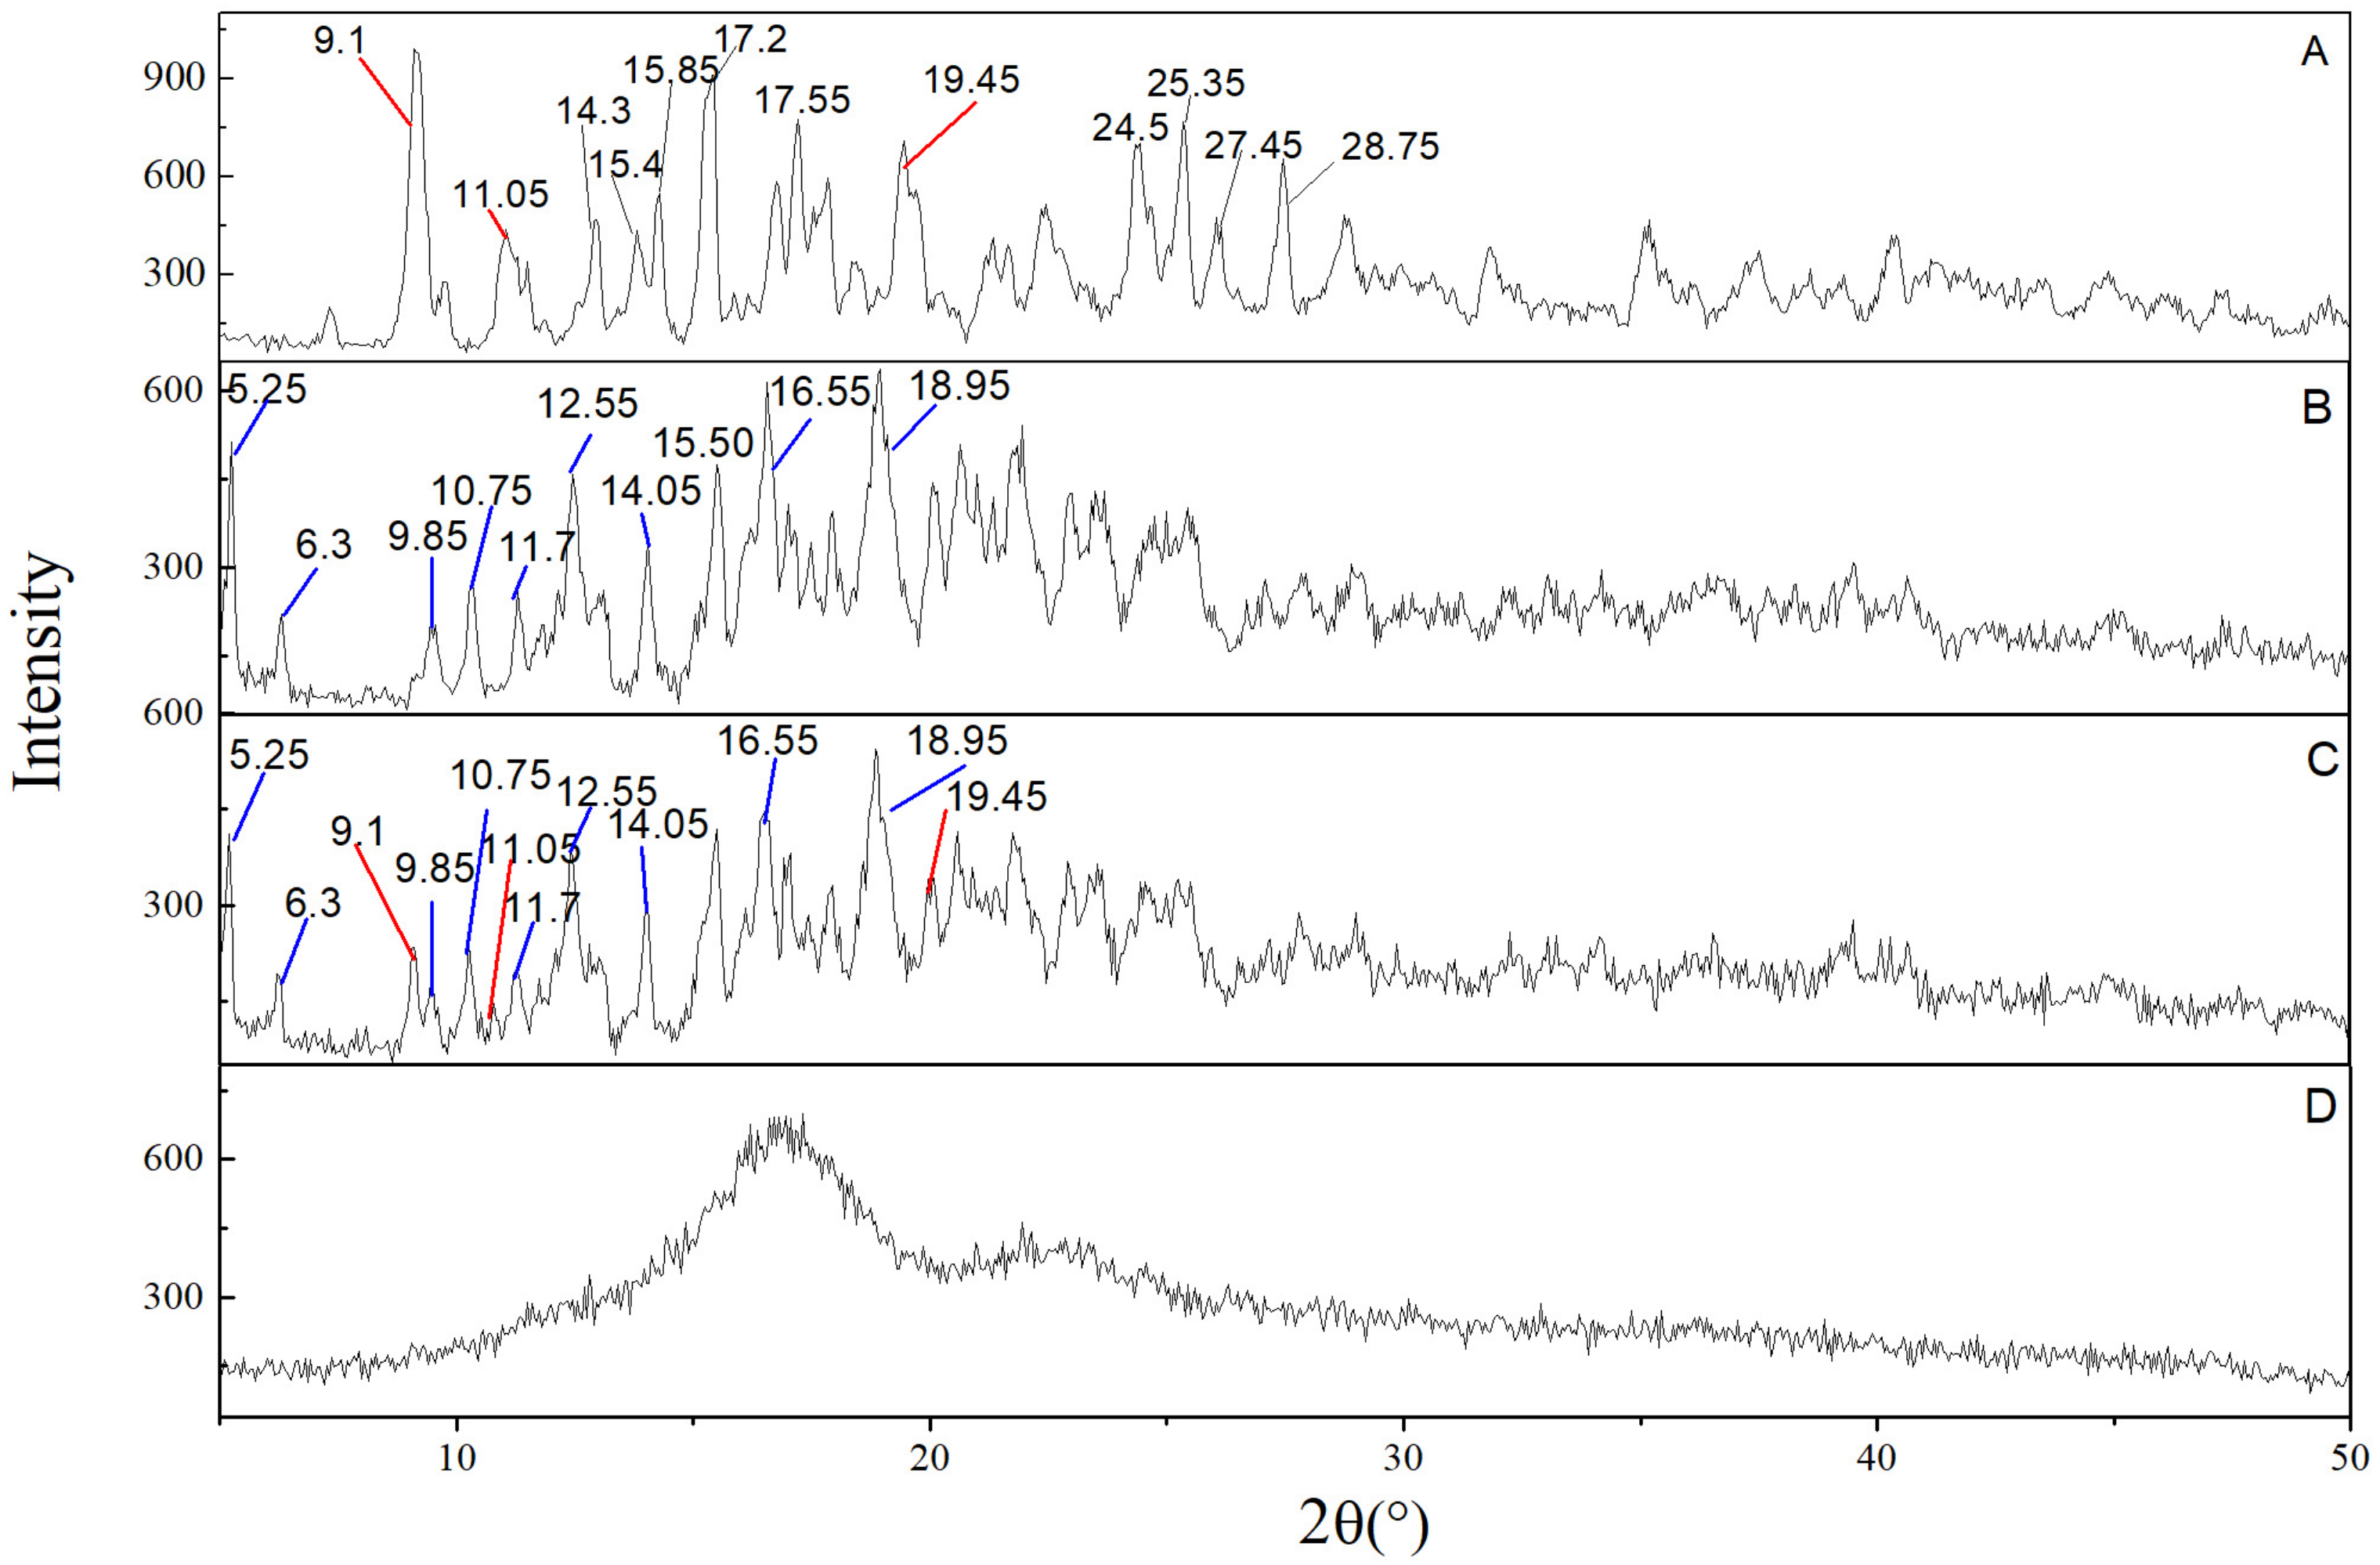
2.4.2. X-ray Diffraction (XRD)
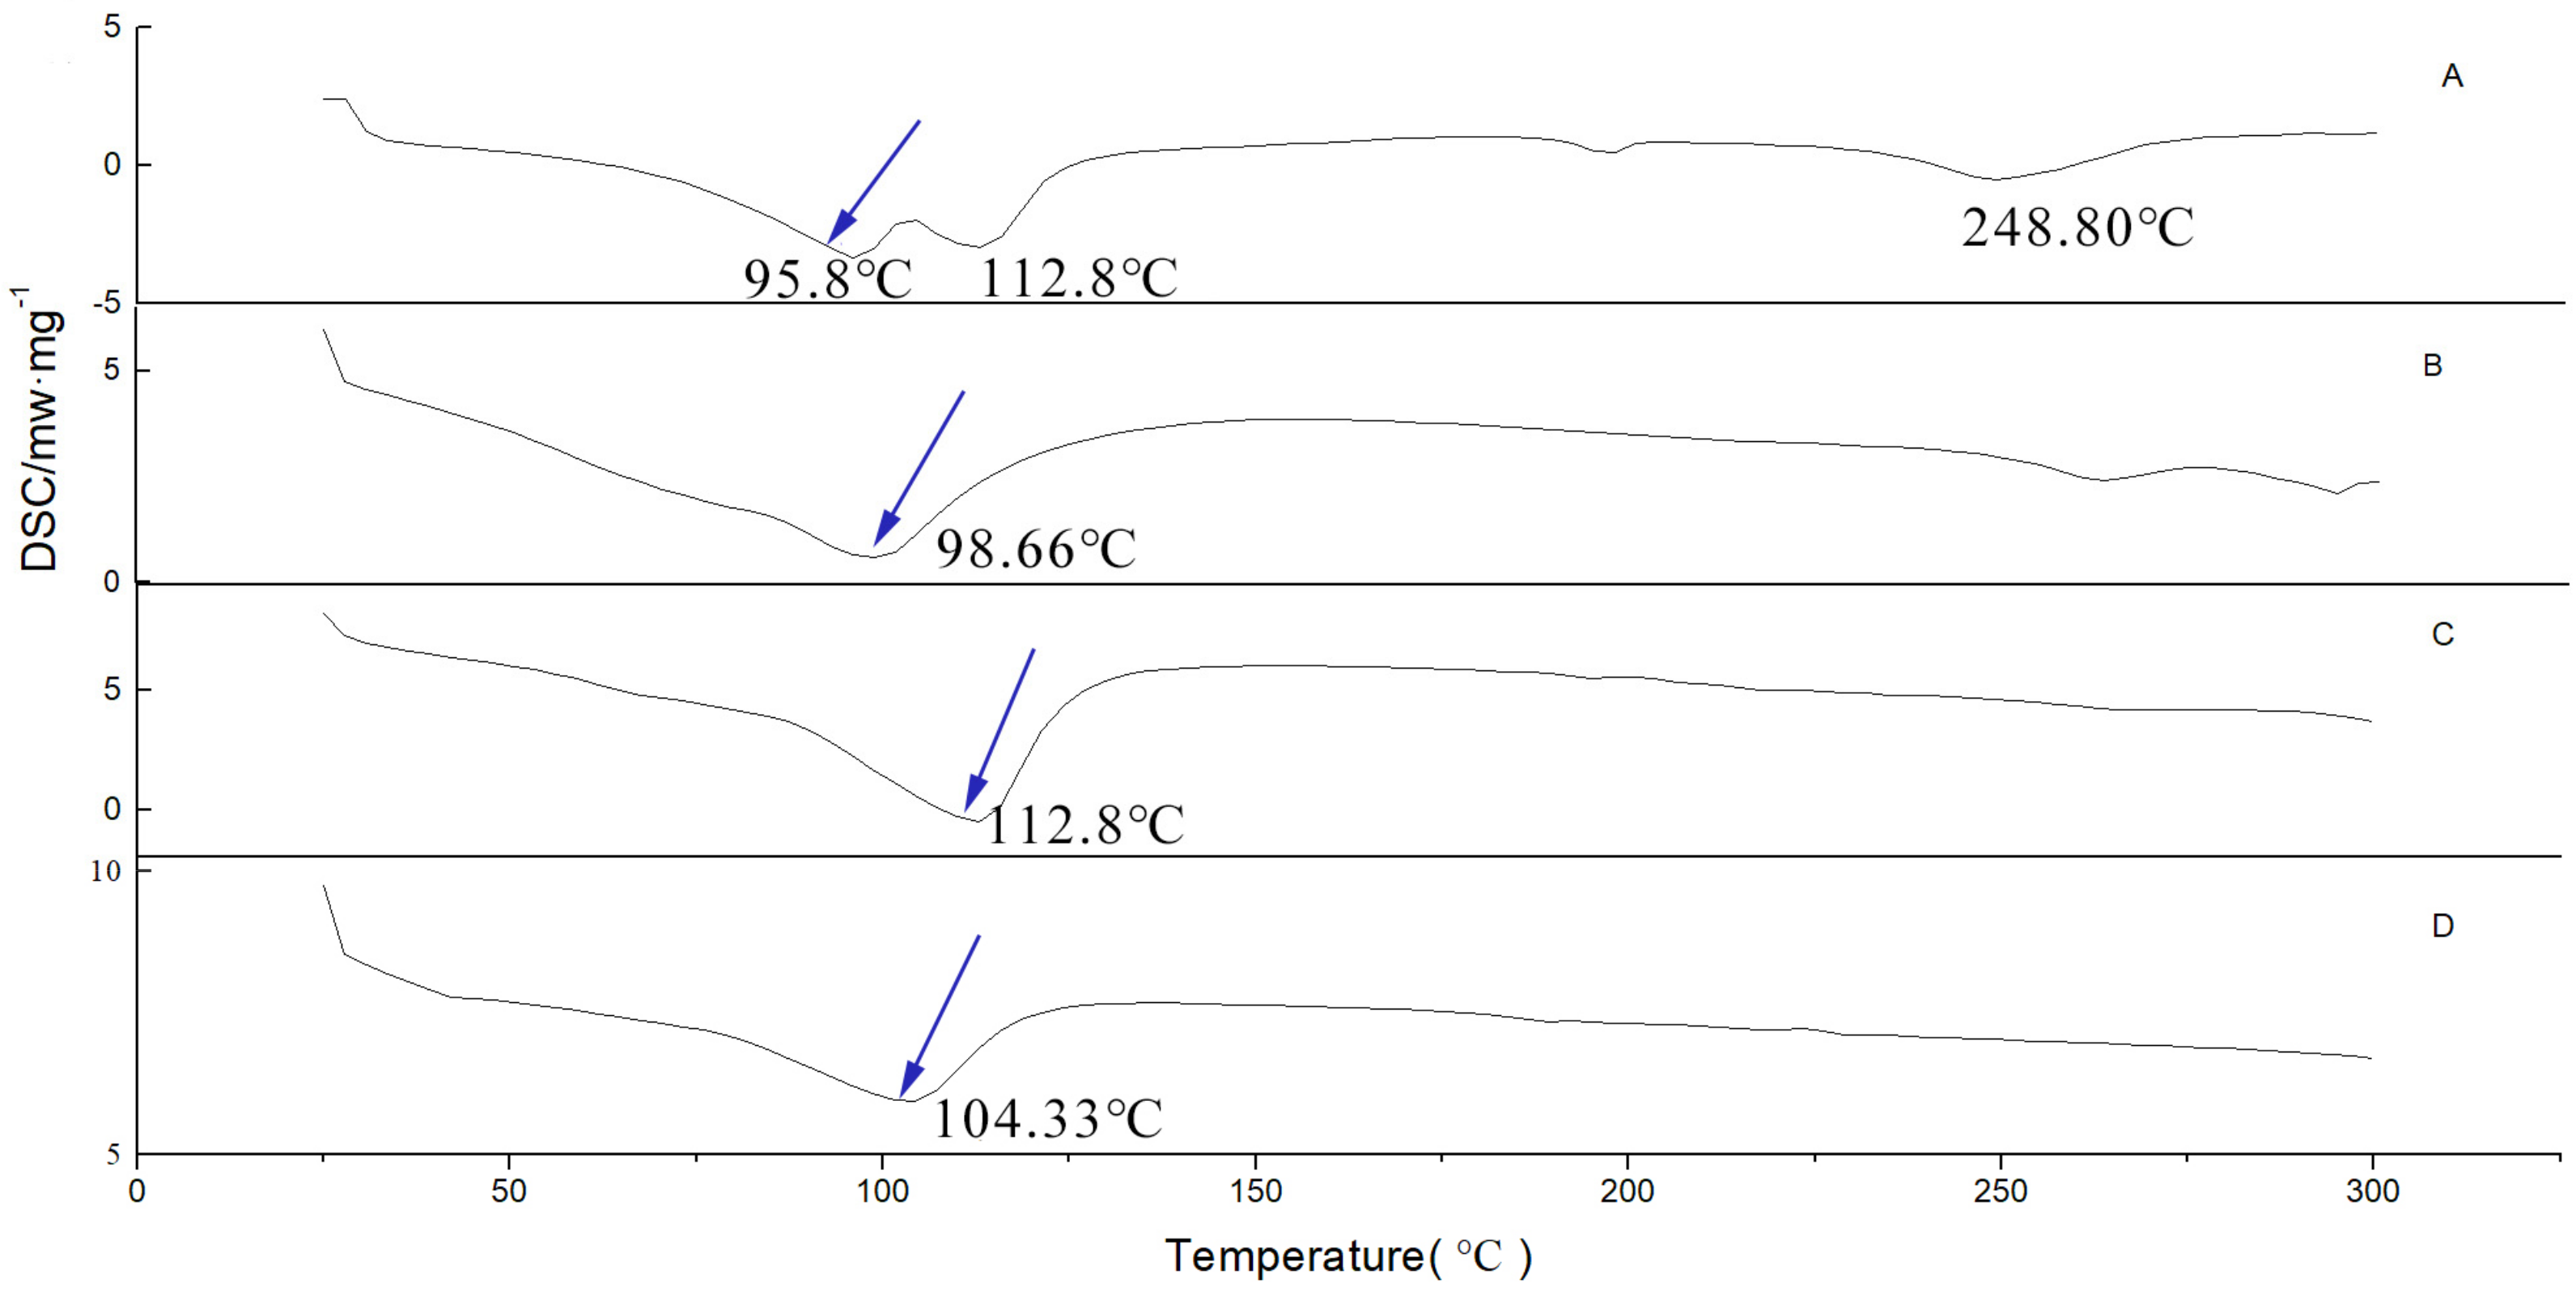
2.4.3. Differential Scanning Calorimetry (DSC)
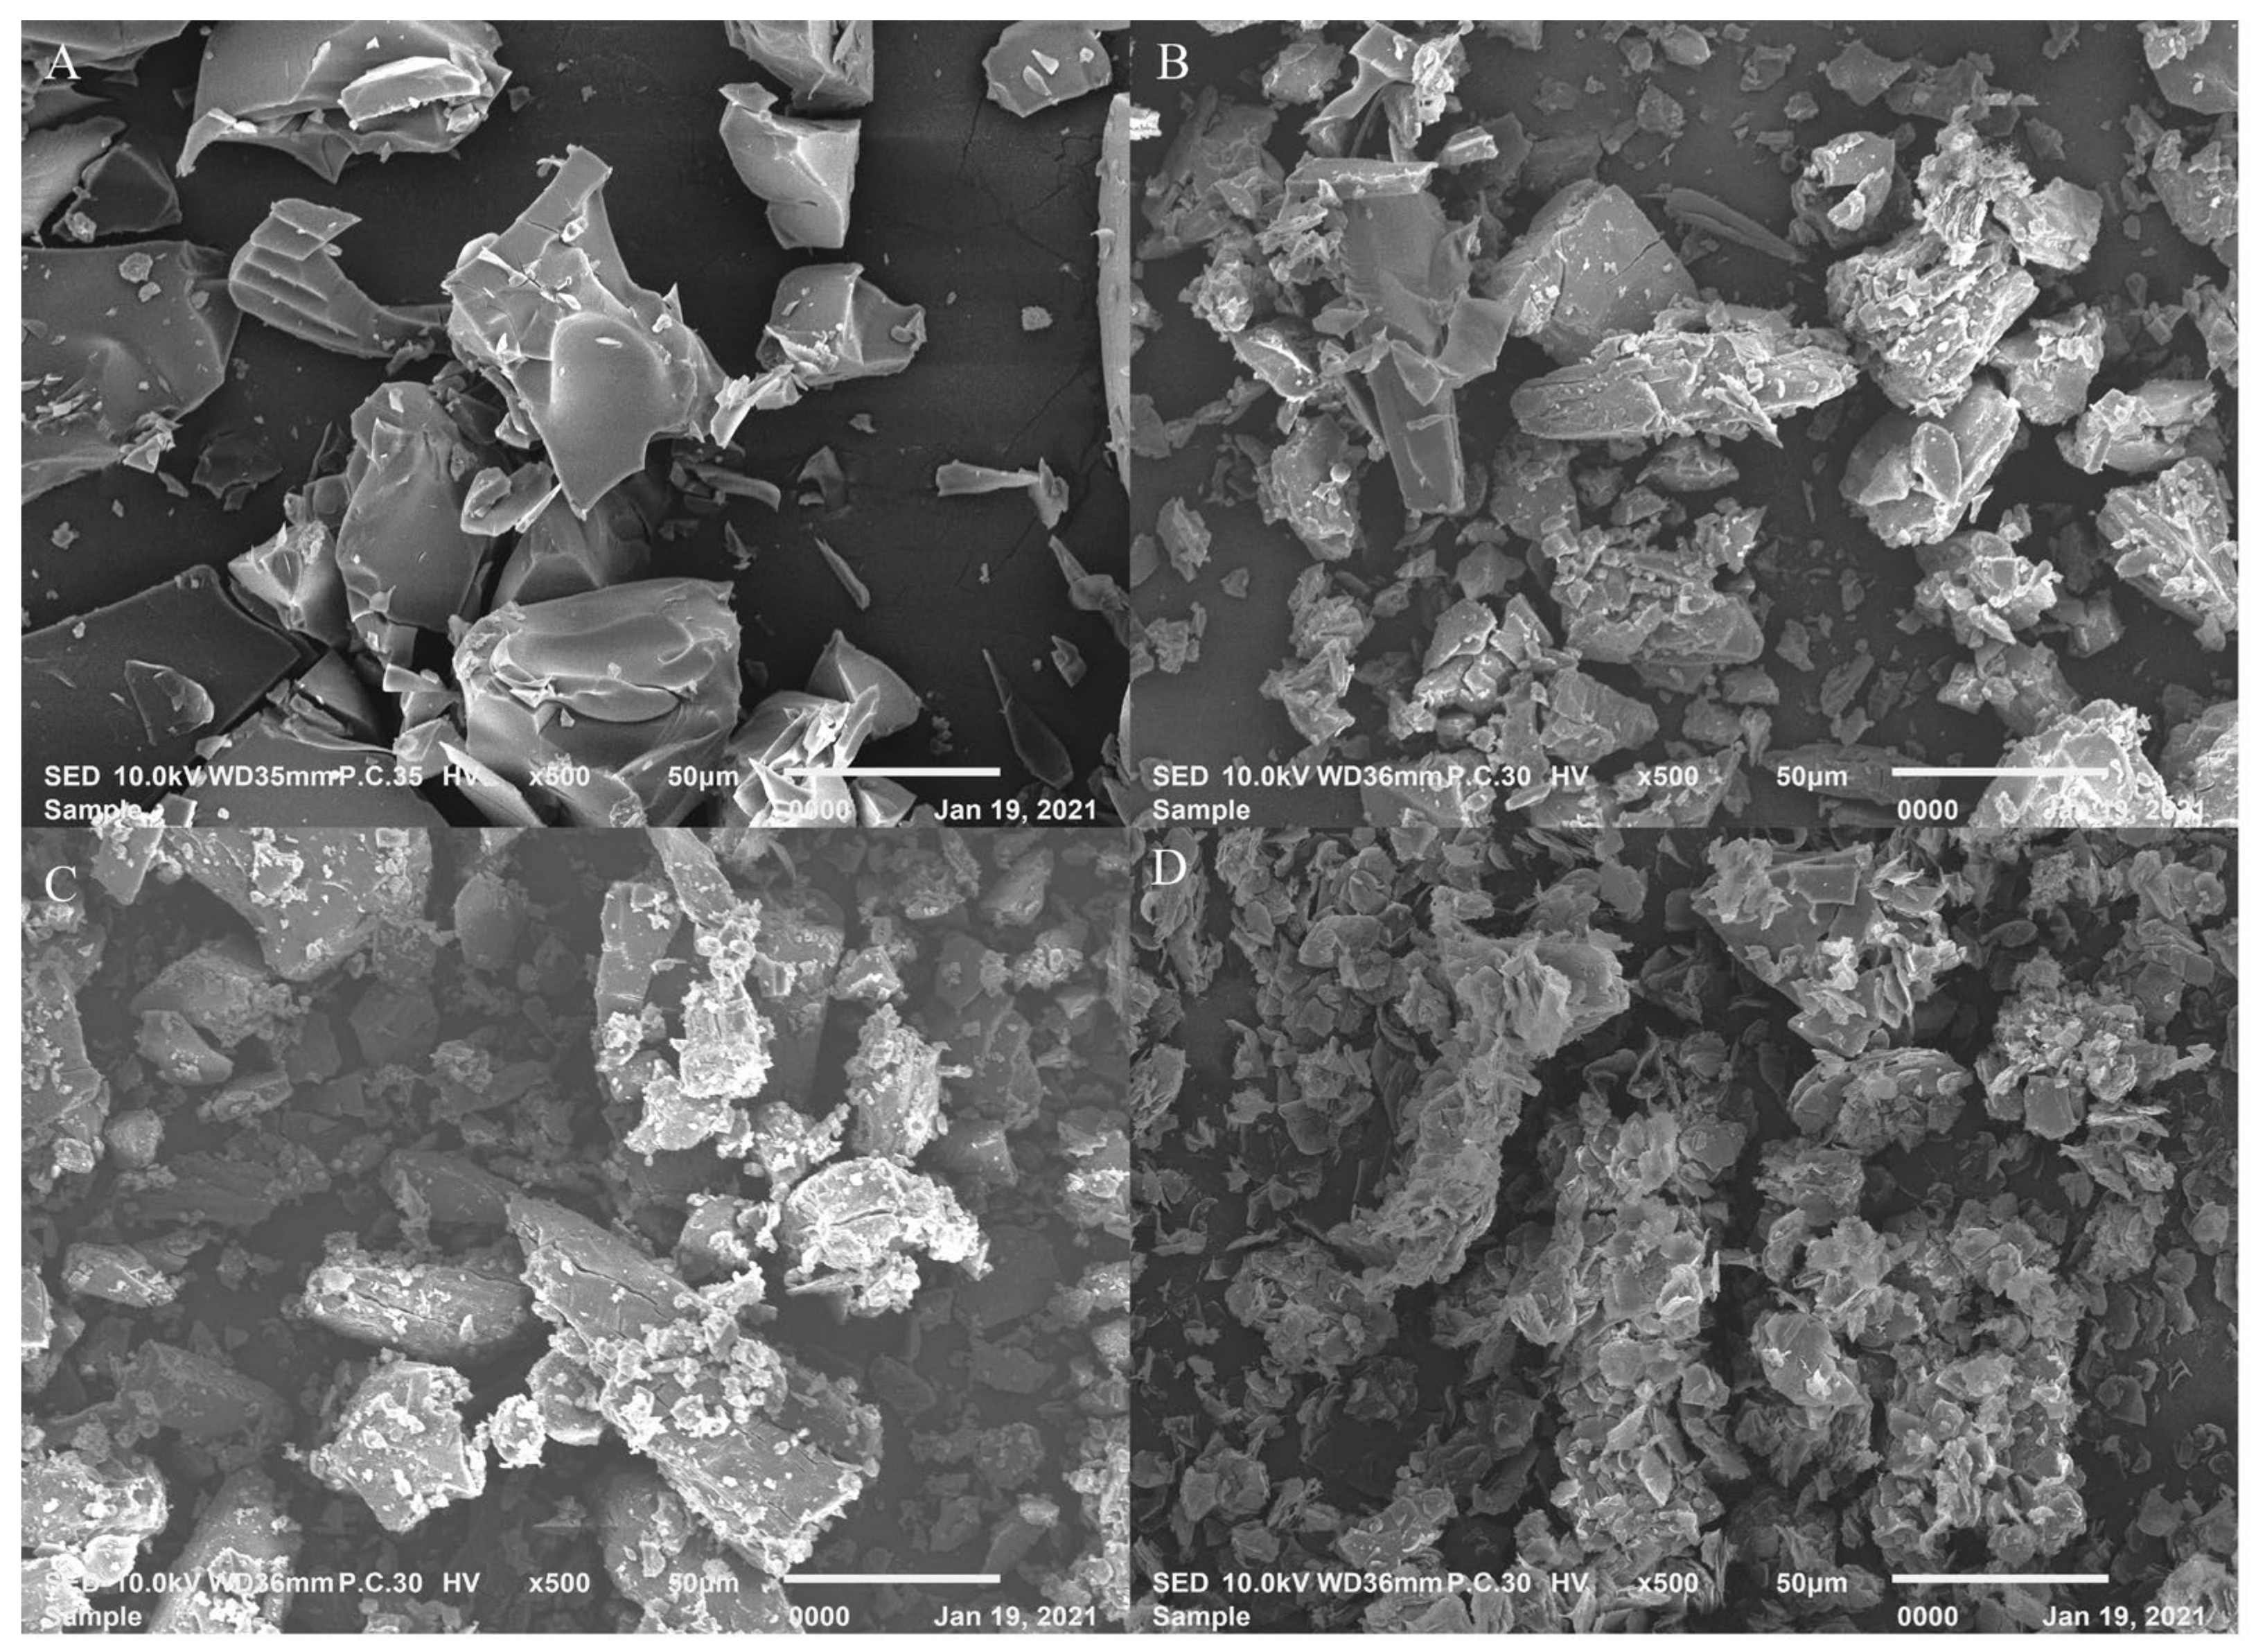
2.4.4. Scanning Electron Microscopy (SEM)
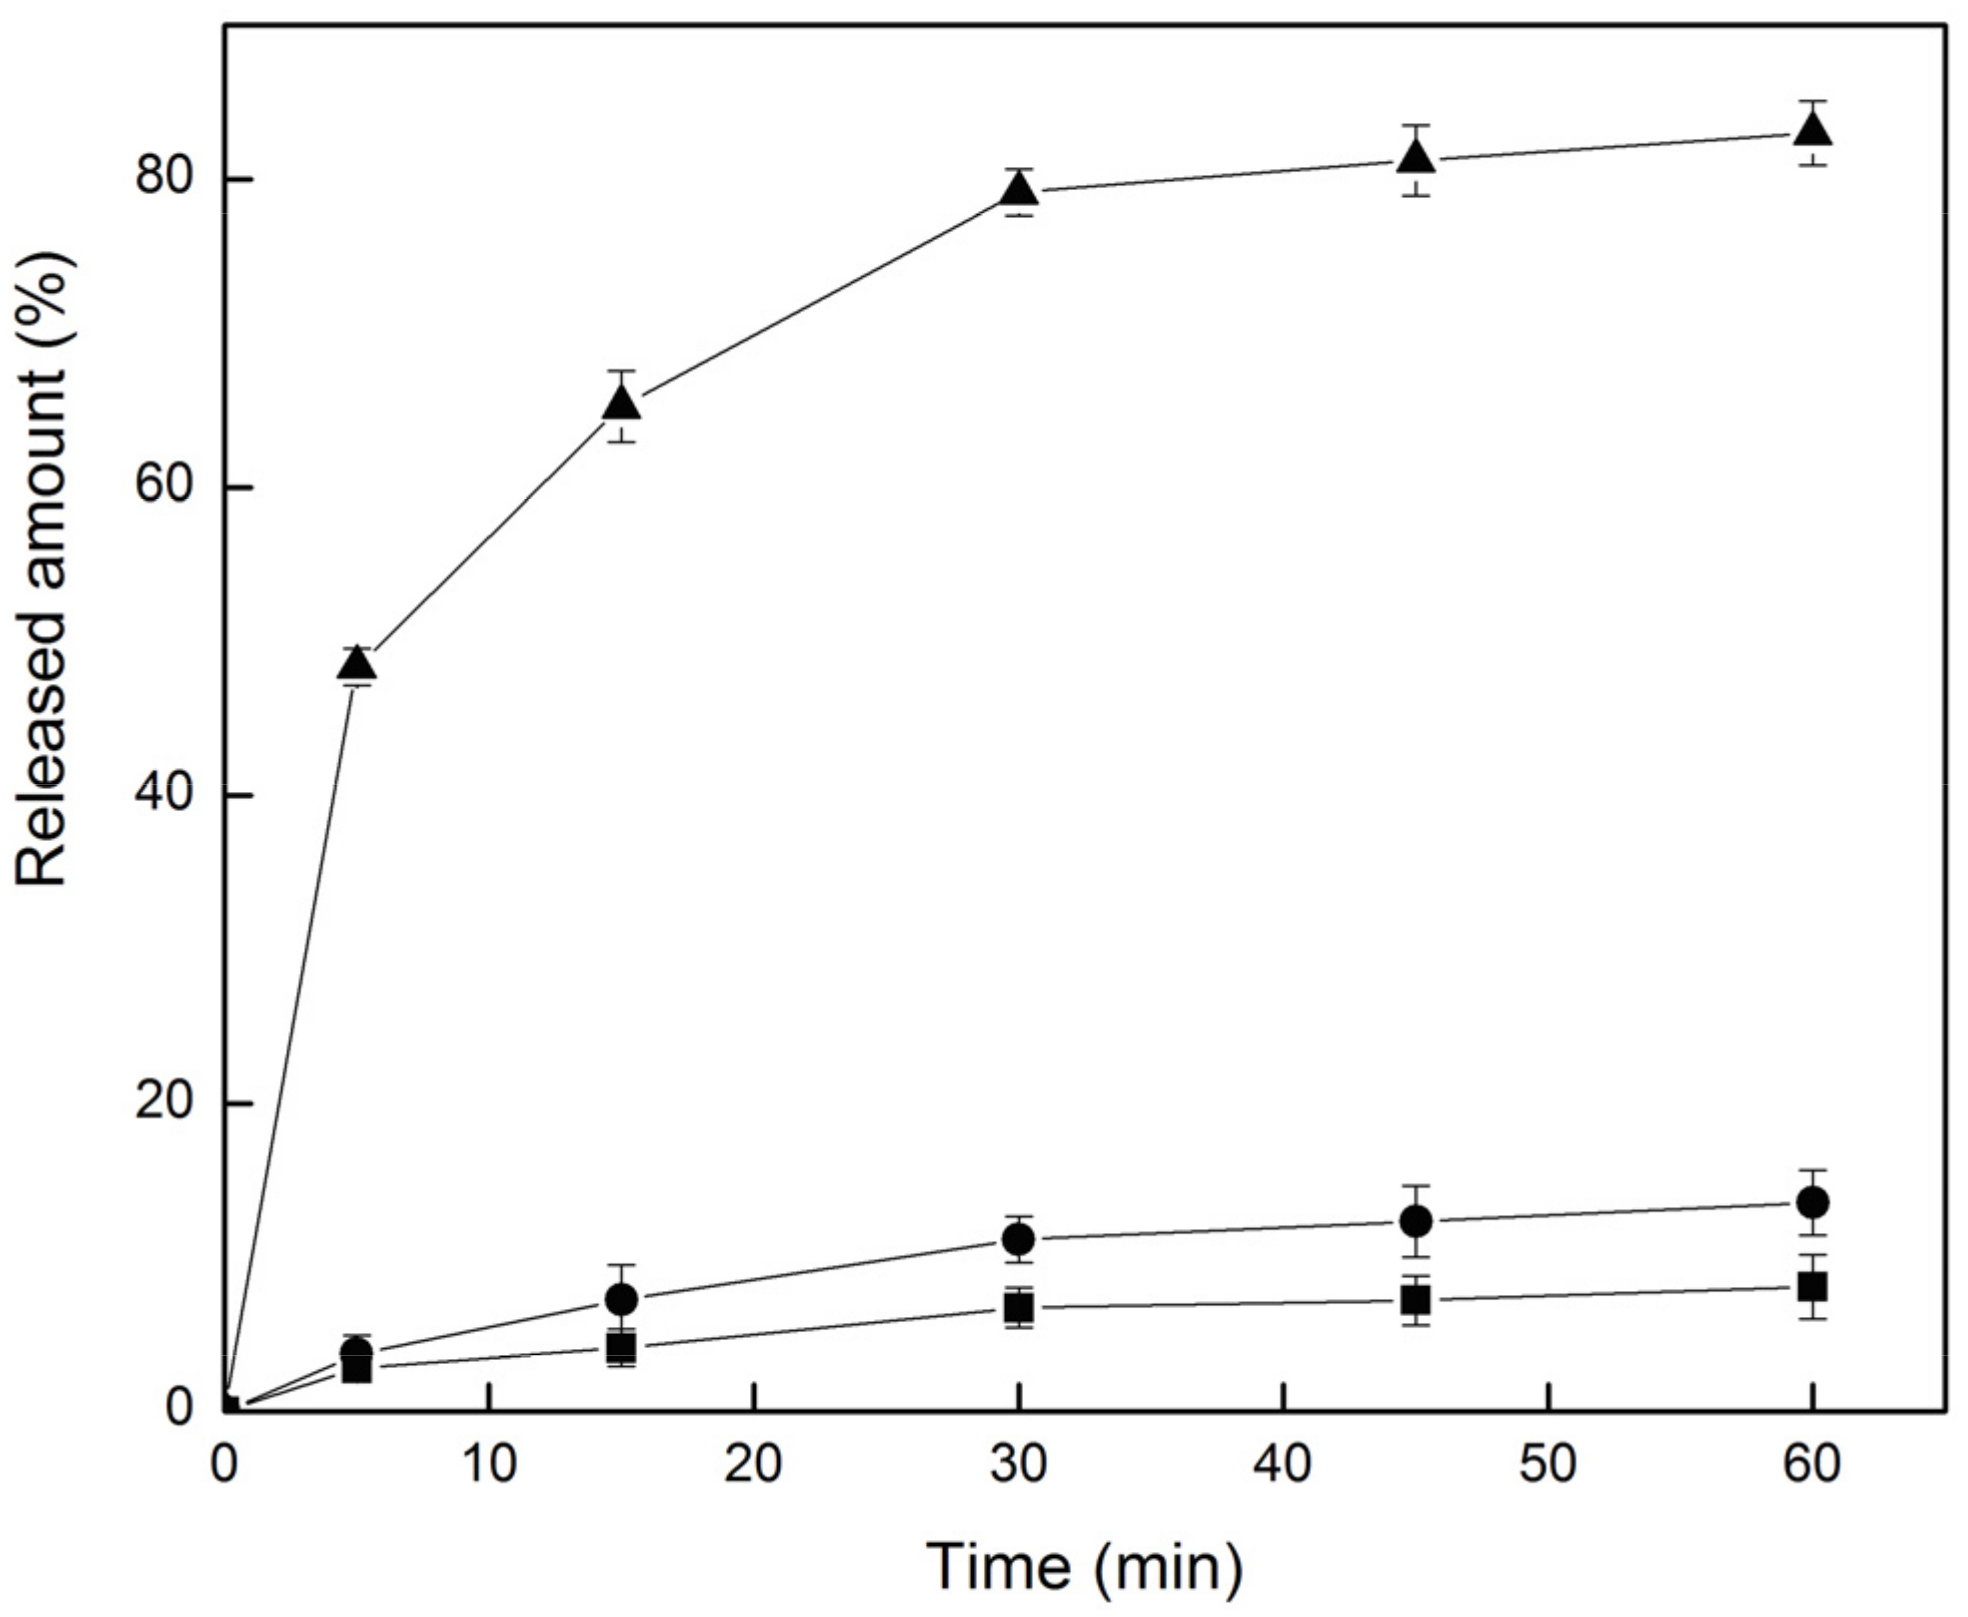
2.5. Dissolution Test
2.6. Bioavailability Study with LC-MS/MS
2.6.1. Method Validation
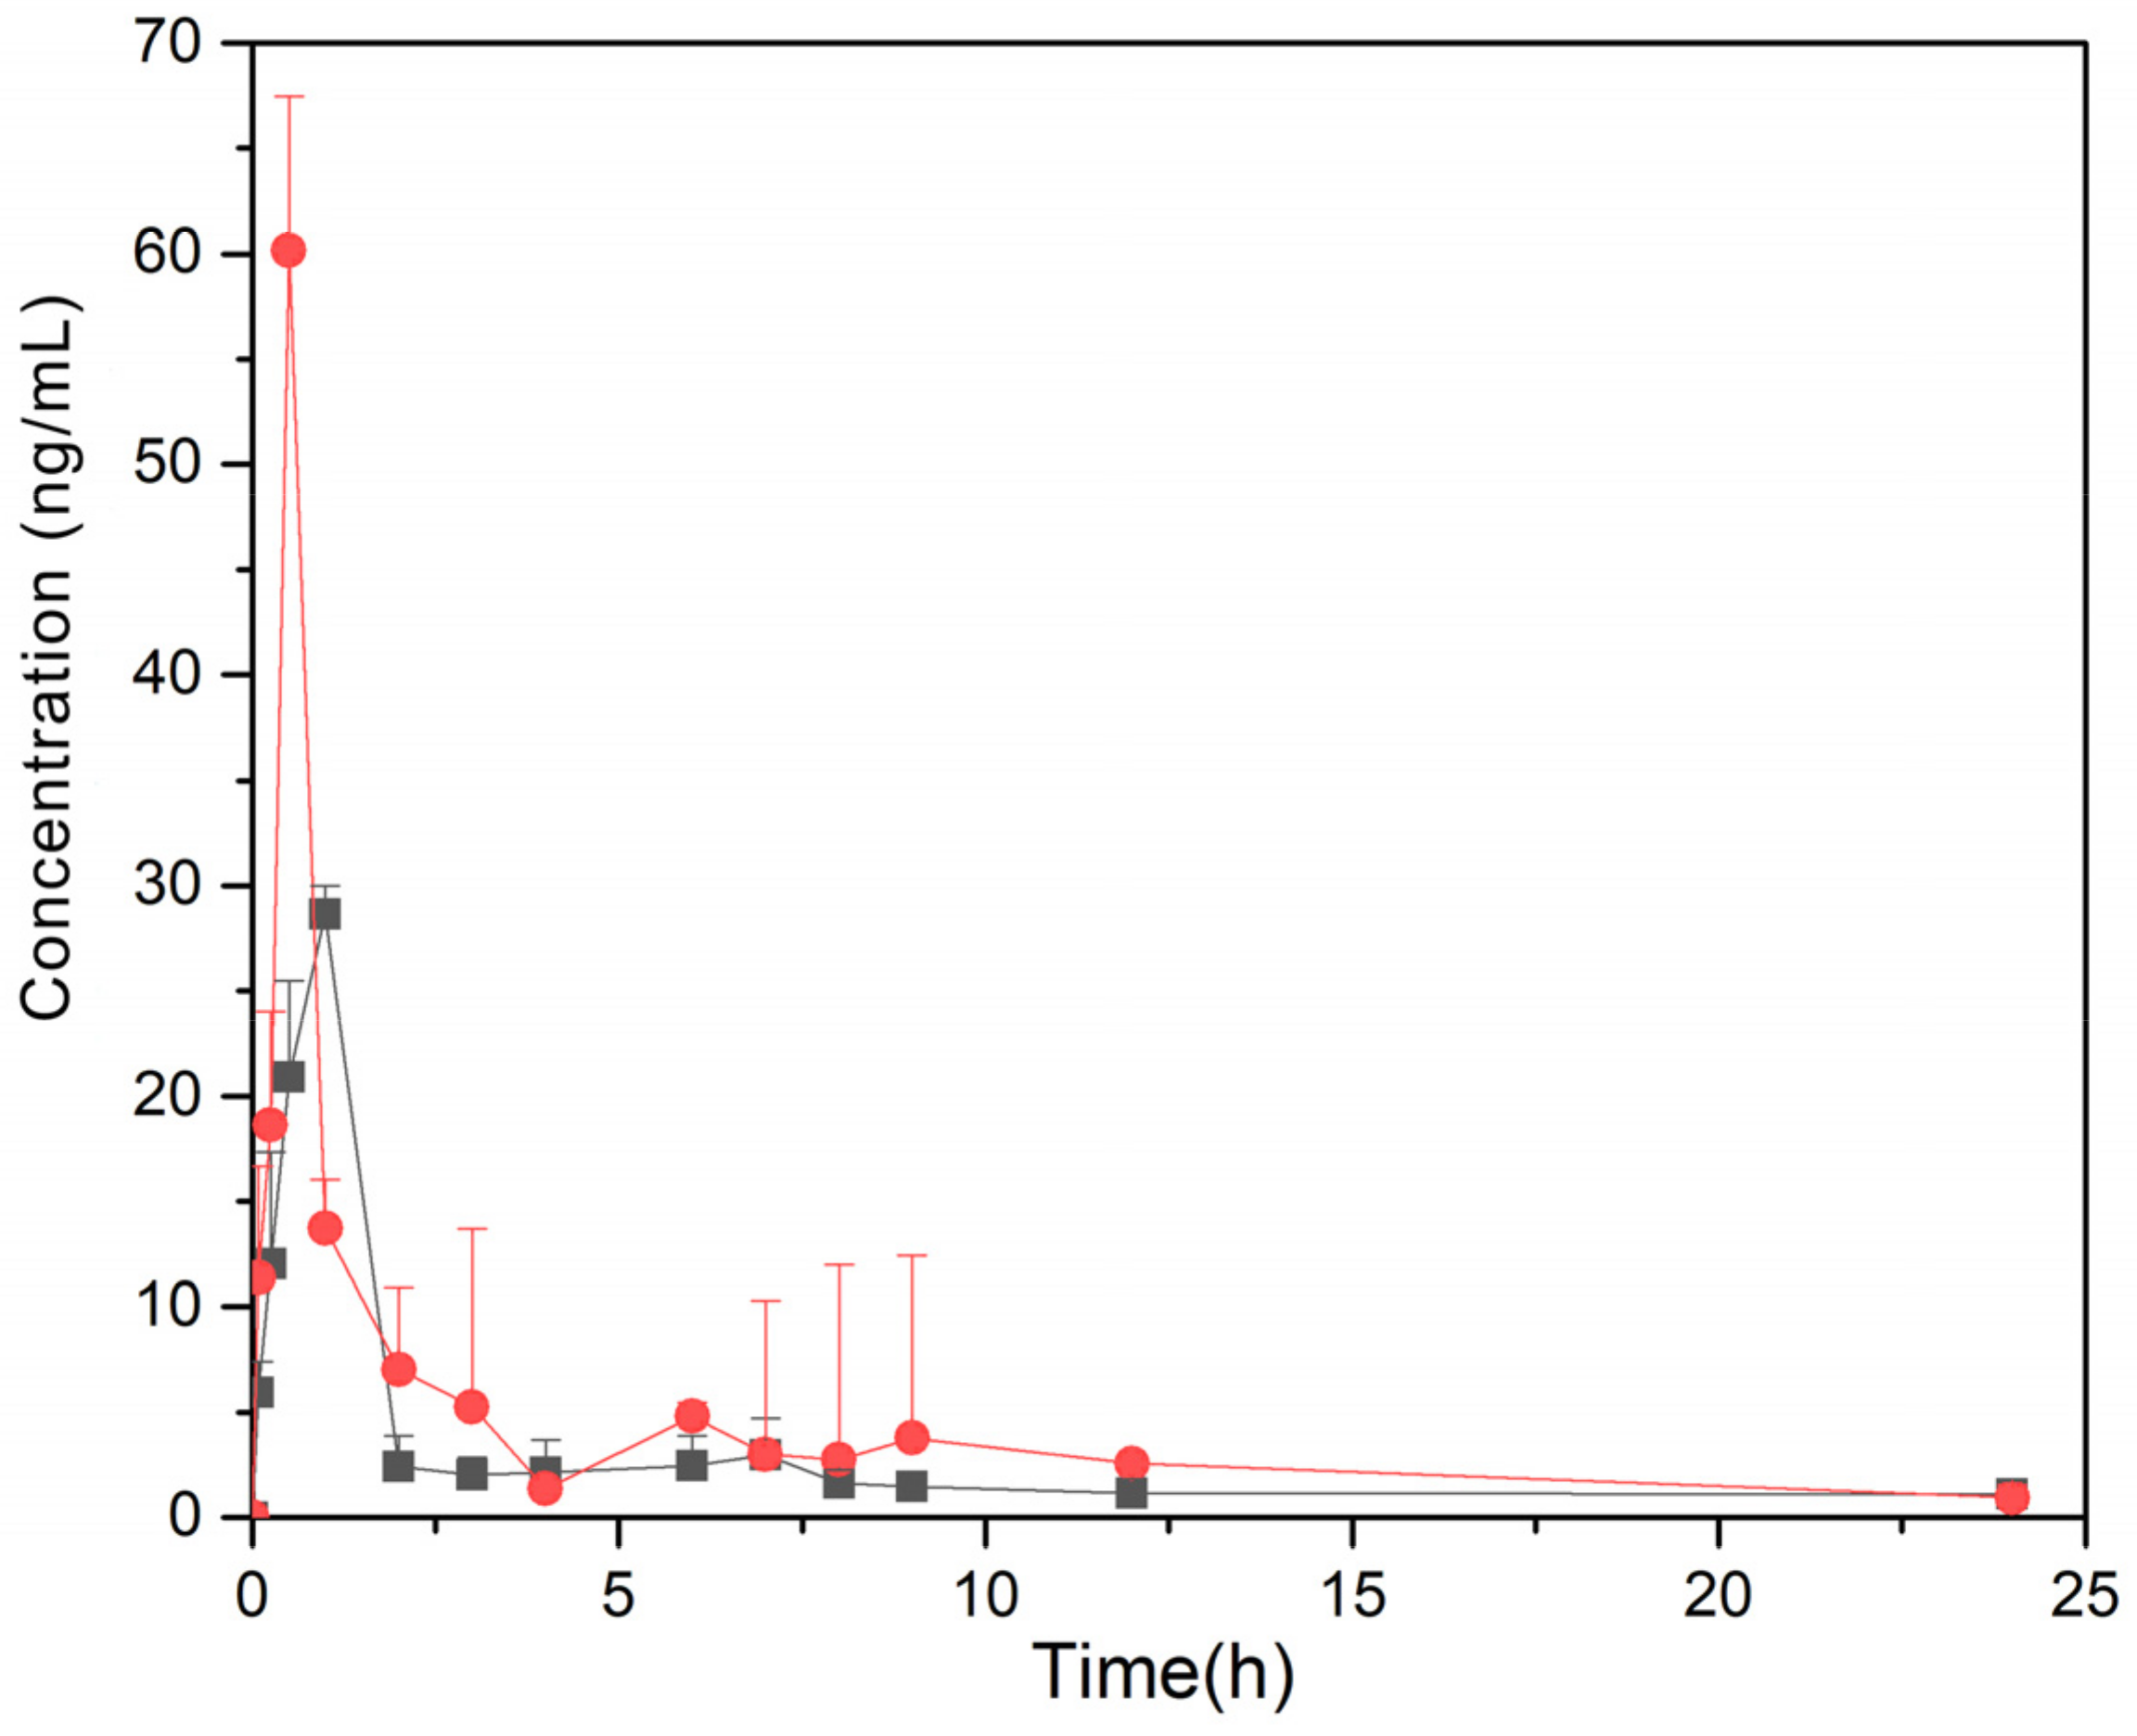
2.6.2. Pharmacokinetic Studies
3. Materials and Methods
3.1. Chemicals
3.2. Phase Solubility Test
3.3. Molecular Docking Simulation
3.4. Preparation and Optimization of IC
3.5. Dissolution Test
3.6. Confirmation of IC
3.6.1. Fourier Transform-Infrared Spectroscopy(FT-IR)
3.6.2. Differential Scanning Calorimetry (DSC)
3.6.3. X-ray Diffractometry (XRD)
3.6.4. Scanning Electron Microscopy (SEM)
3.6.5. HPLC Analysis of Re Levels
3.7. Bioavailability Studies
3.7.1. G-Re Administration and In Vivo Analysis
3.7.2. Sample Detection with LC-MS/MS
3.7.3. Pharmacokinetic Analysis
4. Conclusions
Author Contributions
Funding
Institutional Review Board Statement
Informed Consent Statement
Data Availability Statement
Conflicts of Interest
Sample Availability
References
- Shi, Z.Y.; Zeng, J.Z.; Wong, A.S.T. Chemical Structures and Pharmacological Profiles of Ginseng Saponins. Molecules 2019, 24, 2443. [Google Scholar] [CrossRef] [PubMed] [Green Version]
- Kang, O.J.; Kim, J.S. Comparison of Ginsenoside Contents in Different Parts of Korean Ginseng (Panax ginseng CA. Meyer). Prev. Nutr. Food. Sci. 2016, 21, 389–392. [Google Scholar] [CrossRef] [PubMed] [Green Version]
- Yang, G.; Ping, Z.; Shang-Fu, X.; Yi-Qi, L.; Jiang, D.; Dan-Li, Y. Ginsenoside Re inhibits PDGF-BB-induced VSMC proliferation via the eNOS/NO/cGMP pathway. Biomed. Pharmacother. 2019, 115, 108934. [Google Scholar]
- Kim, H.B.; Lim, K.H.; Kang, C.-W.; Kim, B.S.; Roh, Y.S.; Kwon, J.; Kim, S.; Ejaz, S.; Kim, J.-H. Influence of ginsenoside-Re against myocardial infarction in isolated heart. Mol. Cell. Toxicol. 2011, 7, 15–24. [Google Scholar] [CrossRef]
- Wang, Y.G.; Zima, A.V.; Ji, X.; Pabbidi, R.; Blatter, L.A.; Lipsius, S.L. Ginsenoside Re suppresses electromechanical alternans in cat and human cardiomyocytes. Am. J. Physiol. Heart. Circ. Physiol. 2008, 295, H851-9. [Google Scholar] [CrossRef]
- Yu, Y.; Sun, J.; Liu, J.; Wang, P.; Wang, C. Ginsenoside Re Preserves Cardiac Function and Ameliorates Left Ventricular Remodeling in a Rat Model of Myocardial Infarction. J. Cardiovasc. Pharmacol. 2020, 75, 91–97. [Google Scholar] [CrossRef]
- Wang, Q.W.; Yu, X.F.; Xu, H.L.; Jiang, Y.C.; Zhao, X.Z.; Sui, D.Y. Ginsenoside Re Attenuates Isoproterenol-Induced Myocardial Injury in Rats. Evid.-Based Complement. Altern. Med. 2018, 2018, 8637134. [Google Scholar] [CrossRef] [Green Version]
- Peng, D.; Wang, H.; Qu, C.; Xie, L.; Wicks, S.M.; Xie, J. Ginsenoside Re: Its chemistry, metabolism and pharmacokinetics. Chin. Med. 2012, 7, 1–6. [Google Scholar] [CrossRef] [Green Version]
- Qu, H.; Sai, J.; Wang, Y.; Sun, Y.; Zhang, Y.; Li, Y.; Zhao, Y.; Wang, Q. Establishment of an Enzyme-Linked Immunosorbent Assay and Application on Determination of Ginsenoside Re in Human Saliva. Planta Med. 2014, 80, 1143–1150. [Google Scholar] [CrossRef]
- Joo, K.M.; Lee, J.H.; Jeon, H.Y.; Park, C.W.; Hong, D.K.; Jeong, H.J.; Lee, S.J.; Lee, S.Y.; Lim, K.M. Pharmacokinetic study of ginsenoside Re with pure ginsenoside Re and ginseng berry extracts in mouse using ultra performance liquid chromatography/mass spectrometric method. J. Pharm. Biomed. Anal. 2010, 51, 278–283. [Google Scholar] [CrossRef]
- Merisko-Liversidge, E.; Liversidge, G.G. Nanosizing for oral and parenteral drug delivery: A perspective on formulating poorly-water soluble compounds using wet media milling technology. Adv. Drug Deliv. Rev. 2011, 63, 427–440. [Google Scholar] [CrossRef]
- Chouker, M.A.; Abdallah, H.; Zeiz, A.; El-Dakdouki, M.H. Host-Quest Inclusion Complex of Quinoxaline-1,4-Dioxide Derivative With 2-Hydroxypropyl-β-Cyclodextrin: Preparation, Characterization, and Antibacterial Activity. J. Mol. Struct. 2021, 1235, 130273. [Google Scholar] [CrossRef]
- Zhang, Y.M.; Liu, Y.H.; Liu, Y. Cyclodextrin-Based Multistimuli-Responsive Supramolecular Assemblies and Their Biological Functions. Adv. Mater. 2020, 32, 1806158. [Google Scholar] [CrossRef]
- Koontz, J.L.; Marcy, J.E. Formation of natamycin:cyclodextrin inclusion complexes and their characterization. J. Agric. Food Chem. 2003, 57, 7106–7110. [Google Scholar] [CrossRef]
- Liu, Z.; Zhou, W.; Li, J.; Zhang, H.; Dai, X.; Liu, Y.; Liu, Y. High-efficiency dynamic sensing of biothiols in cancer cells with a fluorescent beta-cyclodextrin supramolecular assembly. Chem. Sci. 2020, 11, 4791–4800. [Google Scholar] [CrossRef] [Green Version]
- Hussain, A.M.; Muhammad, I.; Arshad, M.; Patrick, K.; Aamir, J.; Shumaila, A.; Andreas, B.S. Thiolated cyclodextrins: Mucoadhesive and permeation enhancing excipients for ocular drug delivery. Int. J. Pharm. 2021, 599, 120451. [Google Scholar]
- Moya-Ortega, M.; Alvarez-Lorenzo, C.; Sigurdsson, H.H.; Concheiro, A.; Loftsson, T. γ-Cyclodextrin hydrogels and semi-interpenetrating networks for sustained delivery of dexamethasone. Carbohyd. Polym. 2010, 80, 900–907. [Google Scholar] [CrossRef]
- Nam, Y.H.; Le, H.T.; Rodriguez, I.; Kim, E.Y.; Tong, H.K. Enhanced antidiabetic efficacy and safety of the ginsenoside compound K in zebrafish by conjugation with β-cyclodextrin. J. Ginseng Res. 2016, 41, 103–112. [Google Scholar] [CrossRef] [Green Version]
- Igami, K.; Ozawa, M.; Inoue, S.; Iohara, D.; Miyazaki, T.; Shinoda, M.; Anraku, M.; Hirayama, F.; Uekama, K. The formation of an inclusion complex between a metabolite of ginsenoside, compound K and gamma-cyclodextrin and its dissolution characteristics. J. Pharm. Pharmacol. 2016, 68, 646–654. [Google Scholar] [CrossRef]
- Floresta, G.; Punzo, F.; Rescifina, A. Supramolecular host-guest interactions of pseudoginsenoside F11 with beta- and gamma-cyclodextrin: Spectroscopic/spectrometric and computational studies. J. Mol. Struct. 2019, 1195, 387–394. [Google Scholar] [CrossRef]
- Lee, P.S.; Han, J.Y.; Song, T.W.; Sung, J.H.; Kwon, O.S.; Song, S.; Chung, Y.B. Physicochemical characteristics and bioavailability of a novel intestinal metabolite of ginseng saponin (IH901) complexed with beta-cyclodextrin. Int. J. Pharm. 2006, 316, 29–36. [Google Scholar] [CrossRef] [PubMed]
- Nikolenko, M.V.; Vasylenko, K.V.; Myrhorodska, V.D.; Kostyniuk, A.; Likozar, B. Synthesis of Calcium Orthophosphates by Chemical Precipitation in Aqueous Solutions: The Effect of the Acidity, Ca/P Molar Ratio, and Temperature on the Phase Composition and Solubility of Precipitates. Processes 2020, 8, 1009. [Google Scholar] [CrossRef]
- Valdes-Tresanco, M.S.; Valdes-Tresanco, M.E.; Valiente, P.A.; Moreno, E. AMDock: A versatile graphical tool for assisting molecular docking with Autodock Vina and Autodock4. Biol. Direct. 2020, 15, 12. [Google Scholar] [CrossRef] [PubMed]
- Stepniak, A.; Belica-Pacha, S.; Rozalska, S.; Dlugonski, J.; Urbaniak, P.; Palecz, B. Study on a host-guest interaction of p-cyclodextrin with tebuconazole in water. J. Mol. Liq. 2015, 211, 288–293. [Google Scholar] [CrossRef]
- Hill, A.D.; Reilly, P.J. A Gibbs free energy correlation for automated docking of carbohydrates. J. Comput. Chem. 2008, 29, 1131–1141. [Google Scholar] [CrossRef]
- Zhu, F.-D.; Zhang, Z.-H.; Chi, S.-M.; Chen, S.-L.; Lang, Y.-F.; Zhu, H.-Y.; Lei, Z.; Zhao, Y. Experimental and molecular docking investigation of the inclusion complexes between 20(S)-protopanaxatriol and four modified β-cyclodextrins. Carbohydr. Res. 2021, 500, 108256. [Google Scholar] [CrossRef]
- Ying, A.; Yu, Q.-T.; Guo, L.; Zhang, W.-S.; Liu, J.-F.; Li, Y.; Song, H.; Li, P.; Qi, L.-W.; Ge, Y.-Z.; et al. Structural-Activity Relationship of Ginsenosides from Steamed Ginseng in the Treatment of Erectile Dysfunction. Am. J. Chin. Med. 2018, 46, 137–155. [Google Scholar] [CrossRef]
- Gao, S.; Liu, Y.; Jiang, J.; Li, X.; Zhao, L.; Fu, Y.; Ye, F. Encapsulation of thiabendazole in hydroxypropyl-beta-cyclodextrin nanofibers via polymer-free electrospinning and its characterization. Pest. Manag. Sci. 2020, 76, 3264–3272. [Google Scholar] [CrossRef]
- Liu, M.; Zheng, Y.; Wang, C.; Xie, J.; Wang, B.; Wang, Z.; Han, J.; Sun, D.; Niu, M. Improved stability of (+)-catechin and (−)-epicatechin by complexing with hydroxypropyl-beta-cyclodextrin: Effect of pH, temperature and configuration. Food Chem. 2016, 196, 148–154. [Google Scholar] [CrossRef]
- Roy, N.; Bomzan, P.; Roy, M.N. Probing Host-Guest Inclusion Complexes of Ambroxol Hydrochloride with α-&β-Cyclodextrins by Physicochemical Contrivance Subsequently Optimized by Molecular Modeling Simulations. Chem. Phys. Lett. 2020, 748, 137372. [Google Scholar]
- Harata, K. Structural Aspects of Stereodifferentiation in the Solid State. Chem. Rev. 1998, 98, 1803–1828. [Google Scholar] [CrossRef]
- Hancock, B.C.; Zografi, G. Characteristics and significance of the amorphous state in pharmaceutical systems. J. Pharm. Sci. 1997, 86, 1–12. [Google Scholar] [CrossRef]
- Esclusa-Diaz, M.T.; Gayo-Otero, M.; Pérez-Marcos, M.B.; Vila-Jato, J.L.; Torres-Labandeira, J.J. Preparation and evaluation of ketoconazole-β-cyclodextrin multicomponent complexes. Int. J. Pharm. 1996, 142, 183–187. [Google Scholar] [CrossRef]
- Zhang, J.Q.; Jiang, K.M.; An, K.; Ren, S.H.; Xie, X.G.; Jin, Y.; Lin, J. Novel water-soluble fisetin/cyclodextrins inclusion complexes: Preparation, characterization, molecular docking and bioavailability. Carbohydr. Res. 2015, 418, 20–28. [Google Scholar] [CrossRef]
- Sadaquat, H.; Akhtar, M. Comparative effects of β-cyclodextrin, HP-β-cyclodextrin and SBE7-β-cyclodextrin on the solubility and dissolution of docetaxel via inclusion complexation. J. Incl. Phenom. Macrocycl. 2020, 96, 333–351. [Google Scholar] [CrossRef]
- Nikolic, I.L.; Savic, I.M.; Popsavin, M.M.; Rakic, S.J.; Mihajilov-Krstev, T.M.; Ristic, I.S.; Eric, S.P.; Savic-Gajic, I.M. Preparation, characterization and antimicrobial activity of inclusion complex of biochanin A with (2-hydroxypropyl)-beta-cyclodextrin. J. Pharm. Pharmacol. 2018, 70, 1485–1493. [Google Scholar] [CrossRef]
- Shityakov, S.; Salmas, R.E.; Durdagi, S.; Roewer, N.; Frster, C.; Broscheit, J. Solubility profiles, hydration and desolvation of curcumin complexed with γ-cyclodextrin and hydroxypropyl-γ-cyclodextrin. J. Mol. Struct. 2016, 1134, 91–98. [Google Scholar] [CrossRef]
- dos Santos, S.M.; Weber, C.-C.; Franke, C.; Mueller, W.E.; Eckert, G.P. Cholesterol: Coupling between membrane microenvironment and ABC transporter activity. Biochem. Biophys. Res. Commun. 2007, 354, 216–221. [Google Scholar] [CrossRef]
- Yong, Y.H.; Dong, C.S.; Yoon, S.N.; Cho, B.-K. Characterization, stability, and pharmacokinetics of sibutramine/β-cyclodextrin inclusion complex. J. Ind. Eng. Chem. 2012, 18, 1412–1417. [Google Scholar]


| CD | S0 (×10−3M) | Slope | Ks (×103M−1) | 1/Slope | R2 | △→G (kJ/mol) |
|---|---|---|---|---|---|---|
| α-CD | 0.392 | 0.0086 | 0.022 | 116.28 | 0.9938 | −7.659 |
| β-CD | 0.391 | 0.1935 | 0.612 | 5.16 | 0.9933 | −15.889 |
| γ-CD | 0.391 | 0.8494 | 14.41 | 1.18 | 0.9974 | −23.736 |
| Host | Side | Insertion Position | Affinity Energy (kcal /mol) | Bond Numbers | O-O Intermolecular Distance (Å) |
|---|---|---|---|---|---|
| α-CD | wide | Glu-C20 | −4.70 | 6 | 2.5, 2.8, 2.4, 2.5, 2.5, 2.3 |
| β-CD | wide | Glu-C6 | −5.10 | 7 | 3.3, 3.1, 3.1, 2.9, 3.2, 2.8, 3.2 |
| γ-CD | wide | Glu-C20 | −6.70 | 4 | 1.9, 2.1, 2.0, 2.4 |
| Parameter Values | |||
|---|---|---|---|
| Parameters | Measuring Unit | G-Re | G-Re-γ-CD |
| Cmax | ng/mL | 32.237 ± 8.152 | 60.176 ± 10.296 * |
| Tmax | h | 1.023 ± 0.036 | 0.509 ± 0.042 * |
| T1/2 | h | 12.169 ± 1.557 | 14.164 ± 8.060 * |
| AUC0–24h | ng·h/mL | 113.031 ± 44.6 | 175.426 ± 67.426 * |
| AUC0–∞ | ng·h/mL | 129.907 ± 54.1 | 219.945 ± 127.918 * |
| MRT | h | 5.147 ± 0.968 | 6.976 ± 1.465 * |
| CLt | L/h | 2.401 ± 0.52 | 1.370 ± 0.28 |
| Vdss | L/kg | 13.691 ± 3.74 | 8.135 ± 1.47 * |
| F | % | — | 171.395 ± 48.89 * |
Publisher’s Note: MDPI stays neutral with regard to jurisdictional claims in published maps and institutional affiliations. |
© 2021 by the authors. Licensee MDPI, Basel, Switzerland. This article is an open access article distributed under the terms and conditions of the Creative Commons Attribution (CC BY) license (https://creativecommons.org/licenses/by/4.0/).
Share and Cite
Li, H.; Zhang, G.; Wang, W.; Chen, C.; Jiao, L.; Wu, W. Preparation, Characterization, and Bioavailability of Host-Guest Inclusion Complex of Ginsenoside Re with Gamma-Cyclodextrin. Molecules 2021, 26, 7227. https://doi.org/10.3390/molecules26237227
Li H, Zhang G, Wang W, Chen C, Jiao L, Wu W. Preparation, Characterization, and Bioavailability of Host-Guest Inclusion Complex of Ginsenoside Re with Gamma-Cyclodextrin. Molecules. 2021; 26(23):7227. https://doi.org/10.3390/molecules26237227
Chicago/Turabian StyleLi, Hui, Guolei Zhang, Wei Wang, Changbao Chen, Lili Jiao, and Wei Wu. 2021. "Preparation, Characterization, and Bioavailability of Host-Guest Inclusion Complex of Ginsenoside Re with Gamma-Cyclodextrin" Molecules 26, no. 23: 7227. https://doi.org/10.3390/molecules26237227
APA StyleLi, H., Zhang, G., Wang, W., Chen, C., Jiao, L., & Wu, W. (2021). Preparation, Characterization, and Bioavailability of Host-Guest Inclusion Complex of Ginsenoside Re with Gamma-Cyclodextrin. Molecules, 26(23), 7227. https://doi.org/10.3390/molecules26237227