Article

Effects of Variety and Growing Location on Physicochemical Properties of Starch from Sweet Potato Root Tuber

1
Key Laboratory of Crop Genetics and Physiology of Jiangsu Province/Jiangsu Key Laboratory of Crop Genomics and Molecular Breeding, Yangzhou University, Yangzhou 225009, China
2
Co-Innovation Center for Modern Production Technology of Grain Crops of Jiangsu Province/Joint International Research Laboratory of Agriculture & Agri-Product Safety of the Ministry of Education, Yangzhou University, Yangzhou 225009, China
3
Institute of Food Crops, Jiangsu Academy of Agricultural Sciences, Nanjing 210014, China
*
Author to whom correspondence should be addressed.
L.S. and Y.L. contributed equally to this work.
Molecules 2021, 26(23), 7137; https://doi.org/10.3390/molecules26237137
Submission received: 3 November 2021 / Revised: 20 November 2021 / Accepted: 23 November 2021 / Published: 25 November 2021
(This article belongs to the Special Issue Feature Papers in Food Chemistry)

Abstract

:
Three sweet potato varieties with purple-, yellow-, and white-fleshed root tubers were planted in four growing locations. Starches were isolated from their root tubers, their physicochemical properties (size, iodine absorption, amylose content, crystalline structure, ordered degree, lamellar thickness, swelling power, water solubility, and pasting, thermal and digestion properties) were determined to investigate the effects of variety and growing location on starch properties in sweet potato. The results showed that granule size (D[4,3]) ranged from 12.1 to 18.2 μm, the iodine absorption parameters varied from 0.260 to 0.361 for OD620, from 0.243 to 0.326 for OD680 and from 1.128 to 1.252 for OD620/550, and amylose content varied from 16.4% to 21.2% among starches from three varieties and four growing locations. Starches exhibited C-type X-ray diffraction patterns, and had ordered degrees from 0.634 to 0.726 and lamellar thicknesses from 9.72 to 10.21 nm. Starches had significantly different swelling powers, water solubilities, pasting viscosities, and thermal properties. Native starches had rapidly digestible starch (RDS) from 2.2% to 10.9% and resistant starch (RS) from 58.2% to 89.1%, and gelatinized starches had RDS from 70.5% to 81.4% and RS from 10.8% to 23.3%. Two-way ANOVA analysis showed that starch physicochemical properties were affected significantly by variety, growing location, and their interaction in sweet potato.

1. Introduction

Sweet potato (Ipomoea batatas), an essential root tuber starchy crop, is widely cultivated in over 100 countries. There are over 90 million tonnes in annual production [1]. The root tuber contains about 50–80% starch in dry basis (d.b.) [2,3]. Sweet potato starch is widely used to make conventional noodle, vermicelli, thickening agent, and syrup in processed foods, and can also produce film, ethanol, citric acid, lactic acid, and other chemicals in non-food industries [4,5]. The physicochemical properties of starch determine its utilizations in food and nonfood industries [3]. Therefore, the research of sweet potato starch has been getting great attentions.
Due to artificial selection, natural hybrids, and mutations, there are hundreds of varieties or lines of sweet potato [4]. Their root tubers have different flesh colors [2,6]. Starches from different varieties have been investigated for their physicochemical properties and utilizations in sweet potato [2,3,7,8,9]. Though starch content in root tuber exhibits significant differences among different colored varieties, starch properties are not affected by the color of root tuber [2,8].
Effects of plant growing condition on starch properties have been reported in sweet potato [10,11,12,13]. Crystalline structure of starch significantly changes when sweet potato is planted in soils with different temperatures. A-type starch forms and accumulates in root tuber grown in soil with high temperature, and B-type crystallinity gradually does in root tuber with the decrease of soil temperature [11]. Recently, Duan et al. [10] planted one sweet potato variety in soils with different treatments of nitrogen fertilizer, and found that nitrogen treatment can change starch physicochemical properties. However, Noda et al. [13] found that starch properties do not significantly change in four sweet potato varieties grown in different levels of fertilizer. Guo et al. [12] planted three white, three yellow, and three purple fleshed varieties in soils with three treatments of nitrogen fertilizer, and found that nitrogen treatments have different effects on starch properties among different varieties, indicating that different genotypes have different responses to nitrogen fertilizer treatment.
In recent years, the effects of genotype and growing environment on starch characteristics have been studied in rice [14,15], wheat [16], potato [17,18], and cassava [19]. The effects exhibit some differences among different references or crops. For examples, Li and Liu [14] reported that components and chain-length distribution of rice starch are affected significantly by variety, growing location, and their interaction, but Sar et al. [15] found that the structures of amylose and amylopectin are affected only by varieties but have no significant relationship with growing location and the interaction of variety and growing location. Pelpolage et al. [18] reported that thermal properties and pasting peak, breakdown and final viscosities of potato starch are significantly affected by variety, growing location, and their interaction, but Ahmed et al. [17] found that gelatinization conclusion temperature, gelatinization enthalpy, and pasting final viscosity of potato starch are not affected by growing location. In addition, Nhan and Copeland [16] reported that thermal and pasting properties of wheat starch are affected significantly by variety and growing location. For cassava starch, some physicochemical properties are affected significantly by variety, or growing location, or both variety and growing location, or the interaction of variety and growing location [19]. Sweet potato is extensively grown in the tropical and subtropical areas [6]. However, the effects of growing location on starch characteristics are unclear in sweet potato, restricting the utilization of sweet potato variety in different regions.
Therefore, the objective of this work was to study the effect of sweet potato variety and growing location on the changes of starch properties. To achieve this objective, three sweet potato varieties with purple-, yellow-, and white-fleshed root tubers planted in four different growing locations were collected and analyzed their physicochemical properties (size, iodine absorption, amylose content, crystalline structure, ordered degree, lamellar thickness, swelling power, water solubility, and pasting, thermal and digestion properties).

2. Results and Discussion

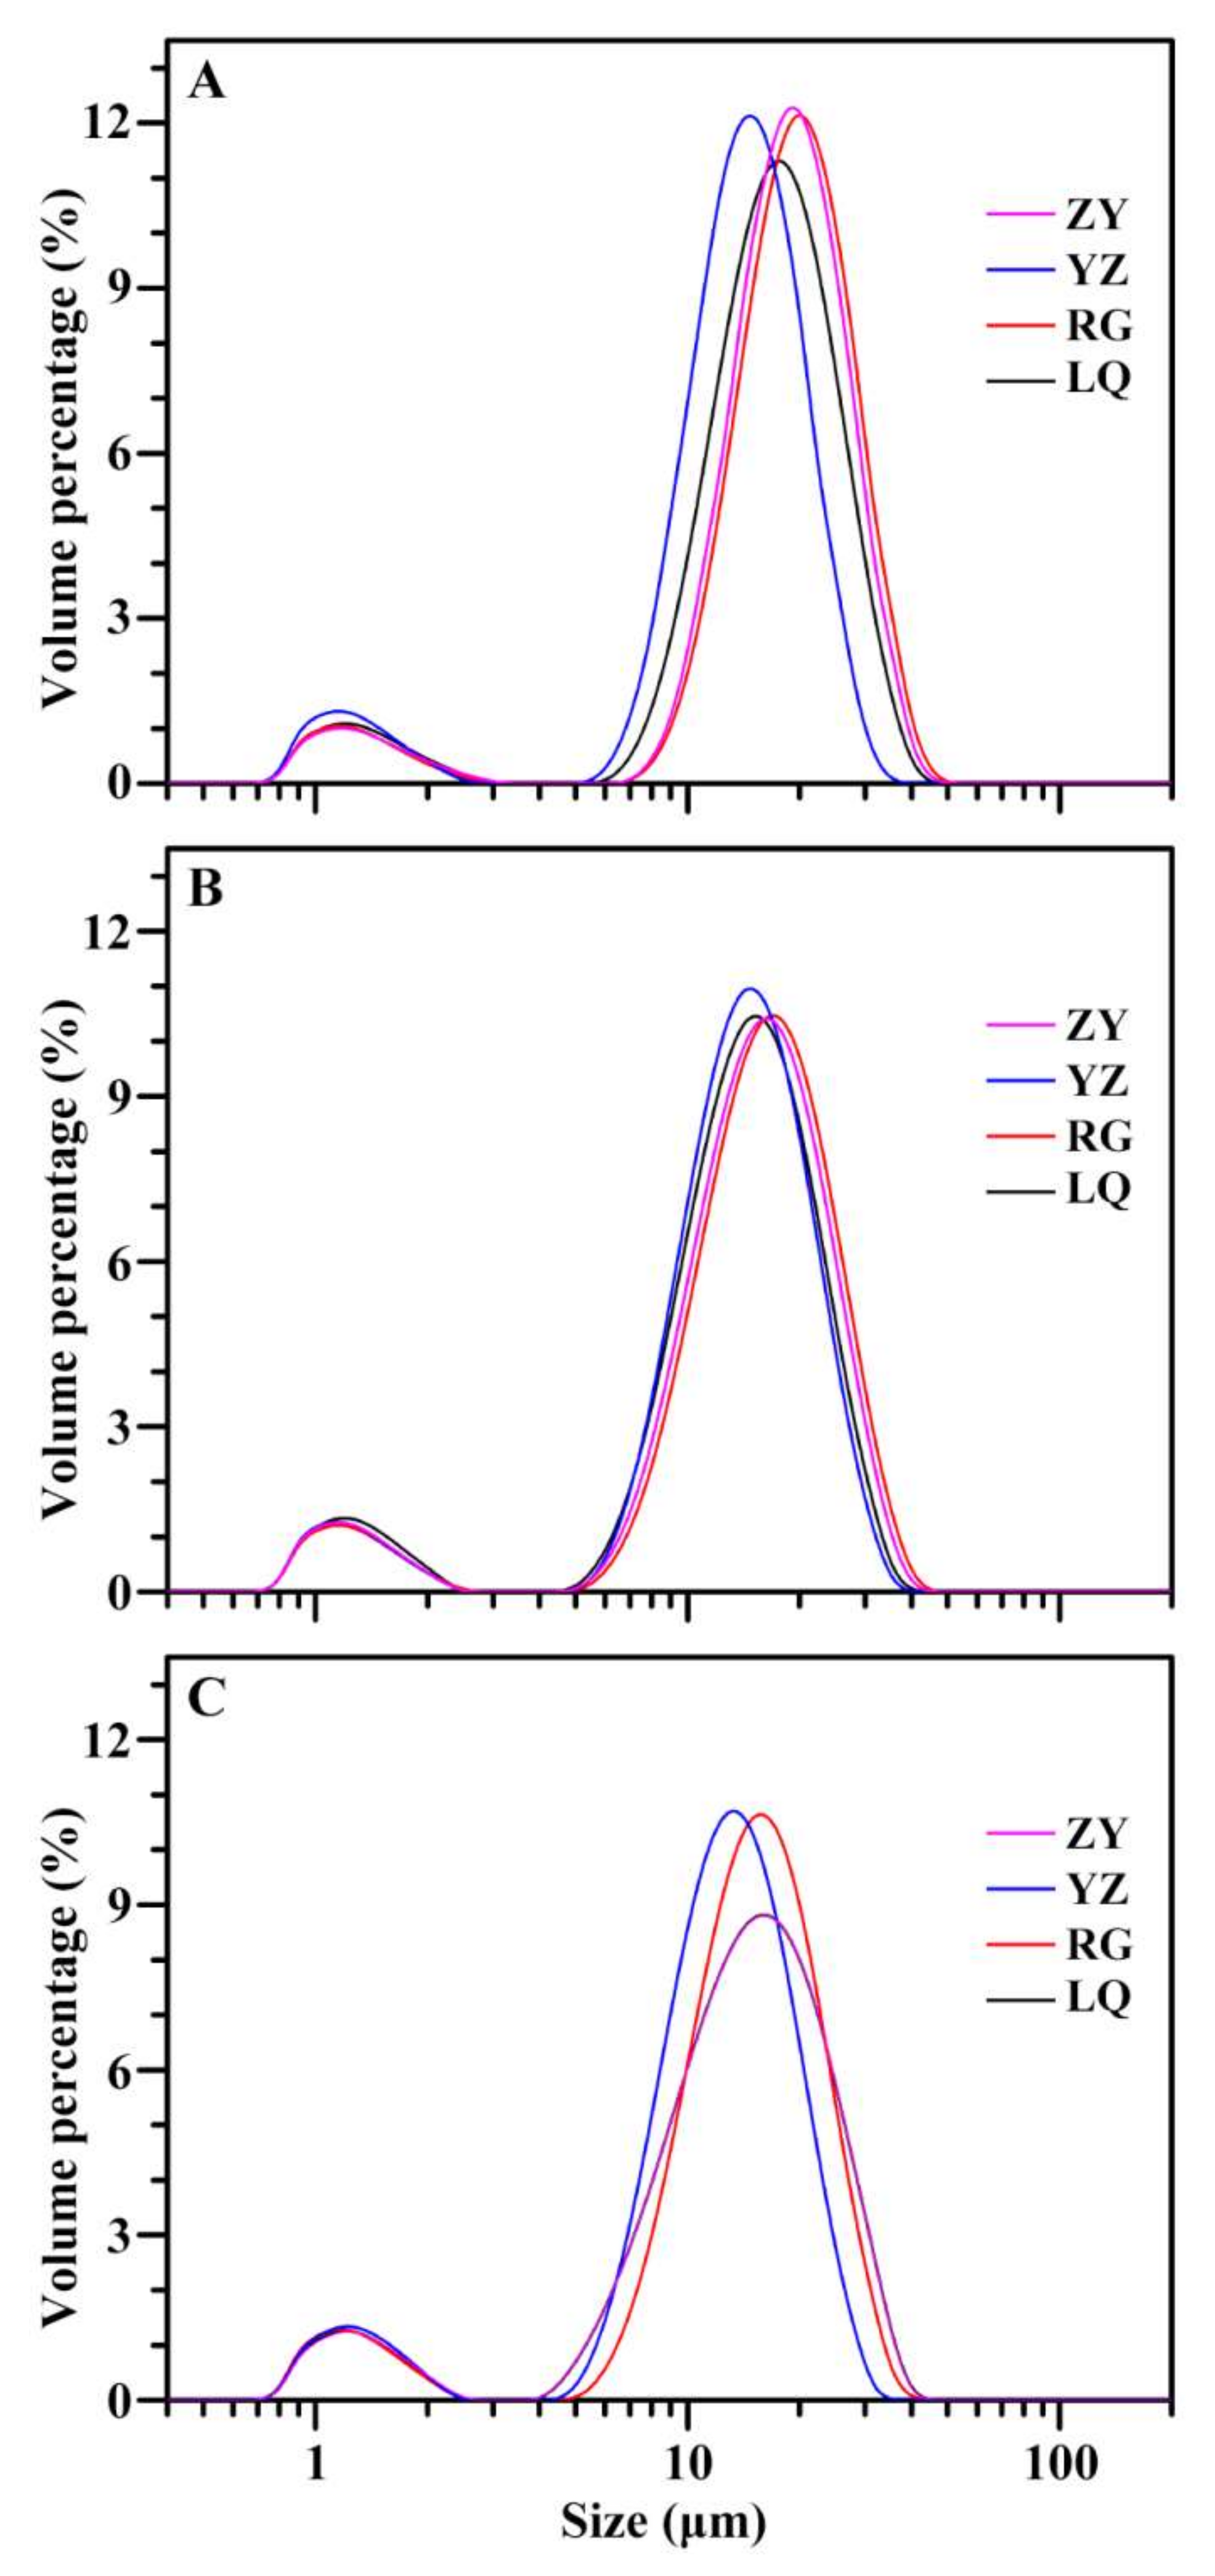
2.1. Effects of Variety and Growing Location on Starch Size

Starches from three varieties in four growing locations followed similar size distribution patterns (Figure 1). Though there were two granule populations about from 0.8 to 3 μm and from 6 to 40 μm, the small-sized granules had very low weight percentage. Similar phenomenon has been reported in previous papers [2,9]. In the present research, the volume-weighted mean diameter (D[4,3]) was used to reflect the granule size (Table 1). Among four growing locations, granule size varied from 13.33 μm (YZ) to 18.22 μm (RG), from 13.53 μm (YZ) to 15.39 μm (RG), and from 12.11 μm (YZ) to 14.19 μm (RG) for Ningzishu 1, Sushu 16, and Sushu 28, respectively. Three sweet potato varieties all exhibited the largest starch size in growing location of RG and the smallest starch size in growing location of YZ. Two-way ANOVA analysis showed that starch size was significantly affected by variety, growing location, and their interaction (p < 0.001) (Table 1). Abegunde et al. [20] found that starch size is affected by plant physiology except variety and growing condition in sweet potato. Similar conclusion is also given in potato [18]. Guo et al. [2] reported that starches have significantly different granule sizes among different colored sweet potato varieties grown in the same environment, and the starch size is determined mainly by genotype but has no relationship with fleshed color.

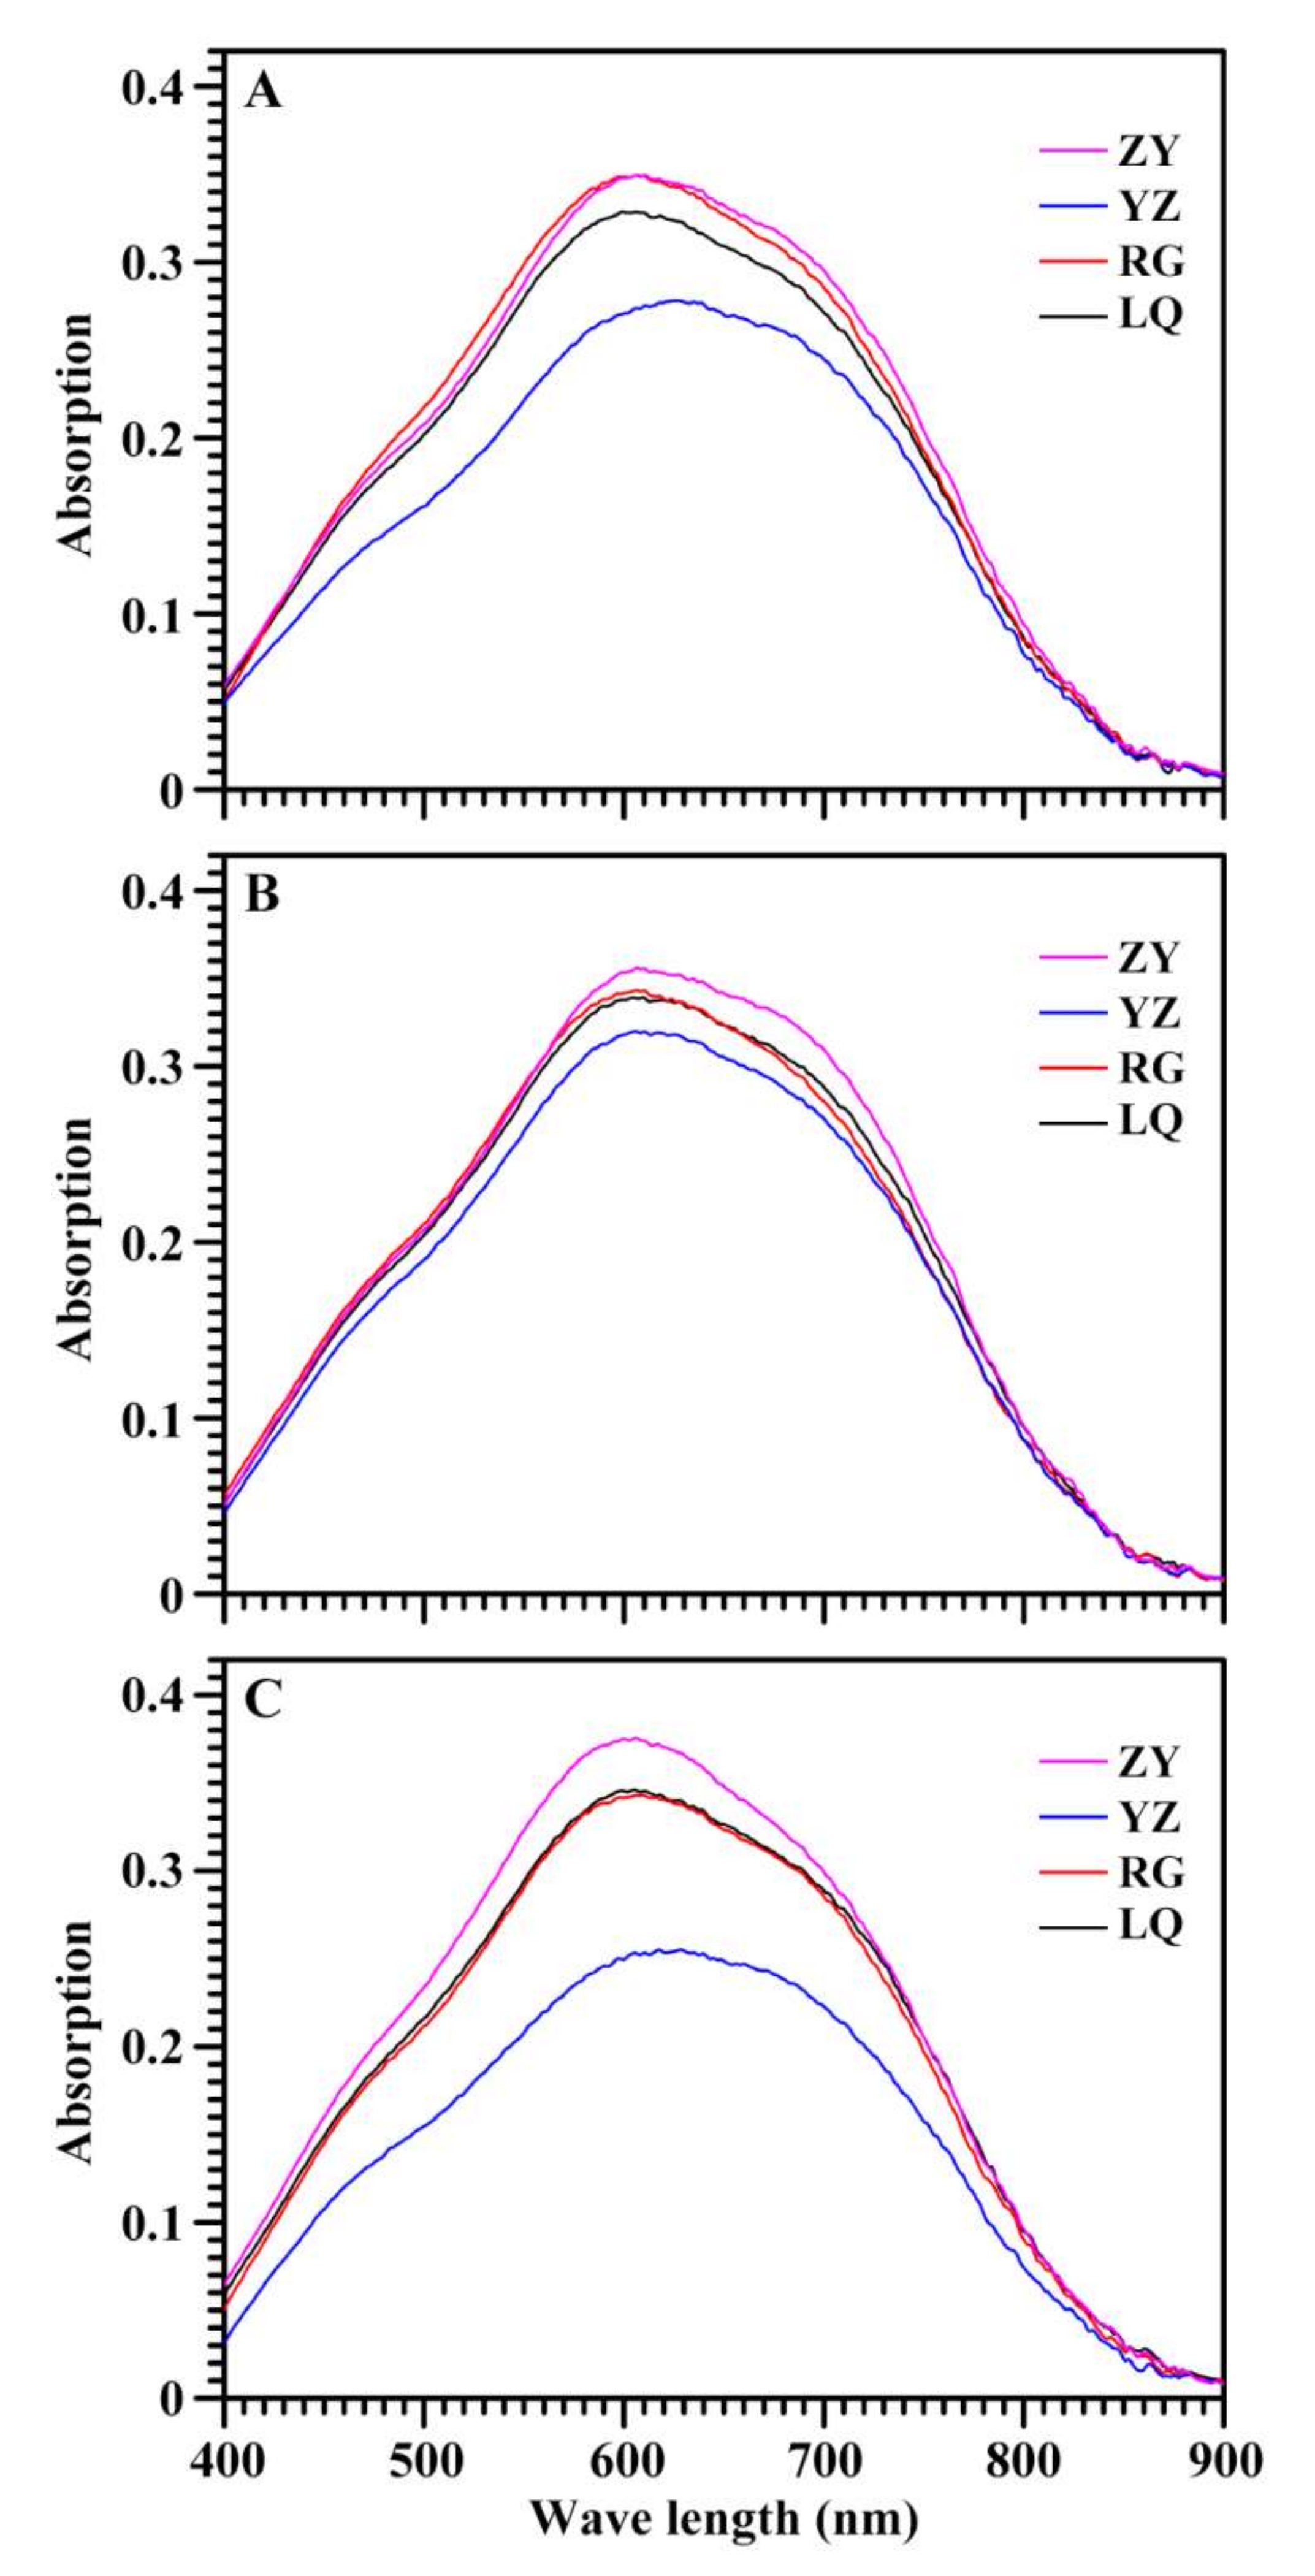
2.2. Effects of Variety and Growing Location on Starch–Iodine Absorption Parameters

The starch–iodine absorption spectrum is presented in Figure 2, and spectrum parameters including OD620, OD680, OD620/550 and the maximum absorption wavelength (λmax) are presented in Table 1. The OD620 indicates the iodine-binding of amylose and amylopectin long branch-chains, and the OD680 (also called blue value) reflects the iodine-binding capacity of starch [21]. The OD620 of starch–iodine complex ranged from 0.275 (YZ) to 0.361 (ZY), from 0.322 (YZ) to 0.353 (ZY), and from 0.260 (YZ) to 0.347 (ZY) for Ningzishu 1, Sushu 16, and Sushu 28, respectively. The OD680 ranged from 0.257 (YZ) to 0.321 (ZY), from 0.294 (YZ) to 0.326 (ZY), and from 0.243 (YZ) to 0.316 (ZY) for Ningzishu 1, Sushu 16, and Sushu 28, respectively, indicating that sweet potato grown in YZ and ZY had the lowest and the highest starch–iodine binding ability, respectively. The OD620/550, absorption ratio of OD620 and OD550, is an index reflecting the relative proportion of long molecule chains in starch [21]. The OD620/550 varied from 1.128 (ZY) to 1.232 (YZ), from 1.193 (RG) to 1.235 (ZY), and from 1.175 (LQ) to 1.252 (YZ) for Ningzishu 1, Sushu 16, and Sushu 28, respectively. The λmax among four growing locations varied from 606.1 nm (RG) to 625.6 nm (YZ), from 609.2 nm (YZ) to 613.9 nm (LQ), and from 606.4 nm (ZY) to 629.0 nm (YZ) for Ningzishu 1, Sushu 16, and Sushu 28, respectively. Two-way ANOVA analysis showed that starch–iodine absorption parameters of OD620, OD680, OD620/550 and λmax were significantly affected by variety, growing location, and their interaction (p < 0.001) (Table 1). Both amylose/amylopectin ratio and amylopectin structure determine the starch–iodine absorption parameters [22]. Starch is synthesized by some starch synthesis-related enzymes. The expression regulation of these enzymes is influenced by genotype and growing condition of plant, especially for environment temperature [23,24,25].

2.3. Effects of Variety and Growing Location on Amylose Content of Starch

The AC determines starch physicochemical properties, and can be measured with iodine colorimetry and concanavalin A precipitation [21]. The iodine colorimetry is often used to evaluate the apparent amylose content due to that iodine can bind amylopectin long branch-chains to overestimate AC. The concanavalin A can specifically bind with amylopectin and form precipitation. The ratio of amylose to both amylose and amylopectin measured by concanavalin A precipitation is usually called true amylose content due to being not influenced by starch purity and amylopectin long branch-chains [21]. In this study, the AC was measured using concanavalin A precipitation method (Table 1). The AC ranged from 16.4% (LQ) to 17.7% (ZY), from 18.4% (LQ) to 21.2% (ZY), and from 18.3% (YZ) to 21.1% (RG) for Ningzishu 1, Sushu 16, and Sushu 28, respectively. Two-way ANOVA analysis showed that AC was significantly affected by variety, growing location, and their interaction (Table 1). Some researchers reported that both genotype and environment contribute significantly to the variability in AC in wheat [26] and rice [14]. Amylose is synthesized by granule-bound starch synthase I (GBSSI) encoded by Waxy (Wx) in plant storage tissue. Many Wx alleles have been reported in cereal crops. They are responsible for significantly different expressions and activities of GBSSI, leading to starches with different ACs among different varieties [27]. Therefore, it is easy to understand that amylose is determined by genotype. Some references reported that AC has no significant effect from the growing location, and is influenced only by genotype in potato [18], cassava [19], and rice [15]. However, more references reported that Wx expression and GBSSI activity are influenced by environment temperature. The low temperature increases amylose synthesis, and high temperature decreases amylose synthesis [23,24]. In the present study, four growing locations had different temperatures during sweet potato starch development (Figure 3). Therefore, AC is affected by variety, growing location, and their interaction in sweet potato.

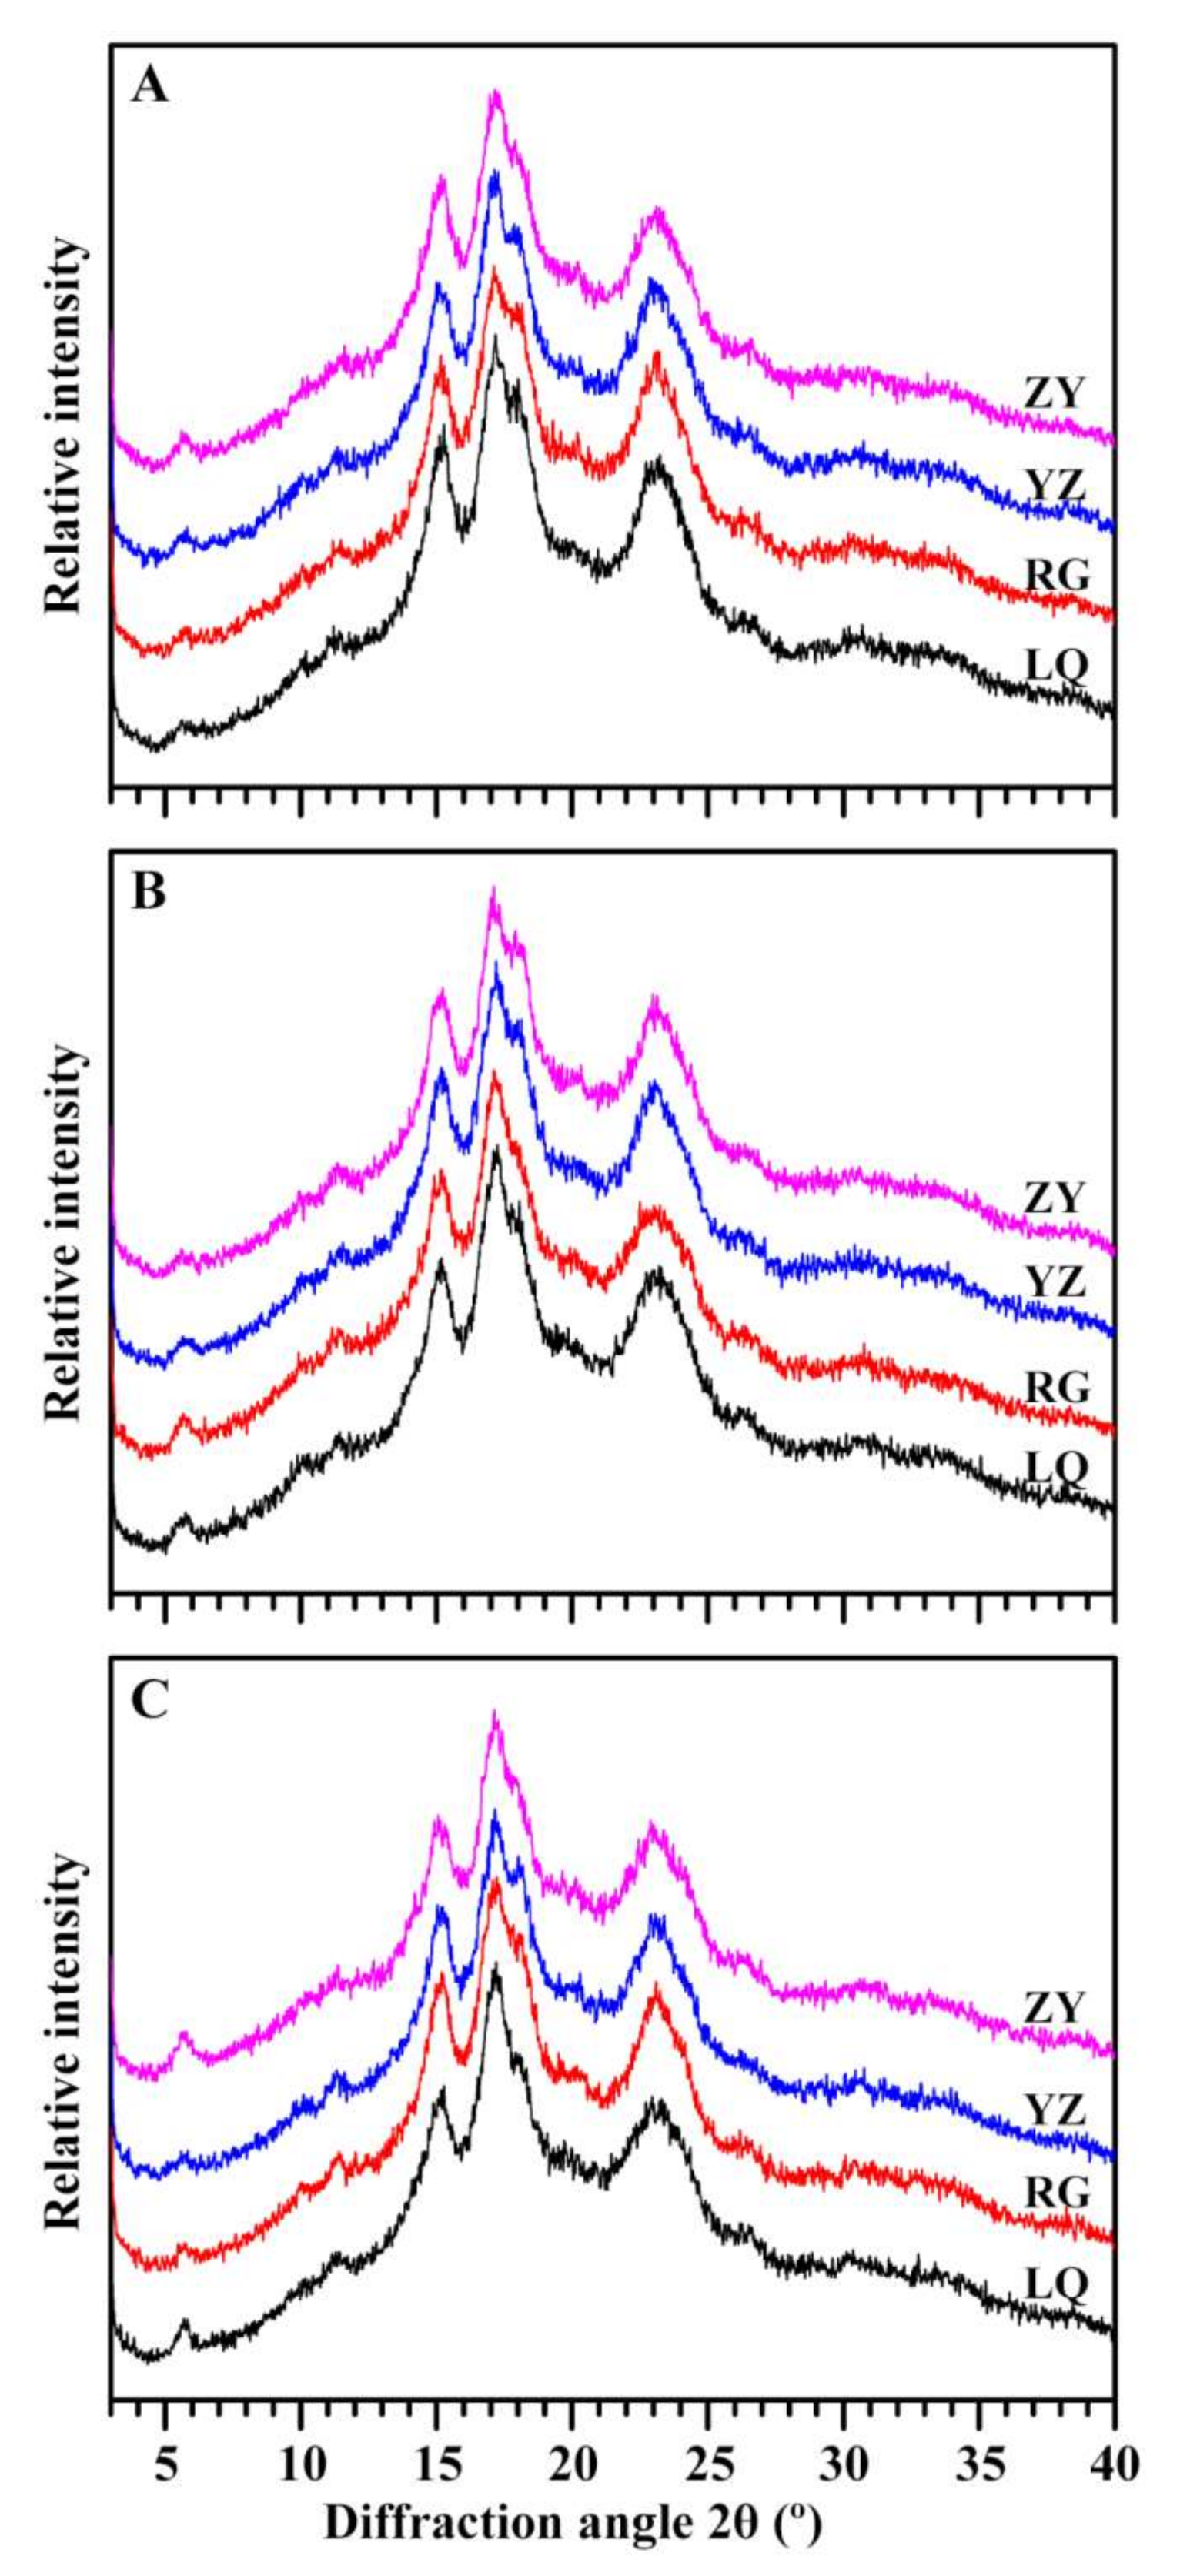
2.4. Effects of Variety and Growing Location on Crystalline Structure of Starch

The XRD patterns of starches from three sweet potato varieties and four growing locations are shown in Figure 4. Amylopectin in plants can form A- and B-type crystallinities. Native starches from botany sources are usually divided into A-, B-, and C-type according to their crystallinity types [28]. A- and B-type starch contains only A- and B-type crystallinity, respectively, but C-type starch contains both A- and B-type crystallinities. According to the proportion of A- and B-type crystallinity from high to low, C-type starch is usually divided into CA-, CC-, and CB-type [28]. Though XRD patterns of starches from Ningzishu 1, Sushu 16, and Sushu 28 grown in LQ, RG, YZ, and ZY all exhibited C-type, the intensity of shoulder peak at 2θ 18°, a characteristic peak of A-type crystallinity, was significantly different, exhibiting a different proportion of A- and B-type crystallinity in starch (Figure 4). A-, CA-, CC-, and CB-type starches have been found in some sweet potato varieties [9,29,30]. Genkina et al. [11] found that A-type starch forms and accumulates in sweet potato root tuber grown in soil of high temperature (over 33 °C), and CC-type starch exists in root tuber grown in soil of low temperature about 15 °C. Guo et al. [31] found that A-, B-, and C-type starch granules can simultaneously exist in root tuber of sweet potato. Therefore, variety and environment temperature affect starch crystalline structure of sweet potato. However, RC of starch was found to have no significant relationship with sweet potato variety and growing location (p > 0.05) (Table 2).

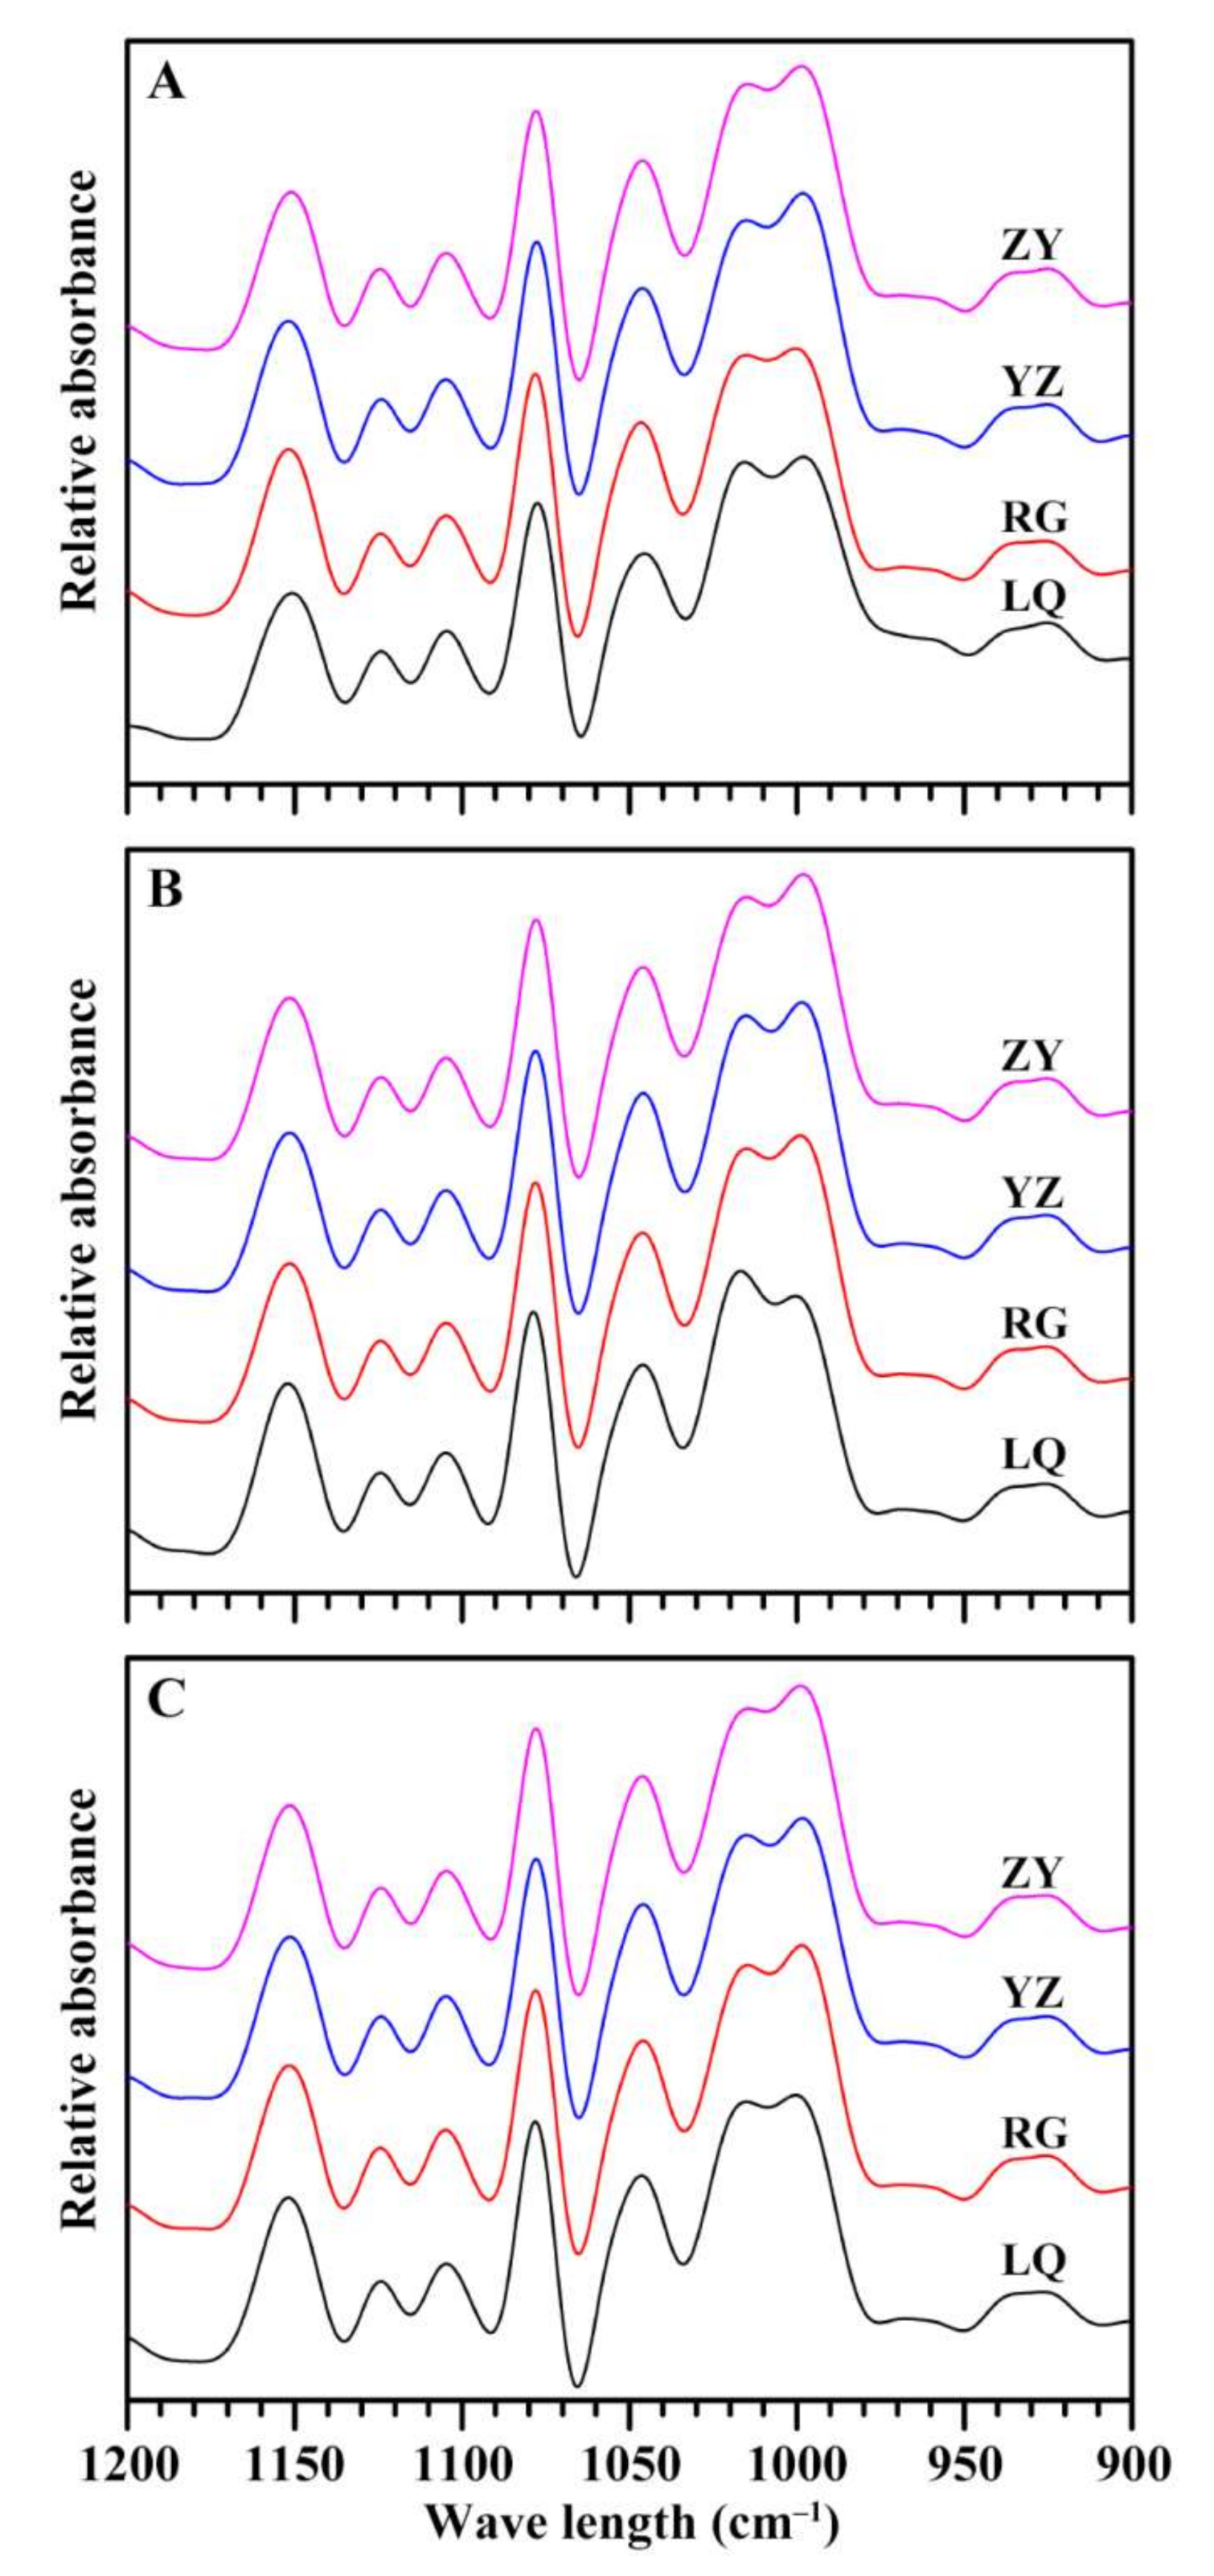
2.5. Effects of Variety and Growing Location on Ordered Structure of Starch

The deconvolution FTIR spectra of starches from different varieties and growing locations are shown in Figure 5. The absorption bands at 1045 and 1022 cm–1 are associated with crystalline and amorphous regions in starch, respectively [32]. The intensity ratio of band at 1045 to 1022 cm–1 (1045/1022 cm–1) is often used as an index reflecting the ordered degree, and that at 1022 to 995 cm–1 (1022/995 cm–1) indicates the proportion of amorphous to ordered carbohydrate structure in starch [33]. The 1045/1022 cm–1 ranged from 0.650 (LQ) to 0.709 (YZ), from 0.634 (LQ) to 0.702 (YZ), and from 0.678 (LQ) to 0.726 (YZ) for Ningzishu 1, Sushu 16, and Sushu 28, respectively. The 1022/995 cm–1 varied from 0.896 (YZ) to 0.983 (RG), from 0.922 (ZY) to 1.103 (LQ), and from 0.911 (ZY) to 0.977 (LQ) for Ningzishu 1, Sushu 16, and Sushu 28, respectively. Two-way ANOVA analysis showed that ordered structure of sweet potato starch was significantly affected by variety, growing location, and their interaction (Table 2).

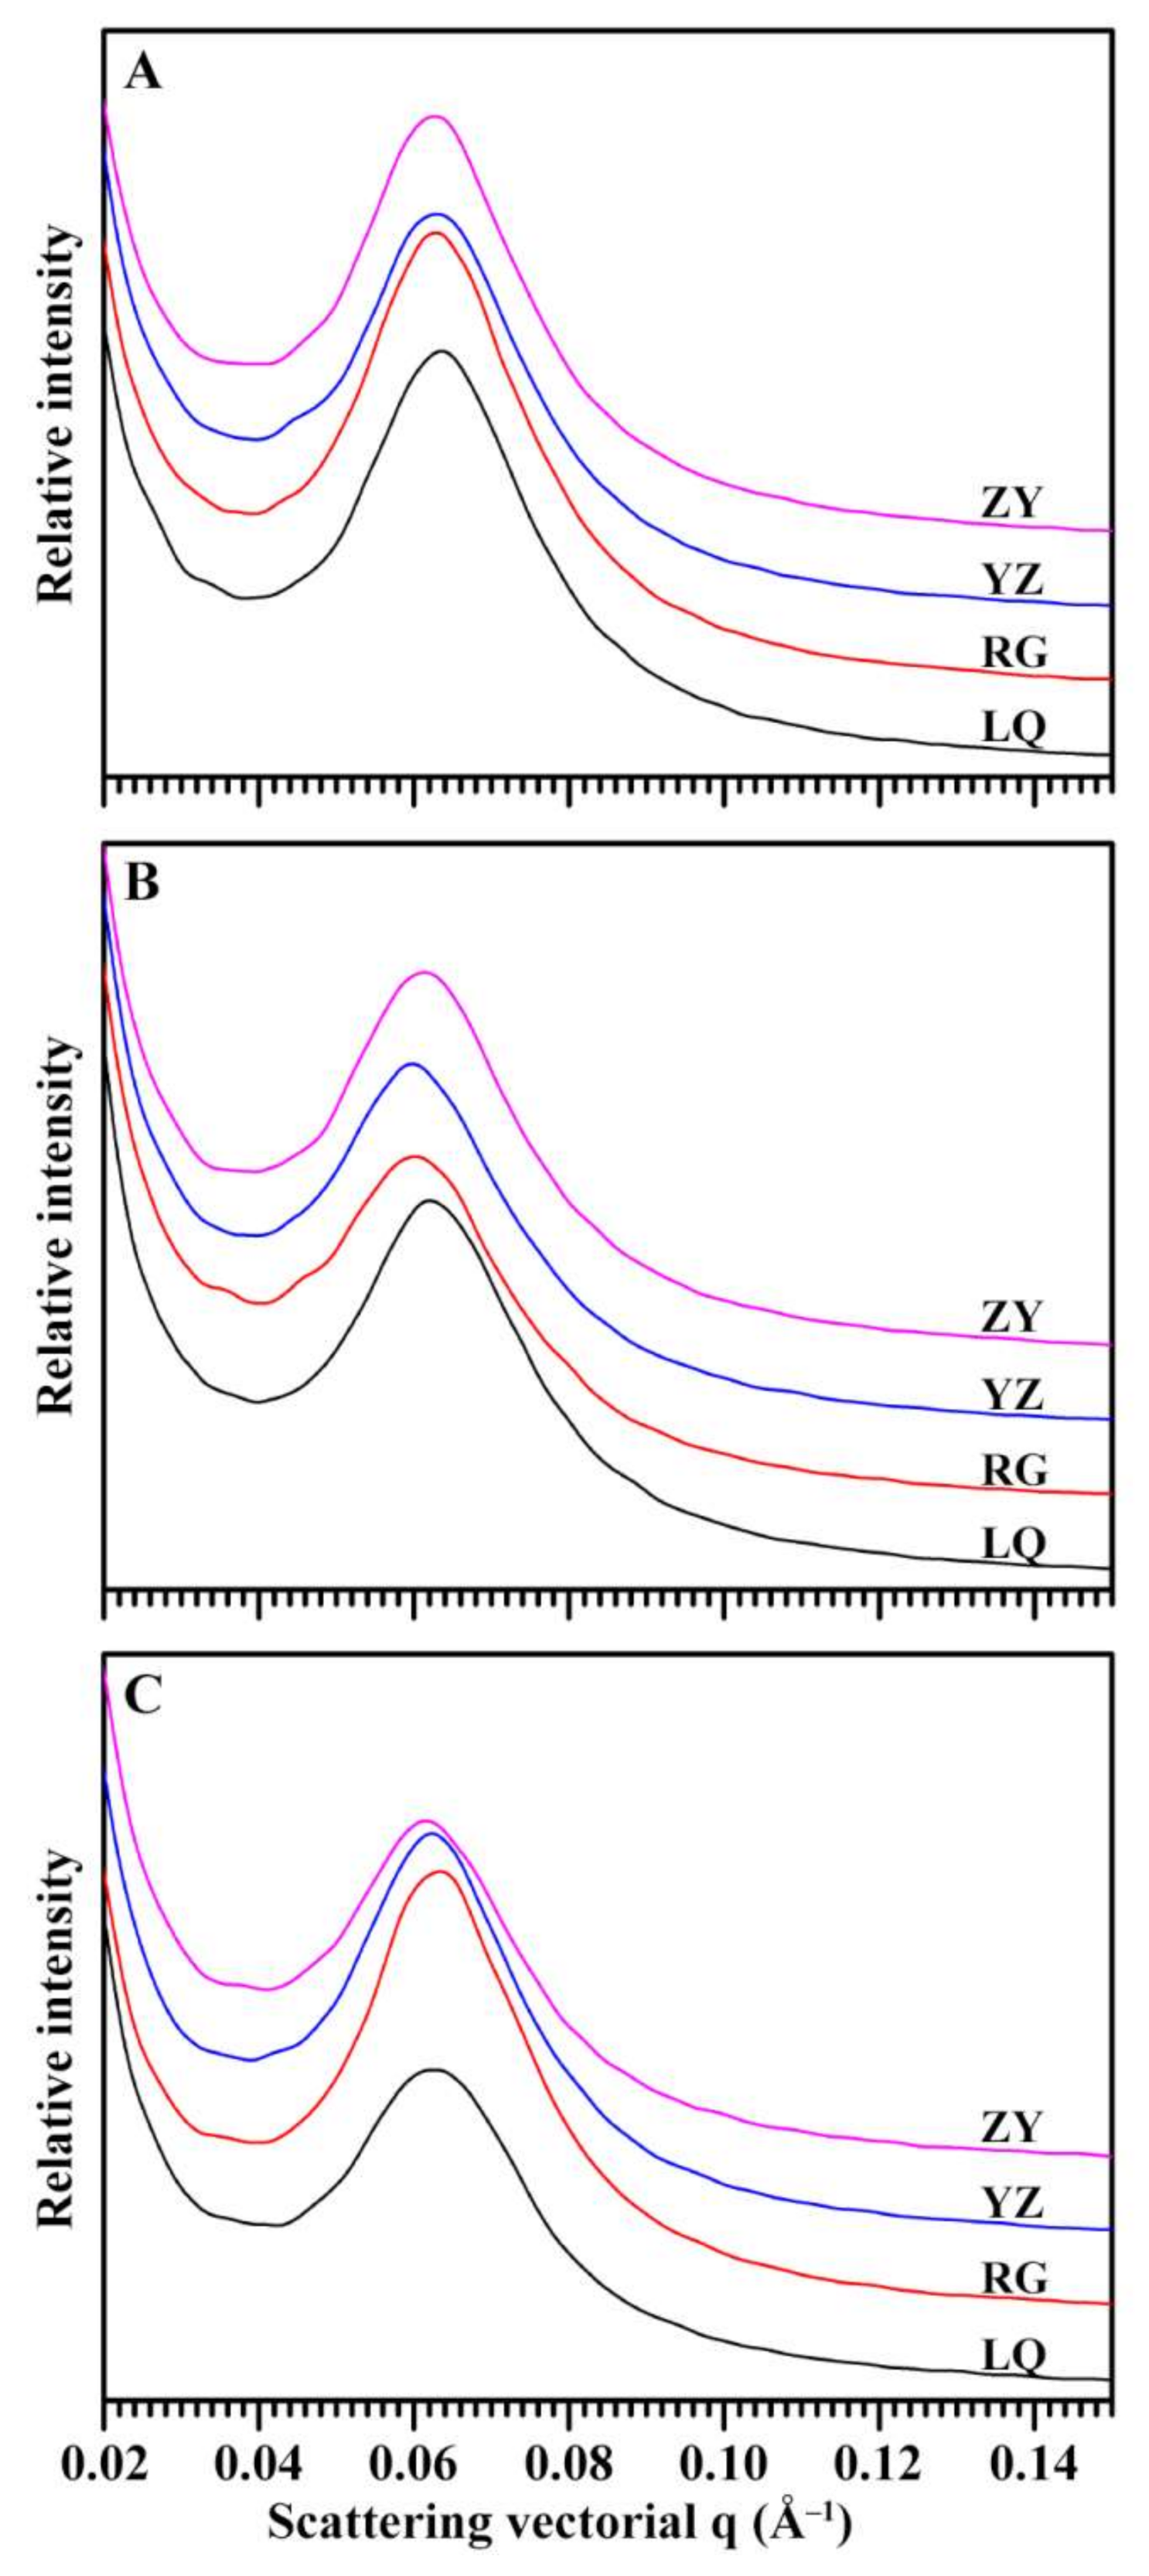
2.6. Effects of Variety and Growing Location on Lamellar Structure of Starch

The SAXS spectra of starches from different sweet potato varieties grown in different locations are presented in Figure 6. Their intensities at 0.2 Å–1 were normalized, resulting in comparable peak intensities among different samples [34]. The peak intensity of SAXS profile is determined by the ordered structure in semicrystalline regions, and lamellar distance reflects the thickness of repeated crystalline and amorphous lamellae [35]. The lamellar structure is formed by amylopectin branch-chains [36]. The peak intensity ranged from 357.1 (YZ) to 418.6 (RG), from 257.7 (RG) to 332.4 (ZY), and from 275.5 (LQ) to 417.8 (RG) for Ningzishu 1, Sushu 16, and Sushu 28, respectively. The lamellar thickness ranged from 9.72 nm (LQ) to 9.82 nm (ZY), from 9.86 nm (LQ) to 10.21 nm (YZ), and from 9.76 nm (RG) to 9.89 nm (ZY) for Ningzishu 1, Sushu 16, and Sushu 28, respectively. Two-way ANOVA analysis exhibited that lamellar peak intensity and thickness of sweet potato starch were significantly affected by variety, growing location, and their interaction (Table 2).

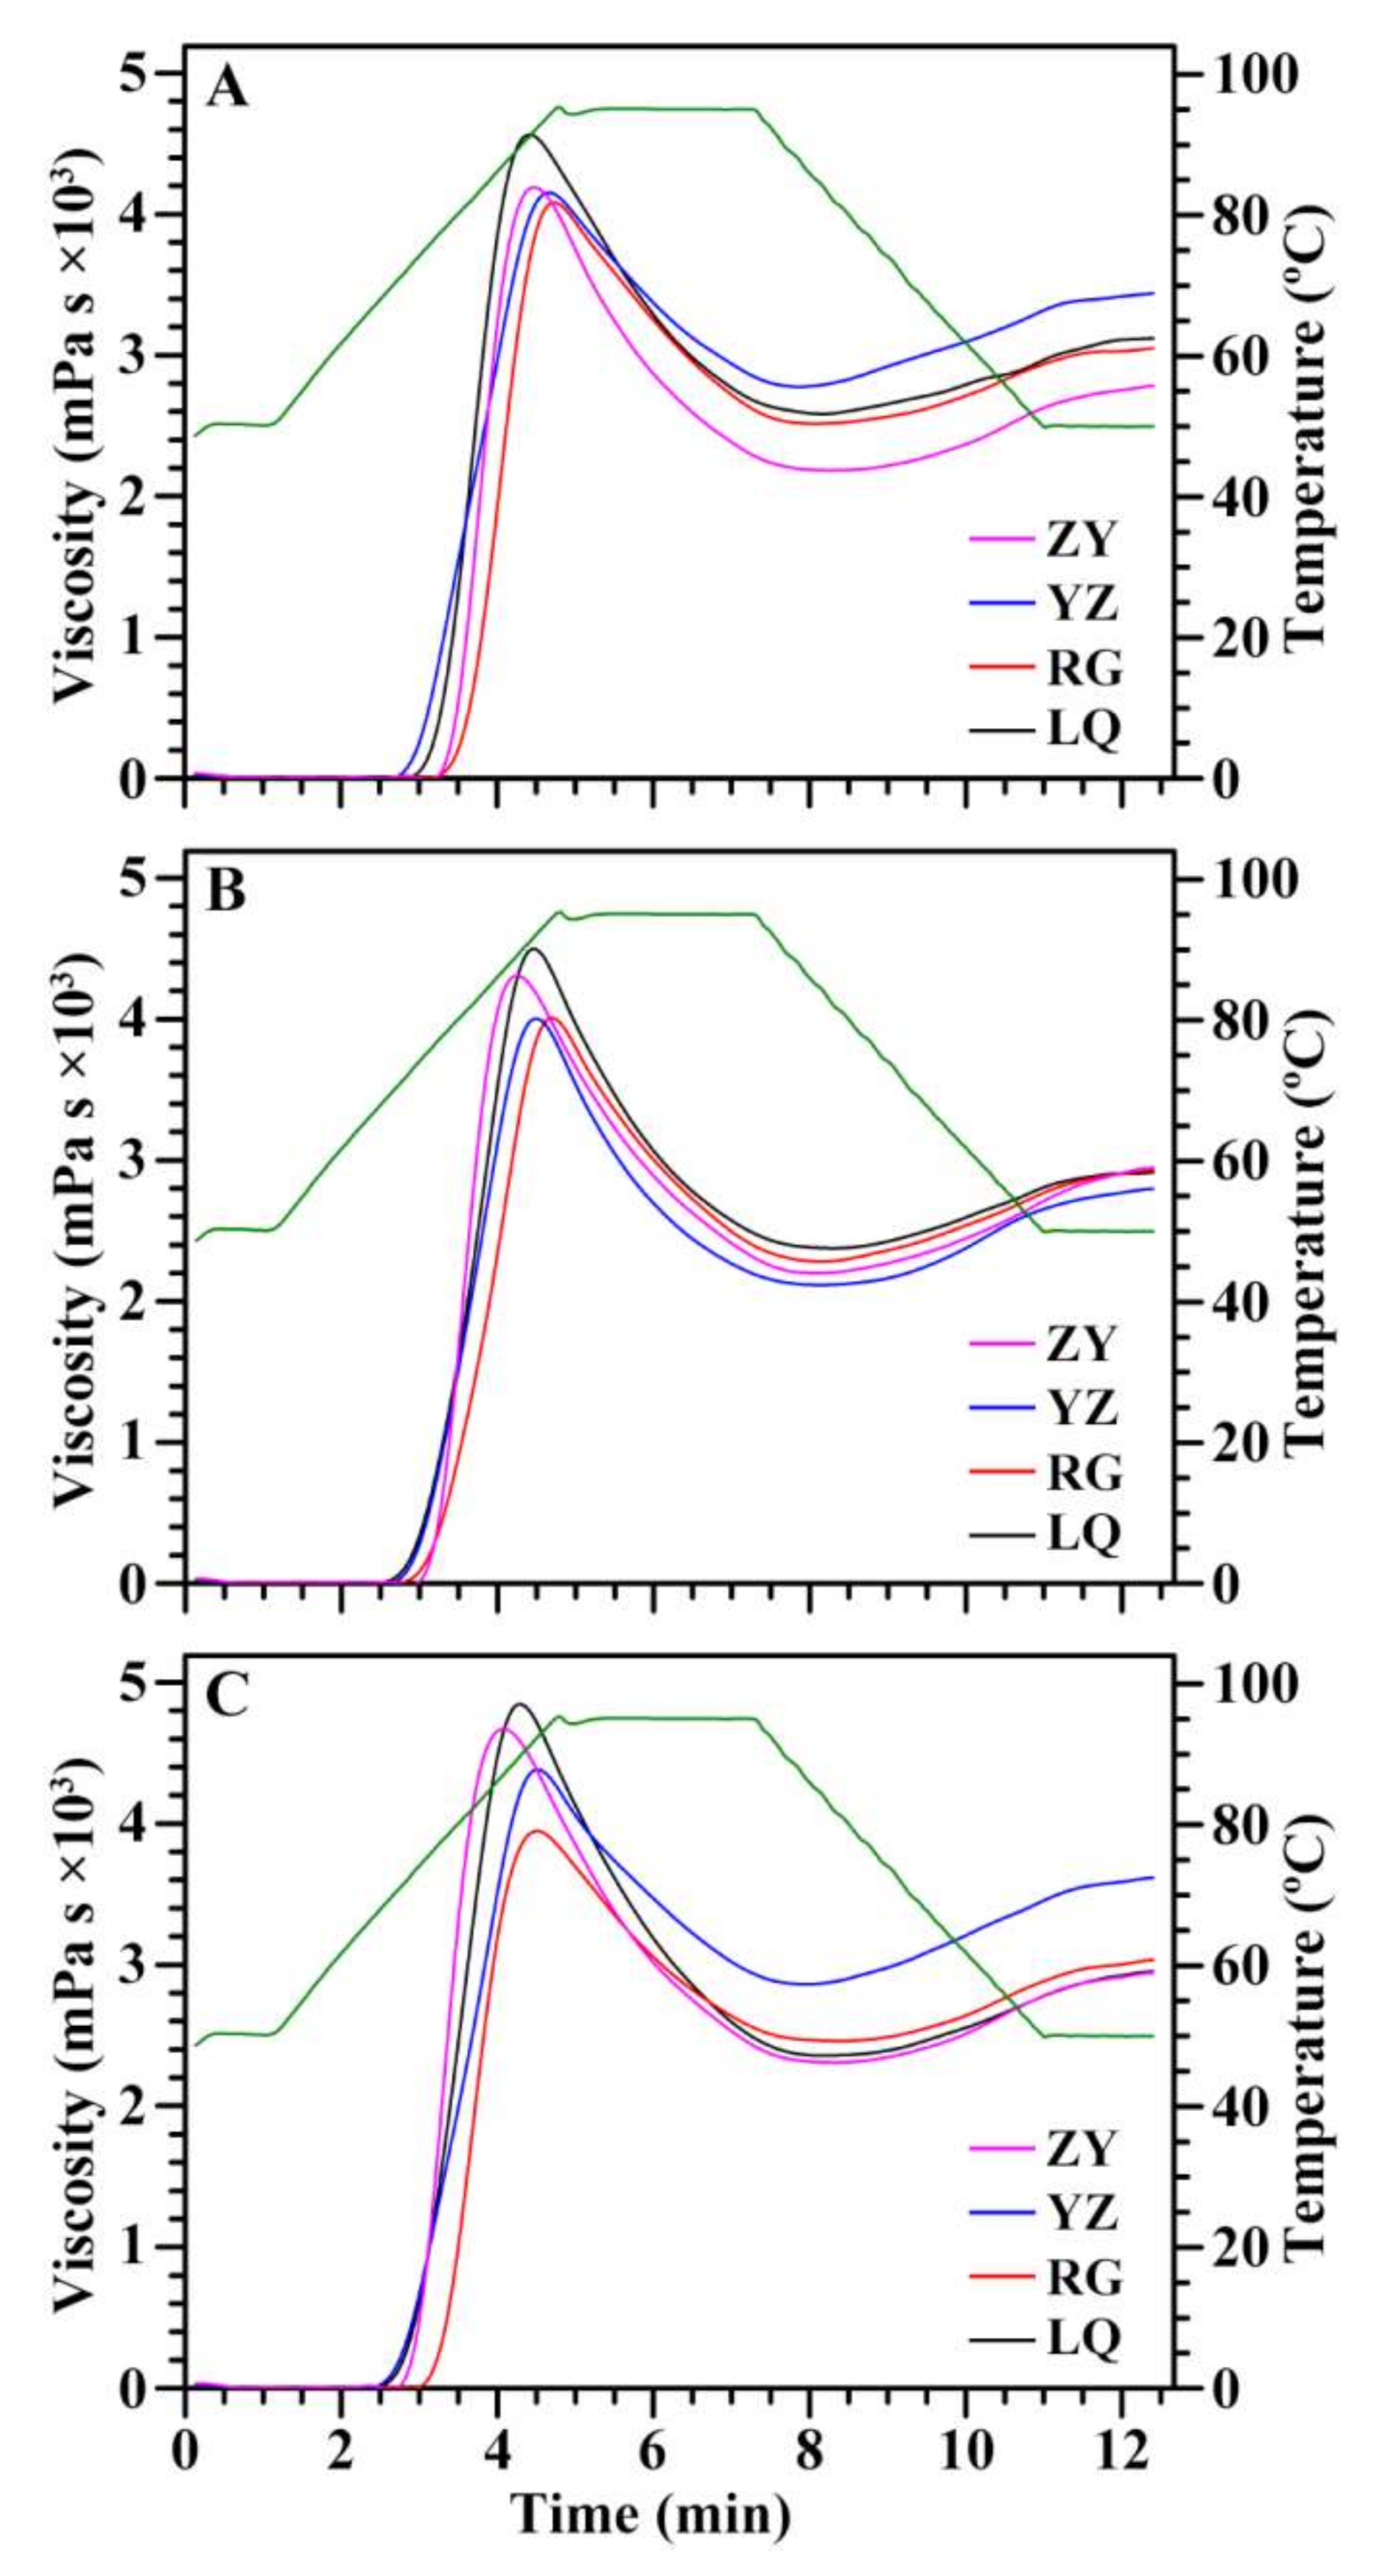
2.7. Effects of Variety and Growing Location on Pasting Properties of Starch

RVA can heat and cool an aqueous suspension of starch under constant shear and simultaneously measures the viscosity, producing a RVA curve of viscosity change as a function of temperature and time [37]. RVA curve is usually converted into RVA parameters including pasting temperature (PTemp), peak time (PTime), and peak (PV), hot (HV), breakdown (BV), final (FV), and setback viscosity (SV). These parameters are used as pasting properties of starch, which reflect eating, cooking, and processing qualities of starch and are also important parameters to design starch blend products as well as new products based on starch [19,37]. RVA curves of sweet potato starches from different varieties grown in different locations are shown in Figure 7. PV refers to the maximum viscosity during heating of starch paste, reflecting the capability of binding water and the granular swelling of starch [37]. PV ranged from 4171 mPa s (RG) to 4635 mPa s (LQ), from 4102 mPa s (YZ) to 4656 mPa s (LQ), and from 3918 mPa s (RG) to 4929 mPa s (LQ) for Ningzishu 1, Sushu 16, and Sushu 28, respectively (Table 3). The swollen granules disrupt during heating, leading to the decrease of viscosity. The HV is the lowest viscosity of heating starch paste, and is affected by granule swelling, amylose leaching, and amylose–lipid complex [38]. HV ranged from 2171 mPa s (ZY) to 2788 mPa s (YZ), from 2113 mPa s (YZ) to 2363 mPa s (LQ), and from 2274 mPa s (ZY) to 2846 mPa s (YZ) for Ningzishu 1, Sushu 16, and Sushu 28, respectively (Table 3). BV is the different value between PV and HV, reflecting paste resistance to heat and shear [20]. BV ranged from 1504 mPa s (YZ) to 2102 mPa s (ZY), from 1839 mPa s (RG) to 2293 mPa s (LQ), and from 1479 mPa s (RG) to 2591 mPa s (LQ) for Ningzishu 1, Sushu 16, and Sushu 28, respectively (Table 3). FV is the viscosity of starch paste after cooling, and indicates the stability to cooled starch paste or gel [2]. FV ranged from 2802 mPa s (ZY) to 3471 mPa s (YZ), from 2769 mPa s (YZ) to 2947 mPa s (ZY), and from 2920 mPa s (ZY) to 3579 mPa s (YZ) for Ningzishu 1, Sushu 16, and Sushu 28, respectively (Table 3). SB is the different viscosity between FV and HV, reflecting the tendency of starch pastes to retrograde [20]. SV ranged from 541 mPa s (LQ) to 682 mPa s (YZ), from 562 mPa s (LQ) to 769 mPa s (ZY), and from 587 mPa s (RG) to 733 mPa s (YZ) for Ningzishu 1, Sushu 16, and Sushu 28, respectively. PTemp reflects the energy cost required during cooking, and ranged from 73.08 °C (YZ) to 78.98 °C (ZY), from 71.68 °C (LQ) to 76.05 °C (ZY), and from 70.07 °C (YZ) to 76.88 °C (RG) for Ningzishu 1, Sushu 16, and Sushu 28, respectively (Table 3). PTime is the time of PV, and can reflect starch swelling with high swelling starch having low PTime [20]. PTime ranged from 4.40 min (LQ) to 4.62 min (YZ), from 4.22 min (ZY) to 4.60 min (RG), and from 4.07 min (ZY) to 4.51 (RG) for Ningzishu 1, Sushu 16, and Sushu 28, respectively. Two-way ANOVA analysis showed that the RVA parameters were significantly affected by variety, growing location, and their interaction (Table 3). Similar phenomenon exists in potato starch [18]. However, Ahmed et al. [17] reported that no significant effects of environment are observed on HV, FV, SV and PTemp of potato starch. Nhan and Copeland [16] reported that PV, HV, and FV of wheat starch are affected by genotype, growing location, and their interaction, but BV, SV, and PTemp are not affected by genotype. Tappiban et al. [19] reported that BV of cassava starch is affected by genotype, environment, and their interaction; PV is affected by genotype and environment; PTemp and PTime are affected by genotype; HV, FV, and SV are not affected by genotype, environment, and their interaction.

2.8. Effects of Variety and Growing Location on Swelling Power and Water Solubility of Starch

Swelling powers and water solubilities of sweet potato starches at 95 °C are presented in Table 4. Swelling power ranged from 29.9 g/g (RG) to 30.9 g/g (LQ), from 29.1 g/g (ZY) to 32.6 g/g (LQ), and from 26.7 g/g (YZ) to 29.8 g/g (ZY) for Ningzishu 1, Sushu 16, and Sushu 28, respectively. Water solubility ranged from 12.5% (RG) to 14.4% (ZY), from 14.2% (YZ) to 17.9% (ZY), and from 12.8% (YZ) to 15.3% (ZY) for Ningzishu 1, Sushu 16, and Sushu 28, respectively. The results are comparable with previous reports that swelling powers range from 24.5 to 32.7 g/g and water solubilities range from 12.1% to 24.1% among starches from 44 sweet potato varieties [39]. Two-way ANOVA analysis indicated that swelling power and water solubility of sweet potato starch were significantly affected by variety, growing location, and their interaction (Table 4). Pelpolage et al. [18] reported that swelling power of potato starch is not influenced by growing location, and water solubility is not affected by variety.

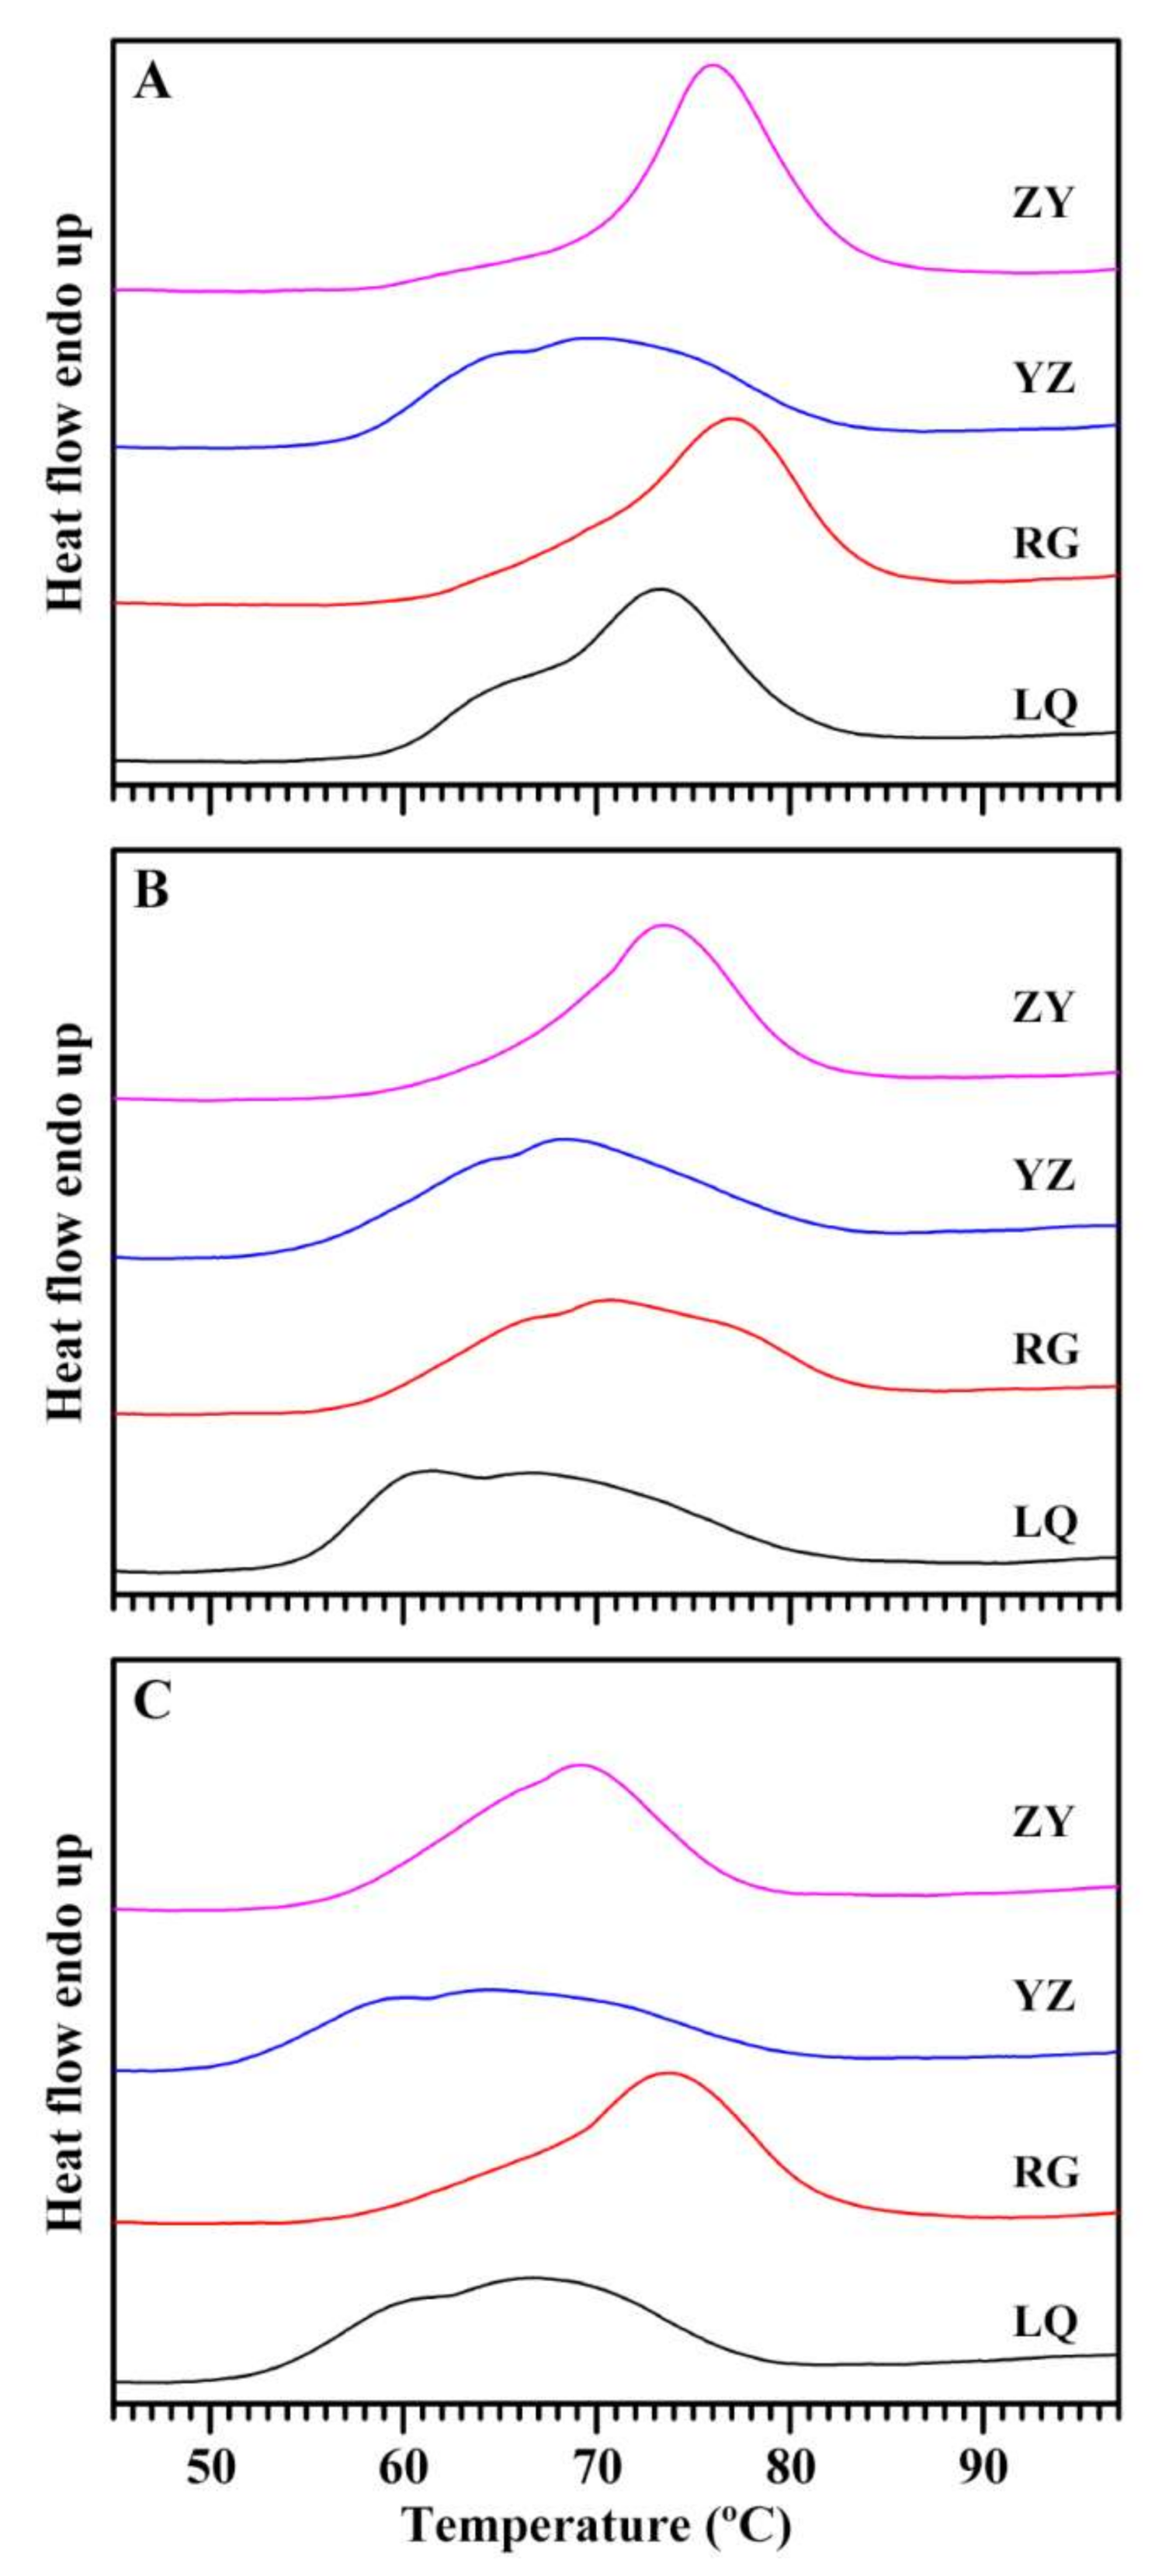
2.9. Effects of Variety and Growing Location on Thermal Properties of Starch

Thermal properties provide important reference parameters for evaluating cooking and processing quality of starch. Significant differences in thermograms were detected among different sweet potato varieties and growing locations (Figure 8). Some starches such as starch from Ningzishu 1 grown in ZY exhibited single-peak DSC curve with wide gelatinization temperature range, some starches such as starch from Sushu 28 grown in LQ exhibited two-peak DSC curve, and some starches such as starch from Sushu 16 grown in RG showed three-peak DSC curve (Figure 8). Similar single-, two-, and three-peak DSC curves are detected in sweet potato starches from different varieties [2,9,11]. This complex gelatinization curve is due to that C-type starches have different proportions of A-type crystallinity with high gelatinization temperature and B-type crystallinity with low gelatinization temperature [40,41]. Guo et al. [2] systematically studied thermal properties of sweet potato starch. The single-, two-, and three-peak DSC curves with wide gelatinization temperature range of sweet potato starches can all be fitted into three gelatinization peaks corresponding to the gelatinization of B-, C-, and A-type starch according to gelatinization temperature from low to high. The sweet potato C-type starch consists of heterogeneous granules of A-, B-, and C-type starch. Their different proportions result in single-, two-, and three-peak gelatinization curves in sweet potato starches from different varieties [31]. The different DSC curves of starches from different sweet potato varieties and growing locations indicated that thermal properties of starch were influenced by varieties, growing locations, and their interaction. The gelatinization temperature and enthalpy are presented in Table 4. The gelatinization onset temperature varied from 57.6 °C (YZ) to 62.9 °C (RG), from 54.8 °C (LQ) to 62.8 °C (ZY), and from 51.1 °C (YZ) to 57.9 °C (RG) for Ningzishu 1, Sushu 16, and Sushu 28, respectively. The gelatinization peak temperature varied from 69.5 °C (YZ) to 77.2 °C (RG), from 61.2 °C (LQ) to 73.0 °C (ZY), and from 64.1 °C (YZ) to 73.5 °C (RG) for Ningzishu 1, Sushu 16, and Sushu 28, respectively. The gelatinization conclusion temperature varied from 80.8 °C (LQ) to 84.0 °C (RG), from 80.7 °C (ZY) to 83.0 °C (RG), and from 77.3 °C (ZY) to 81.5 °C (RG) for Ningzishu 1, Sushu 16, and Sushu 28, respectively. The gelatinization temperature range varied from 20.9 °C (LQ) to 24.5 °C (YZ), from 17.9 °C (ZY) to 26.6 °C (YZ), and from 20.9 °C (ZY) to 28.1 °C (YZ) for Ningzishu 1, Sushu 16, and Sushu 28, respectively. The gelatinization enthalpy is the energy requirement for disruption of crystallinity, and ranged from 13.2 J/g (YZ) to 14.3 J/g (LQ), from 12.2 J/g (RG) to 13.3 J/g (ZY), and from 11.7 J/g (YZ) to 13.3 J/g (RG) for Ningzishu 1, Sushu 16, and Sushu 28, respectively. Two-way ANOVA analysis showed that gelatinization temperature and enthalpy of sweet potato were significantly affected by variety, growing location, and their interaction (Table 4). The gelatinization properties of starch are affected by variety, growing location, and their interaction in potato [18] and wheat [16], but only gelatinization onset and peak temperature of starch are affected by varieties in cassava [19].

2.10. Effects of Variety and Growing Location on Digestion Properties of Starch

The enzyme hydrolysis of starch can provide important references in estimating starch utilizations in food and nonfood industries. The RDS, SDS, and RS are presented in Table 5. For native starch, Ningzishu 1, Sushu 16, and Sushu 28 had significantly different digestibilities. Three sweet potato varieties exhibited the highest and lowest RDS in growing location of YZ and ZY, respectively, and the highest and lowest RS in ZY and YZ, respectively (Table 5). Abegunde et al. [20] measured the digestion of native starches from 11 sweet potato varieties planted in different places, and found that starches from different cultivars exhibit significantly different digestibilities due to that environmental temperature and soil affect starch development. Guo et al. [2] reported that native starches from nine sweet potato varieties grown in the same location exhibit significantly different digestion properties. In fact, enzyme hydrolysis of native starch is affected by morphology, size, component, amylopectin structure, crystallinity, hydrolysis condition, and type of hydrolyzing enzyme [2,20]. In the present research, two-way ANOVA analysis showed that the digestibility of native starch was significantly influenced by sweet potato variety, growing location, and their interaction (Table 5). For gelatinized starch, the digestion of starch is mainly affected by amylose/amylopectin structure and content [21]. The gelatinized starch had RDS from 70.5% to 81.4%, SDS from 2.1% to 11.0%, and RS from 10.8% to 23.3% among three sweet potato varieties grown in four locations. Two-way ANOVA analysis also showed that the digestibility of gelatinized starch was significantly influenced by sweet potato variety, growing location, and their interaction (Table 5). Tappiban et al. [19] measured the RS of starches from five cassava cultivars grown in two locations, and found that RS of cassava starch is not affected by genotype, environment, and their interaction.

3. Materials and Methods

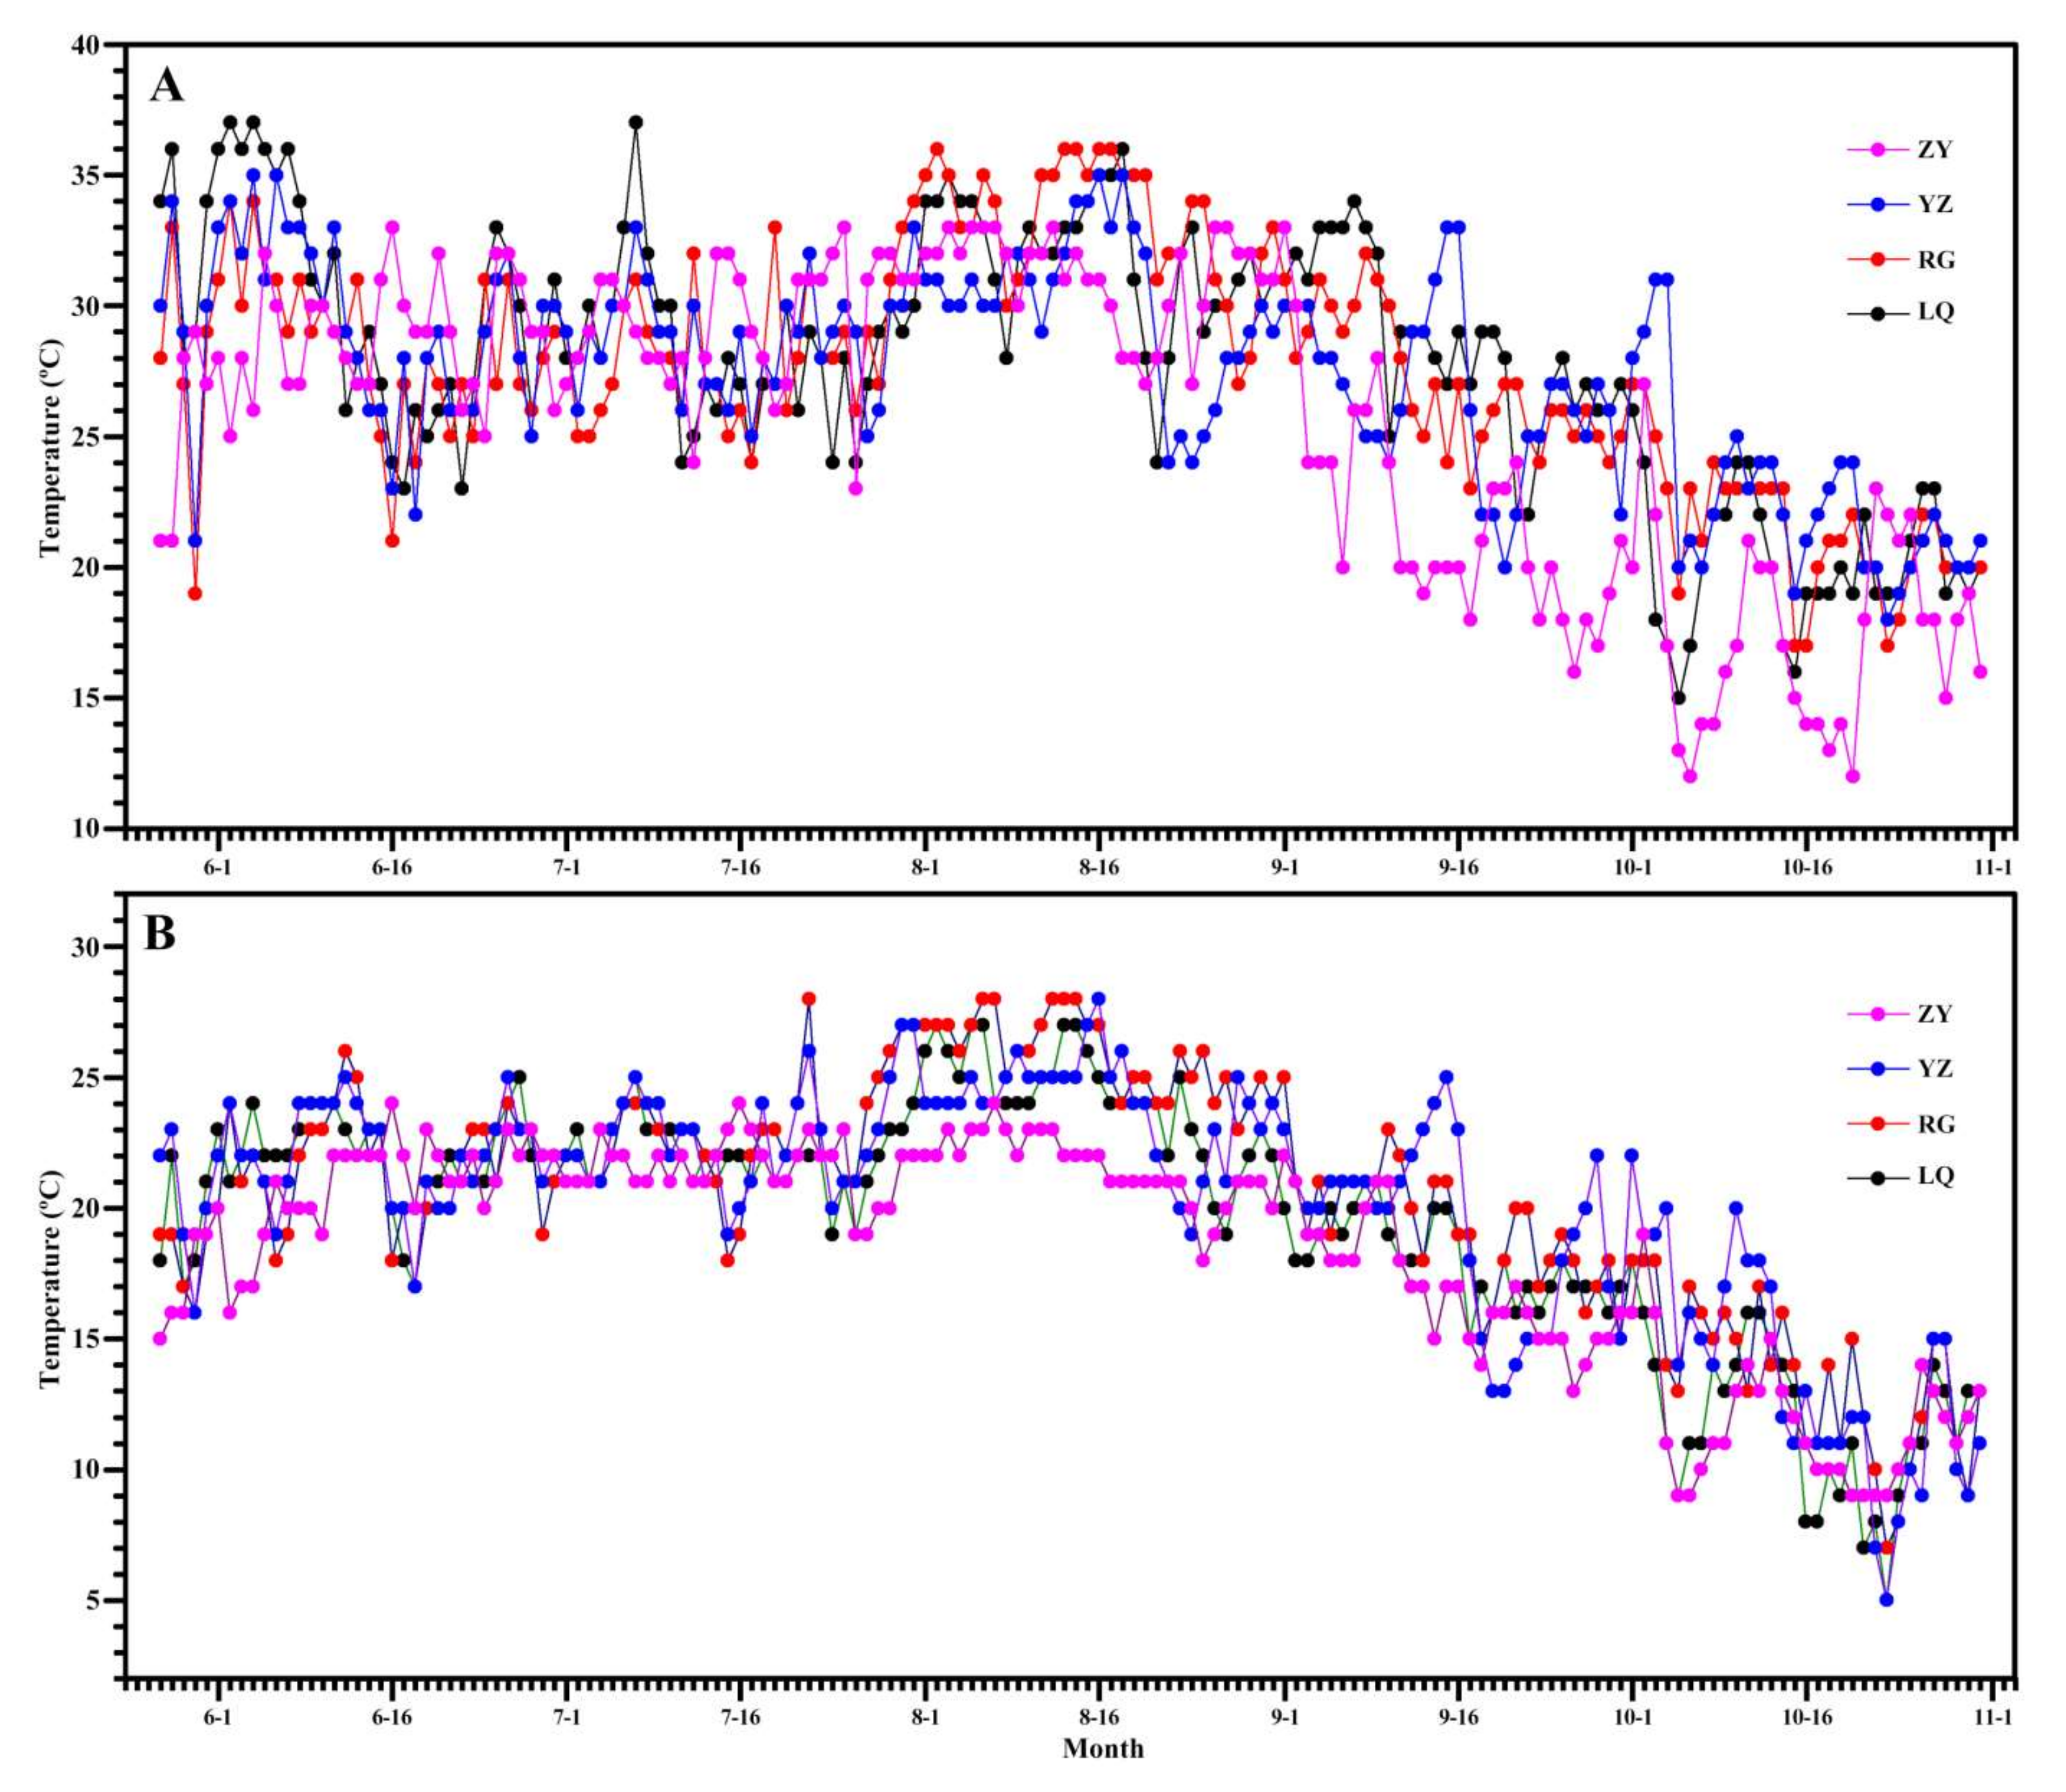
3.1. Plant Materials

Three sweet potato varieties of purple-fleshed Ningzishu 1, yellow-fleshed Sushu 16, and white-fleshed Sushu 28 were planted on 27 May and harvested on 31 October 2020. For each variety in one experimental plot, 100 seedlings were planted in five rows with 90 cm between rows and 20 cm between hills and one seedling per hill under routine agronomic practices in four growing locations of Linquan (LQ) [latitude 32°58′32″ N, longitude 115°14′05″ E, altitude 38 m], Rugao (RG) [latitude 32°21′38″ N, longitude 120°26′36″ E, altitude 6 m], Yangzhou (YZ) [latitude 32°23′43″ N, longitude 119°25′46″ E, altitude 8 m], and Zunyi (ZY) [latitude 27°32′05″ N, longitude 107°10′20″ E, altitude 893 m]. All varieties in every growing location were planted repeatedly in three experimental plots. The soil in each growing location was given the same nitrogen treatment of 15 kg/ha applied in the ridge before planting. The fertilizers included urea, superphosphate, and potassium sulfate. Temperature variation of growing location during sweet potato growth stage is presented in Figure 3.

3.2. Isolation of Starch from Root Tuber of Sweet Potato

Starch was isolated from fresh root tuber of sweet potato using water homogenization, sieving, and treatment of 0.2% NaOH and anhydrous ethanol following the processes of Guo et al. [2] exactly.

3.3. Analysis of Size Distribution of Starch

Starch and water slurry was analyzed with a laser particle size analyzer (Mastersizer 2000, Malvern, Worcestershire, UK) following the processes of Guo et al. [2]. The testing condition included the opacity between 10% and 11% and the mixing at 2000 rpm. The granule size was expressed with volume-weighted mean diameter (D[4,3]).

3.4. Analysis of Absorption Spectrum Parameters of Starch–Iodine Complex

Starch was dissolved in dimethyl sulfoxide containing 10% 6.0 M urea (UDMSO) and stained with iodine solution following the processes of Man et al. [22] exactly. The sample was analyzed with a spectrophotometer (BioMate 3S, Thermo Scientific, Chino, CA, USA). The parameters including the absorption value at 550, 620, and 680 nm and the maximum absorption wavelength were obtained from the spectrum.

3.5. Determination of Amylose Content

The amylose content (AC) was measured using concanavalin A (Con A) precipitation method with an amylose/amylopectin assay kit (K-AMYL, Megazyme, Bray, Ireland) following its assay procedures. For measuring principle, starch is first dispersed completely into amylose and amylopectin, and separated into two aliquots. The Con A specifically precipitates the amylopectin in an aliquot, and the remaining amylose in the supernatant is quantified. The dispersed amylose and amylopectin in another aliquot are also quantified. The AC is the ratio of amylose to both amylose and amylopectin.

3.6. X-ray Diffraction (XRD) Analysis

Starch was analyzed using an XRD spectrometer (D8, Bruker, Karlsruhe, Germany) following the method of Guo et al. [2] exactly. The testing condition included X-ray beam at 40 kV and 40 mA and scanning angle from 3° to 40° 2θ with 0.02° step size. The relative crystalline (RC) was the area percentage of crystalline peaks and total diffraction peak between 4° to 30° 2θ [42].

3.7. Fourier Transform Infrared (FTIR) Analysis

Starch was analyzed using a FTIR spectrometer (7000, Varian, Santa Clara, CA, USA) following the method of Guo et al. [2] exactly. The testing condition included 64 scans with 4 cm−1 resolution from 4000 to 800 cm−1. The spectrum was deconvoluted using Lorentzian line shape with 19 cm–1 half-width and 1.9 resolution enhancement factor after baseline correction from 1200 to 900 cm−1.

3.8. Small Angle X-ray Scattering (SAXS) Analysis

Starch was analyzed using a SAXS system (NanoStar, Bruker, Karlsruhe, Germany) following the method of Cai et al. [43] except that the peak intensity and position were measured with PeakFit V4.12 software. The testing condition included X-ray source with copper rotating anode (0.1 mm filament) at 50 kV and 30 W, cross coupled Göbel mirrors, and 1.5418 Å Cu Kα radiation wavelength.

3.9. Rapid Visco Analyzer (RVA) Analysis

Starch was analyzed using a RVA (3D, Newport Scientific, Warriewood, Australia) following the method of Guo et al. [2] exactly. The testing condition included starch (2.5 g) and water (25 mL) slurry, 160 rpm rotating speed, and programmed temperature–time profile with 50 °C for 1 min, from 50 to 95 °C for 3.75 min, 95 °C for 2.5 min, from 95 to 50 °C for 3.75 min, and 50 °C for 1.4 min.

3.10. Determination of Swelling Power and Water Solubility

The swelling power and water solubility of starch at 95 °C were measured following the method of Guo et al. [2] exactly. The soluble carbohydrates measured with anthrone-H2SO4 method were used to evaluate the water solubility (percentage of soluble carbohydrates to total starch), and the swelling power was the ratio of precipitated starch to total starch with subtraction of soluble carbohydrates.

3.11. Differential Scanning Calorimetry (DSC) Analysis

Starch was analyzed using a DSC (200-F3, Netzsch, Selb, Germany) following the method of Guo et al. [2] exactly. The testing condition included starch (5 mg) and water (15 μL) sealed in aluminum pan, heating range from 30 to 130 °C, and heating rate at 10 °C/min.

3.12. Analysis of Digestion Properties of Starch

The digestibilities of native and gelatinized starches were evaluated using both porcine pancreatic α-amylase (Sigma, A3176, St. Louis, MO, USA) and Aspergillus niger amyloglucosidase (Megazyme, E-AMGDF) following the method of Guo et al. [2] exactly. The released glucose was measured with a glucose assay kit (K-GLUC, Megazyme, Bray, Ireland) to convert the degraded starch quantity. The total starch was measured using a total starch assay kit (K-TSTA, Megazyme, Bray, Ireland). The rapidly digestible starch (RDS) and slowly digestible starch (SDS) are the percentage of degraded starch within 20 min and between 20 min and 2 h to the total starch, respectively, and the resistant starch (RS) is the difference between total starch and both RDS and SDS.

3.13. Data Analysis

The data difference among different starches with Tukey’s test and the effects of variety, growing location, and their interaction on starch properties with two-way ANOVA test were analyzed with SPSS 19.0.

4. Conclusions

Three sweet potato varieties grown in four locations were used to investigate the effects of variety and growing location on starch physicochemical properties in sweet potato. The granule size, iodine absorption parameters and AC of starch were influenced significantly by variety, growing location, and their interaction. C-type starches in root tubers had different proportions of A- and B-type crystallinities in different varieties and growing locations. The ordered degree and lamellar thickness of starch were affected by variety and growing location of sweet potato. The pasting properties, swelling power, water solubility, thermal properties, and digestibility exhibited significant differences among different varieties and growing location. Therefore, in consideration of the applications of starch, it is very important to choose an appropriate variety for planting sweet potato in a specific growing location.

Author Contributions

C.W. conceived the study and designed the experiments; L.S., Y.L., L.L. and X.B. performed the experiments; and C.W. and L.S. wrote the manuscript. All authors discussed the contents of the manuscript and approved the submission. All authors have read and agreed to the published version of the manuscript.

Funding

This study was financially supported by grants from the National Natural Science Foundation of China (31570324), Talent Project of Yangzhou University, and Priority Academic Program Development of Jiangsu Higher Education Institutions.

Institutional Review Board Statement

Not applicable.

Informed Consent Statement

Not applicable.

Data Availability Statement

The data are available upon request from the corresponding author.

Conflicts of Interest

The authors declare no conflict of interest.

Sample Availability

Samples of starches are available from the corresponding author upon reasonable request.

References

  1. FAOSTAT. Available online: http://www.fao.org/faostat/en/#data (accessed on 24 October 2021).
  2. Guo, K.; Liu, T.; Xu, A.; Zhang, L.; Bian, X.; Wei, C. Structural and functional properties of starches from root tubers of white, yellow, and purple sweet potatoes. Food Hydrocoll. 2019, 89, 829–836. [Google Scholar] [CrossRef]
  3. Zhu, F.; Wang, S. Physicochemical properties, molecular structure, and uses of sweetpotato starch. Trends Food Sci. Technol. 2014, 36, 68–78. [Google Scholar] [CrossRef]
  4. Song, H.G.; Choi, I.C.; Lee, J.S.; Chung, M.N.; Yoon, C.S.; Han, J. Comparative study on physicochemical properties of starch films prepared from five sweet potato (Ipomoea batatas) cultivars. Int. J. Biol. Macromol. 2021, 189, 758–767. [Google Scholar] [CrossRef]
  5. Truong, V.D.; Avula, R.Y.; Pecota, K.V.; Yencho, G.C. Sweetpotato production, processing, and nutritional quality. In Handbook of Vegetables and Vegetable Processing; Siddiq, M., Uebersax, M.A., Eds.; John Wiley & Sons Ltd.: Hoboken, NJ, USA, 2018; pp. 811–838. [Google Scholar]
  6. Alam, M.K. A comprehensive review of sweet potato (Ipomoea batatas [L.] Lam): Revisiting the associated health benefits. Trends Food Sci. Technol. 2021, 115, 512–529. [Google Scholar] [CrossRef]
  7. Kim, H.J.; Woo, K.S.; Lee, H.U.; Nam, S.S.; Lee, B.W.; Kim, M.Y.; Lee, Y.Y.; Lee, J.Y.; Kim, M.H.; Lee, B. Physicochemical characteristics of starch in sweet potato cultivars grown in Korea. Prev. Nutr. Food Sci. 2020, 25, 212–218. [Google Scholar] [CrossRef] [PubMed]
  8. Wang, H.; Yang, Q.; Ferdinand, U.; Gong, X.; Qu, Y.; Gao, W.; Ivanistau, A.; Feng, B.; Liu, M. Isolation and characterization of starch from light yellow, orange, and purple sweet potatoes. Int. J. Biol. Macromol. 2020, 160, 660–668. [Google Scholar] [CrossRef] [PubMed]
  9. Zhang, L.; Zhao, L.; Bian, X.; Guo, K.; Zhou, L.; Wei, C. Characterization and comparative study of starches from seven purple sweet potatoes. Food Hydrocoll. 2018, 80, 168–176. [Google Scholar] [CrossRef]
  10. Duan, W.; Zhang, H.; Xie, B.; Wang, B.; Zhang, L. Impacts of nitrogen fertilization rate on the root yield, starch yield and starch physicochemical properties of the sweet potato cultivar Jishu 25. PLoS ONE 2019, 14, e0221351. [Google Scholar] [CrossRef] [Green Version]
  11. Genkina, N.K.; Noda, T.; Koltisheva, G.I.; Wasserman, L.A.; Tester, R.F.; Yuryev, V.P. Effects of growth temperature on some structural properties of crystalline lamellae in starches extracted from sweet potatoes (Sunnyred and Ayamurasaki). Starch 2003, 55, 350–357. [Google Scholar] [CrossRef]
  12. Guo, K.; Bian, X.; Jia, Z.; Zhang, L.; Wei, C. Effects of nitrogen level on structural and functional properties of starches from different colored-fleshed root tubers of sweet potato. Int. J. Biol. Macromol. 2020, 164, 3235–3242. [Google Scholar] [CrossRef]
  13. Noda, T.; Takahata, Y.; Sato, T.; Ikoma, H.; Mochida, H. Physicochemical properties of starches from purple and orange fleshed sweet potato roots at two levels of fertilizer. Starch 1996, 48, 395–399. [Google Scholar] [CrossRef]
  14. Li, H.; Liu, Y. Effects of variety and growth location on the chain-length distribution of rice starches. J. Cereal Sci. 2019, 85, 77–83. [Google Scholar] [CrossRef] [Green Version]
  15. Sar, S.; Tizzotti, M.J.; Hasjim, J.; Gilbert, R.G. Effects of rice variety and growth location in Cambodia on grain composition and starch structure. Rice Sci. 2014, 21, 47–58. [Google Scholar] [CrossRef]
  16. Nhan, M.T.; Copeland, L. Effect of variety and growing environment on pasting and thermal properties of wheat starch. Starch 2016, 68, 436–445. [Google Scholar] [CrossRef]
  17. Ahmed, S.; Ru, W.; Han, H.; Cheng, L.; Bian, X.; Li, G.; Jin, L.; Wu, P.; Bao, J. Fine molecular structure and its effects on physicochemical properties of starches in potatoes grown in two locations. Food Hydrocoll. 2019, 97, 105172. [Google Scholar] [CrossRef]
  18. Pelpolage, S.; Nakata, K.; Shinbayashi, Y.; Murayama, D.; Tani, M.; Yamauchi, H.; Koaze, H. Comparison of pasting and thermal properties of starches isolated from four processing type potato varieties cultivated in two locations in Hokkaido. Food Sci. Technol. Res. 2016, 22, 687–693. [Google Scholar] [CrossRef]
  19. Tappiban, P.; Sraphet, S.; Srisawad, N.; Wu, P.; Han, H.; Smith, D.R.; Bao, J.; Triwitayakorn, K. Effects of cassava variety and growth location on starch fine structure and physicochemical properties. Food Hydrocoll. 2020, 108, 106074. [Google Scholar] [CrossRef]
  20. Abegunde, O.K.; Mu, T.H.; Chen, J.W.; Deng, F.M. Physicochemical characterization of sweet potato starches popularly used in Chinese starch industry. Food Hydrocoll. 2013, 33, 169–177. [Google Scholar] [CrossRef]
  21. Lin, L.; Zhang, Q.; Zhang, L.; Wei, C. Evaluation of the molecular structural parameters of normal rice starch and their relationships with its thermal and digestion properties. Molecules 2017, 22, 1526. [Google Scholar] [CrossRef] [Green Version]
  22. Man, J.; Lin, L.; Wang, Z.; Wang, Y.; Liu, Q.; Wei, C. Different structures of heterogeneous starch granules from high-amylose rice. J. Agric. Food Chem. 2014, 62, 11254–11263. [Google Scholar] [CrossRef]
  23. Ahmed, N.; Maekawa, M.; Tetlow, I.J. Effects of low temperature on grain filling, amylose content, and activity of starch biosynthesis enzymes in endosperm of basmati rice. Aust. J. Agric. Res. 2008, 59, 599–604. [Google Scholar] [CrossRef]
  24. Ahmed, N.; Tetlow, I.J.; Nawaz, S.; Iqbal, A.; Mubin, M.; ul Rehman, M.S.N.; Butt, A.; Lightfoot, D.A.; Maekawa, M. Effect of high temperature on grain filling period, yield, amylose content and activity of starch biosynthesis enzymes in endosperm of basmati rice. J. Sci. Food Agric. 2015, 95, 2237–2243. [Google Scholar] [CrossRef] [PubMed]
  25. Lu, H.F.; Hu, Y.Y.; Wang, C.Y.; Liu, W.X.; Ma, G.; Han, Q.X.; Ma, D.Y. Effects of high temperature and drought stress on the expression of gene encoding enzymes and the activity of key enzymes involved in starch biosynthesis in wheat grains. Front. Plant. Sci. 2019, 10, 1414. [Google Scholar] [CrossRef] [PubMed]
  26. Nhan, M.T.; Copeland, L. Effects of growing environment on properties of starch from five Australian wheat varieties. Cereal Chem. 2014, 91, 587–594. [Google Scholar] [CrossRef]
  27. Huang, L.; Sreenivasulu, N.; Liu, Q. Waxy editing: Old meets new. Trends Plant. Sci. 2020, 25, 963–966. [Google Scholar] [CrossRef] [PubMed]
  28. He, W.; Wei, C. Progress in C-type starches from different plant sources. Food Hydrocoll. 2017, 73, 162–175. [Google Scholar] [CrossRef]
  29. Kim, J.; Ren, C.; Shin, M. Physicochemical properties of starch isolated from eight different varieties of Korean sweet potatoes. Starch 2013, 65, 923–930. [Google Scholar] [CrossRef]
  30. Lee, B.H.; Lee, Y.T. Physicochemical and structural properties of different colored sweet potato starches. Starch 2017, 69, 1600001. [Google Scholar] [CrossRef]
  31. Guo, K.; Zhang, L.; Bian, X.; Cao, Q.; Wei, C. A-, B- and C-type starch granules coexist in root tuber of sweet potato. Food Hydrocoll. 2020, 98, 105279. [Google Scholar] [CrossRef]
  32. Warren, F.J.; Gidley, M.J.; Flanagan, B.M. Infrared spectroscopy as a tool to characterize starch ordered structure: A joint FTIR-ATR, NMR, XRD and DSC study. Carbohydr. Polym. 2016, 139, 35–42. [Google Scholar] [CrossRef] [Green Version]
  33. Sevenou, O.; Hill, S.E.; Farhat, I.A.; Mitchell, J.R. Organisation of the external region of the starch granule as determined by infrared spectroscopy. Int. J. Biol. Macromol. 2002, 31, 79–85. [Google Scholar] [CrossRef]
  34. Sanderson, J.S.; Daniels, R.D.; Donald, A.M.; Blennow, A.; Engelsen, S.B. Exploratory SAXS and HPAEC-PAD studies of starches from diverse plant genotypes. Carbohydr. Polym. 2006, 64, 433–443. [Google Scholar] [CrossRef]
  35. Blazek, J.; Gilbert, E.P. Application of small-angle X-ray and neutron scattering techniques to the characterisation of starch structure: A review. Carbohydr. Polym. 2011, 85, 281–293. [Google Scholar] [CrossRef]
  36. Witt, T.; Doutch, J.; Gilbert, E.P.; Gilbert, R.G. Relations between molecular, crystalline and lamellar structures of amylopectin. Biomacromolecules 2012, 13, 4273–4282. [Google Scholar] [CrossRef]
  37. Shar, T.; Sheng, Z.H.; Ali, U.; Fiaz, S.; Wei, X.J.; Xie, L.H.; Jiao, C.A.; Ali, F.; Shao, G.N.; Hu, S.K.; et al. Mapping quantitative trait loci associated with starch paste viscosity attributes by using double haploid populations of rice (Oryza sativa L.). J. Integr. Agric. 2020, 19, 1691–1703. [Google Scholar] [CrossRef]
  38. Singh, N.; Kuar, L.; Sandhu, K.S.; Kuar, J.; Nishinari, K. Relationships between physicochemical, morphological, thermal, rheological properties of rice starches. Food Hydrocoll. 2006, 20, 532–542. [Google Scholar] [CrossRef]
  39. Collado, L.S.; Mabesa, R.C.; Corke, H. Genetic variation in the physical properties of sweet potato starch. J. Agric. Food Chem. 1999, 47, 4195–4201. [Google Scholar] [CrossRef] [PubMed]
  40. Bogracheva, T.Y.; Morris, V.J.; Ring, S.G.; Hedley, C.L. The granular structure of C-type pea starch and its role in gelatinization. Biopolym. Orig. Res. Biomol. 1998, 45, 323–332. [Google Scholar] [CrossRef]
  41. Fan, X.; Zhao, L.; Zhang, L.; Xu, B.; Wei, C. A new allomorph distribution of C-type starch from root tuber of Apios fortunei. Food Hydrocoll. 2017, 66, 334–342. [Google Scholar] [CrossRef]
  42. Wei, C.; Qin, F.; Zhou, W.; Chen, Y.; Xu, B.; Wang, Y.; Gu, M.; Liu, Q. Formation of semi-compound C-type starch granule in high-amylose rice developed by antisense RNA inhibition of starch-branching enzyme. J. Agric. Food Chem. 2010, 58, 11097–11104. [Google Scholar] [CrossRef]
  43. Cai, C.; Cai, J.; Man, J.; Yang, Y.; Wang, Z.; Wei, C. Allomorph distribution and granule structure of lotus rhizome C-type starch during gelatinization. Food Chem. 2014, 142, 408–415. [Google Scholar] [CrossRef] [PubMed]
Figure 1. Granule size distributions of starches from root tubers of Ningzishu 1 (A), Sushu 16 (B), and Sushu 28 (C) in growing locations of Linquan (LQ), Rugao (RG), Yangzhou (YZ), and Zunyi (ZY).
Molecules 26 07137 g001
Figure 2. Iodine absorption spectra of starches from root tubers of Ningzishu 1 (A), Sushu 16 (B), and Sushu 28 (C) in growing locations of Linquan (LQ), Rugao (RG), Yangzhou (YZ), and Zunyi (ZY).
Molecules 26 07137 g002
Figure 3. High temperature (A) and low temperature (B) of every day during growth stage of sweet potato in growing locations of Linquan (LQ), Rugao (RG), Yangzhou (YZ), and Zunyi (ZY).
Molecules 26 07137 g003
Figure 4. XRD spectra of starches from root tubers of Ningzishu 1 (A), Sushu 16 (B), and Sushu 28 (C) in growing locations of Linquan (LQ), Rugao (RG), Yangzhou (YZ), and Zunyi (ZY).
Molecules 26 07137 g004
Figure 5. FTIR spectra of starches from root tubers of Ningzishu 1 (A), Sushu 16 (B), and Sushu 28 (C) in growing locations of Linquan (LQ), Rugao (RG), Yangzhou (YZ) and Zunyi (ZY).
Molecules 26 07137 g005
Figure 6. SAXS profiles of starches from root tubers of Ningzishu 1 (A), Sushu 16 (B), and Sushu 28 (C) in growing locations of Linquan (LQ), Rugao (RG), Yangzhou (YZ) and Zunyi (ZY).
Molecules 26 07137 g006
Figure 7. RVA profiles of starches from root tubers of Ningzishu 1 (A), Sushu 16 (B), and Sushu 28 (C) in growing locations of Linquan (LQ), Rugao (RG), Yangzhou (YZ), and Zunyi (ZY).
Molecules 26 07137 g007
Figure 8. DSC thermograms of starches from root tubers of Ningzishu 1 (A), Sushu 16 (B), and Sushu 28 (C) in growing locations of Linquan (LQ), Rugao (RG), Yangzhou (YZ), and Zunyi (ZY).
Molecules 26 07137 g008
Table 1. Effects of variety and growing location on granule size, iodine absorption parameters, and amylose content of starch from sweet potato root tuber.
VarietyLocationD[4,3] (μm)Iodine Absorption ParametersAC (%)
OD620OD680OD620/550λmax (nm)
Ningzishu 1LQ16.06 ± 0.01iB0.332 ± 0.010bcB0.297 ± 0.005bB1.145 ± 0.017abA606.5 ± 0.5aA16.4 ± 0.9aA
RG18.22 ± 0.02kD0.339 ± 0.010bcdB0.302 ± 0.006bcB1.156 ± 0.033abcA606.1 ± 0.2aA16.6 ± 0.3aA
YZ13.33 ± 0.01bA0.275 ± 0.002aA0.257 ± 0.005aA1.232 ± 0.021efB625.6 ± 2.4dB16.7 ± 0.3aA
ZY17.50 ± 0.02jC0.361 ± 0.005eC0.321 ± 0.004deC1.128 ± 0.021aA606.4 ± 0.4aA17.7 ± 0.4abA
Sushu 16LQ13.79 ± 0.01dB0.339 ± 0.002bcdB0.308 ± 0.004bcdAB1.196 ± 0.006cdeA613.9 ± 2.6cB18.4 ± 0.1bcA
RG15.39 ± 0.01hD0.339 ± 0.010bcdB0.308 ± 0.011bcdAB1.193 ± 0.021bcdeA609.3 ± 0.8abA19.5 ± 0.5cdeA
YZ13.53 ± 0.02cA0.322 ± 0.005bA0.294 ± 0.007bA1.208 ± 0.006defA609.2 ± 2.0abA19.0 ± 0.4bcdA
ZY14.75 ± 0.03gC0.353 ± 0.003deB0.326 ± 0.007eB1.235 ± 0.006efB610.7 ± 0.4bcAB21.2 ± 0.2fB
Sushu 28LQ14.14 ± 0.01eB0.334 ± 0.010bcdB0.302 ± 0.010bcB1.175 ± 0.015abcdA611.1 ± 0.6bcB19.8 ± 0.6cdefAB
RG14.19 ± 0.01fC0.333 ± 0.007bcB0.298 ± 0.006bB1.178 ± 0.010bcdA606.8 ± 1.2aA21.1 ± 0.3efB
YZ12.11 ± 0.01aA0.260 ± 0.006aA0.243 ± 0.004aA1.252 ± 0.026fB629.0 ± 2.4eC18.3 ± 0.6bcA
ZY14.13 ± 0.02eB0.347 ± 0.003cdeB0.316 ± 0.003cdeC1.191 ± 0.016bcdeA606.4 ± 0.4aA20.3 ± 0.3defB
F-valueVariety (2)94054.64 ***25.00 ***29.17 ***18.10 ***10.95 ***109.55 ***
Location (3)63443.40 ***161.64 ***120.35 ***19.68 ***180.67 ***19.14 ***
Variety × Location (6)9144.67 ***15.41 ***9.15 ***7.02 ***61.03 ***5.93 **
D[4,3]: volume-weighted mean diameter; OD620 and OD680: absorption value of starch–iodine complex at 620 and 680 nm, respectively; OD620/550: ratio of absorption value of starch–iodine complex at 620 and 550 nm; λmax: maximum absorption wavelength of starch–iodine complex; AC: amylose content. Data are means ± standard deviations, n = 3. Values with different lowercase letters in the same column are significantly different (p < 0.05), and values with different capital letters in the same column and the same variety are significantly different (p < 0.05). The number in the parentheses is the freedom degree, and ** and *** indicates statistically significant effect at 0.01 and 0.001 level, respectively.
Table 2. Effects of variety and growing location on relative crystallinity, ordered structure, and lamellar structure parameters of starch from sweet potato root tuber.
VarietyLocationRC (%)IR RatioLamellar Parameters
1045/1022 (cm−1)1022/995 (cm−1)PI (a.u.)D (nm)
Ningzishu 1LQ26.2 ± 0.9aA0.650 ± 0.002abA0.974 ± 0.005efC382.3 ± 2.0cdB9.72 ± 0.00aA
RG25.0 ± 1.3aA0.699 ± 0.013deB0.983 ± 0.015fC418.6 ± 0.6dC9.80 ± 0.01abcBC
YZ25.3 ± 0.7aA0.709 ± 0.006deB0.896 ± 0.003aA357.1 ± 3.0bcA9.78 ± 0.00abcB
ZY24.5 ± 0.5aA0.676 ± 0.012bcdAB0.934 ± 0.005bcdB384.8 ± 4.6cdB9.82 ± 0.02abcC
Sushu 16LQ24.9 ± 1.9aA0.634 ± 0.001aA1.103 ± 0.009gB331.2 ± 1.5bC9.86 ± 0.03bcA
RG22.8 ± 1.7aA0.659 ± 0.004abcA0.954 ± 0.010deA257.7 ± 7.3aA10.15 ± 0.02eC
YZ24.3 ± 0.1aA0.702 ± 0.012deB0.945 ± 0.002cdA289.2 ± 0.8aB10.21 ± 0.01eC
ZY24.9 ± 0.3aA0.697 ± 0.014deB0.922 ± 0.014bcA332.4 ± 4.7bC10.02 ± 0.01dB
Sushu 28LQ23.7 ± 0.4aA0.678 ± 0.007bcdA0.977 ± 0.005efC275.5 ± 8.3aA9.87 ± 0.08bcA
RG26.2 ± 0.8aA0.695 ± 0.012cdeA0.925 ± 0.002bcB417.8 ± 7.2dB9.76 ± 0.01abA
YZ24.7 ± 0.8aA0.726 ± 0.019eA0.931 ± 0.003bcdB332.0 ± 35.1bA9.88 ± 0.00cA
ZY23.4 ± 1.3aA0.703 ± 0.012deA0.911 ± 0.003abA283.2 ± 1.6aA9.89 ± 0.07cA
F-valueVariety (2)2.1513.42 **73.34 ***119.16 ***163.16 ***
Location (3)0.4630.45 ***197.87 ***15.42 ***18.20 ***
Variety × Location (6)2.693.33 *52.74 ***43.11 ***18.96 ***
RC: relative crystallinity; 1045/1022: ratio of peak intensity at 1045 and 1022 cm−1; 1022/995: ratio of peak intensity at 1022 and 995 cm–1; PI: lamellar peak intensity; D: lamellar thickness. Data are means ± standard deviations, n = 3. Values with different lowercase letters in the same column are significantly different (p < 0.05), and values with different capital letters in the same column and the same variety are significantly different (p < 0.05). The number in the parentheses is the degree of freedom, and *, ** and *** indicates statistically significant effect at the 0.05, 0.01 and 0.001 level, respectively.
Table 3. Effects of variety and growing location on pasting properties of starch from sweet potato root tuber.
VarietyLocationPV (mPa s)HV (mPa s)BV (mPa s)FV (mPa s)SV (mPa s)PTemp (°C)PTime (min)
Ningzishu 1LQ4635 ± 29 gC2546 ± 27eC2090 ± 29eC3087 ± 51cB541 ± 25aA75.47 ± 0.45eB4.40 ± 0.07cA
RG4171 ± 20bcdA2478 ± 27dB1693 ± 45bB3034 ± 17cB556 ± 11abA78.73 ± 0.46gC4.60 ± 0.07dB
YZ4293 ± 65defB2788 ± 26fD1504 ± 43aA3471 ± 42dC682 ± 16deC73.08 ± 0.51cA4.62 ± 0.04dB
ZY4273 ± 26cdeB2171 ± 16aA2102 ± 10eC2802 ± 21aA631 ± 24bcdB78.98 ± 0.08gC4.42 ± 0.08cA
Sushu 16LQ4656 ± 63gC2363 ± 42cB2293 ± 45fD2925 ± 12bB562 ± 49abA71.68 ± 0.03bA4.42 ± 0.04cB
RG4145 ± 34bcA2306 ± 28bcB1839 ± 28cA2938 ± 13bB633 ± 20bcdAB74.18 ± 0.03dC4.60 ± 0.01dC
YZ4102 ± 25bA2113 ± 29aA1989 ± 7dB2769 ± 26aA656 ± 33cdB72.47 ± 0.03bcB4.47 ± 0.01cB
ZY4383 ± 42efB2178 ± 16aA2205 ± 39fC2947 ± 36bB769 ± 43fC76.05 ± 0.48efD4.22 ± 0.04bA
Sushu 28LQ4929 ± 52hD2338 ± 39bcA2591 ± 14hC2942 ± 55bA604 ± 16abcdA70.55 ± 0.48aA4.20 ± 0.07bB
RG3918 ± 89aA2439 ± 26dB1479 ± 64aA3026 ± 21cB587 ± 45abcA76.88 ± 0.45fC4.51 ± 0.04cdC
YZ4415 ± 79fB2846 ± 36fC1569 ± 44aA3579 ± 35eC733 ± 32efB70.07 ± 0.06aA4.44 ± 0.04cC
ZY4739 ± 40gC2274 ± 22bA2465 ± 43gB2920 ± 25bA645 ± 6 cd A72.80 ± 0.52cB4.07 ± 0.07aA
F-valueVariety (2)42.75 ***289.82 ***125.27 ***173.57 ***10.11 **384.62 ***49.45 ***
Location (3)268.63 ***254.21 ***787.49 ***233.50 ***38.92 ***377.46 ***81.60 ***
Variety × Location (6)34.44 ***131.76 ***98.02 ***142.61 ***7.75 ***50.46 ***6.17 **
PV: peak viscosity; HV: heat viscosity; BV: breakdown viscosity (PV–HV); FV: final viscosity; SV: setback viscosity (FV–HV); PTemp: pasting temperature; PTime: peak time. Data are means ± standard deviations, n = 3. Values with different lowercase letters in the same column are significantly different (p < 0.05), and values with different capital letters in the same column and the same variety are significantly different (p < 0.05). The number in the parentheses is the degree of freedom, and ** and *** indicates statistically significant effect at the 0.01 and 0.001 level, respectively.
Table 4. Effects of variety and growing location on swelling power, water solubility, and thermal property parameters of starch from sweet potato root tuber.
VarietiesLocationsSP (g/g)WS (%)Thermal Property Parameters
To (°C)Tp (°C)Tc (°C)ΔT (°C)ΔH (J/g)
Ningzishu 1LQ30.9 ± 0.2cA12.7 ± 0.5aA59.9 ± 0.1gB73.3 ± 0.1fB80.8 ± 0.1cA20.9 ± 0.2bA14.3 ± 0.1cB
RG29.9 ± 0.9bcA12.5 ± 0.6aA62.9 ± 0.1hC77.2 ± 0.3gD84.0 ± 0.5fC21.1 ± 0.3bA14.2 ± 0.1cB
YZ30.1 ± 0.7bcA12.9 ± 0.5aA57.6 ± 0.1fA69.5 ± 0.6deA82.1 ± 0.4deB24.5 ± 0.4cdC13.2 ± 0.6abcA
ZY30.2 ± 0.6bcA14.4 ± 0.7bcB60.1 ± 0.1gB76.2 ± 0.2gC83.3 ± 0.3efC23.1 ± 0.2cB14.1 ± 0.5cB
Sushu 16LQ32.6 ± 0.6dB15.4 ± 0.1cA54.8 ± 0.2cA61.2 ± 0.2aA80.9 ± 0.4cA26.1 ± 0.3eB13.2 ± 0.6abcA
RG29.9 ± 0.6bcA15.2 ± 0.8cA57.7 ± 0.5fC70.0 ± 0.9eC83.0 ± 0.3efB25.3 ± 0.6deB12.2 ± 0.6abA
YZ29.8 ± 0.5bcA14.2 ± 0.5bcA55.7 ± 0.4dB68.7 ± 0.4dB82.3 ± 0.7deB26.6 ± 0.9eB12.7 ± 0.4abcA
ZY29.1 ± 0.4bA17.9 ± 0.6dB62.8 ± 0.2hD73.0 ± 0.4fB80.7 ± 0.5cA17.9 ± 0.6aA13.3 ± 0.7bcA
Sushu 28LQ28.9 ± 0.2bB13.5 ± 0.1abA53.1 ± 0.1bB66.4 ± 0.5cB77.4 ± 0.4aA24.3 ± 0.4cdB12.8 ± 0.7abcA
RG27.4 ± 0.5aA14.6 ± 0.1bcB57.9 ± 0.2fD73.5 ± 0.3fD81.5 ± 0.3cdC23.6 ± 0.4cB13.3 ± 0.7bcA
YZ26.7 ± 0.4aA12.8 ± 0.4aA51.1 ± 0.3aA64.1 ± 0.4bA79.2 ± 0.9bB28.1 ± 1.1fC11.7 ± 0.7aA
ZY29.8 ± 0.5bcB15.3 ± 0.6cB56.5 ± 0.4eC69.1 ± 0.2deC77.3 ± 0.2aA20.9 ± 0.2bA12.9 ± 0.6abcA
F-valueVariety (2)62.68 ***75.16 ***1467.13 ***796.78 ***205.24 ***41.10 ***18.39 ***
Location (3)23.27 ***41.71 ***911.93 ***644.24 ***73.36 ***173.62 ***5.29 **
Variety × Location (6)11.76 ***4.42 **195.71 ***157.12 ***11.25 ***62.30 ***2.78 *
SP: swelling power; WS: water solubility; To: gelatinization onset temperature; Tp: gelatinization peak temperature; Tc: gelatinization conclusion temperature; ΔT: gelatinization temperature range (Tc–To); ΔH: gelatinization enthalpy. Data are means ± standard deviations, n = 3. Values with different lowercase letters in the same column are significantly different (p < 0.05), and values with different capital letters in the same column and the same variety are significantly different (p < 0.05). The number in the parentheses is the degree of freedom, and *, ** and *** indicates statistically significant effect at the 0.05, 0.01, and 0.001 level, respectively.
Table 5. Effects of variety and growing location on digestion properties of native and gelatinized starches.
VarietiesLocationsNative StarchGelatinized Starch
RDS (%)SDS (%)RS (%)RDS (%)SDS (%)RS (%)
Ningzishu 1LQ3.2 ± 0.1cC10.3 ± 0.3aB86.5 ± 0.4gB70.5 ± 1.1aA6.2 ± 0.5bcAB23.3 ± 1.5eB
RG2.7 ± 0.1bB9.2 ± 0.2aA88.1 ± 0.3ghC72.9 ± 0.9abcAB7.9 ± 0.2cdB19.2 ± 1.1cdA
YZ5.1 ± 0.1fD16.6 ± 0.6cC78.3 ± 0.7deA75.0 ± 1.6bcdB7.7 ± 0.5cdB17.3 ± 1.4cA
ZY2.2 ± 0.1aA8.8 ± 0.3aA89.1 ± 0.4hC74.4 ± 1.8bcdB5.5 ± 1.6bA20.1 ± 0.2dA
Sushu 16LQ5.0 ± 0.1fC18.3 ± 0.4dB76.6 ± 0.5dB78.4 ± 0.6efB10.2 ± 0.3efAB11.5 ± 0.8abA
RG4.1 ± 0.1dB16.3 ± 0.6bcA79.6 ± 0.7efC76.0 ± 1.3cdeB10.7 ± 0.7fB13.3 ± 0.6bB
YZ7.9 ± 0.3hD29.6 ± 0.9eC62.5 ± 1.1bA77.1 ± 0.7deB11.0 ± 0.4fB11.8 ± 0.4abA
ZY3.3 ± 0.2cA16.6 ± 0.2cA80.0 ± 0.4efC72.6 ± 2.0abA8.2 ± 1.8cdA19.2 ± 0.3cdC
Sushu 28LQ6.5 ± 0.2gB19.0 ± 0.6dB74.5 ± 0.9cB80.7 ± 0.6fB8.5 ± 0.3deC10.8 ± 0.8aA
RG4.6 ± 0.0eA15.1 ± 0.0bcA80.3 ± 0.1efC78.3 ± 1.5efA2.1 ± 0.8aA19.6 ± 1.1dB
YZ10.9 ± 0.3iC30.9 ± 1.4eC58.2 ± 1.6aA81.1 ± 0.3fB7.9 ± 0.3cdC11.0 ± 0.5aA
ZY4.6 ± 0.1eA14.7 ± 0.8bA80.6 ± 0.9fC81.4 ± 0.2fB6.7 ± 0.3bcdB12.0 ± 0.4abA
F-valueVariety (2)361.59 ***1267.42 ***745.02 ***109.19 ***75.68 ***220.52 ***
Location (3)125.27 ***1425.86 ***727.37 ***4.77 **14.92 ***42.25 ***
Variety × Location (6)9.16 ***88.32 ***29.75 ***10.29 ***19.44 ***54.79 ***
RDS: rapidly digestible starch degraded within 20 min; SDS: slowly digestible starch degraded between 20 min and 2 h; RS; resistant starch undegraded within 2 h. Data are means ± standard deviations, n = 3. Values with different lowercase letters in the same column are significantly different (p < 0.05), and values with different capital letters in the same column and the same variety are significantly different (p < 0.05). The number in the parentheses is the degree of freedom, and ** and *** indicates statistically significant effect at the 0.01 and 0.001 level, respectively.
Publisher’s Note: MDPI stays neutral with regard to jurisdictional claims in published maps and institutional affiliations.

