Article

Application of UHPLC Fingerprints Combined with Chemical Pattern Recognition Analysis in the Differentiation of Six Rhodiola Species

1
School of Pharmacy, Shenyang Pharmaceutical University, Shenyang 110016, China
2
Shenzhen Institute for Drug Control, Shenzhen 518057, China
3
NMPA Key Laboratory for Quality Research and Evaluation of Traditional Chinese Medicine, Shenzhen Institute for Drug Control, Shenzhen 518057, China
4
Shenzhen Key Laboratory of Drug Quality Standard Research, Shenzhen Institute for Drug Control, Shenzhen 518057, China
*
Authors to whom correspondence should be addressed.
Molecules 2021, 26(22), 6855; https://doi.org/10.3390/molecules26226855
Submission received: 23 October 2021 / Revised: 8 November 2021 / Accepted: 11 November 2021 / Published: 13 November 2021

Abstract

:
Rhodiola, especially Rhodiola crenulate and Rhodiola rosea, is an increasingly widely used traditional medicine or dietary supplement in Asian and western countries. Because of the phytochemical diversity and difference of therapeutic efficacy among Rhodiola species, it is crucial to accurately identify them. In this study, a simple and efficient method of the classification of Rhodiola crenulate, Rhodiola rosea, and their confusable species (Rhodiola serrata, Rhodiola yunnanensis, Rhodiola kirilowii and Rhodiola fastigiate) was established by UHPLC fingerprints combined with chemical pattern recognition analysis. The results showed that similarity analysis and principal component analysis (PCA) could not achieve accurate classification among the six Rhodiola species. Linear discriminant analysis (LDA) combined with stepwise feature selection exhibited effective discrimination. Seven characteristic peaks that are responsible for accurate classification were selected, and their distinguishing ability was successfully verified by partial least-squares discriminant analysis (PLS-DA) and orthogonal partial least-squares discriminant analysis (OPLS-DA), respectively. Finally, the components of these seven characteristic peaks were identified as 1-(2-Hydroxy-2-methylbutanoate) β-D-glucopyranose, 4-O-glucosyl-p-coumaric acid, salidroside, epigallocatechin, 1,2,3,4,6-pentagalloyglucose, epigallocatechin gallate, and (+)-isolarisiresinol-4′-O-β-D-glucopyranoside or (+)-isolarisiresinol-4-O-β-D-glucopyranoside, respectively. The results obtained in our study provided useful information for authenticity identification and classification of Rhodiola species.

1. Introduction

Rhodiola, a genus of perennial herbaceous plants in the family Crassulaceae, comprises more than 100 species, at least 70 of which have been recorded in China [1]. Many species of Rhodiola have been used as traditional medicines or dietary supplements in Asia, Europe, and the United States to improve overall health. Rhodiola crenulate is the only official species recorded in the Chinese Pharmacopoeia, its root and rhizome are widely used in Tibetan medicine and traditional Chinese medicine for its observable effects, such as acute mountain sickness and fatigue resistance [2,3]. Rhodiola rosea is a commonly used species in western countries and is present in the market as a dietary supplement with antifatigue, antistress, and antidepressant properties [4,5]. Rhodiola kirilowii is recorded in the standardization of traditional Chinese medicine in Gansu province for hemostasis, alleviating pain, trauma, irregular menstruation, and dysentery [6]. Furthermore, Rhodiola fastigata is used for dissipating blood stasis, detumescence, and trauma; Rhodiola yunnanensis is used in detumescence, rheumatism, ostalgia, mastitis, furuncle, and open fracture [7]. In China, Rhodiola crenulata has been generally recognized as the appropriate raw materials of high quality for making various products, including medicines, functional foods, and cosmetics [8]. Like Rhodiola crenulata, the increasing demand for Rhodiola rosea in western countries has also caused its shortage. Therefore, other Rhodiola species such as Rhodiola serrata, Rhodiola yunnanensis, Rhodiola kirilowii, and Rhodiola fastigiate have been sold as Rhodiola crenulate or Rhodiola rosea in the market [8,9], while different species of Rhodiola possess different pharmacological activities. However, the morphologies of different species of commercial Rhodiola samples are too similar to distinguish visually [10]. Salidroside and tyrosol are commonly considered as chemical markers for quality control, including methods documented in Pharmacopoeia [2,11,12]. However, it has been reported that salidroside and tyrosol are the common components in various Rhodiola extracts [1]. Owing to the complex composition of Rhodiola species, it is insufficient to perform quality assessments using one or two chemical markers. There is an urgent need to establish a comprehensive quality evaluation method among the various Rhodiola species based on their integral components.
Fingerprint analysis has become a comprehensive method for quality evaluation of complex traditional Chinese medicines and plant extracts based on the holistic chemical profile obtained by various analytical techniques, such as gas chromatography (GC), high/ultra-high performance liquid chromatography (HPLC/UHPLC), nuclear magnetic resonance (NMR), and infra-red (IR) spectroscopy [13,14]. Among them, HPLC is the commonly used method for fingerprint analysis [15,16]. However, time-consuming, inability to withstand high pressure and large use of organic solvent are considered as its imperfections [17]. These problems have been successfully solved by UHPLC, which means introducing an environment-friendly approach to drug analysis achieved in a shorter run time with increasing resolution [17]. However, UHPLC fingerprints of traditional Chinese medicines often contain highly complex multivariate data that make their interpretation difficult. In recent years, chemical pattern recognition has attracted increasing attention in the fields of data mining, which can simplify complex data and extract hidden information from fingerprints [18]. Therefore, many chemical pattern recognition models have been used to reasonably distinguish the quality differences of the samples, such as hierarchical cluster analysis (HCA), principal component analysis (PCA), linear discriminant analysis (LDA), partial least-squares discriminant analysis (PLS-DA), and orthogonal partial least-squares discriminant analysis (OPLS-DA) [19,20].
In fact, fingerprint combined with chemical pattern recognition has been used in the analysis of Rhodiola. For example, 1H-NMR fingerprinting combined with PCA, PLS-DA, HCA, and gene expression programming was applied to distinguish Rhodiola crenulate, Rhodiola kirilowii, and Rhodiola fastigiate by Li et al. [21]. Li et al. [22] developed a method in the classification of four different species of Rhodiola (Rhodiola crenulata, Rhodiola fastigiata, Rhodiola kirilowii, and Rhodiola brevipetiolata) by fourier transform near-infrared spectroscopy combined with kernel extreme learning machine and PLS-DA analysis. However, a comprehensive and effective method for identification and classification of Rhodiola crenulate, Rhodiola rosea, and more kinds of confusable species in the market and finding out the potential chemical markers would be of great interest.
In this study, Rhodiola crenulata, Rhodiola serrata, Rhodiola yunnanensis, Rhodiola rosea, Rhodiola kirilowii, and Rhodiola fastigiata were selected to investigate their quality variation using UHPLC fingerprints with chemical pattern recognition. Unsupervised (PCA) and supervised (LDA) pattern recognition methods were both applied to discriminate samples based on UHPLC fingerprints. The characteristic peaks responsible for the classification were obtained by LDA, and their distinguishing ability was verified by PLS-DA and OPLS-DA models, respectively. Afterward, UHPLC-Q-TOF-MS/MS was applied to identify the obtained characteristic peaks. The proposed strategy provides a more comprehensive method to evaluate the quality of various Rhodiola species.

2. Results and Discussion

2.1. Optimization of Sample Preparation

The extraction conditions for Rhodiola were optimized by comparing different extraction methods (ultrasonic extraction and refluxing extraction), extraction solvents (water; 30/70, 50/50, 70/30 EtOH/H2O (v/v); and EtOH), and extraction time (15, 30, 45, and 60 min). Compared to refluxing extraction, the ultrasonic method was preferred as it was more efficient, faster, easier to be operated, and required lower extraction temperature and less solvent (Figure S1). As can be seen in Figure S2, the 30/70 EtOH/H2O (v/v) should be selected as an extraction solvent based on the peak numbers and areas. For extraction time, there was a rapid increase in peak numbers and areas from 15 min to 45 min, but after 45 min, the extraction efficiency increased slowly (Figure S3). Results suggested that samples were optimally extracted by the ultrasonic method with 30/70 EtOH/H2O (v/v) for 45 min.

2.2. Optimization of the Chromatographic Conditions

To obtain useful chemical information and better separation, several parameters including detection wavelength (205, 225, 251, 265, 275, and 360 nm), mobile phase composition (acetonitrile/water, methanol/water, acetonitrile/0.1% aqueous formic acid) and temperature (25, 30, 35 and 40 °C) were optimized. The wavelength of 275 nm was selected as a suitable detection wavelength based on the flat baseline, more detectable peaks, and larger response values (Figure S4). As can be seen in Figure S5, the acetonitrile/water system had better resolution than methanol/water. Meanwhile, the addition of 0.1% (v/v) formic acid in water improved the resolution of target compounds. Furthermore, the increase in temperature from 25 °C to 40 °C resulted in improved peak shape and resolution (Figure S6). Therefore, acetonitrile/0.1% aqueous formic acid was considered as the optimum mobile phase and the temperature was set at 40 °C for further studies.

2.3. Methodology Validation

The analytical method was validated through precision, repeatability, and stability, respectively. The system precision was determined by six consecutive injections of the same sample solution. Six independent samples were prepared in parallel for the evaluation of repeatability. The stability was assessed by repeatedly analyzing one sample solution after being stored at room temperature for 0, 2, 4, 8, 12, and 24 h, respectively. For instrument precision, repeatability of the method, and stability of the sample solution, all relative standard deviations (RSDs) including retention times (RTs) and peak areas were <3% (See Supplementary Materials, Table S1), which indicated that the method is suitable for fingerprint analysis.

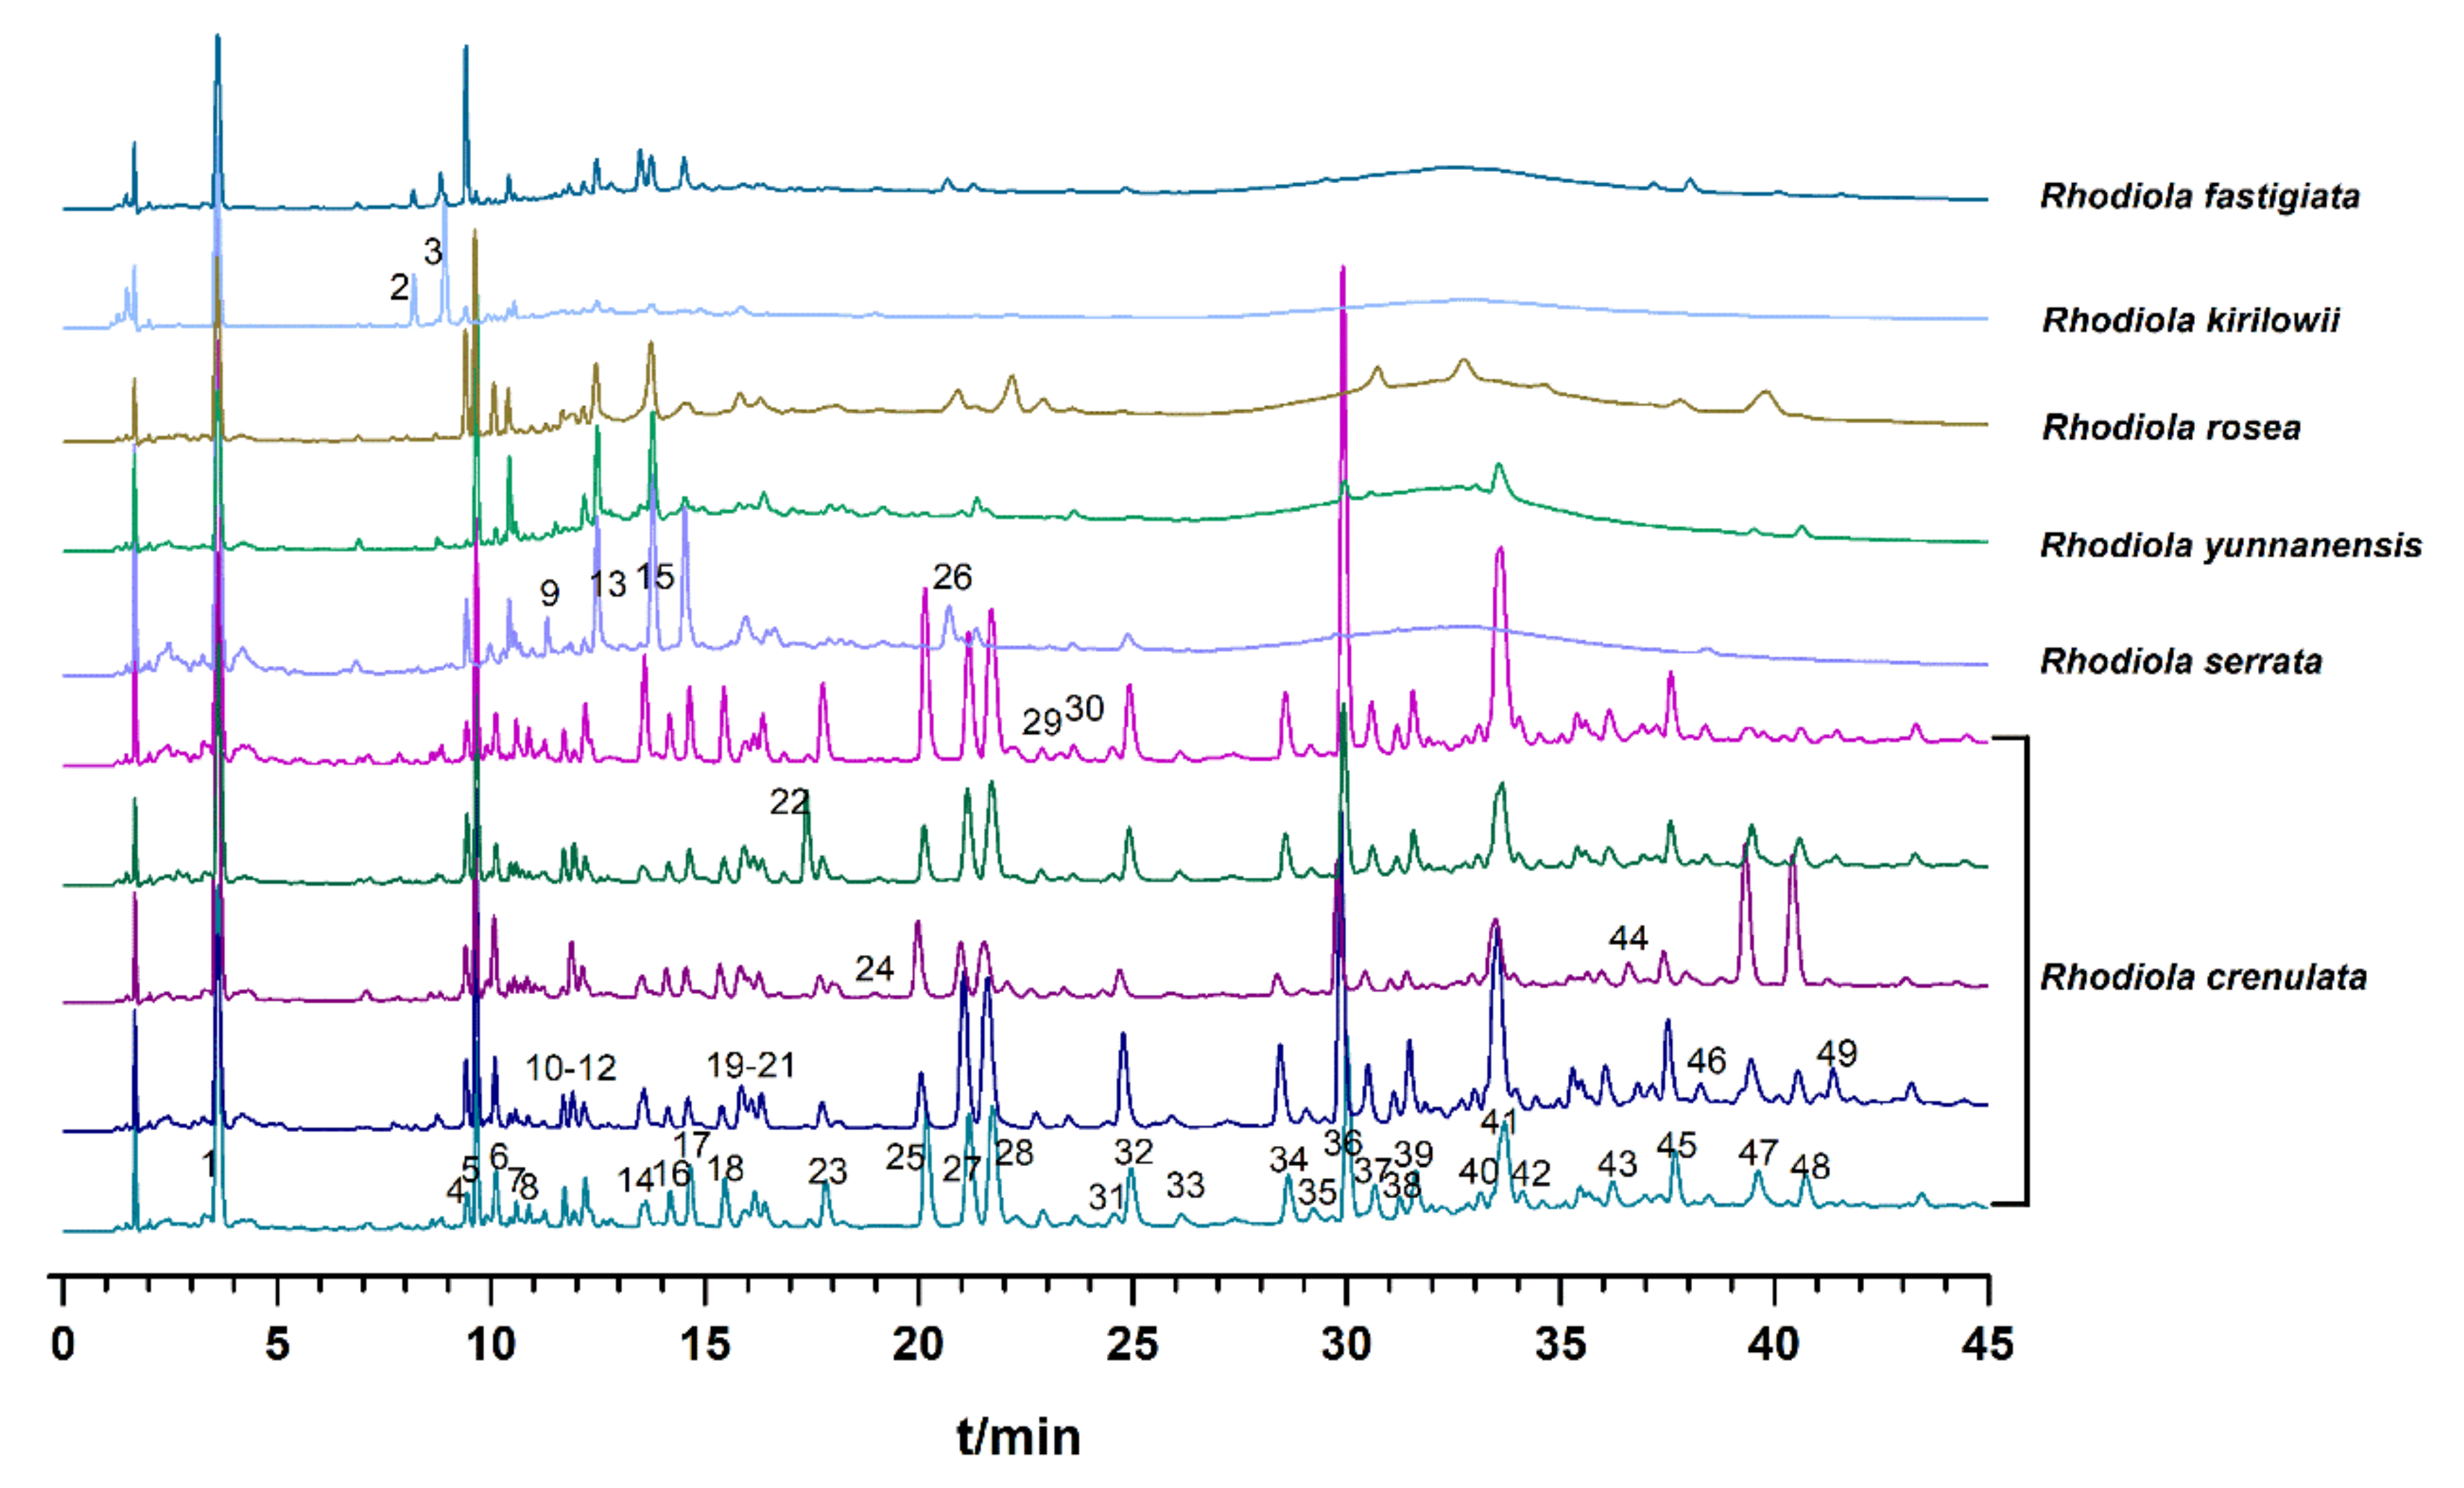
2.4. UHPLC Fingerprint Analysis and Similarity Evaluation

The fingerprints of 159 batches of samples were established under optimized conditions. In fingerprints, a total of 49 peaks were obtained, and the typical chromatograms of Rhodiola crenulate, Rhodiola serrata, Rhodiola yunnanensis, Rhodiola rosea, Rhodiola kirilowii, and Rhodiola fastigiata were presented in Figure 1. Based on the sample fingerprints and reference fingerprint similarities were calculated. The results of similarity values were shown in Table S2, and they were in the range of 0.785 to 0.967 for Rhodiola crenulate, 0.393 to 0.597 for Rhodiola serrata, 0.595 to 0.623 for Rhodiola yunnanensis, 0.449 to 0.459 for Rhodiola rosea, 0.516 to 0.517 for Rhodiola kirilowii, and 0.522 for Rhodiola fastigiata. Rhodiola crenulate could be preliminarily distinguished from others based on similarity values, while no significant difference was observed among other species. Therefore, similarity evaluation was not efficient enough for classifying different Rhodiola species. Consequently, the chemical pattern recognition method was employed to assess the variation in quality.

2.5. Chemical Pattern Recognition Analysis

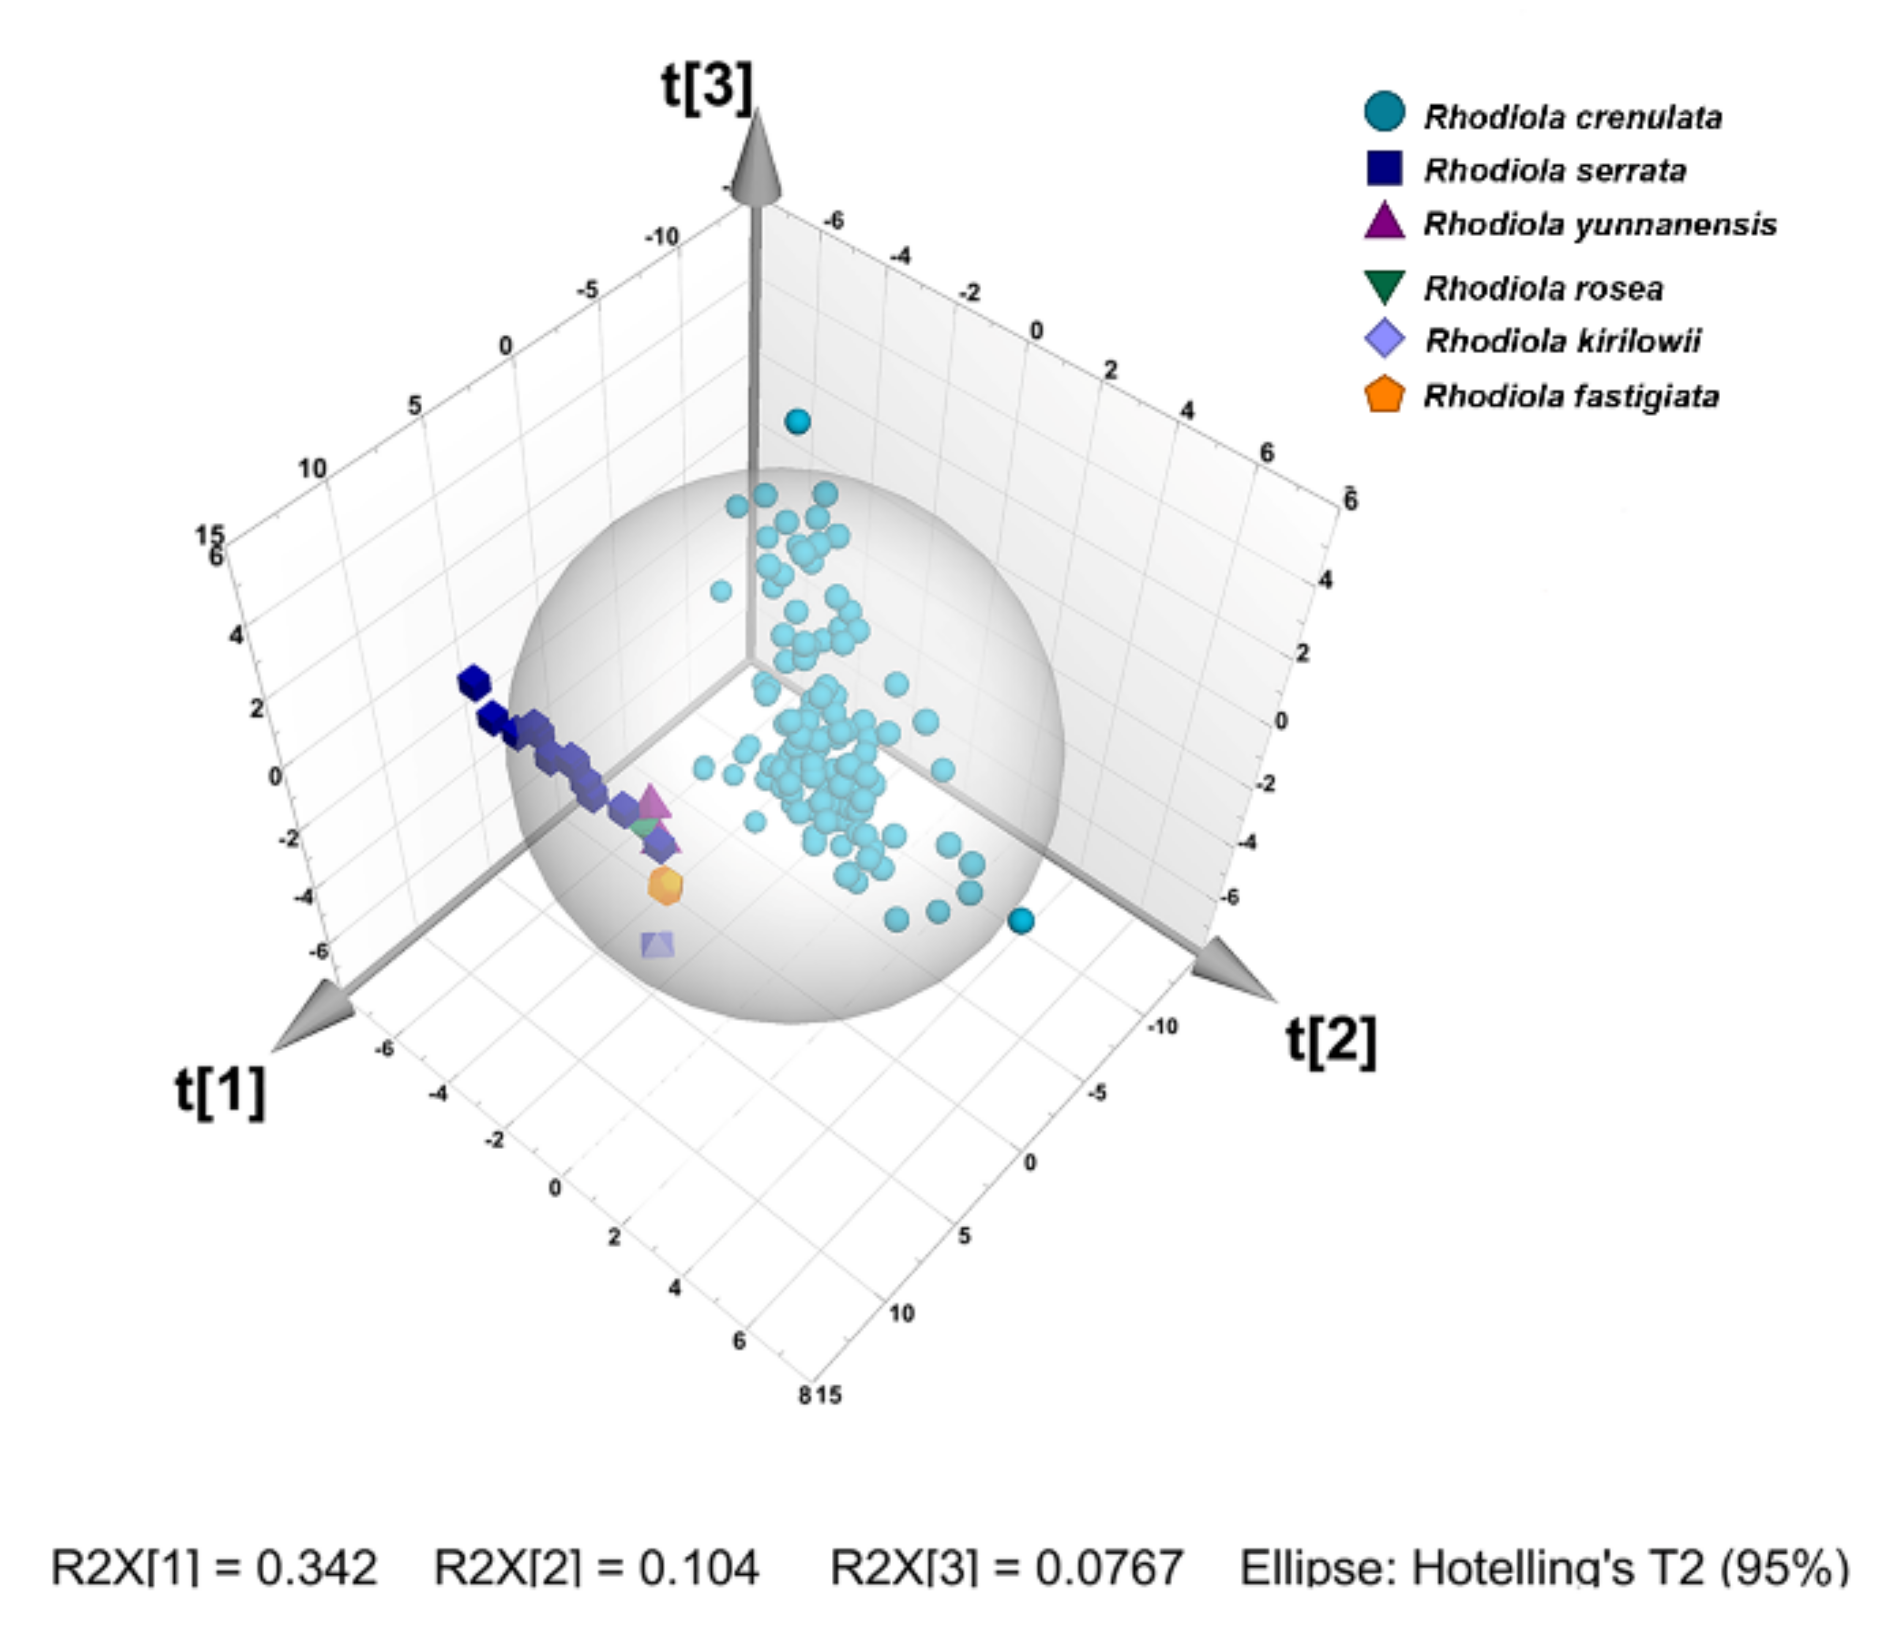
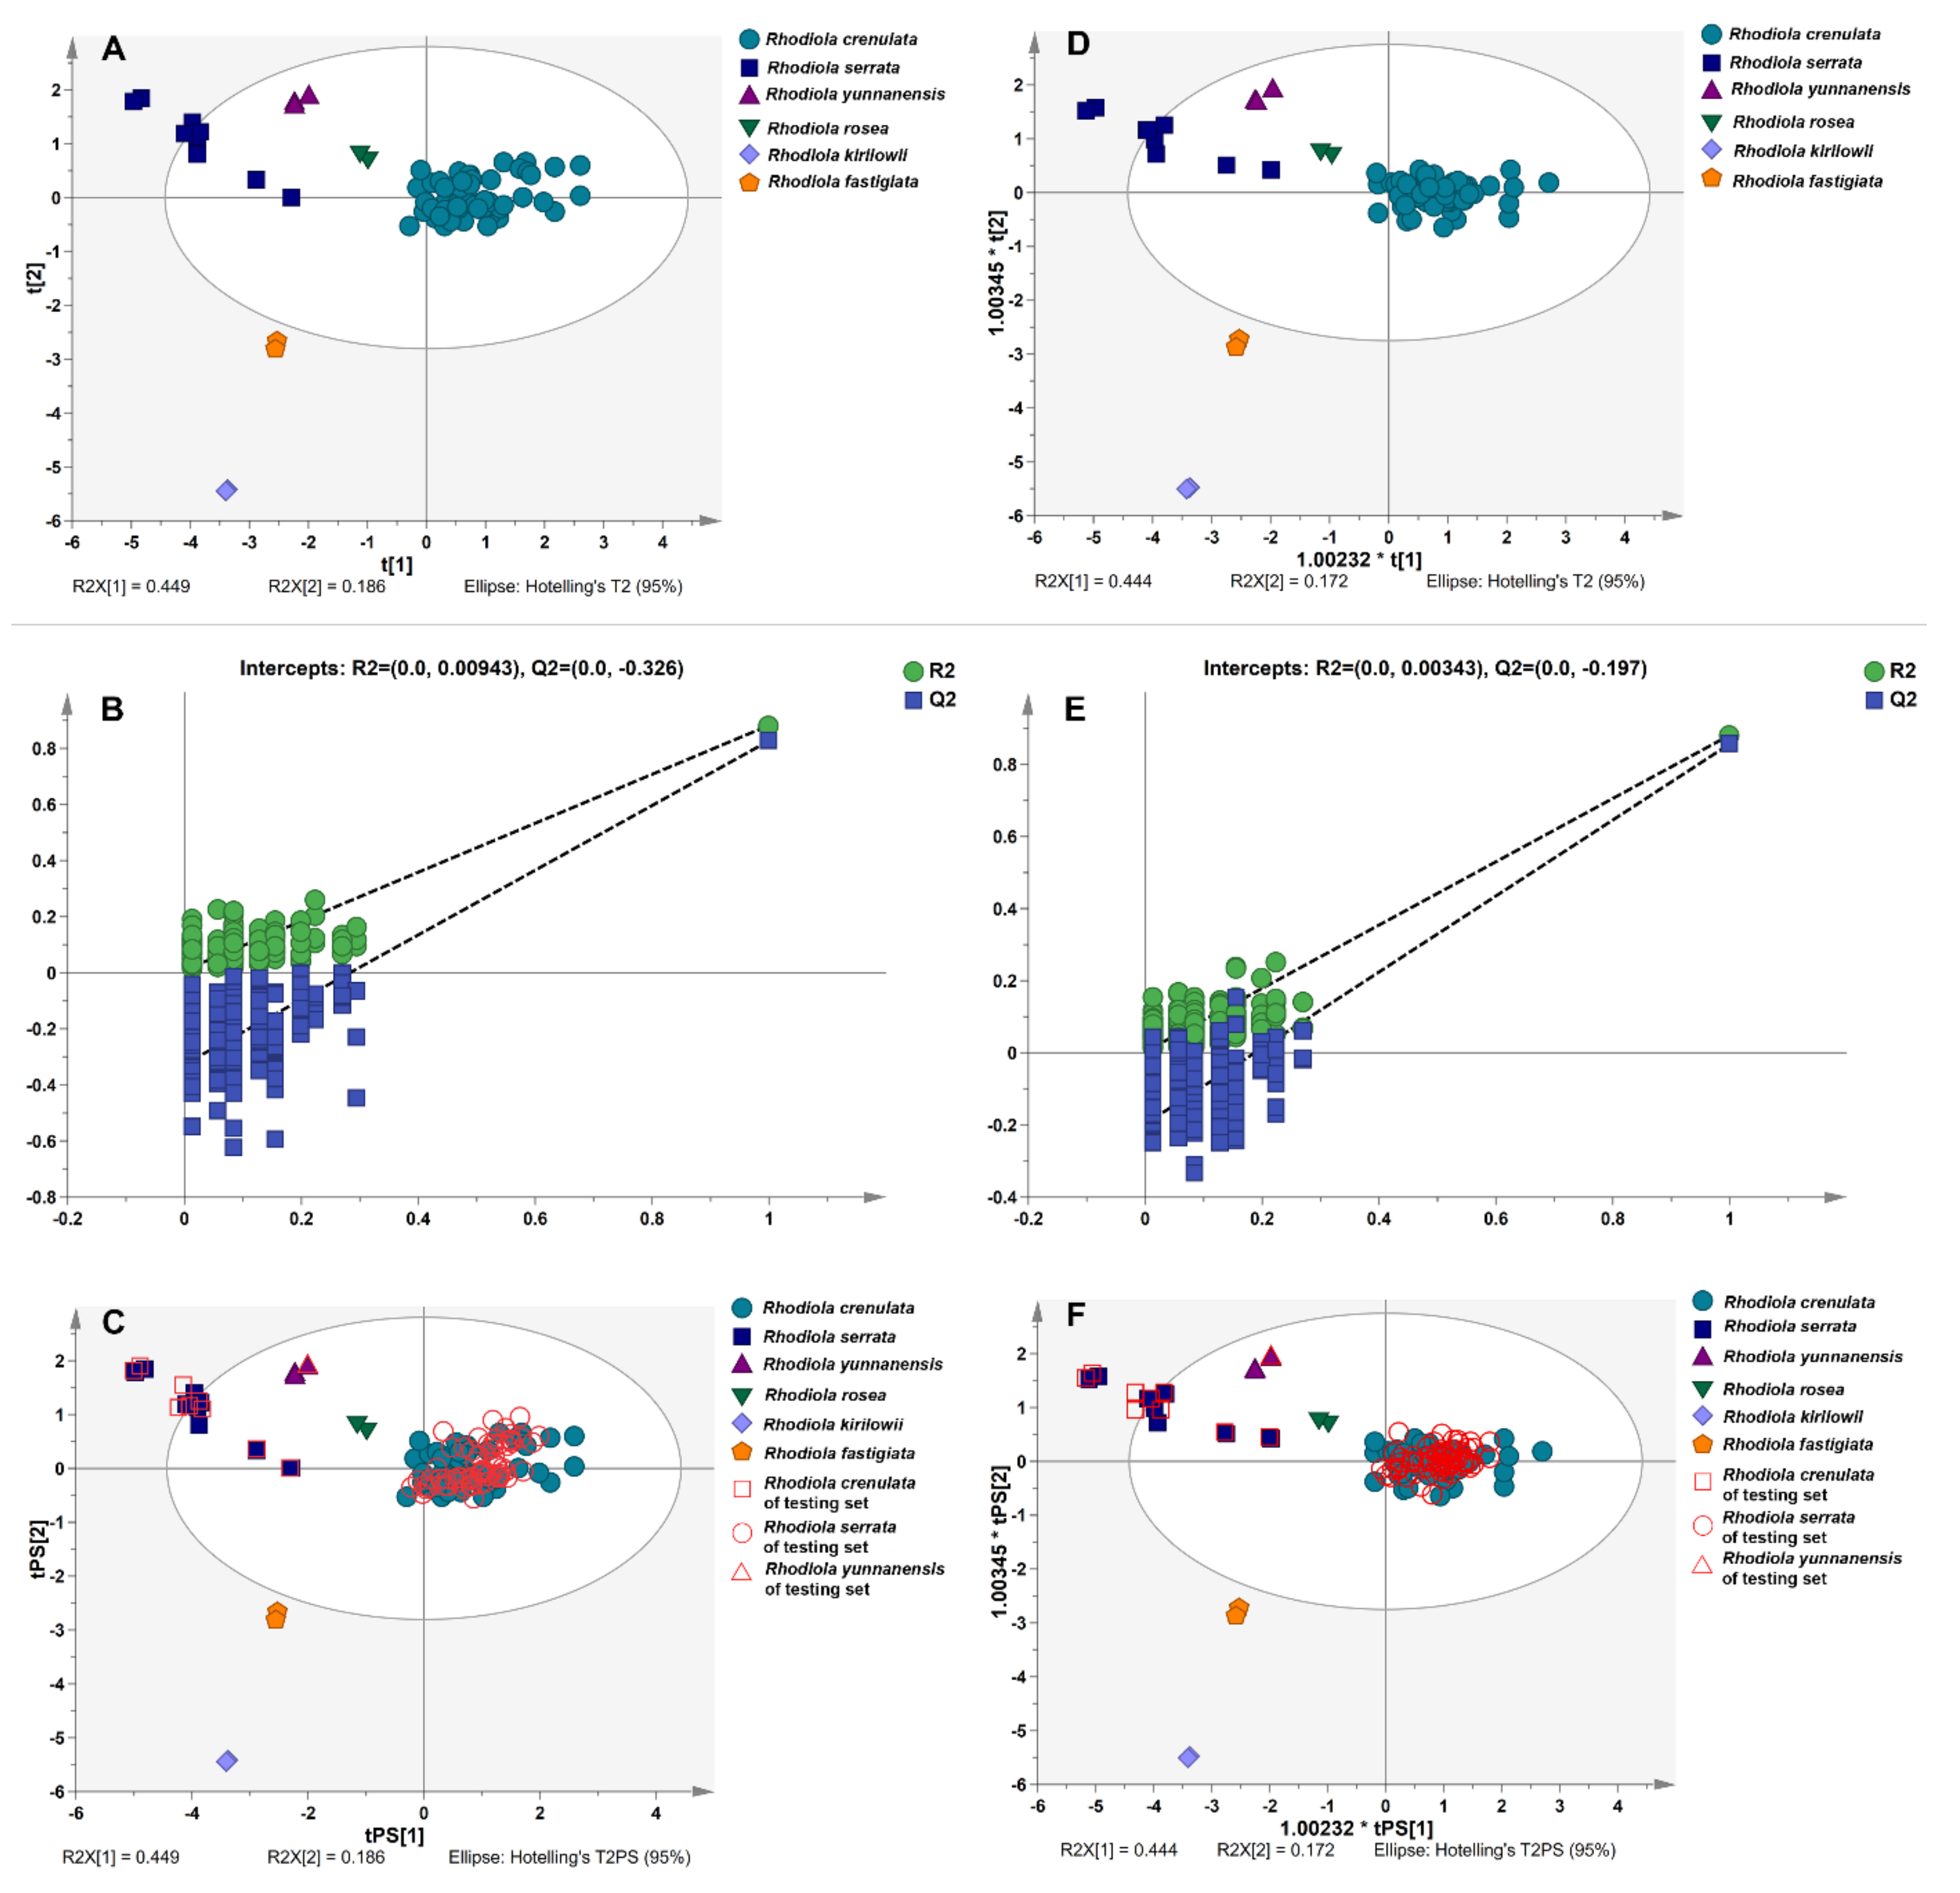
2.5.1. Principal Component Analysis

PCA is widely used for data compression and information extraction by reducing a large number of variables to a small set without losing much information [23]. In this study, PCA was performed based on the data matrix with dimensions 159 (samples) × 49 (peaks). The analysis showed that the standardized peak area matrix was transformed into principal components (PCs) comprising a new set of seven orthogonal variables. The first three PCs were extracted and explained 34.2%, 10.4%, and 7.6% of the total variation, respectively. Figure 2 showed the scores of the first three PCs, illustrating the distribution of the samples from six Rhodiola species. The Rhodiola crenulate could be distinguished clearly from others. However, appropriate visualization and differentiation could not be observed for Rhodiola serrata, Rhodiola yunnanensis, Rhodiola rosea, Rhodiola kirilowii, and Rhodiola fastigiata. The result revealed that PCA was not able to provide an accurate classification for the selected species of Rhodiola. Consequently, the supervised method was needed to find out the specific variation to classify the six species accurately.

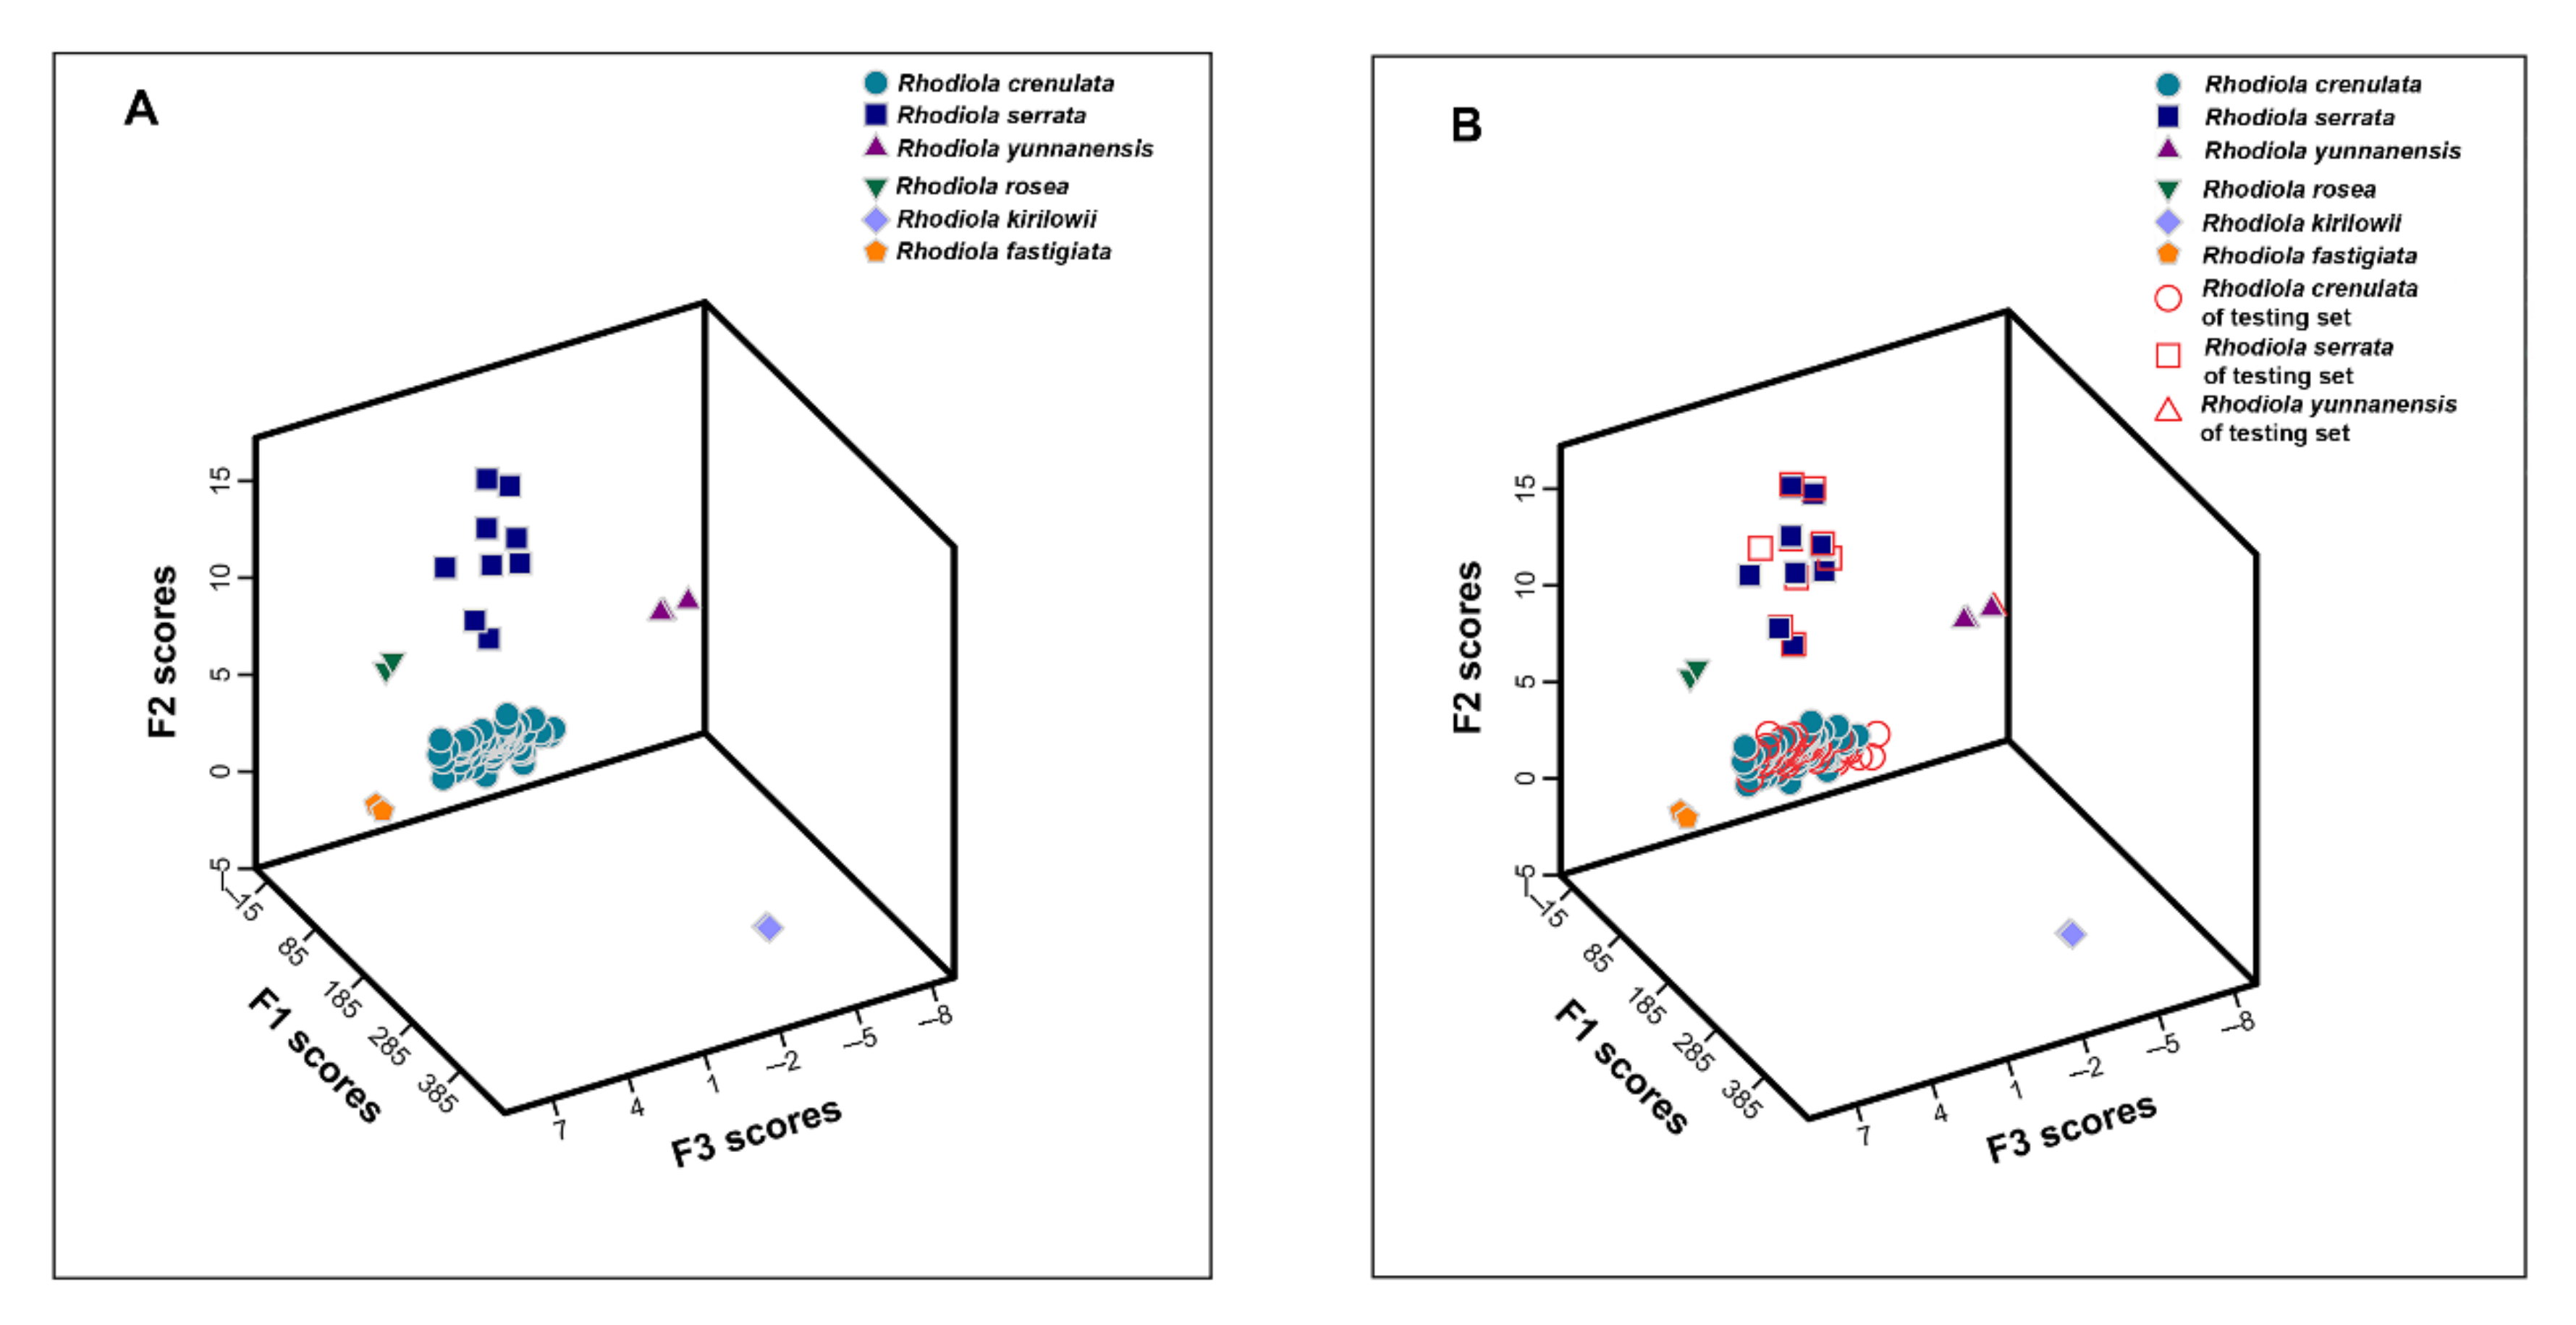
2.5.2. Linear Discriminant Analysis

LDA is a supervised pattern recognition method is frequently used for feature extraction and classification of multivariate data [20]. This procedure generates a set of discriminant functions based on linear combinations of the predictor variables that provide the best discrimination among the different groups [24]. In this work, stepwise LDA was applied to classify Rhodiola according to the related species. The model (function) was obtained using the training set consisting of 85 samples, while 74 samples were used as the testing set to validate the predictive ability. Seven characteristic variables were selected to generate the discriminant functions, which denoted the areas of the peaks 2, 4, 5, 7, 13, 36, and 37, respectively. The six discriminant functions were generated from six different species were as follows:
A = −0.595 × X2 + 3.597 × X4 + 2.574 × X5 + 0.601 × X7 − 0.663 × X13 + 0.410 × X36 − 1.243 × X37 − 15.552
B = 0.133 × X2 + 2.032 × X4 − 0.409 × X5 − 0.013 × X7 + 10.028 × X13 + 0.002 × X36 + 0.419 × X37 − 38.376
C = −0.268 × X2 − 4.616 × X4 + 6.611 × X5 + 13.020 × X7 + 2.488 × X13 + 0.113 × X36 − 10.005 × X37 − 47.297
D = −2.890 × X2 + 11.260 × X4 + 0.150 × X5 + 2.366 × X7 + 4.230 × X13 − 0.804 × X36 + 8.164 × X37 − 51.115
E = 107,875.876 × X2 + 0.641 × X4 + 0.061 × X5 − 0.399 × X7 + 1.092 × X13 + 0.018 × X36 − 0.029 × X37 − 106,799.405
F = 31,321.634 × X2 + 21.247 × X4 − 2.209 × X5 + 1.631 × X7 − 1.527 × X13 − 0.092 × X36 + 0.306 × X37 − 9058.316
where A denotes samples from Rhodiola crenulata, B denotes samples from Rhodiola serrata, C denotes samples from Rhodiola yunnanensis, D denotes samples from Rhodiola rosea, E denotes samples from Rhodiola kirilowii, F denotes samples from Rhodiola fastigiata, and Xi denotes the variables. When assigning a sample, the peak area values of the seven variables can be put into the six functions, and the sample belongs to the cluster where the calculated value of the function is the highest. The classification result for the training set was shown in a scatter plot of the samples in 3D space (Figure 3A) defined by the first three discriminant functions. All the samples were excellently divided into six clusters, demonstrating a remarkable difference among the six types. The leave-one-out cross-validation method, employed as an internal tool to predict the accuracy of the model, classified 98.8% of the samples correctly. To validate the performance of the established model, 74 batches of external testing set samples were distinguished by discriminant functions. As shown in Figure 3B, the samples were accurately separated into the six related clusters that further proved the success of the established model.

2.5.3. Verification of Distinguishing Ability of Characteristic Variables

For verifying whether the above-mentioned variables have the ability to discriminate different Rhodiola species as potential chemical markers, PLS-DA and OPLS-DA models were also generated. In PLS-DA, the data matrix of 85 (samples) × 7 (characteristic peaks) was formed to construct the classification model. The values of R2X, R2Y, and Q2 were 0.981, 0.736, and 0.505 at a confidence level of 95%, respectively, which showed that the established model had a good fitting and predictive ability. The score plot was shown in Figure 4A, the separation of six different Rhodiola species could be clearly observed. The 200 permutation tests were performed and the vertical intercept values of R2 and Q2 were 0.00943 and −0.326 (Figure 4B), respectively, indicating that the developed model avoided the problem of over-fitting and showed a good prediction. The prediction results in the testing set showed that the samples were correctly classified into their corresponding species clusters (Figure 4C).
After that, seven variables were used to construct the OPLS-DA model. At a confidence level of 95%, the values of R2X, R2Y, and Q2 were 0.980, 0.736, and 0.663, respectively, reflecting the established model had goodness of fit and great predictability. The score plot (Figure 4D) indicated that the OPLS-DA model could successfully provide a distinct classification of samples. The 200 permutation tests revealed that the model was not over-fitting (Figure 4E), and all the samples in the testing set were correctly classified into their related groups (Figure 4F).
Eventually, based on the seven characteristic peaks, LDA, PLS-DA, and OPLS-DA models achieved the excellent classification of samples from six Rhodiola species, respectively. Therefore, peaks 2, 4, 5, 7, 13, 36, and 37 were critical for the classification of Rhodiola crenulata, Rhodiola serrata, Rhodiola yunnanensis, Rhodiola rosea, Rhodiola kirilowii, and Rhodiola fastigiate, and could be selected as chemical markers for the quality evaluation of Rhodiola from different species.

2.6. Identification of the Characteristic Peaks

Seven characteristic peaks were identified from the six kinds of sample solutions by UHPLC-Q-TOF-MS/MS. The peaks were identified or tentatively assigned by comparing with the reference compounds and/or matching the empirical molecular formulae and mass fragments with those of the known compounds published in the literature. The component of peak 5 was identified as salidroside [25], with [M-H] ion at m/z 299.1134 (C14H20O7), and fragment ions at m/z 179.0553 [M-H-C8H8O], 119.0498 [M-H-Glu-H2O]. The component of peak 13, with [M-H] ion at m/z 457.0773 (C22H18O11) and fragment ions at m/z 305.0667 [M-H-C7H5O4], 287.0568 [M-H-C7H5O4-H2O], 169.0133 [M-H-C15H12O6] and 125.0238 [M-H-C7H5O4-C9H8O4], was identified as epigallocatechin gallate [26]. Similarly, the components of peaks 2, 4, 7, 36, 37 were identified as 1-(2-Hydroxy-2-methylbutanoate) β-D-glucopyranose, 4-O-glucosyl-p-coumaric acid, epigallocatechin, 1,2,3,4,6-pentagalloyglucose, and (+)-isolarisiresinol-4′-O-β-D-glucopyranoside or (+)-isolarisiresinol-4-O-β-D-glucopyranoside, respectively [25,26,27]. The MS/MS spectrum fragment ions of them were shown in Table 1, and the chemical structures can be seen in Figure S7. Among them, salidroside (peak 5) and 1,2,3,4,6-pentagalloyglucose (peak 36) were unambiguously identified by comparison with the reference substances.

3. Materials and Methods

3.1. Materials and Reagents

HPLC-grade ethanol (EtOH) and acetonitrile were obtained from Merck (Darmstadt, Germany). Formic acid was purchased from Aladdin Chemicals (Shanghai, China). Reference standard of salidroside was obtained from National Institutes for Food and Drug Control (Beijing, China). And 1,2,3,4,6-pentagalloyglucose was purchased from Chengdu Chroma-Biotechnology (Chengdu, China). The water was purified by a Milli-Q water purification system (Billerica, MA, USA). The roots and rhizomes of 159 batches of samples were collected from China and included 131 batches of Rhodiola crenulata, 18 batches of Rhodiola serrata, 4 batches of Rhodiola yunnanensis, and 2 batches of Rhodiola rosea, Rhodiola kirilowii, Rhodiola fastigiata, respectively. All samples were authenticated by the traditional Chinese medicine testing department (Shenzhen Institute for Drug Control, Shenzhen, Guangdong, China). The detailed sample information is listed in Table 2.

3.2. Apparatus and Conditions

UHPLC analysis was performed on a DIONEX Ultimate 3000 UHPLC system (Thermo Fisher Scientific, Waltham, MA, USA), which consists of an Ultimate 3000 RS pump, Ultimate 3000 RS autosampler, Ultimate 3000 RS column compartment, Ultimate 3000 RS Diode array detector, and Chromeleon software. All separations were performed on an ACQUITY UPLC HSS T3 column (2.1 × 150 mm, 1.8 μm). The mobile phase was composed of 0.1% aqueous formic acid (v/v) (A) and acetonitrile (B) with the following gradient elution: 0 min/3% B, 2 min/5% B, 6 min/12% B, 22 min/15% B, 28.5 min/19% B, 45 min/22% B. The column temperature and flow rate were set at 40 °C and 0.3 mL/min, respectively. The injection volume was 2 µL and the detection wavelength was set at 275 nm.
Identification of the characteristic peaks from the UHPLC fingerprints was performed on a UHPLC-Q-TOF-MS/MS system. Separation was carried out on a UHPLC system (Shimadzu, Kyoto, Japan) using the same column with the same mobile phases and the same gradient conditions above-mentioned. After separation, mass spectra were acquired on the AB X500R Q-TOF mass spectrometer (AB SCIEX, Framingham, MA, USA) with an ESI source. The spectrometer was operated in full-scan TOF-MS at m/z 100–1500 and information-dependent acquisition (IDA) MS/MS modes, with negative ionization mode. The optimized parameters of mass spectrometry were: Ion Source Temperature: 550 °C; Curtain Gas: 35 psi; Ion Source Gas 1 and 2: 50 psi; Ion Spray Voltage: −4500 V; Declustering Potential: −80 V (MS and MS/MS); Collision Energy: −10 V (MS), −35 V (MS/MS); Collision Energy Spread 15 V (MS/MS); Mass Range: 100–1500 m/z (MS), 50–1500 m/z (MS/MS); Accumulation Time: 0.15 s (MS), 0.05 s (MS/MS).

3.3. Preparation of Sample Solutions

Dry raw materials were firstly grounded into fine powder by a high-speed pulverizer and then filtered through 50 mesh sieves. An amount of 0.2 g ground powder was accurately weighed and transferred to a 50 mL conical flask with a stopper, and 10 mL 30/70 EtOH/H2O (v/v) was added. After ultrasonication at room temperature for 45 min, 30/70 EtOH/H2O (v/v) was added to compensate for the weight loss during the extraction. The extract was centrifuged at 4000 rpm for 10 min. Then the supernatant was filtered through a 0.22 μm membrane (Nylon 66; Tianjin jinteng experimental equipment Co., Ltd., Tianjin, China) and stored at 4 °C for further experiments.

3.4. Data Analysis

3.4.1. Similarity Analysis

The raw UHPLC chromatographic data of 159 samples were exported as *.AIA format file. Similarity analysis was performed using the software “Similarity Evaluation System for Chromatographic Fingerprint of Traditional Chinese Medicine” (Version 2004 A, Chinese Pharmacopoeia Committee). The reference fingerprint was generated automatically by the median method based on the chromatographic information of Rhodiola crenulate samples, and the similarity values of all the samples were then calculated.

3.4.2. Chemical Pattern Recognition Analysis

All chromatographic data of 159 batches of samples were collected and integrated. The data were normalized using a Z-score transformation method (SPSS 22 software, IBM Inc., Chicago, IL, USA). Afterward, chemical pattern recognition analysis was performed using PCA, LDA, PLS-DA, and OPLS-DA. PCA, PLS-DA, and OPLS-DA were carried out by SIMCA-P 14.1 software (Umetrics AB, Umea, Sweden) and LDA was undertaken through SPSS 22. Among them, PCA is an unsupervised pattern recognition tool to simplify and visualize data by extracting only the important information from the dataset [28]. LDA, PLS-DA, and OPLS-DA are widely used as supervised pattern recognition methods, where are applied to screen out the main markers that are responsible for discrimination [29]. In supervised pattern recognition methods, the samples are usually divided into a training set and a testing set [30]. The classification model is developed by the training set and validated by the testing set.

4. Conclusions

In this study, a simple and efficient method was developed combining UHPLC fingerprints and chemical pattern recognition to authenticity identification and classification of Rhodiola crenulate, Rhodiola rosea, and their confusable species (Rhodiola serrata, Rhodiola yunnanensis, Rhodiola kirilowii, and Rhodiola fastigiate). The results showed that the samples could not be accurately classified into the right clusters by similarity evaluation and PCA. LDA had the authenticity identification performance and seven characteristic peaks that are responsible for the accurate classification were selected. Based on the selected characteristic peaks, PLS-DA and OPLS-DA could also accomplish accurate classification process. Therefore, the components of these peaks were identified by UHPLC-Q-TOF-MS/MS, which are suitable for the quality evaluation of Rhodiola species. In conclusion, the established method could be employed as a powerful tool for the classification and quality assessment of Rhodiola species.

Supplementary Materials

The following are available online, Table S1: Repeatability, precision, and stability of fingerprints in Rhodiola samples expressed by the relative standard deviation (RSD) of retention time (RT) and peak area, Table S2: Similarities of 159 batches of Rhodiola samples, Figure S1: UHPLC chromatograms of the extracts of Rhodiola sample with total peak numbers and total areas under different extraction methods, Figure S2: UHPLC chromatograms of the extracts of Rhodiola sample with total peak numbers and total areas under different extraction solvents, Figure S3: UHPLC chromatograms of the extracts of Rhodiola sample with total peak numbers and total areas by different extraction time, Figure S4: UHPLC chromatograms of the extract of Rhodiola sample in different wavelength, Figure S5: Effect of the different mobile phase composition on the separation of extract of Rhodiola sample, Figure S6: Effect of temperature on resolution, Figure S7: Chemical structures of seven characteristic peaks for discriminating six different Rhodiola species.

Author Contributions

Conceptualization, T.W. and Y.L.; Methodology, T.W. and K.B.; Experimentation, D.M., X.X. and L.W.; Analysis, T.W., L.W., D.M., Y.J., L.G., X.Y., G.Y. and J.W.; writing—original draft preparation, D.M.; writing—review and editing, T.W. and L.W.; Fund acquisition, T.W. and Y.L. All authors have read and agreed to the published version of the manuscript.

Funding

This research was funded by the Special Project of Science and Technology for Sustainable Development, Shenzhen Municipal Science and Technology Innovation Committee (KCXFZ20201221173005015).

Institutional Review Board Statement

Not applicable.

Informed Consent Statement

Not applicable.

Data Availability Statement

The data are available within this article and its Supplementary Materials.

Acknowledgments

We gratefully appreciate the financial support from the Special Project of Science and Technology for Sustainable Development, Shenzhen Municipal Science and Technology Innovation Committee (KCXFZ20201221173005015).

Conflicts of Interest

The authors declare no conflict of interest.

Sample Availability

Samples of the Rhodiola are available from the authors.

References

  1. Tao, H.; Wu, X.; Cao, J.; Peng, Y.; Wang, A.; Pei, J.; Xiao, J.; Wang, S.; Wang, Y. Rhodiola species: A comprehensive review of traditional use, phytochemistry, pharmacology, toxicity, and clinical study. Med. Res. Rev. 2019, 39, 1779–1850. [Google Scholar] [CrossRef]
  2. The State Pharmacopoeia Commission of the PRC. Pharmacopoeia of the People’s Republic of China; The State Pharmacopoeia Commission of the PRC: Beijing, China, 2020; Volume I, pp. 161–162. [Google Scholar]
  3. Liao, Y.-H.; Chao, Y.-C.; Sim, B.Y.-Q.; Lin, H.-M.; Chen, M.-T.; Chen, C.-Y. Rhodiola/Cordyceps-Based Herbal Supplement Promotes Endurance Training-Improved Body Composition but Not Oxidative Stress and Metabolic Biomarkers: A Preliminary Randomized Controlled Study. Nutrients 2019, 11, 2357. [Google Scholar] [CrossRef] [Green Version]
  4. Li, Y.; Pham, V.; Bui, M.; Song, L.; Wu, C.; Walia, A.; Uchio, E.; Smith-Liu, F.; Zi, X. Rhodiola rosea L.: An Herb with Anti-Stress, Anti-Aging, and Immunostimulating Properties for Cancer Chemoprevention. Curr. Pharmacol. Rep. 2017, 3, 384–395. [Google Scholar] [CrossRef]
  5. Panossian, A. Evidence-Based Efficacy of Adaptogens in Fatigue, and Molecular Mechanisms Related to their Stress-Protective Activity. Curr. Clin. Pharmacol. 2009, 4, 198–219. [Google Scholar] [CrossRef]
  6. Gansu Institute of Drug Control. Standardization of Traditional Chinese Medicine in Gansu Province; Gansu Institute of Drug Control: Gansu, China, 2009; pp. 103–106. [Google Scholar]
  7. Li, T.; Zhang, H. Application of microscopy in authentication of traditional Tibetan medicinal plants of fiveRhodiola (Crassulaceae) alpine species by comparative anatomy and micromorphology. Microsc. Res. Tech. 2008, 71, 448–458. [Google Scholar] [CrossRef] [PubMed]
  8. Cunningham, A.; Li, H.; Luo, P.; Zhao, W.; Long, X.; Brinckmann, J. There “ain’t no mountain high enough”? The drivers, diversity and sustainability of China’s Rhodiola trade. J. Ethnopharmacol. 2020, 252, 112379. [Google Scholar] [CrossRef] [PubMed]
  9. Xin, T.; Li, X.; Yao, H.; Lin, Y.; Ma, X.; Cheng, R.; Song, J.; Ni, L.; Fan, C.; Chen, S. Survey of commercial Rhodiola products revealed species diversity and potential safety issues. Sci. Rep. 2015, 5, 8337. [Google Scholar] [CrossRef] [PubMed] [Green Version]
  10. Liu, Z.; Liu, Y.; Liu, C.; Song, Z.; Li, Q.; Zha, Q.; Lu, C.; Wang, C.; Ning, Z.; Zhang, Y.; et al. The chemotaxonomic classification of Rhodiola plants and its correlation with morphological characteristics and genetic taxonomy. Chem. Cent. J. 2013, 7, 118. [Google Scholar] [CrossRef] [PubMed] [Green Version]
  11. Cui, S.; Hu, X.; Chen, X.; Hu, Z. Determination of p -tyrosol and salidroside in three samples of Rhodiola crenulata and one of Rhodiola kirilowii by capillary zone electrophoresis. Anal. Bioanal. Chem. 2003, 377, 370–374. [Google Scholar] [CrossRef]
  12. Linh, P.T.; Kim, Y.H.; Hong, S.P.; Jian, J.J.; Kang, J.S. Quantitative determination of salidroside and tyrosol from the underground part of Rhodiola rosea by high performance liquid chromatography. Arch. Pharmacal Res. 2000, 23, 349–352. [Google Scholar] [CrossRef] [PubMed]
  13. Liang, W.; Chen, W.; Wu, L.; Li, S.; Qi, Q.; Cui, Y.; Liang, L.; Ye, T.; Zhang, L. Quality Evaluation and Chemical Markers Screening of Salvia miltiorrhiza Bge. (Danshen) Based on HPLC Fingerprints and HPLC-MSn Coupled with Chemometrics. Molecules 2017, 22, 478. [Google Scholar] [CrossRef] [PubMed] [Green Version]
  14. Huang, Y.; Wang, T.; Yin, G.; Wang, J.; Jiang, K.; Tu, J. High-performance liquid chromatography–based fingerprint analysis with chemical pattern recognition for evaluation of Mahonia Bealei (Fort.) Carr. J. Sep. Sci. 2020, 43, 3625–3635. [Google Scholar] [CrossRef] [PubMed]
  15. Wang, Y.; Jiang, K.; Wang, L.; Han, D.; Yin, G.; Wang, J.; Qin, B.; Li, S.; Wang, T. Identification of Salvia species using high-performance liquid chromatography combined with chemical pattern recognition analysis. J. Sep. Sci. 2018, 41, 609–617. [Google Scholar] [CrossRef]
  16. Meng, Z.; Huang, Y.; Wang, L.; Jiang, K.; Guo, L.; Wang, J.; Yin, G.; Wang, T. Quality evaluation of Panax Notoginseng using high-performance liquid chromatography with chemical pattern recognition. Sep. Sci. PLUS 2020, 3, 200–206. [Google Scholar] [CrossRef]
  17. Wei, W.; Wang, X.; Hou, J.; Yao, C.; Feng, Z.; Zhang, J.; Han, S.; Deng, Y.; Huang, Y.; Wu, W.; et al. Implementation of a Single Quadrupole Mass Spectrometer for Fingerprint Analysis: Venenum bufonis as a Case Study. Molecules 2018, 23, 3020. [Google Scholar] [CrossRef] [Green Version]
  18. Esteki, M.; Farajmand, B.; Amanifar, S.; Barkhordari, R.; Ahadiyan, Z.; Dashtaki, E.; Mohammadlou, M.; Heyden, Y.V. Classification and authentication of Iranian walnuts according to their geographical origin based on gas chromatographic fatty acid fingerprint analysis using pattern recognition methods. Chemom. Intell. Lab. Syst. 2017, 171, 251–258. [Google Scholar] [CrossRef]
  19. Cao, X.; Sun, L.; Li, D.; You, G.; Wang, M.; Ren, X. Quality Evaluation of Phellodendri Chinensis Cortex by Fingerprint–Chemical Pattern Recognition. Molecules 2018, 23, 2307. [Google Scholar] [CrossRef] [Green Version]
  20. Cheng, X.-M.; Zhao, T.; Yang, T.; Wang, C.-H.; Bligh, S.W.A.; Wang, Z.-T. HPLC fingerprints combined with principal component analysis, hierarchical cluster analysis and linear discriminant analysis for the classification and differentiation of Peganumsp. indigenous to China. Phytochem. Anal. 2010, 21, 279–289. [Google Scholar] [CrossRef]
  21. Li, X.; Wang, X.; Hong, D.; Zeng, S.; Su, J.; Fan, G.; Zhang, Y. Metabolic Discrimination of Different Rhodiola Species Using 1H-NMR and GEP Combinational Chemometrics. Chem. Pharm. Bull. 2019, 67, 81–87. [Google Scholar] [CrossRef]
  22. Li, T.; Su, C. Authenticity identification and classification of Rhodiola species in traditional Tibetan medicine based on Fourier transform near-infrared spectroscopy and chemometrics analysis. Spectrochim. Acta Part A Mol. Biomol. Spectrosc. 2018, 204, 131–140. [Google Scholar] [CrossRef]
  23. Wu, X.-D.; Chen, H.-G.; Zhou, X.; Huang, Y.; Hu, E.-M.; Jiang, Z.-M.; Zhao, C.; Gong, X.-J.; Deng, Q.-F. Studies on Chromatographic Fingerprint and Fingerprinting Profile-Efficacy Relationship of Saxifraga stolonifera Meerb. Molecules 2015, 20, 22781–22798. [Google Scholar] [CrossRef] [PubMed] [Green Version]
  24. Liu, W.; Yin, D.; Li, N.; Hou, X.; Wang, D.; Li, D.; Liu, J. Influence of Environmental Factors on the Active Substance Production and Antioxidant Activity in Potentilla fruticosa L. and Its Quality Assessment. Sci. Rep. 2016, 6, 28591. [Google Scholar] [CrossRef] [PubMed]
  25. Chen, K.; Liu, J.; Ma, Z.; Duan, F.; Guo, Z.; Xiao, H. Rapid identification of chemical constituents of Rhodiola Crenulata using liquid chromatography-mass spectrometry pseudotargeted analysis. J. Sep. Sci. 2021, 44, 3747–3776. [Google Scholar] [CrossRef] [PubMed]
  26. Wang, X.; Zeng, Q.; Contreras, M.D.M.; Wang, L. Profiling and quantification of phenolic compounds in Camellia seed oils: Natural tea polyphenols in vegetable oil. Food Res. Int. 2017, 102, 184–194. [Google Scholar] [CrossRef]
  27. Yang, L.-M.; Fu, H.-Z. Chemical constituents of Rhodiola kirilowii Maxim. J. Chin. Pharm. Sci. 2011, 20, 56–60. [Google Scholar] [CrossRef]
  28. Turrini, F.; Zunin, P.; Boggia, R. Potentialities of Rapid Analytical Strategies for the Identification of the Botanical Species of Several “Specialty” or “Gourmet” Oils. Foods 2021, 10, 183. [Google Scholar] [CrossRef]
  29. Wang, C.; Zhang, C.-X.; Shao, C.-F.; Li, C.-W.; Liu, S.-H.; Peng, X.-P.; Xu, Y.-Q. Chemical Fingerprint Analysis for the Quality Evaluation of Deepure Instant Pu-erh Tea by HPLC Combined with Chemometrics. Food Anal. Methods 2016, 9, 3298–3309. [Google Scholar] [CrossRef]
  30. Zhang, H.; Wang, H.; Wei, J.; Chen, X.; Sun, M.; Ouyang, H.; Hao, J.; Chang, Y.; Dou, Z.; He, J. Comparison of the Active Compositions between Raw and Processed Epimedium from Different Species. Molecules 2018, 23, 1656. [Google Scholar] [CrossRef] [Green Version]
Figure 1. Typical UHPLC fingerprints of Rhodiola from six different species.
Molecules 26 06855 g001
Figure 2. Score plot of PCA on the first three principal components for Rhodiola samples.
Molecules 26 06855 g002
Figure 3. LDA score plot of training set samples (A); training set and testing set samples (B).
Molecules 26 06855 g003
Figure 4. PLS-DA/OPLS-DA score plot of training set samples (A,D); permutation test result (B,E); score plot of training set and testing set samples (C,F).
Molecules 26 06855 g004
Table 1. Identification of the characteristic peaks of Rhodiola by UHPLC-Q-TOF-MS/MS in negative ion mode.
[M-H]-
Peak No.Observed Mass (Da)Error (ppm)FormulaMS/MSIdentificationType
2279.10910.9C11H20O8117.0566[M-H-C6H10O5],
101.0242[M-H-C6H10O6]
1-(2-Hydroxy-2-methylbutanoate) β-D-glucopyranoseAcyclic acid glycoside
4325.0926−1C15H18O8119.0500[M-H-Glu-CO2], 163.0399[M-H-Glu]4-O-glucosyl-p-coumaric acidPhenylpropanoid
5 a299.1134−0.8C14H20O7299.1155 [M-H], 179.0553 [Glu-H], 119.0498 [M-H-Glu-H2O]SalidrosideThe phenethyl glycosides
7305.0665−0.3C15H14O7221.0470[M-H-2C2H2O], 203.0331[M-H-2C2H2O-H2O],
179.0348[M-H-C6H6O3],
165.0348[M-H-C7H8O3],
137.0244[M-H-C8H8O4],
125.0247[M-H-C9H8O4]
EpigallocatechinFlavonoids
13457.0773−1.0C22H18O11305.0667[M-H-C7H5O4], 287.0568[M-H-C7H5O4-H2O],
169.0133[M-H-C15H12O6],
125.0238 [M-H-C7H5O4-C9H8O4]
Epigallocatechin gallateFlavonoids
36 a939.11120.3C41H32O26939.1085[M-H], 769.0884[M-H-C7H6O5], 617.0785[M-H-C7H6O5-C7H4O4], 447.0578[M-H-2C7H6O5-C7H4O4], 169.0146[Galloy]1,2,3,4,6-PentagalloyglucoseGallic acid derivative
37521.2028−0.1C26H34O11491.1942[M-HCHO-H], 503.1883[M-H2O-H],
341.1383[M-Glu-H2O]
(+)-isolarisiresinol-4′-O-β-D-glucopy ranoside or (+)-isolarisiresinol-4-O-β-D-glucopyranoside)Phenylpropanoid
a Identification by reference substances.
Table 2. The information of Rhodiola samples.
Sample No.SpeciesOriginSpecifications
1–47/68–115Rhodiola crenulataTibetProcessed drugs
48–53/116–122Rhodiola crenulataSichuanProcessed drugs
54–57/123/124Rhodiola crenulataXinjiangProcessed drugs
58–61/125/126Rhodiola crenulataJilinProcessed drugs
62–65/127/128Rhodiola crenulataQinghaiProcessed drugs
66Rhodiola crenulataInner MongoliaProcessed drugs
67Rhodiola crenulataGansuProcessed drugs
129Rhodiola crenulataYunnanProcessed drugs
130Rhodiola crenulataGuangxiProcessed drugs
131Rhodiola crenulataLiaoningProcessed drugs
132/141Rhodiola serrataTibetProcessed drugs
133/142Rhodiola serrataHunanProcessed drugs
134/143Rhodiola serrataSichuanCrude drugs
135–140/144–149Rhodiola serrata/Crude drugs
150–153Rhodiola yunnanensisTibetProcessed drugs
154/155Rhodiola rosea/Crude drugs
156/157Rhodiola kirilowii/Crude drugs
158/159Rhodiola fastigiataTibetProcessed drugs
Publisher’s Note: MDPI stays neutral with regard to jurisdictional claims in published maps and institutional affiliations.

