Article

Similarity-Based Virtual Screen Using Enhanced Siamese Multi-Layer Perceptron

by
Mohammed Khaldoon Altalib
1,2,* and
Naomie Salim
1,*
1
School of Computing, Universiti Teknologi Malaysia, Johor Bahru 81310, Malaysia
2
Computer Science Department, Education for Pure Science College, University of Mosul, Mosul 41002, Iraq
*
Authors to whom correspondence should be addressed.
Molecules 2021, 26(21), 6669; https://doi.org/10.3390/molecules26216669
Submission received: 17 September 2021 / Revised: 24 October 2021 / Accepted: 1 November 2021 / Published: 3 November 2021

Abstract

:
Traditional drug development is a slow and costly process that leads to the production of new drugs. Virtual screening (VS) is a computational procedure that measures the similarity of molecules as one of its primary tasks. Many techniques for capturing the biological similarity between a test compound and a known target ligand have been established in ligand-based virtual screens (LBVSs). However, despite the good performances of the above methods compared to their predecessors, especially when dealing with molecules that have structurally homogenous active elements, they are not satisfied when dealing with molecules that are structurally heterogeneous. The main aim of this study is to improve the performance of similarity searching, especially with molecules that are structurally heterogeneous. The Siamese network will be used due to its capability to deal with complicated data samples in many fields. The Siamese multi-layer perceptron architecture will be enhanced by using two similarity distance layers with one fused layer, then multiple layers will be added after the fusion layer, and then the nodes of the model that contribute less or nothing during inference according to their signal-to-noise ratio values will be pruned. Several benchmark datasets will be used, which are: the MDL Drug Data Report (MDDR-DS1, MDDR-DS2, and MDDR-DS3), the Maximum Unbiased Validation (MUV), and the Directory of Useful Decoys (DUD). The results show the outperformance of the proposed method on standard Tanimoto coefficient (TAN) and other methods. Additionally, it is possible to reduce the number of nodes in the Siamese multilayer perceptron model while still keeping the effectiveness of recall on the same level.

Graphical Abstract

1. Introduction

Drug discovery is a prolonged and complex process that culminates in the manufacture of new drugs. The biomolecular target is selected, and high-performance screening procedures are executed to identify bioactive chemicals for defined aims in traditional drug research and development. It is costly and time-consuming to produce high-performing research testing [1]. In truth, the chances of success are slim; approximately 1 out of every 5000 drug candidates is expected to be accepted and widely used at some point [2]. Increased computer capabilities, on the other hand, have enabled the screening of millions of chemical compounds at a reasonable speed and cost. The virtual screening methodology is a computerized method for scanning large libraries of small compounds for the most likely structures with the goal of developing medication [3,4,5]. Virtual screening (VS) is used in the early stages of drug development to identify the most promising lead compounds from large chemical libraries. The development of medications has been sped up in recent years thanks to virtual screening (VS). Virtual screening is divided into two types: structure-based virtual screening (SBVS) and ligand-based virtual screening (LBVS) [6]. The SBVS approaches strategies to look for indirect chemicals that are suitable for the binding site of the biological target. The molecular docking technique lies at the heart of SBVS approaches [7]. On the other hand, the LBVS approach is used constantly for the prediction of molecular properties and for measuring molecular similarity because the method to represent the molecules is easy and accurate. The necessity of applications of similarity searching comes from the importance of lead optimization in drug discovery programs, in which close neighbors are looking into an initial lead compound to find decent compounds [8,9,10].
Modern deep learning (DL) approaches have recently been presented in a variety of fields, and they have progressed in recent years, creating a new door for researchers. The hit of DL techniques benefits from the speedy growth of the DL algorithms and the progression of high-performance computing techniques. Moreover, DL techniques have slight generalization errors, which allow them to achieve credible results on certain benchmarks or competitive tests [11,12]. In addition, the Siamese network is frequently employed to solve image and text similarity problems. It has been utilized for more complex data samples, particularly heterogeneous data samples with a variety of dimensionality and type properties [13,14]. However, some studies reported that pruning the parameters makes the model of deep learning smaller in size, more memory-efficient, more power-efficient, and faster at inference. The whole idea of model pruning is to reduce the number of parameters without much loss in the accuracy of the model, which means cutting down parts of the network that contribute less or nothing to the network during inference [15,16,17].
Various techniques have been utilized in order to augment the retrieval effectiveness of similarity search algorithms. The use of 2D similarity algorithms has gained popularity. Estimating molecular similarity is based on the assumption that structurally similar molecules seem to be more likely to have similar characteristics than structurally different ones. Therefore, the objective of similarity searching is to identify molecules that are similar in structure to the consumer’s reference structures [18,19]. A number of coefficient techniques can be used to quantify the similarity/difference between molecule pairs. Many other studies tested the outcomes of various similarity coefficients, showing that the Tanimoto coefficient performed better than the others. As a result, in cheminformatics, the Tanimoto coefficient has become the most often used measure of chemical compound similarity [20,21,22]. Some experiments attempted to combine techniques from other fields. Such that they adapted the techniques from text information retrieval to employ in the cheminformatic domain to improve the similitude of molecular searching [23]. For example, the Bayesian inference network was based on text retrieval domains, it has been adapted and used in the similarity of molecular searches in virtual screening, and outperforms the Tanimoto technique [24,25]. Furthermore, reweighting approaches were employed to model document retrieval in the text field and modified in the cheminformatic area in the retrieval model [25,26,27]. Mohammed Al Dabagh (2017) improved the molecular similarity searching and molecular ranking of chemical compounds in LBVS using quantum mechanics physics theory principles [28]. Mubarak Hussien (2017) constructed a new similarity measure using current similarity measures by reweighting several bit-strings. Furthermore, the author offered ranking strategies for the development of a replacement ranking approach [29]. Deep belief networks (DBN) were used by Nasser, Majed, and colleagues (2021) to reweight molecular data wherein many descriptors were used, each reflecting separate relevant aspects, and combining all new features from all descriptors to create a new descriptor for similarity searches [30,31].
On the other hand, many studies have used deep learning methods as prediction or classification models. Some of them have used the DNN model to predict the activities of the selected compounds. Furthermore, other studies have reported that deep learning methods in Siamese architecture as a similarity model produce the best performance in many fields. For example, Jonas et al. (2016) used an LSTM Siamese neural network to calculate the similarity wherein the exponential Manhattan distance was used to measure the similarity between two sentences [32]. Jun Yu and Mengyan Li et al. (2020) used CNN Siamese architecture to determine whether two people are related, allowing missing persons to be reunited with their kin [33]. In the drug discovery domain, Devendra Singh Dhami et al. (2020) used images as an input in a Siamese convolutional network architecture to predict drug interactions in the drug discovery area [34]. Minji Jeon1 et al. (2019) proposed a method for calculating distance, utilizing MLP Siamese neural networks (ReSimNet) in structure-based virtual screen (SBVS) using cosine similarity [35].
Moreover, some early work in the pruning parameters domain used a gradual pruning scheme based on pruning all the weights in a layer less than some threshold (manually chosen) [12]. Blundell et al. (2015) introduced Bayes backpropagation for feedforward neural networks. This method gives the uncertainty in their predictions and reduces the model’s parameter count by ordering the weights according to their signal-to-noise-ratio and setting a certain percentage of the weights with the lowest ratios to 0 to prune these weights [15]. Louizos and Christos et al. (2017) used hierarchical priors to prune nodes instead of individual weights and also used the posterior uncertainties to determine the optimal fixed-point precision to encode the weights [36]. Chenglong Zhao et al. (2019) proposed a variational Bayesian scheme for pruning convolutional neural networks at the channel level. The variational technique is introduced to estimate the distribution of a newly proposed parameter; based on this, redundant channels can be removed from the model [37].
Despite the good performances of the above methods compared to their prior, especially when dealing with molecules that have homogenous active elements structural such as classes of molecules in the MDL Drug Data Report dataset (MDDR_DR2), the performances are not satisfied when dealing with molecules with structurally heterogeneous nature such as classes of molecules in the MDL Drug Data Report dataset (MDDR_DR3, MDDR_DR1) and maximum unbiased validation (MUV) dataset. In this paper, the Siamese multi-layer perceptron model will be used and enhanced in order to achieve the main purpose of this study for improving the performance of similarity searching, especially with molecules that are structurally heterogeneous. The following are the paper’s main contributions:
(1)
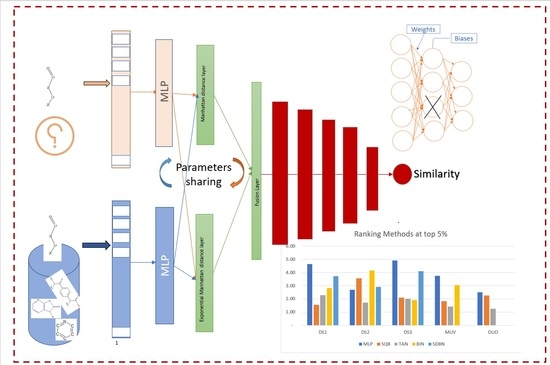
The Siamese multi-layer perceptron will be enhanced by (a) using two distance layers and then a fuse layer that combines the results from two distance layers, with multiple layers added after the fusion layer to improve the similarity recall; (b) pruning nodes in the Siamese similarity model to reduce the number of parameters that contribute less or nothing to the network during inference.
(2)
In comparison to the benchmark approach and previous studies, the suggested method outperformance in terms of results, especially when dealing with heterogeneous classes of molecules.

2. Materials and Methods

A Siamese neural network includes two artificial neural networks that are the same, each able to handle the hidden input data representation, which have to be linked to a final layer using a distance layer to predict whether or not two vectors fall under the same group. The networks that make up the Siamese architecture are called twins since all the weights and biases are connected. This means that both networks are symmetric. During training, the two neural networks use both feedforward perceptron and error back-propagation. As a result, it has been applied to more complex data samples, particularly heterogeneous data samples with varying dimensionality and type properties [13]. In this paper, the Siamese multilayer perceptron (MLP) model will be enhanced; the flowchart of steps for enhancing the Siamese architecture is presented in Figure 1:
The steps to enhance the Siamese architecture of the multilayer perceptron include:
(1)
Many models of Siamese architecture have been studied and analyzed in various domains, such as Minji Jeon1 et al. (2019) [35], Devendra Singh Dhami et al. (2020) [34] in the field of structure-based virtual screens, and Jonas et al. (2016) in the text field [32].
(2)
All prior studies used one distance layer. In this paper, two distance layers are used, and then one fusion layer combines the results from distance layers. The reason for using more than one distance layer is to further improve the similarity measurements between molecules.
(3)
Many layers have been added after the fusion layer to improve the retrieval recall.
(4)
To acquire a good retrieval recall outcome, the model hyperparameters, such as the number of epochs and batch size, optimization, and the activation function, have been tuned.
(5)
Finally, the nodes of the model that contribute less or nothing to the network during inference are pruned without having an effect on the effectiveness of the retrieval recall.
The architecture of the Siamese MLP similarity model and the mechanism of pruning the nodes will be explained in the following subsections.

2.1. Enhanced Siamese Multi-Layer Perceptron Similarity Model

The architecture of the Siamese MLP similarity model consists of two inputs, representing molecular descriptors (fingerprints), and has one output that represents the degree of similarity, meaning that the output has two classes; a value of (1) means high similarity and a value of (0) means high dissimilarity. In this model, the input layer has 1024 cells, each one connected to one feature of the molecular fingerprint, with each input layer connected to distance layers. Two distances were used; the first one was the Manhattan distance, which can be represented as [38]:
d A B = | f A f B |  
dAB: Manhatten distance
fA: feature of molecule’s query
fB: feature of molecule’s dataset
And the second distance was exponential Manhattan distance and can be given as [32]:
E A B = e x p ( | f A f B | )
EAB: exponential Manhatten distance
fA: feature of molecule’s query
fB: feature of molecule’s dataset
A fusion layer was then added between two distance layers—Manhattan and Exponential Manhattan—and was the reason for using more than one similarity distance to enhance the measures of similarity between molecules. The ReLU activation function has been used for all layers except the last one, in which the sigmoid activation function has been used. Moreover, the RMSprop optimizer has been used and the loss function was (binary_crossentropy); and the batch size was 256. Figure 2 demonstrates the architecture of the enhanced Siamese MLP similarity model.

2.2. Nodes or Neurons Pruning

As deep neural networks contain more layers, we must multiply multiple floating-point integers together, which takes a long time to train and infer and consumes a lot of computing resources. The problem mentioned above can be solved in a number of ways, including weight sharing, pruning, quantization, and so on. The goal of model pruning is to reduce the number of parameters while maintaining model correctness, which entails pruning parts of the network that give little or no information to the network during inference. As a result, models are smaller in size, and more memory-efficient, power-efficient, and faster at inference with low accuracy loss [16,39]. Weight pruning and node pruning are the two most common methods of pruning. In weight pruning, individual weights are ranked in a weight matrix W based on their magnitude (or any other criterion), and the smallest k percent of the weights are set to zero in weight trimming. This corresponds to deleting connections between nodes in different layers. However, in node pruning, the columns that represented nodes in weight matrix are set to zero, in effect deleting the corresponding output neuron. Here, nodes are ranked according to their magnitude (or any other criterion), and the smallest k percent of each node is set to zero. Pruning nodes will be employed in this research. Figure 3 demonstrates the idea of node pruning.
Each node is represented by a column of values in the weights matrix; the mean and variance of the column (node) are evaluated, and then the signal-to-noise ratio is calculated [15], the formula for which is:
s i g n a l _ t o _ n o i s e   r a t i o = | μ i | σ i
μ: mean of column
σ: variance of column
i: the sequence of a column in the weight matrix

3. Experimental Design

3.1. Datasets

The MDL drug data report (MDDR) [40], maximum unbiased validation (MUV) [41], and directory of useful decoys (DUD) [42] were used in the experiments. These datasets are the most common cheminformatics datasets, and these datasets have recently been used by our study community. All molecules in the MDDR dataset were converted to fingerprints using the ECFC 4 descriptor. The screening studies were carried out with ten reference structures randomly selected from each activity class. Three 102,516-molecule datasets have been chosen (MDDR-DS1, MDDR-DS2, and MDDR-DS3). The MDDR-DS1 is divided into 11 activity groups, some of which have structurally homogeneous active elements and others which have structurally heterogeneous (i.e., structurally different) active elements. MDDR-DS2 contains ten homogeneous activity classes, whereas MDDR-DS3 contains ten heterogeneous activity classes. All of the datasets are described in Table 1, Table 2 and Table 3. Each row of a table includes the activity class, the number of molecules belonging to the class, as well as a diversity of groups, which were measured as the average similarity of Tanimoto, computed by ECFC 4 for all pairs of molecules. As shown in Table 4, Rohrer and Baumann recorded the second data collection (MUV) in this study. This data collection contains 17 interaction groups, each of which has up to 30 active and 15,000 inactive molecules. The class composition of this dataset shows that it contains classes with a lot of variety or processes that are more heterogeneous. The last group of data used in this study is the Useful Decoys Directory (DUD), which was recently compiled for docking methods as a benchmark dataset. It was introduced by Huang et al. (2006) and was recently used in both molecular and molecular virtual screening [43]. Twelve DUD subsets with 704 active compounds and 25,828 decoys were used in this study, as shown in Table 5.

3.2. Evaluation Measures of the Performance

The following criteria are used to assess the efficacy of the suggested method:
  • The first method is to look for active chemical compounds in the top 1% and 5% of the scored test set and calculate the recall value. This metric has been employed in a number of previous approaches [27,28,30,31,44,45,46,47,48].
  • Comparison method: the second method is to compare current techniques that may be utilized to evaluate the proposed model’s findings. These techniques include the following:
    (a)
    TAN: the Tanimoto similarity coefficient has been the search benchmark method in LBVS for many years. The Tanimoto coefficient is used in its continuous form for similarities. It has been utilized in the datasets DS1, DS2, DS3, MUV, and DUD.
    (b)
    BIN: the second technique is the Bayesian inference network, which used the ECFC4 descriptors in datasets DS1, DS2, DS3, and MUV. This is another way of comparing the results in the similarity model of molecular fingerprints in LBVS [24].
    (c)
    SQB: the third method is quantum similarity search SQB in the MDDR dataset (DS1, DS2, DS3, and MUV) for the ECFC4 descriptor. This method utilizes a quantum mechanics approach as the model of similarity searching in LBVS [28].
    (d)
    SDBN: the last technique is the deep belief networks, used to reweight the chemical characteristics, where ECFC-4, EPFP-4, and ECFP-4 descriptors were analyzed using the stack of deep belief networks technique on the MDDR dataset (DS1, DS2, DS3) [31].
  • The Kendall W concordance test is another important metric that could be used to measure the performance of the suggested techniques and rank the similarity methods. The concordance coefficient is a measure of agreement among raters. In the Kendall W test, each case represents a judge or rater, while each variable represents the thing or person being assessed. The domain of a Kendall W test score is between 0 and 1. If the test score is 0, this means no agreement; if the test score 1, this means complete agreement. Assume the object (i) is considered as the similarity method, (ranked objects) is given the rank r i j by the raters j (activity class), where there are in total (n) objects and (m) raters. Then, the total rank (R) given to object (i) is [49]:
    i = j = i m r i j
    Then, the mean value (Ŕ) is calculated by these total rankings as:
    ¯ = 1 2 m ( n + 1 )
    Then, the sum of squared deviations (δ) is calculated as:
    δ = i = i n ( i ¯ ) 2
    Then, the Kendall W test is calculated as:
    W = 12 δ m 2 ( n 3 n )
The results of this test are the Kendall coefficient (between 0 and 1) and significance level (p-value); if the p-value is less than 0.05, the result is considered significant, and the similarity methods can be ranked.

4. Results and Discussion

The experimental results from the MDDR-DS1, MDDR-DS2, MDDR-DS3, MUV, and DUD datasets, for the ECFC-4 descriptor, are provided in Table 6, Table 7, Table 8, Table 9, Table 10, Table 11, Table 12, Table 13, Table 14 and Table 15, respectively, using 1% and 5% cut-offs. These tables show the results of the enhanced Siamese MLP similarity model compared to the benchmark TAN, as well as earlier studies BIN, SQB, and SDBN for MDDR datasets, BIN and SQB for MUV datasets, and SQB for DUD datasets. Every row in the tables displays the recall for the top 1% and 5% of the activity class, with the best recall rate shaded in each row. The mean rows in the tables represent the average for all activity classes, whereas the rows with shaded cells represent the total number of shaded cells for each technique throughout the whole range of activity classes.
When comparing the MDDR-DS1 recall results for the top 1% and 5% in Table 6 and Table 7, the suggested enhanced Siamese MLP technique was clearly superior to the benchmark TAN method and prior studies BIN, SQB, and SDBN in terms of the mean and number of shaded cells. The suggested technique has the highest mean value (30.69) in Table 6, followed by SDBN, BIN, SQB, and lastly, TAN methods. In the suggested approach, the shaded cells have a value of (7). The suggested approach has the highest mean value (50.463) in Table 7, followed by SDBN, BIN, SQB, and lastly TAN methods. In the suggested technique, shaded cells have a value of (9).
Furthermore, the MDDR-DS2 recall values obtained at the top 1%, as shown in Table 8, demonstrate that the suggested Siamese MLP technique outperforms the benchmark TAN method. In view of the number of shaded cells, the MLP approach produced the best retrieval recall results, and the suggested method’s mean value is extremely close to that of prior research. However, by comparison, The MDDR-DS2 recall values obtained at the top 5% in Table 9 clearly shows that the suggested Siamese MLP approach outperforms the benchmark TAN method only. In terms of the mean and number of shaded cells, the BIN approach produced the best retrieval recall results. Next, the second is SQB, SDBN, and finally, TAN in view of the mean value.
In addition, the MDDR-DS3 recall values recorded at the top 1% and 5% in Table 10 and Table 11, respectively, show that the proposed enhanced Siamese MLP method is obviously superior to the benchmark TAN method and methods from other studies. Likewise, in Table 10, the proposed method gave the best retrieval recall results in view of the mean and number of shaded cells, compared to prior studies and benchmark TAN, followed by SDBN, BIN, SQB, and finally, TAN methods. By comparison, in Table 11, the suggested enhanced Siamese MLP method was obviously superior to the benchmark TAN method and other studies. The second one is SDBN, followed by TAN, BIN, and SQB.
Moreover, the MUV dataset recall values recorded at the top 1% and 5% in Table 12 and Table 13, respectively, show that the proposed enhanced Siamese MLP method is obviously superior to the benchmark TAN method and other studies. Likewise, in Table 12, the proposed method gave the best retrieval recall results in view of the mean and number of shaded cells, compared to the TAN method and methods from other studies, followed by BIN, SQB, and finally, TAN methods. However, by comparison, in Table 13, the proposed enhanced Siamese MLP method was obviously superior to the benchmark TAN method and methods from other studies. Next, the second one is BIN, followed by SQB and TAN.
Moreover, the DUD dataset recall values recorded at the top 1% and 5% in Table 14 and Table 15, respectively, show that the proposed enhanced Siamese MLP method is obviously superior to the benchmark TAN method and methods from other studies. Likewise, in Table 14, the proposed method gave the best retrieval recall results in view of the mean and number of shaded cells, compared to the previous study and benchmark TAN. Furthermore, in Table 15, the proposed enhanced Siamese MLP method was obviously superior to the benchmark TAN method and the previous study SQB.
The experimental results for pruning nodes on MDDR-DS1, MDDR-DS2, MDDR-DS3, MUV, and DUD datasets are shown in Figure 4, Figure 5, Figure 6, Figure 7, Figure 8, Figure 9, Figure 10, Figure 11, Figure 12 and Figure 13, respectively. In these figures, the x axis represents the pruning ratio starting from 0% and ending with 90%, 95%, 95%, 70%, and 98% in DS1, DS2, DS3, MUV, and DUD datasets, respectively. They y axis represents the level of retrieval recall values for each class in the dataset. The classes of molecules are represented as color lines. The tables that contain on pruning ratio of recall values for each dataset are available as Supplementary Materials.
Figure 4 shows the level of the retrieval recall values at different pruning ratios for each class at the top 1% in DS1. We note that the recall values of most classes remain the same until they reach 80% of the pruning ratio, while some classes increased slightly, such as class 7, and decreased by a little in others, such as classes 2 and 9. Furthermore, Figure 5 shows the level of retrieval recall values at different pruning ratios for each class at the top 5% in DS1. The recall values of most classes remain the same values until they reach 80% of the pruning ratio, while some classes decreased, such as classes 2 and 10.
Figure 6 shows the level of retrieval recall values at different pruning ratios for each class at the top 1% in DS2. We note that the recall values of most classes remain the same until they reach 90% of the pruning ratio, while some classes increased slightly, such as classes 5 and 8, and decreased by a little in others, such as classes 1, 3, and 4. Furthermore, Figure 7 shows the level of retrieval recall values at different pruning ratios for each class at the top 5% in DS2. The recall values of most classes remain the same until they reach 90% of the pruning ratio, except for class 6, which remains until more than 95% of the pruning ratio, while some classes decreased by a little, such as class 4, or increased slightly, such as class 5.
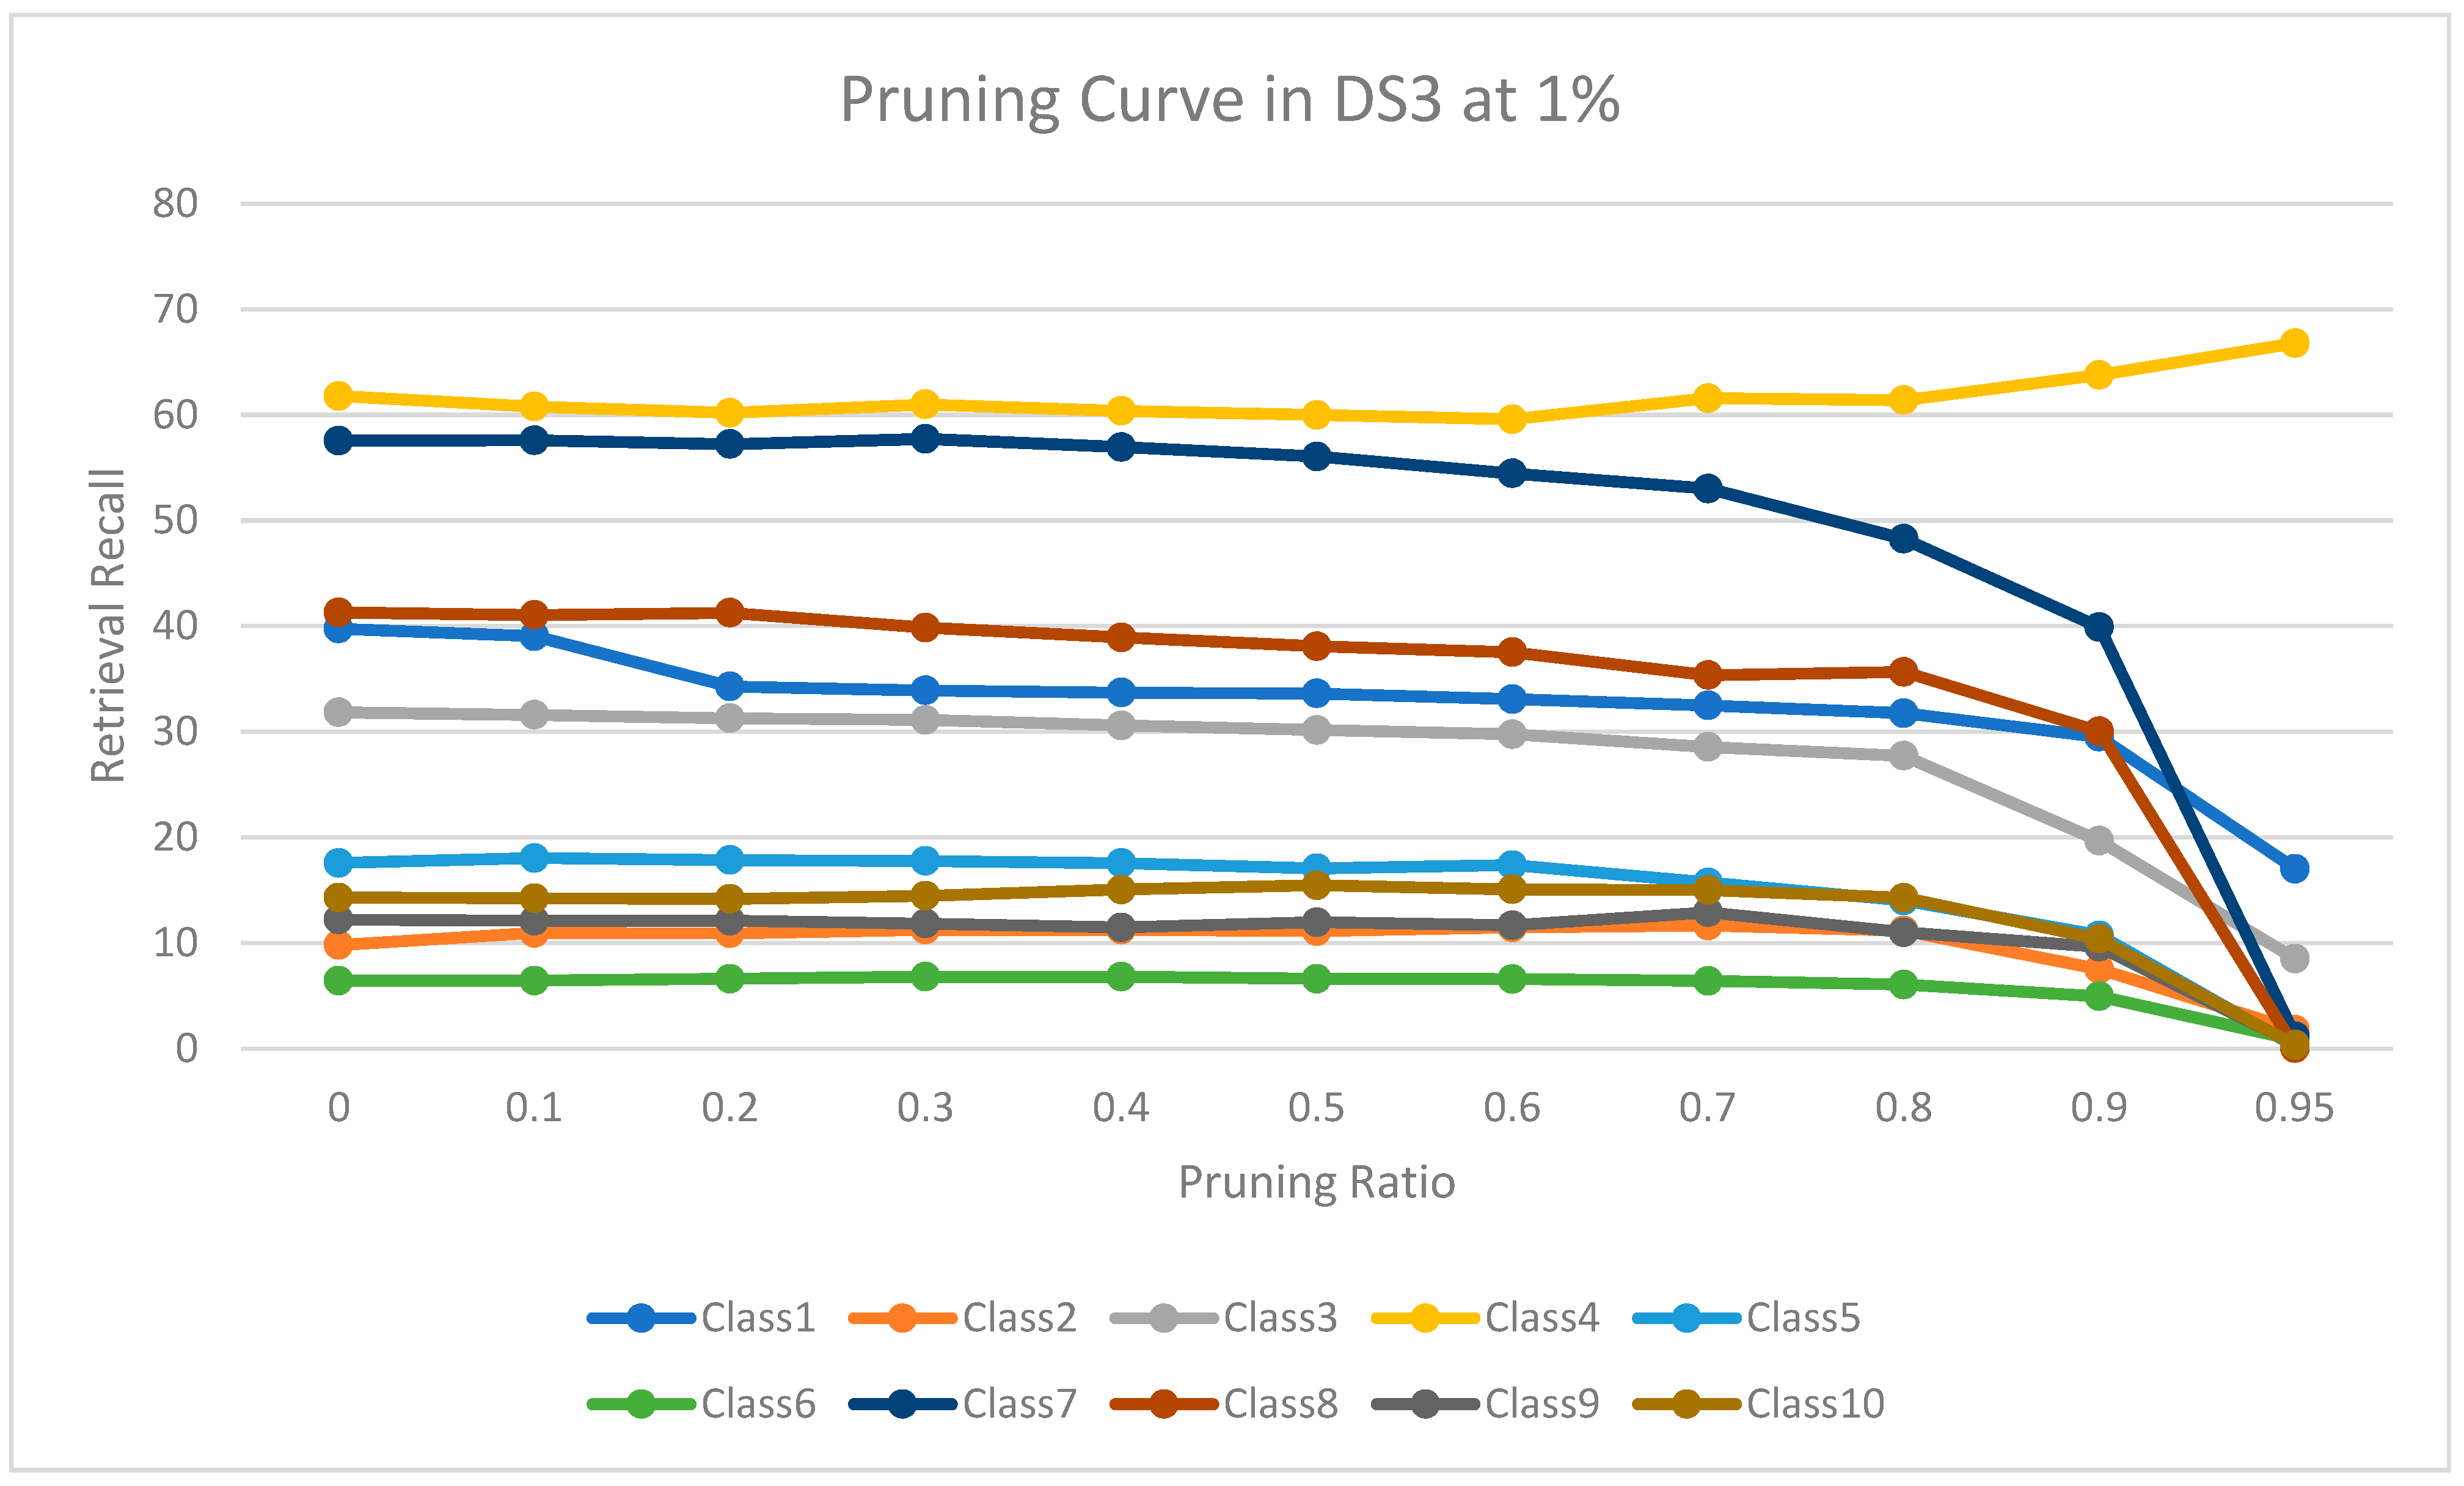
Figure 8 shows the level of retrieval recall values at different pruning ratios for each class at the top 1% in DS3. We note that the recall values of most classes remain the same until they reach 80% of the pruning ratio, while some classes increased slightly, such as class 4, a more than 95% pruning ratio, and decreased by a little in others, such as classes 1, 7, and 8. Furthermore, Figure 9 shows the retrieval recall values at different pruning ratios for each class at the top 5% in DS3. The recall values of most classes remain the same until they reach 80% of the pruning ratio, except for class 4, which increased until more than 95%, while some classes decreased by a little, such as classes 1, 3, 7, and 8.
Figure 10 shows the level of retrieval recall values at different pruning ratios for each class at the top 1% in MUV. We note that the recall values of most classes remained the same until they reached 60% of the pruning ratio, while some classes increased slightly, such as classes 3 and 10, and decreased by a little in others, such as class 8. Moreover, 
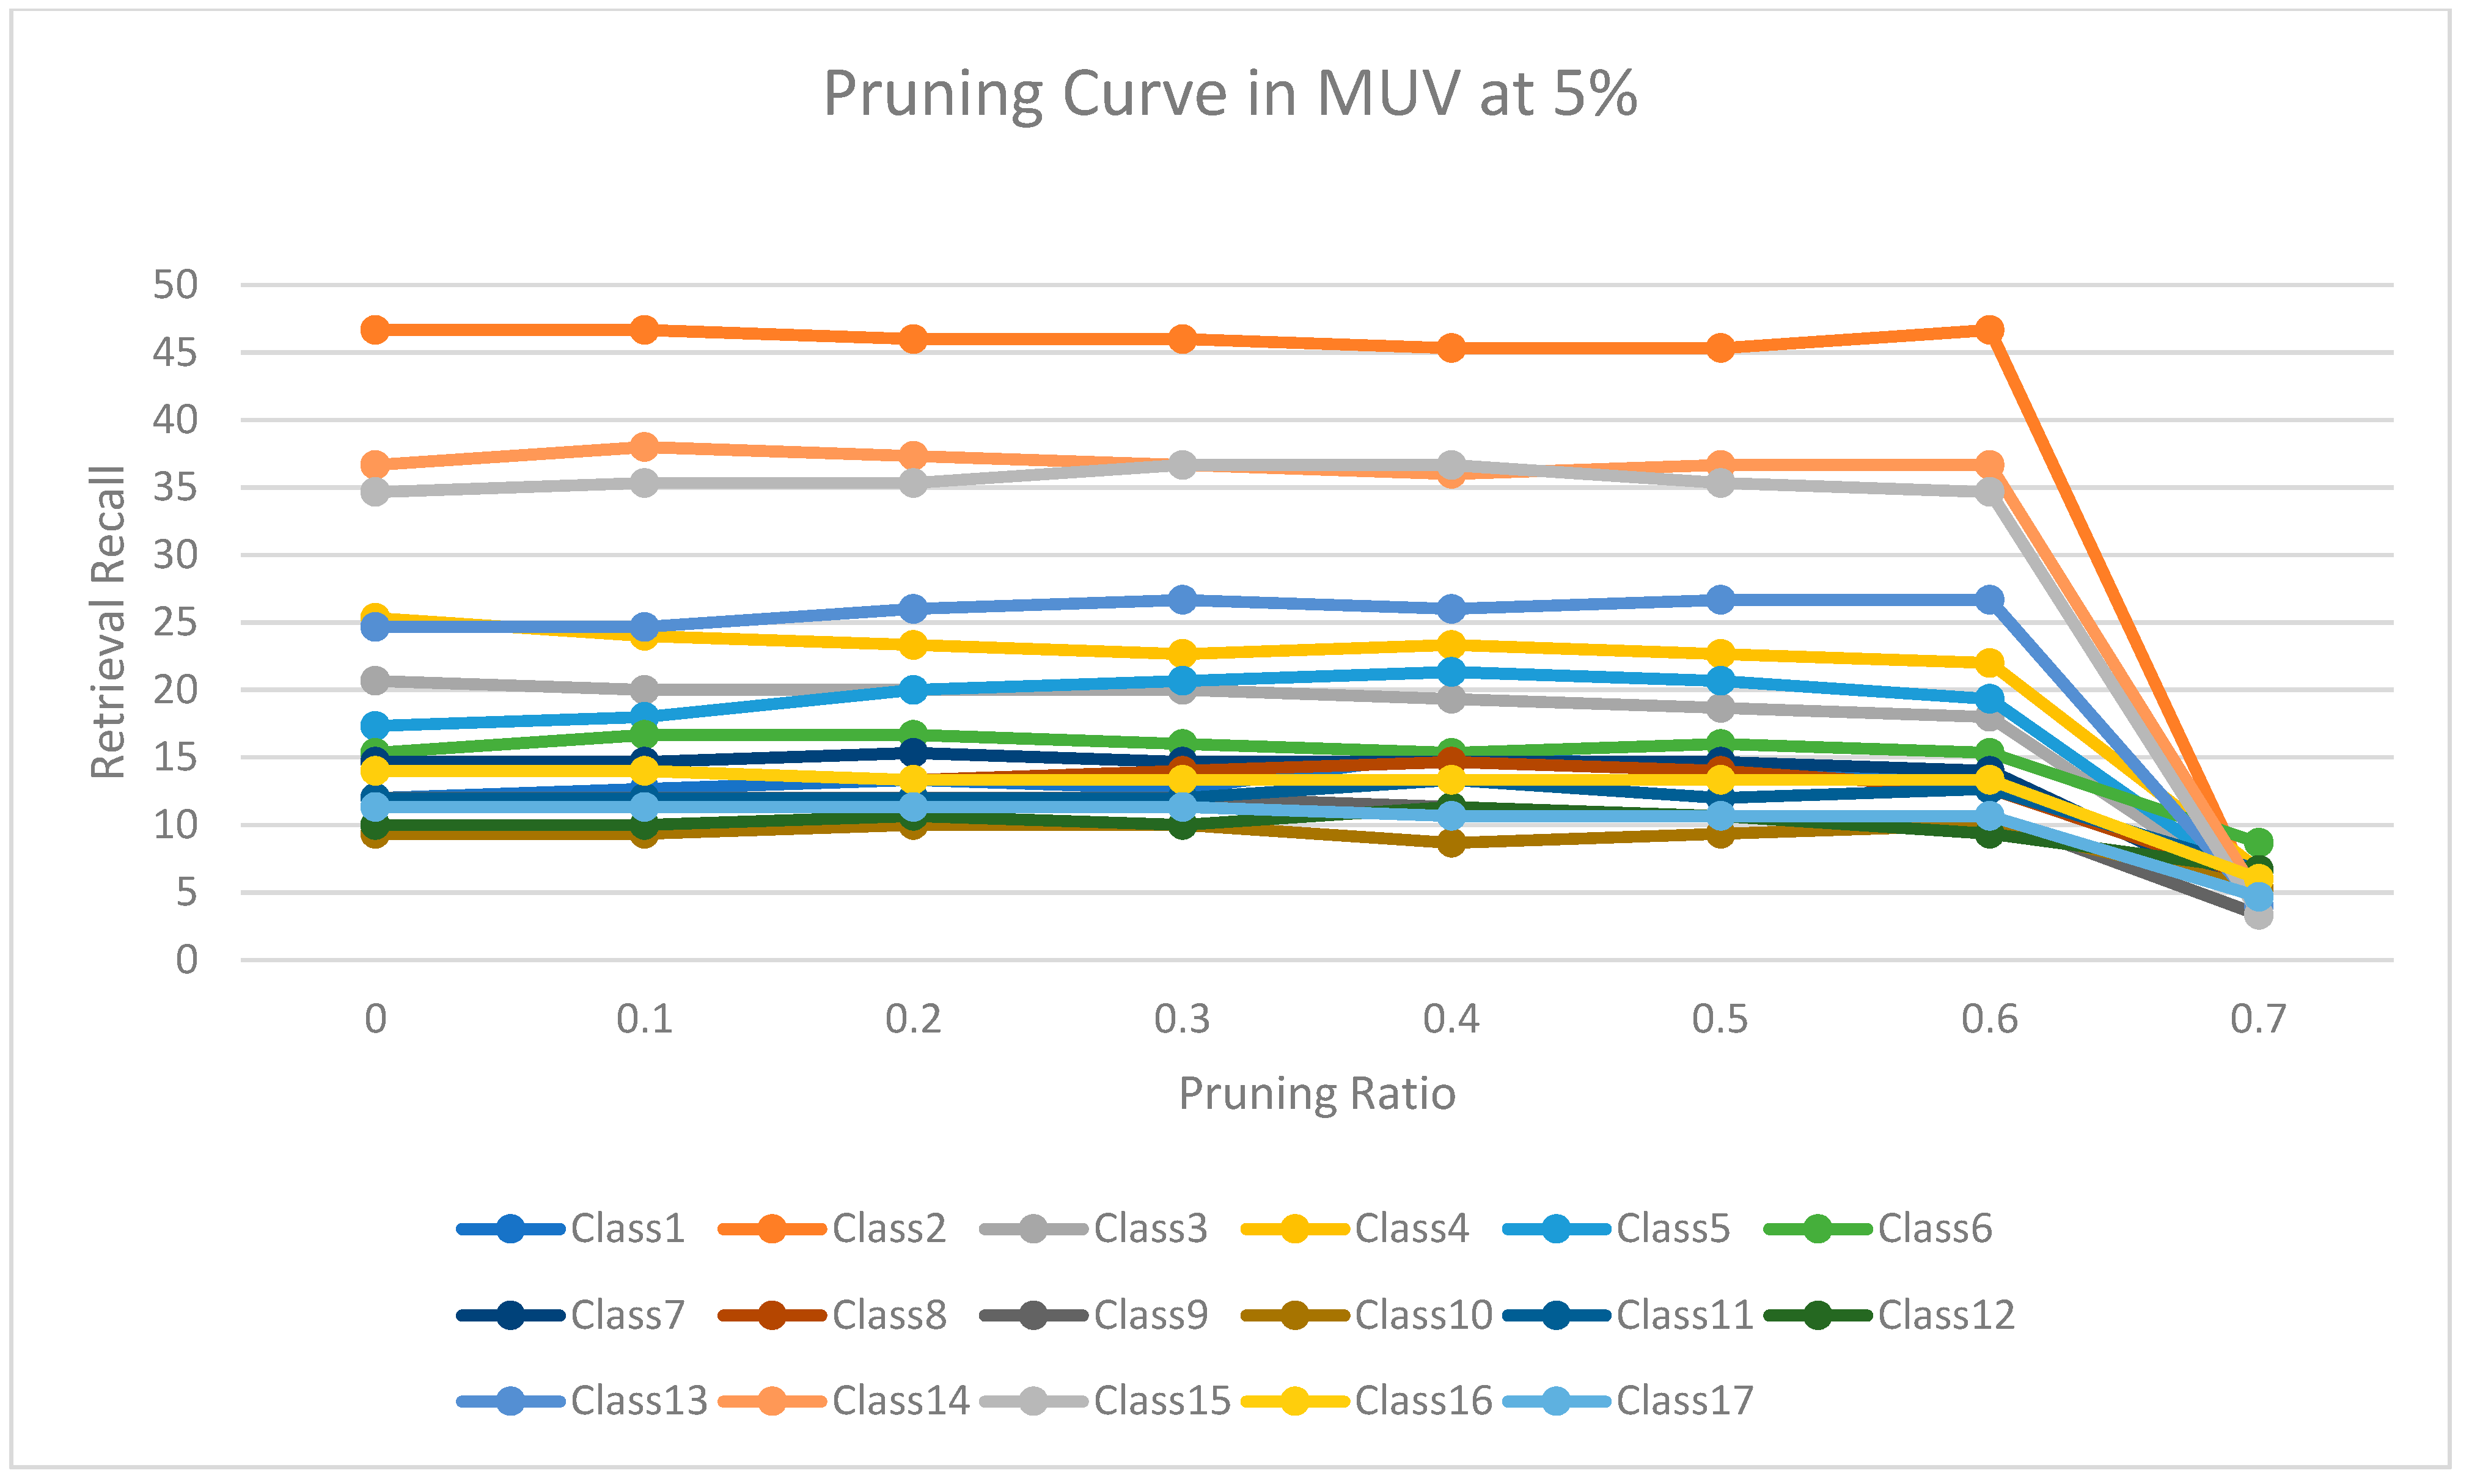
Figure 11 shows the retrieval recall values at different pruning ratios for each class at the top 5% in MUV. The recall values of most classes remained the same until they reached 60% of the pruning ratio, while some classes increased slightly, such as classes 1, 3 and 5, and decreased by a little in others, such as classes 3 and 4.
Furthermore, Figure 12 shows the level of retrieval recall values at different pruning ratios for each class at the top 1% in DUD. We note that the recall values of most classes remained the same until they reached 80% of the pruning ratio, while some classes increased slightly, such as classes 4,6, and 9, and decreased by a little in others, such as classes 3, 8, and 12. Moreover, Figure 13 shows the retrieval recall values at different pruning ratios for each class at the top 5% in DUD. The recall values of most classes remained the same until they reached 80% of the pruning ratio, while some classes increased slightly, such as classes 11 and 12, and decreased by a little in others, such as classes 3 and 10.
Moreover, the Kendall W concordance test has been used; Table 16 shows the ranking of the enhanced Siamese multilayer perceptron method based on previous studies of TAN, BIN, SQB, and SDBN using Kendall W test results for MDDR-DS1, MDDR-DS2, MDDR-DS3, MUV, and DUD at the top 1% and 5%. The first method is the benchmark method, which is the Tanimoto coefficient TAN; the second method is Bayesian inference [24]; the third method is quantum similarity search SQB-Complex [28]; the last method is multi-descriptor-based on Stack of deep belief networks SDBN [31]. The results of the Kendall W test of the top 1% for all used datasets show that the values of associated probability (p) are less than 0.05. This indicates that the enhanced Siamese multilayer perceptron method is significant in the top 1% for all cases. As a result, the overall ranking of all methods indicates that the enhanced Siamese multilayer perceptron method is superior to previous studies and benchmark TAN. The overall ranking for methods showed that MLP has the top ranks among other methods. This is the same as with the results of the Kendall W test of the top 5%; the results show that the values of associated probability (p) are less than 0.05. This indicates that the enhanced Siamese multilayer perceptron method is significant in the top 5%. As a result, the overall ranking of all methods indicates that the enhanced Siamese multilayer perceptron method is superior to previous studies for all datasets and the overall ranking for the method showed that Siamese multilayer perceptron method has the top ranks among other methods, except in DR2, in which the BIN method was better than MLP. Figure 14 and Figure 15 show the ranking of the enhanced Siamese multilayer perceptron method based on TAN, BIN, SQB, and SDBN using the Kendall W test results for DS1, DS2,DS3, MUV, and DUD at the top 1% and 5%.

5. Conclusions

Many techniques for capturing the biological similarity between a test compound and a known target ligand in LBVS have been established. LBVS is based on the premise that the target-binding behavior of related property compounds will be related. In spite of the good performances of the above methods compared to their prior, especially when dealing with molecules that have structurally homogenous active elements, the performances are not satisfied when dealing with molecules that are structurally heterogeneous. The main goal of this research was to improve the retrieval effectiveness of the similarity model, especially with molecules that are structurally heterogeneous. In this study, the Siamese multilayer perceptron similarity model has been enhanced by using two distance layers with a fuse layer that combines the results from two distance layers, and then multiple layers were added after the fusion layer, followed by pruning of the nodes that contribute less or nothing to the network during inference according to their signal-to-noise ratio. The results showed that the significance of the proposed method obviously outperformed the standard Tanimoto coefficient (TAN) and previous studies (BIN, SQB, and SDBN) at the top 1% and 5% for MDDR-DS1, MDDR-DS3, DUD, and MUV, which include heterogeneous classes. Additionally, the proposed method has the top rank for the top 1% MDDR-DS2, which include homogeneous classes. Besides that, it is possible to reduce the number of nodes in the Siamese multilayer perceptron model while still keeping the effectiveness of recall on the same level when pruning 60% of nodes in MUV, 90% in DS2, and 80% in DS1, DS3, and DUD. Multiple molecular descriptors will be tested in this proposed method as future work.

Supplementary Materials

The following are available online, Support Information which contains Table S1: The structure-activity classes of the MUV dataset, Table S2: The MDDR-DS1 structure activity classes, Table S3: The MDDR-DS2 structure activity classes, Table S4: The MDDR-DS3 structure activity classes, Table S5: DUD structure activity classes. Also Experiment Results of proposed method in each query with pruning in excel file.

Author Contributions

Conceptualization, M.K.A. and N.S.; methodology, M.K.A. and N.S.; software, M.K.A.; validation, M.K.A. and N.S.; formal analysis, M.K.A. and N.S.; investigation, M.K.A. and N.S.; data curation, M.K.A.; writing—original draft, M.K.A.; writing—review and editing, M.K.A. and N.S.; supervision, N.S.; project administration, N.S.; funding acquisition, N.S. All authors have read and agreed to the published version of the manuscript.

Funding

This work was supported by the Ministry of Higher Education Project No: R.J130000.7828.4F985, and Malaysia Ministry of Higher Education and Universiti Teknologi Malaysia Project No: Q.J130000.2551.21H38.

Institutional Review Board Statement

Not applicable.

Informed Consent Statement

Not applicable.

Data Availability Statement

The MDL Drug Data Report (MDDR) dataset is owned by www.accelrys.com (accessed on 31 October 2021). A license is required to access the data. Maximum unbiased validation (MUV) datasets are freely available at http://www.pharmchem.tu-bs.de/lehre/baumann/MUV.html (accessed on 31 October 2021). The DUD dataset is freely accessible online as a benchmarking set at http://blaster.docking.org/dud/ (accessed on 31 October 2021). Software License: Python 3.7 in environment anaconda/Spyder was used with the following libraries: TensorFlow, Theano, Keras, Numpy, Pandas, and math. The license of statistics application (IBM spss) is licenseapp.utm.my.

Acknowledgments

I would like to thank the Islamic development bank (IsDB) for the scholarships. and Mosul University for encouraging me to continue with my studies.

Conflicts of Interest

The authors declare no conflict of interest.

Sample Availability

Not available.

References

  1. Hertzberg, R.P.; Pope, A.J. High-throughput screening: New technology for the 21st century. Curr. Opin. Chem. Biol. 2000, 4, 445–451. [Google Scholar] [CrossRef]
  2. DiMasi, J.A.; Grabowski, H.G.; Hansen, R.W. Innovation in the pharmaceutical industry: New estimates of R&D costs. J. Health Econ. 2016, 47, 20–33. [Google Scholar]
  3. Carpenter, K.A.; Cohen, D.S.; Jarrell, J.T.; Huang, X. Deep learning and virtual drug screening. Future Med. Chem. 2018, 10, 2557–2567. [Google Scholar] [CrossRef] [Green Version]
  4. Lavecchia, A.; Di Giovanni, C. Virtual screening strategies in drug discovery: A critical review. Curr. Med. Chem. 2013, 20, 2839–2860. [Google Scholar] [CrossRef]
  5. Shoichet, B.K. Virtual screening of chemical libraries. Nature 2004, 432, 862–865. [Google Scholar] [CrossRef]
  6. Cheng, T.; Li, Q.; Zhou, Z.; Wang, Y.; Bryant, S.H. Structure-based virtual screening for drug discovery: A problem-centric review. AAPS J. 2012, 14, 133–141. [Google Scholar] [CrossRef] [PubMed] [Green Version]
  7. Chaudhary, K.K.; Mishra, N. A review on molecular docking: Novel tool for drug discovery. Databases 2016, 4, 3. [Google Scholar]
  8. Brown, N. Chemoinformatics—an introduction for computer scientists. ACM Comput. Surv. (CSUR) 2009, 41, 1–38. [Google Scholar] [CrossRef]
  9. Cereto-Massagué, A.; Ojeda, M.J.; Valls, C.; Mulero, M.; Garcia-Vallvé, S.; Pujadas, G. Molecular fingerprint similarity search in virtual screening. Methods 2015, 71, 58–63. [Google Scholar] [CrossRef]
  10. Willett, P. Similarity searching using 2D structural fingerprints. In Chemoinformatics and Computational Chemical Biology; Springer: Berlin/Heidelberg, Germany, 2010; pp. 133–158. [Google Scholar]
  11. Fukunishi, Y. Structure-based drug screening and ligand-based drug screening with machine learning. Comb. Chem. High Throughput Screen. 2009, 12, 397–408. [Google Scholar] [CrossRef] [PubMed]
  12. Narang, S.; Elsen, E.; Diamos, G.; Sengupta, S. Exploring sparsity in recurrent neural networks. arXiv 2017, arXiv:1704.05119. [Google Scholar]
  13. Bromley, J.; Guyon, I.; Lecun, Y.; Säckinger, E.; Shah, R. Signature verification using a “Siamese” time delay neural network. Int. J. Pattern Recognit. Artif. Intel. 1993, 7, 669–688. [Google Scholar] [CrossRef] [Green Version]
  14. Chicco, D. Siamese neural networks: An overview. Artif. Neural Netw. 2021, 2190, 73–94. [Google Scholar]
  15. Blundell, C.; Cornebise, J.; Kavukcuoglu, K.; Wierstra, D. Weight uncertainty in neural networks. arXiv 2015, arXiv:1505.05424. [Google Scholar]
  16. Shridhar, K.; Laumann, F.; Liwicki, M. A comprehensive guide to bayesian convolutional neural network with variational inference. arXiv 2019, arXiv:1901.02731. [Google Scholar]
  17. Cheng, Y.; Wang, D.; Zhou, P.; Zhang, T. A survey of model compression and acceleration for deep neural networks. arXiv 2017, arXiv:1710.09282. [Google Scholar]
  18. Willett, P. A review of chemical structure retrieval systems. J. Chemom. 1987, 1, 139–155. [Google Scholar] [CrossRef]
  19. Willett, P. The calculation of molecular structural similarity: Principles and practice. Mol. Inform. 2014, 33, 403–413. [Google Scholar] [CrossRef] [PubMed]
  20. Bajusz, D.; Rácz, A.; Héberger, K. Why is Tanimoto index an appropriate choice for fingerprint-based similarity calculations? J. Cheminformatics 2015, 7, 20. [Google Scholar] [CrossRef] [Green Version]
  21. Cai, C.; Gong, J.; Liu, X.; Gao, D.; Li, H. Molecular similarity: Methods and performance. Chin. J. Chem. 2013, 31, 1123–1132. [Google Scholar] [CrossRef]
  22. Syuib, M.; Arif, S.M.; Malim, N. Comparison of similarity coefficients for chemical database retrieval. In Proceedings of the 2013 1st International Conference on Artificial Intelligence, Modelling and Simulation, Kota Kinabalu, Malaysia, 3–5 December 2013; pp. 129–133. [Google Scholar]
  23. Willett, P. Textual and chemical information processing: Different domains but similar algorithms. Inf. Res. 2000, 5, 2. [Google Scholar]
  24. Abdo, A. Similarity-Based Virtual Screening Using Bayesian Inference Network; Universiti Teknologi Malaysia: Johor, Malaysia, 2009; Volume 3, p. 1. [Google Scholar]
  25. Ahmed, A.; Abdo, A.; Salim, N. Ligand-based virtual screening using Bayesian inference network and reweighted fragments. Sci. World J. 2012, 2012, 410914. [Google Scholar] [CrossRef] [Green Version]
  26. Abdelrahim, A.; Ahmed, A. Fragment Reweighting in Ligand-based Virtual Screening. Ph.D. Thesis, Universiti Teknologi Malaysia, Skudai, Malaysia, 2013. [Google Scholar]
  27. Ahmed, A.; Salim, N.; Abdo, A. Fragment reweighting in ligand-based virtual screening. Adv. Sci. Lett. 2013, 19, 2782–2786. [Google Scholar] [CrossRef]
  28. Aldabagh, M.M. Quantium Inspired Probability Approaches in Ligend-Based Vitual Screen; UTM University: Johor, Malaysia, 2017. [Google Scholar]
  29. Himmat, M.H.I. New Similarity Measures for Ligand-Based Virtual Screening; Universiti Teknologi Malaysia: Johor, Malaysia, 2017. [Google Scholar]
  30. Nasser, M.; Salim, N.; Hamza, H. Molecular Similarity Searching Based on Deep Belief Networks with Different Molecular Descriptors. In Proceedings of the 2020 2nd International Conference on Big Data Engineering and Technology, Johor, Malaysia, 3–5 January 2020; pp. 18–24. [Google Scholar]
  31. Nasser, M.; Salim, N.; Hamza, H.; Saeed, F.; Rabiu, I. Improved Deep Learning Based Method for Molecular Similarity Searching Using Stack of Deep Belief Networks. Molecules 2021, 26, 128. [Google Scholar] [CrossRef]
  32. Mueller, J.; Thyagarajan, A. Siamese recurrent architectures for learning sentence similarity. In Proceedings of the AAAI Conference on Artificial Intelligence, Vancouver, BC, Canada, 22 February–1 March 2016. [Google Scholar]
  33. Kohli, N. Automatic Kinship Verification in Unconstrained Faces Using Deep Learning; West Virginia University: Morgantown, WV, USA, 2019. [Google Scholar]
  34. Dhami, D.S.; Yan, S.; Kunapuli, G.; Page, D.; Natarajan, S. Beyond Textual Data: Predicting Drug-Drug Interactions from Molecular Structure Images using Siamese Neural Networks. arXiv 2019, arXiv:1911.06356. [Google Scholar]
  35. Jeon, M.; Park, D.; Lee, J.; Jeon, H.; Ko, M.; Kim, S.; Choi, Y.; Tan, A.-C.; Kang, J. ReSimNet: Drug response similarity prediction using Siamese neural networks. Bioinformatics 2019, 35, 5249–5256. [Google Scholar] [CrossRef] [PubMed]
  36. Louizos, C.; Ullrich, K.; Welling, M. Bayesian compression for deep learning. In Proceedings of the Advances in Neural Information Processing Systems, Long Beach, CA, USA, 4–9 December 2017; pp. 3288–3298. [Google Scholar]
  37. Zhao, C.; Ni, B.; Zhang, J.; Zhao, Q.; Zhang, W.; Tian, Q. Variational convolutional neural network pruning. In Proceedings of the IEEE/CVF Conference on Computer Vision and Pattern Recognition, Long Beach, CA, USA, 15 June 2019; pp. 2780–2789. [Google Scholar]
  38. Salim, N.; Holliday, J.; Willett, P. Combination of fingerprint-based similarity coefficients using data fusion. J. Chem. Inf. Comput. Sci. 2003, 43, 435–442. [Google Scholar] [CrossRef]
  39. Molchanov, P.; Tyree, S.; Karras, T.; Aila, T.; Kautz, J. Pruning convolutional neural networks for resource efficient inference. arXiv 2016, arXiv:1611.06440. [Google Scholar]
  40. MDL Drug Data Report (MDDR). Accelrys Inc: San Diego, CA, USA. Available online: http://www.accelrys.com (accessed on 15 January 2020).
  41. Rohrer, S.G.; Baumann, K. Maximum unbiased validation (MUV) data sets for virtual screening based on PubChem bioactivity data. J. Chem. Inf. Model. 2009, 49, 169–184. [Google Scholar] [CrossRef] [PubMed]
  42. Huang, N.; Shoichet, B.K.; Irwin, J.J. Benchmarking sets for molecular docking. J. Med. Chem. 2006, 49, 6789–6801. [Google Scholar] [CrossRef] [Green Version]
  43. Cross, S.; Baroni, M.; Carosati, E.; Benedetti, P.; Clementi, S. FLAP: GRID molecular interaction fields in virtual screening. validation using the DUD data set. J. Chem. Inf. Model. 2010, 50, 1442–1450. [Google Scholar] [CrossRef] [PubMed]
  44. Barker, E.J.; Buttar, D.; Cosgrove, D.A.; Gardiner, E.J.; Kitts, P.; Willett, P.; Gillet, V.J. Scaffold hopping using clique detection applied to reduced graphs. J. Chem. Inf. Model. 2006, 46, 503–511. [Google Scholar] [CrossRef] [PubMed]
  45. Hert, J.; Willett, P.; Wilton, D.J.; Acklin, P.; Azzaoui, K.; Jacoby, E.; Schuffenhauer, A. Enhancing the effectiveness of similarity-based virtual screening using nearest-neighbor information. J. Med. Chem. 2005, 48, 7049–7054. [Google Scholar] [CrossRef]
  46. Kogej, T.; Engkvist, O.; Blomberg, N.; Muresan, S. Multifingerprint based similarity searches for targeted class compound selection. J. Chem. Inf. Model. 2006, 46, 1201–1213. [Google Scholar] [CrossRef]
  47. Nasser, M.; Salim, N.; Hamza, H.; Saeed, F. Deep Belief Network for Molecular Feature Selection in Ligand-Based Virtual Screening. In Proceedings of the International Conference of Reliable Information and Communication Technology, Kuala Lumpur, Malaysia, 23–24 July 2018; pp. 3–14. [Google Scholar]
  48. Wilton, D.J.; Harrison, R.F.; Willett, P.; Delaney, J.; Lawson, K.; Mullier, G. Virtual screening using binary kernel discrimination: Analysis of pesticide data. J. Chem. Inf. Model. 2006, 46, 471–477. [Google Scholar] [CrossRef] [PubMed]
  49. Legendre, P. Species associations: The Kendall coefficient of concordance revisited. J. Agric. Biol. Environ. Stat. 2005, 10, 226. [Google Scholar] [CrossRef]
Figure 1. The flowchart of enhancing the Siamese multi-layer perceptron architecture.
Molecules 26 06669 g001
Figure 2. Enhanced Siamese MLP similarity model.
Molecules 26 06669 g002
Figure 3. The idea of node pruning.
Molecules 26 06669 g003
Figure 4. The level of retrieval recall values at different percentages of pruning at the top 1% in MDDR-DR1.
Molecules 26 06669 g004
Figure 5. The level of retrieval recall values at different percentages of pruning at the top 5% in MDDR-DR1.
Molecules 26 06669 g005
Figure 6. The level of retrieval recall values at different percentages of pruning at the top 1% in DDR-DR2.
Molecules 26 06669 g006
Figure 7. The level of retrieval recall values at different percentages of pruning at the top 5% in MDDR-DR2.
Molecules 26 06669 g007
Figure 8. The level of retrieval recall values at different percentages of pruning at the top 1% in DR3-MDDR.
Molecules 26 06669 g008
Figure 9. The level of retrieval recall values at different percentages of pruning at the top 5% in DR3-MDDR.
Molecules 26 06669 g009
Figure 10. The level of retrieval recall values at different percentages of pruning at the top 1% in MUV dataset.
Molecules 26 06669 g010
Figure 11. The level of retrieval recall values at different percentages of pruning at the top 5% in MUV dataset.
Molecules 26 06669 g011
Figure 12. The level of retrieval recall values at different percentages of pruning at the top 1% in DUD dataset.
Molecules 26 06669 g012
Figure 13. The level of retrieval recall values at different percentages of pruning at the top 5% in DUD dataset.
Molecules 26 06669 g013
Figure 14. Ranking of enhanced Siamese multilayer perceptron method based on TAN, BIN, SQB, and SDBN using Kendall W test results for DS1, DS2, DS3, MUV, and DUD at top 1%.
Molecules 26 06669 g014
Figure 15. Ranking of enhanced Siamese multilayer perceptron method based on TAN, BIN, SQB, and SDBN using Kendall W test results for DS1, DS2, DS3, MUV, and DUD at top 5%.
Molecules 26 06669 g015
Table 1. The MDDR-DS1 structure activity classes.
Activity IndexActive MoleculesActivity ClassPairwise Similarity
314201130Renin inhibitors0.290
31432943Angiotensin II AT1 antagonists0.229
37110803Thrombin inhibitors0.180
71523750HIV protease inhibitors0.198
427311246Substance P antagonists0.149
07701395D2 antagonists0.138
062453595HT reuptake inhibitors0.122
78374453Protein kinase C inhibitors0.120
062358275HT1A agonists0.133
062337525HT3 antagonist0.140
78331636Cyclooxygenase inhibitors0.108
Table 2. The MDDR-DS2 structure activity classes.
Activity IndexActive MoleculesActivity ClassPairwise Similarity
07707207Adenosine (A1) agonists0.229
42710111CCK agonists0.361
314201130Renin inhibitors0.290
64200113Cephalosporins0.322
641001346Monocyclic lactams0.336
64500126Carbapenems0.260
642201051Carbacephems0.269
75755455Vitamin D analogous0.386
07708156Adenosine (A2) agonists0.305
Table 3. The MDDR-DS3 structure activity classes.
Activity IndexActive MoleculesActivity ClassPairwise Similarity
09249900Muscarinic (M1) agonists0.111
31281106Dopamine -hydroxylase inhibitors0.125
12464505Nitric oxide synthase inhibitors0.102
71522700Reverse transcriptase inhibitors0.103
43210957Aldose reductase inhibitors0.119
124551400NMDA receptor antagonists0.098
75721636Aromatase inhibitors0.110
783512111Lipoxygenase inhibitors0.113
78348617Phospholipase A2 inhibitors0.123
78331636Cyclooxygenase inhibitors0.108
Table 4. MUV structure activity classes.
Activity IndexActive MoleculesActivity ClassPairwise Similarity
6630S1P1 rec. (agonists) 0.117
64430Rho-Kinase2 (inhibitors) 0.122
60030SF1 (inhibitors) 0.123
68930Eph rec. A4 (inhibitors) 0.113
65230HIV RT-RNase (inhibitors) 0.099
71230HSP 90 (inhibitors) 30 0.106
69230SF1 (agonists) 0.114
73330ER-b-Coact. Bind. (inhibitors) 0.114
71330ER-a-Coact. Bind. (inhibitors) 0.113
81030FAK (inhibitors) 0.107
73730ER-a-Coact. Bind. (potentiators) 0.129
84630FXIa (inhibitors) 0.161
83230Cathepsin G (inhibitors) 0.151
85830D1 rec. (allosteric modulators) 0.111
85230FXIIa (inhibitors) 0.150
54830PKA (inhibitors)0.128
85930M1 rec. (allosteric inhibitors)0.126
Table 5. DUD structure activity classes, where N a denotes the number of active compounds, and Ndec denotes the number of decoys.
No.DatasetActive and Inactive
NdecNa
1FGFR1T4550120
2FXA5745146
3GART87940
4GBP214052
5GR294778
6HIVPR203862
7HIVRT151943
8HMGA148035
9HSP9097937
10MR63615
11NA187449
12PR104127
total-25,828704
Table 6. Retrieval results of top 1% for MDDR-DS1 dataset for (ECFC_4) descriptor.
DS1Previous StudiesProposed Methods
Retrieval Result 1%
Activity IndexTANBINSQBSDBNMLP
3142069.6974.0873.7374.2182.1416
7152325.9428.2626.8427.9749.4118
371109.6326.0524.7326.0345.5639
3143235.8239.2336.6639.7945.5957
4273117.7721.6821.1723.0632.0546
623313.8714.0612.4919.2922.9708
62456.516.316.036.275.36313
77018.6311.4511.3514.0512.0918
62359.7110.8410.1512.8710.7767
7837413.6914.2513.0817.4721.9196
783317.176.035.929.939.70199
Mean19.8622.9322.0124.6309130.69
Shaded cells10037
Table 7. Retrieval results of top 5% for MDDR-DS1 dataset for (ECFC_4) descriptor.
DS1Previous StudiesProposed Methods
Retrieval Result 5%
Activity IndexTANBINSQBSDBNMLP
3142083.4987.6187.2289.0387.3628
7152348.9252.7248.7065.1775.8289
3711021.0148.2045.6241.2571.4536
3143274.2977.5770.4479.8784.1489
4273129.6826.6324.3531.9251.3644
623327.6823.4920.0429.3149.443
624516.5414.8613.7221.0616.0894
770124.0927.7926.7328.4329.7449
623520.0623.7822.8127.8228.7379
7837420.5120.2019.5619.0936.7857
7833116.2011.8011.3716.2124.1391
Mean34.7737.7035.5140.8327350.463
Shaded cells00029
Table 8. Top 1% retrieval results for MDDR-DS2 dataset for descriptor (ECFC 4).
DS2Previous StudiesProposed Methods
Retrieval Result 1%
Activity IndexTANBINSQBSDBNMLP
770761.8472.1872.0983.1986.4706
770847.0396.0095.6894.8297.3077
3142065.1079.8278.5679.2771.7699
4271081.2776.2776.8274.8182.9091
6410080.3188.4387.8093.6594.2769
6420053.8470.1870.1871.1635.5696
6422038.6468.3267.5868.7188.5333
6450030.5681.2079.2075.6262.8571
6435080.1881.8981.6885.2191.8557
7575587.5698.0698.0296.5290.5727
Mean62.6381.2480.7682.29680.21226
Shaded cells03016
Table 9. Top 5% retrieval results for MDDR-DS2 dataset for descriptor (ECFC 4).
DS2Previous StudiesProposed Methods
Retrieval Result 5%
Activity IndexTANBINSQBSDBNMLP
770770.3974.8174.3773.994.2157
770856.5899.6199.6198.2298.7179
3142088.1995.4694.8895.6492.9381
4271088.0992.5591.0990.1288
6410093.7599.2299.0399.0596.6615
6420077.6899.299.3893.7638.6076
6422052.1991.3290.6296.0193.2381
6450044.894.9692.4891.5171.2698
6435091.7191.4790.7886.9495.3608
7575594.8298.3598.3791.693.8767
Mean75.8293.7093.0691.67586.28862
Shaded cells04322
Table 10. Top 1% retrieval results for MDDR-DS3 dataset for descriptor (ECFC 4).
Ds3Previous StudiesProposed Methods
Retrieval Result 1%
Activity IndexTANBINSQBSDBNMLP
924912.1215.3310.9919.4739.7556
124556.579.377.0313.299.8
124648.178.456.9212.9131.84
3128116.9518.2918.6723.6261.8
432106.277.346.8314.2317.5789
715223.754.086.5711.926.42857
7572117.3220.4120.3829.0857.5667
783316.317.516.1611.9341.3
7834810.159.798.999.1712.2
783519.8413.6812.518.1314.3024
Mean9.7511.4310.5016.37529.257217
Shaded cells00037
Table 11. Top 5% retrieval results for MDDR-DS3 dataset for descriptor (ECFC 4).
Ds3 Retrieval Result 5%Previous StudiesProposed Methods
Activity IndexTANBINSQBSDBNMLP
924924.1725.7217.831.6161.1556
1245510.2914.6511.4216.2927.1429
1246415.2216.5516.7920.953.72
3128129.6228.2929.0536.1375.8
4321016.0714.4114.1222.0936.2105
7152212.378.4413.8214.6815.9143
7572125.2130.0230.6141.0778.2333
7833115.0112.0311.9717.1378.2
7834824.6720.7621.1426.9325.4667
7835111.7112.9413.317.8734.2667
Mean18.4318.3818.0024.4748.611
Shaded cells00019
Table 12. Top 1% retrieval results for MUV dataset for descriptor (ECFC 4).
MUV Retrieval Result 1%Previous StudiesProposed Method
Activity IndexTANBINSQBMLP
4663.16.331.386.66667
5488.6214.8911.3828.6667
6003.796.335.5214.6667
6447.59118.9714.6667
6522.7673.7912
6893.797.334.488
6920.695.331.386.66667
7124.148.225.178.66667
7133.15.892.766
7333.456.674.146
7372.415.111.727.33333
8102.076.781.726.66667
8326.5512.558.2816.6667
8469.6613.1112.4116
85212.4113.789.6618
8581.725.111.387.33333
8591.384.892.416.66667
Mean4.5429418.2541185.09117611.21569471
Shaded cells02012
Table 13. Top 5% retrieval results for MUV dataset for descriptor (ECFC 4).
MUV Retrieval Result 5%Previous StudiesProposed Method
Activity IndexTANBINSQBMLP
4665.8610.448.6212
54822.7627.2224.1446.6667
60011.3812.8916.2120.6667
64417.5919.6717.9325.3333
6527.9311.679.6617.3333
6899.6613.2211.7215.3333
6924.839.224.8314.6667
71210.3416.4511.0314
7137.2495.8612
7338.9710.118.629.33333
7378.28128.2812
8106.913.3311.0310
83213.120.4414.8324.6667
84628.6226.1126.936.6667
85221.3823.112034.6667
8585.869.116.2114
8598.979.448.6211.3333
Mean11.7452941214.9076512.6170619.45098412
Shaded cells04013
Table 14. Top 1% retrieval results for DUD dataset.
DUD Retrieval Result 1%Previous StudiesProposed Method
Activity IndexTANSQB3MLP
FGFR1T2.52.923.17
FXA1.923.361.64
GART7.755.758.00
GBP13.2715.963.46
GR2.313.213.08
HIVPR3.553.555.16
HIVRT1.631.865.00
HMGA6.295.4311.67
HSP901.624.054.21
MR5.335.3310.00
NA2.245.315.20
PR1.852.224.29
Mean4.194.915.41
Shaded cells048
Table 15. Top 5% retrieval results for DUD dataset.
DUD Retrieval Result 5%Previous StudiesProposed Method
Activity IndexTANSQB3MLP
FGFR1T6.6778.17
FXA7.888.297.95
GART22.2523.2525.00
GBP20.9630.9610.00
GR6.418.467.69
HIVPR11.7711.2913.87
HIVRT4.886.989.09
HMGA10.2913.1421.11
HSP908.118.3813.68
MR9.331016.25
NA5.19.810.00
PR4.815.197.14
Mean9.8711.9012.50
Shaded cells039
Table 16. Ranking of enhanced Siamese multilayer perceptron method based on previous studies TAN, BIN, SQB, and SDBN using Kendall W test results.
DataSetRetrieval PercentageWPRank Methods
DS11%0.5930.00003MLP4.27
SDBN4.00
BIN3.27
SQB1.73
TAN1.73
5%0.5880.000033MLP4.64
SDBN3.73
BIN2.82
TAN2.27
SQB1.55
DS21%0.36730.0053MLP3.70
BIN3.65
SDBN3.40
SQB2.85
TAN1.40
5%0.343210.00821BIN4.15
SQB3.55
SDBN2.90
MLP2.70
TAN1.70
DS31%0.6980.0000129MLP4.60
SDBN4.10
BIN2.80
SQB1.90
TAN1.60
5%0.7840.000002584MLP4.90
SDBN4.10
SQB2.10
TAN2.00
BIN1.90
MUV1%0.8671.35 × 10−9MLP3.88
BIN3.12
SQB1.65
TAN1.35
5%0.7028.24 × 10−8MLP3.74
BIN3.03
SQB1.82
TAN1.41
DUD1%0.31152.38 × 10−2MLP2.50
SQB2.08
TAN1.42
5%0.583330.0009118MLP2.67
SQB2.17
TAN1.17
Publisher’s Note: MDPI stays neutral with regard to jurisdictional claims in published maps and institutional affiliations.

