Article

Hepatoprotective Constituents of Total Dibenzocyclooctadiene Lignans from Schisandra chinensis Based on the Spectrum-Effect Relationship

1
State Key Laboratory of Functions and Applications of Medicinal Plants, Guizhou Medical University, Guiyang 550014, China
2
The Key Laboratory of Chemistry for Natural Products of Guizhou Province and Chinese Academy of Sciences/Guizhou Provincial Engineering Research Center for Natural Drugs, Guiyang 550014, China
3
Shanxi Province Key Laboratory of Environmental Pollution Control and Reservoir Protection Technology of Oilfields, Xi’an Shiyou University, Xi’an 710065, China
*
Author to whom correspondence should be addressed.
Molecules 2021, 26(21), 6554; https://doi.org/10.3390/molecules26216554
Submission received: 26 September 2021 / Revised: 25 October 2021 / Accepted: 27 October 2021 / Published: 29 October 2021
(This article belongs to the Special Issue Natural Products: Isolation, Identification and Biological Activity)

Abstract

:
To scientifically clarify the hepatoprotective constituents of Fructus Schizandrae chinensis, eleven batches samples of total dibenzocyclooctadiene lignans (TDL) from Schisandra chinensis were prepared by using the optimum extraction technique. Characteristic high-performance liquid chromatography (HPLC) chromatograms were obtained through HPLC analysis technology, and the hepatoprotective effects of the eleven batches of TDL were evaluated by MTT assay. Based on the chemical and biological activity results, the spectrum-effect relationship between the characteristic HPLC fingerprints and the hepatoprotective effect of TDL was established using Minitab 16.0 data analysis software. On the basis of the spectrum-effect relationship, thirteen compounds (113) were obtained from the TDL by chemical natural product chemical separation and purification technology, and their structures were identified on the basis of the spectral data and the literature. Based on these compounds, thirteen common peaks among the thirty-three chromatographic peaks in the above HPLC fingerprints were identified. Our findings showed that some components, including, schisandrin B (2), schisandrin A (3), and schisandrol B (7) had significant roles in promoting hepatoprotective activity. Preliminary verification of the spectrum-effect relationship of TDL from S. chinensis was carried out, and the results confirmed that the activity of a composite of these three key components in optimal ratios was better than that of any individual compound, which potentially confirmed the reliability of the spectrum-effect relationship and the synergistic effects of traditional Chinese medicine.

1. Introduction

The dry fruit of Schisandra chinensis (Turcz.) Baill. is a basic source plant of Fructus Schisandrae chinensis and is officially listed in the Chinese Pharmacopoeia. As a well-known traditional Chinese medicine (TCM), S. chinensis has five flavors, including sour, sweet, bitter, spicy, and salty. Therefore, it is usually called Wuweizi [1]. S. chinensis is mainly distributed in Liaoning, Jilin, and Heilongjiang provinces and the North China region. A modern pharmacological study of dibenzocyclooctadiene lignans showed that they had many biological functions, such as liver protection, reduced enzyme levels, antibacterial, antitumour, antioxidant, antiviral effects, and immune enhancement [2,3,4,5,6]. Furthermore, it is noteworthy that S. chinensis has been prescribed as a medication for the treatment of liver damage in TCM for thousands of years. In recent years, as a result of chemical and pharmacological research, it was shown that the dibenzocyclooctadiene lignans in S. chinensis were the main hepatoprotective constituents [7,8,9,10,11,12], and an enrichment technique for the total dibenzocyclooctadiene lignans (TDL) from S. chinensis was reported [13,14]. However, the correlation between the active dibenzocyclooctadiene lignans and their hepatoprotective activities was not clear, especially regarding which lignans are synergistic with respect to the activity and which lignans are less effective.
More and more studies have shown that the efficacy of TCM is due to the comprehensive synergistic effect of multiple specific targets in the material. In recent years, the spectrum-effect relationship has become an important technical means of combining the qualitative basis and curative effect of TCM. TCM fingerprint information can be combined with drug effect information, which has provided new ideas for elucidating the effective mechanism of TCM by screening out characteristic peaks that are closely related to drug efficacy. Therefore, the spectrum-effect relationship of TDL from S. chinensis was established to clarify its hepatoprotective effect; the results are of great significance to the development and utilization of Fructus Schisandrae chinensis and provide a new research paradigm for assessing the comprehensive effect of effective substances in TCM.
High-performance liquid chromatography (HPLC) fingerprinting is an important analytical method that is useful in the identification and quality control of botanical medicines [15,16,17,18]. HPLC has undergone such rapid development in the quality control and evaluation in TCM and it can be used to determine the contents and constituents of many compounds to obtain fingerprints of various materials [19,20]. The in vitro CCl4-induced hepatoprotective activity model, a classic chemical liver injury bioassay method [21], was chosen to evaluate the hepatoprotective activity of TDL from S. chinensis. Minitab, a powerful software for statistical data analysis, was used to describe the contributions of different dibenzocyclooctadiene lignans to hepatoprotective activity.
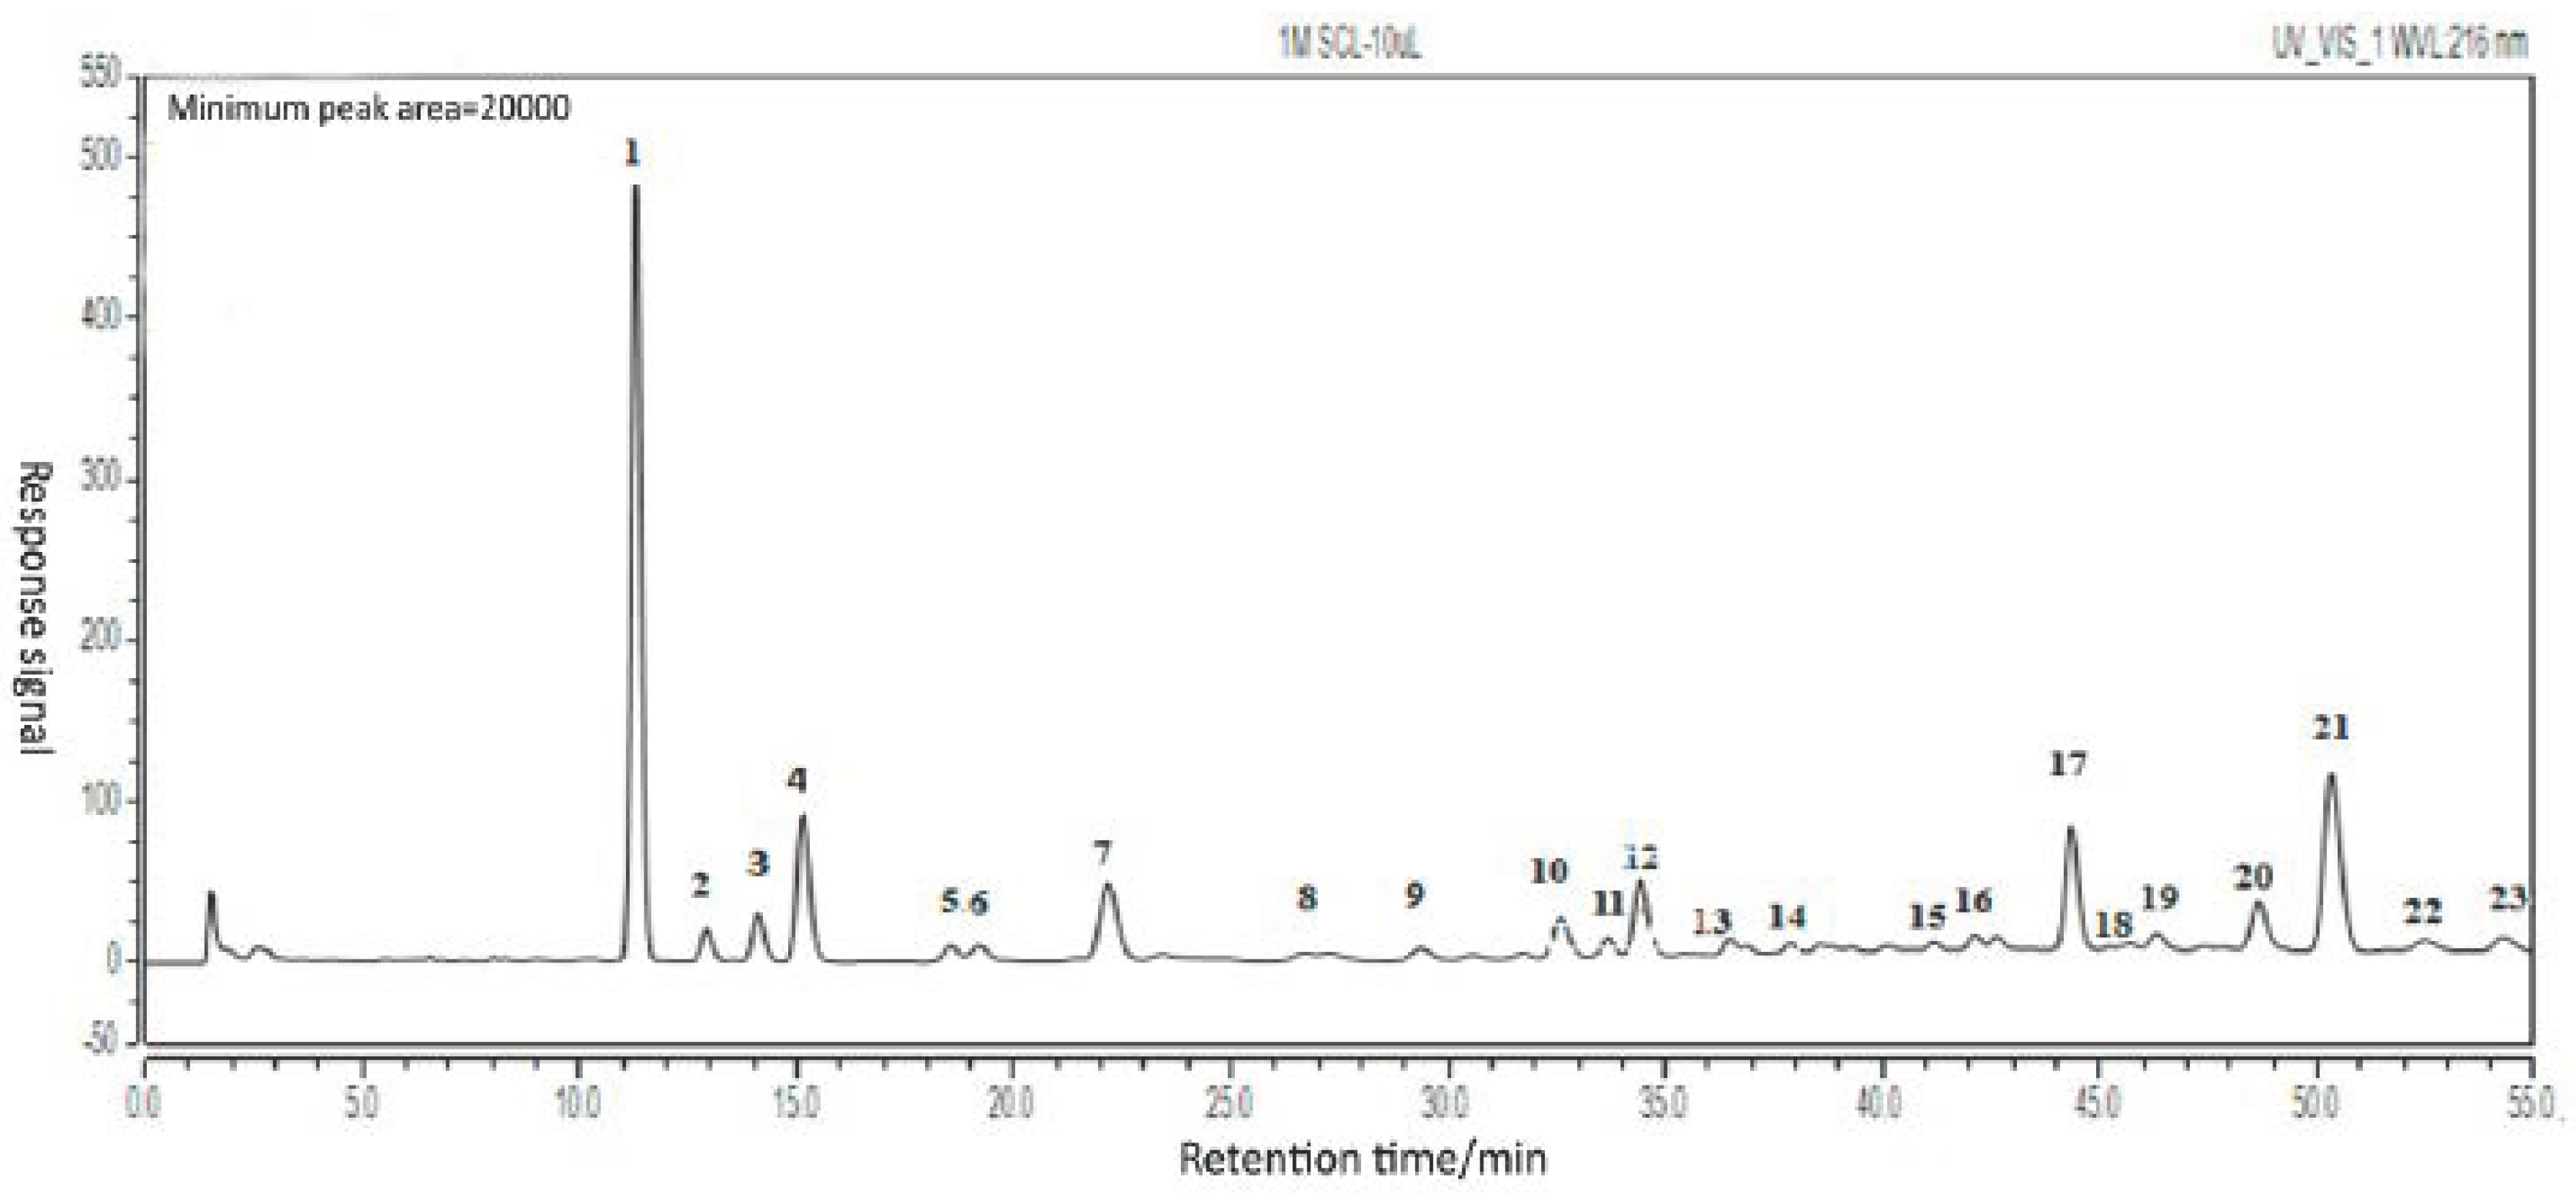
Herein, HPLC and the in vitro hepatoprotective screening model were used to obtain the characteristic HPLC fingerprint and hepatoprotective activity of TDL from S. chinensis. The above data were analyzed in Minitab 16.0 software to obtain the spectrum-effect relationship of TDL from S. chinensis and predict an optimal dibenzocyclooctadiene lignan ratio with strong hepatoprotective activity. In our analysis of the chemical constituents of TDL in S. chinensis, thirteen compounds with the best hepatoprotective activity were isolated and identified, and thirteen common peaks were identified successfully on this basis. Preliminary verification of the spectrum-effect relationship was carried out, and the results indicated that the activity of three key compounds (schisandrin B, schisandrin A, and schisandrol B) in the optimal ratio was better than that of any individual compound. These results might provide an experimental basis and new research strategies for the research and development of S. chinensis as a hepatoprotective drug and health care product.

2. Results

2.1. Establishing the Typical HPLC Chromatogram of TDL from S. chinensis

The details optimized extraction technology of TDL are shown in the Supplementary Materials (Tables S1–S5). Samples S1S11 were analyzed by HPLC. The typical HPLC chromatogram of TDL from S. chinensis is shown in Figure 1. The HPLC chromatogram of S11 is shown in Figure 2. Twenty-three common peaks with large areas and good segregation from adjacent peaks were identified the eleven HPLC chromatograms, and the total areas of these peaks were more than 80% of the total peak area in every chromatogram. Therefore, these twenty-three peaks were selected as the common characteristic peaks, and they were numbered as shown in Figure 2. The data in Table 1 show the average peak areas and relative retention times of the twenty-three common characteristic peaks of S1S11.
The experimental results showed that the relative standard deviation (RSD, %) values for the relative retention times from different batches of samples were less than 0.2%, which showed that the relative retention time of the same chromatographic peak was very consistent. Thus, using this method to establish the feature maps was scientific and reasonable. The RSD (%) values for many peak areas were greater than 10%, which indicated that the compounds in different batches of samples were similar, but their contents were not identical, which implied that the method was suitable for analyzing the spectrum-effect relationship.

2.2. Biological Activity

2.2.1. Protective Activity of Different Concentrations of Test Samples against CCl4-Induced Liver Injury

The protective activity of three doses of S11 against CCl4-induced liver injury was measured by the MTT method, and the OD values and average cell survival rates (%) are shown in Table 2. Compared with the blank group, the cell survival rate of the model group was 68.87%, which indicated that the experimental model had been constructed successfully. The cell survival rates of the positive control (dimethyl dicarboxylate biphenyl, DDB) group and the three experimental groups were higher than those of the model group, which showed that the samples had a certain protective effect against injury to liver cells. The cell survival rate of the middle-dose group was much higher than that of the DDB group, which showed that this dose had better protective activity against CCl4-induced liver injury.

2.2.2. Protective Activity of Eleven Test Samples against CCl4-Induced Liver Injury

The protective activities of S1S11 against CCl4-induced liver injury were screened by the MTT method, and the OD values and average cell survival rates (%) are presented in Table 3. The results showed that these eleven samples of S. chinensis had a certain protective effect against CCl4-induced liver injury in HL-7702 cells. The protective effects of S1, S4, S6, and S11 were the most significant.

2.3. Isolation of TDL from S. chinensis

Thirteen compounds (113) were isolated and purified from TDL from S. chinensis by silica gel column chromatography, reversed phase silica gel column chromatography, Sephadex LX-20 gel column chromatography, semi-prepared HPLC, and recrystallized. Based on the obtained NMR, MS data, and the literatures reported, their structures were identified as schisandrin C (1) [22], schisandrin B (2) [23], schisandrin A (3) [24], gomisin G (4) [25], schisantherin A (5) [26], angeloylgomisin Q (6) [27], schisandrol B (7) [27], gomisin J (8) [28,29], schisantherin B (9) [30], tigloylgomisin H (10) [31], schisandrin (11) [24], schisanhenol (12) [32], and schisanhenol B (13) [33] (Figure 3). All the 1H and 13C NMR spectra data for compounds 113 are presented in Supplementary Materials.

2.4. Evaluation of Similarity and Assignment of Common Peaks

The Similarity Evaluation System for Chromatographic Fingerprints of Traditional Chinese Medicines was used to evaluate the similarity of the HPLC chromatograms of the eleven Fructus Schisandrae chinensis samples, and the results are shown in Table 4. The similarity index of these eleven samples (S1S11) was higher than 0.97.
Hierarchical cluster analysis is a method for highlighting the similarities and differences with the common peak area data of these eleven batches of S. chinensis. Taking the peak areas of twenty-three common peaks as the variable, the systematic cluster analysis of samples S1S11 was carried out. The average connection method between groups was adopted, and the cosine of the included angle was used as the sample similarity measure. As shown in Figure 4, the samples could be divided into two main categories. The one category included S1S3, and S5S11, and the other category only included S4. These results indicated the little difference of the content and distribution of chemical compounds in various S. chinensis.
Thirteen compounds and their mixture were analyzed by HPLC under the same chromatographic conditions to determine their retention times, and the HPLC chromatogram of the mixed reference substances is shown in Figure 5. They were identified according to their retention times. According to Section 2.3 and the relevant literature, thirteen peaks were confirmed, and their retention times, corresponding compound names, and molecular weights are presented in Table 5.

2.5. Analysis of the Spectrum-Effect Relationship

A spectrum-effect relationship model between the protective effect of the eleven samples and the characteristic HPLC fingerprints was established.
The standardized regression coefficients were calculated by the partial least squares regression model. According to the standardized regression coefficients in Table 6, the regression equation of the twenty-three common peak areas and the hepatoprotective activity was obtained as the following: Y = − 0.288X1 − 0.309X2 − 0.064X3 + 0.275X4 + 0.104X5 − 0.254X6 − 0.580X7 − 0.012X8 + 0.588X9 + 0.067X10 + 0.525X11 + 0.378X12 + 0.086X13 + 0.49X14 + 0.204X15 − 0.206X16 + 0.347X17 − 0.394X18 + 0.281X19 − 0.008X20 + 0.705X21 + 0.028X22 − 0.375X23.
As shown in Table 6, thirteen chromatographic peaks corresponding to specific compounds were directly proportional to the hepatoprotective effect, which indicated that these thirteen compounds could promote the hepatoprotective effect. The peak areas of these thirteen compounds are listed in Table 1. Ten peaks were inversely proportional to the hepatoprotective effect. The strength of the hepatoprotective effects of these compounds was in the following order: peak 21 > peak 9 > peak 11 > peak 14 > peak 12 > peak 17 > peak 19 > peak 4 > peak 15 > peak 5 > peak 13 > peak 10 > peak 22 > peak 20 > peak 8 > peak 3 > peak 16 > peak 6 > peak 1 > peak 2 > peak 23 > peak 18 > peak 7.
According to the pharmacological activity screening results shown in Table 3, the protective activity of S4 was the greatest. S4 was taken as an example; according to Table 5 and Table 6, among the thirteen effective compounds, nine compounds were identified, including schisandrin B (2), schisandrin A (3), gomisin G (4), schisantherin A (5), schisandrol B (7), schisantherin B (9), tigloylgomisin H (10), schisanhenol (12), and schisanhenol B (13). Among these nine compounds, seven compounds play obvious roles in protection against liver injury, and the peak area ratio was schisandrin B (2):gomisin G (4):schisantherin A (5):schisantherin B (9):schisandrin A (3):schisandrol B (7):schisanhenol B (13) = 17:1:1:5:16:11:1. And the other ten compounds have inhibitory effects on liver protective activities.

2.6. Preliminary Validation of Hepatoprotective Effect of Three Key Compounds In Vitro

On the basis of the above spectrum-effect relationship, three key compounds schisandrin B (2), schisandrin A (3), and schisandrol B (7), were selected for the validation experiment. The protective activities of composites containing these three compounds in various proportions against CCl4-induced liver injury were screened by MTT, and the OD values and average cell survival rates (%) are presented in Table 7. The results showed that the activity of these three compounds combined according to the selected ratio was better than that of any individual compound, which was consistent with the result of the spectrum-effect relationship.

3. Discussion

Chinese herbal medicine, with the advantage of high efficiency, low toxicity, and less side effects, has become an important resource for the modern drug development. S. Chinensis is a plant species well-known in TCM, and also in modern Chinese medicine, with hepatoprotective activity and reduces related serum enzymes [34]. However, due to the multitarget and multicomponent characteristics of TCM, it is difficult to control the quality of TCM and it has become a hot topic in the field of research. Recently, many studies have proved that the spectrum-effect relationship should be an effective method to control the quality of TCM because it can connect chromatographic fingerprints with biological activity to explore the quality markers related to clinical efficacy [35]. Thus, to ensure the quality and therapeutic consistency of TCM, this approach may be a good strategy to control its quality.
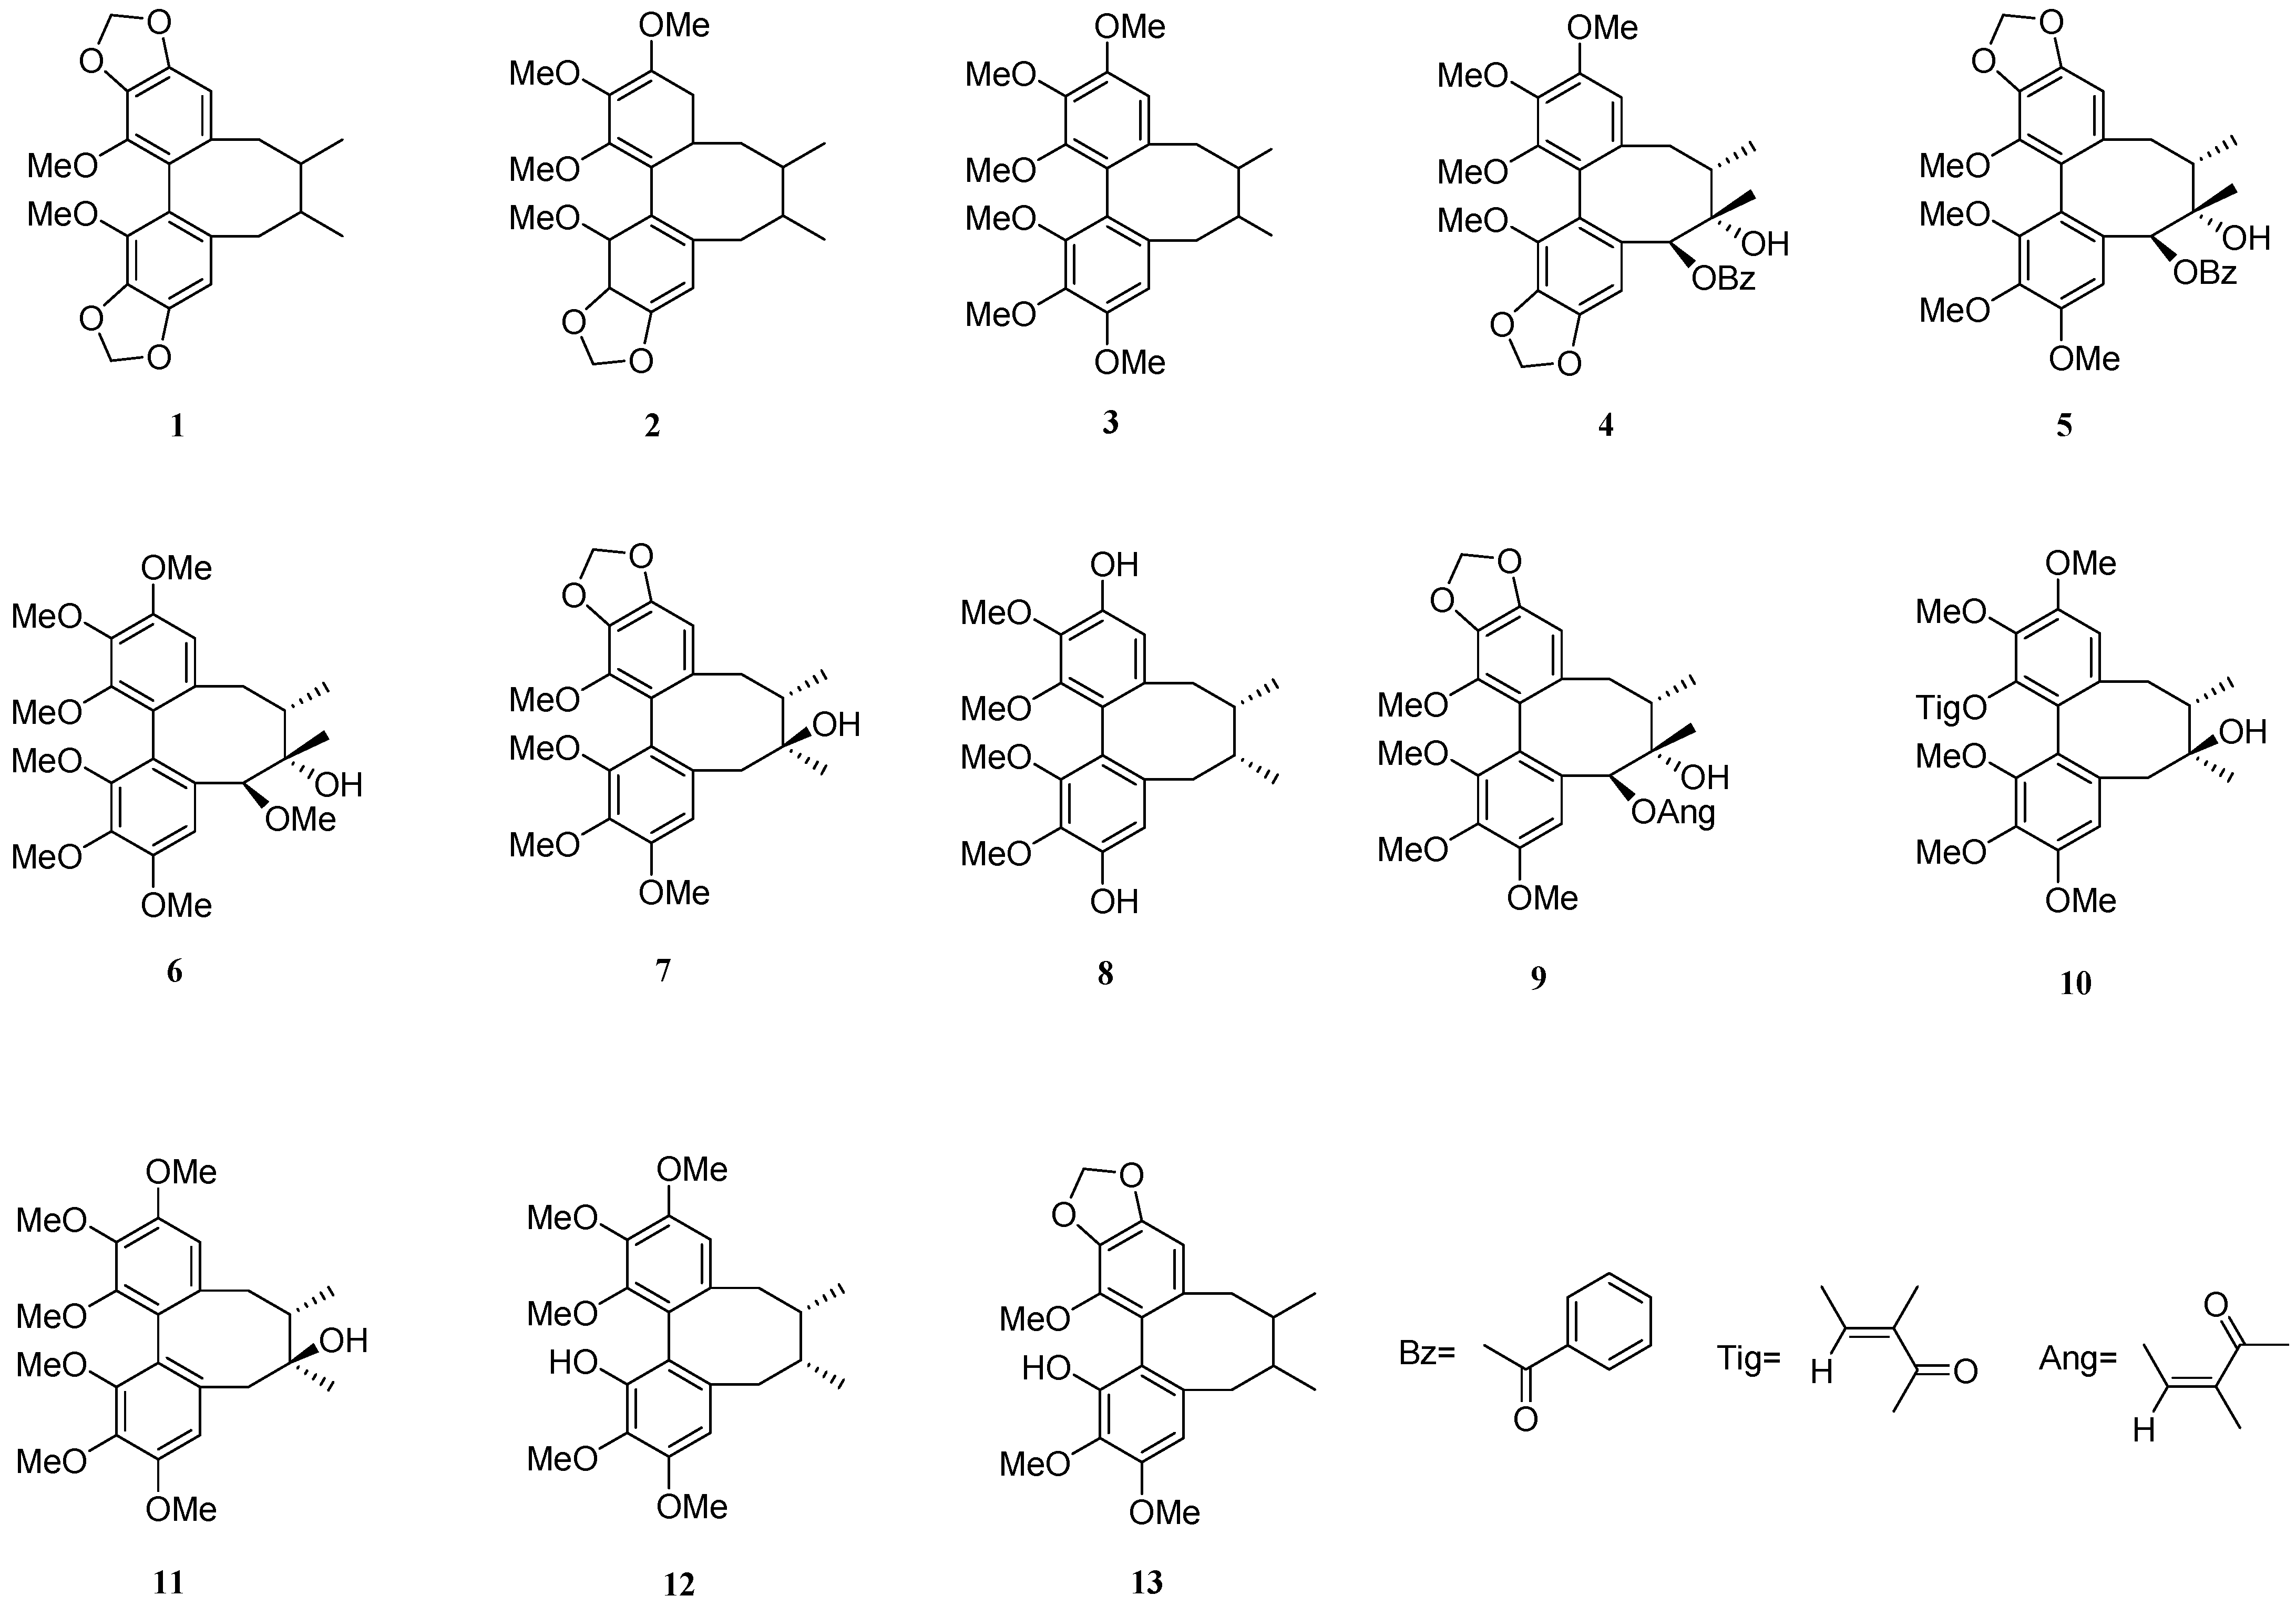
This study examined eleven batches of S. chinensis samples, on the basis of the preliminary experimental results, their TDL (S1S11) were extracted and enriched as putative effective components under the optimum conditions. A characteristic HPLC fingerprint was established. The protective activities of eleven TDL samples (S1S11) were obtained using the CCl4-induced liver injury model and the MTT method. Then, using Minitab 16.0 data analysis software, the relationship between chemical constituents and pharmacological activities was analyzed, and the related equations were obtained. The separation and structural identification of thirteen compounds (113) from TDL in S. chinensis was used to identify the most common peaks. The results showed that schisandrin B (2), schisandrin A (3), gomisin G (4), schisantherin A (5), schisandrol B (7), schisantherin B (9) and schisanhenol B (13) played obvious roles in protection against liver injury, and the preliminary optimal proportions were schisandrin B (2):gomisin G (4):schisantherin A (5):schisantherin B (9):schisandrin A (3):schisandrol B (7):schisanhenol B (13) = 17:1:1:5:16:11:1. On the basis of the above spectrum-effect relationship, three key compounds schisandrin B (2), schisandrin A (3), and schisandrol B (7), were selected for the preliminary validation experiment. The results showed that the activity of the three key compounds combined in the optimal ratio was better than that of any individual compound, which was consistent with the result of the spectrum-effect relationship.
In our study, the spectrum-effect relationship between the chromatographic fingerprints of TDL and the hepatoprotective activity in S. chinensis was established for the first time, and the main effective components and their best ratio were obtained. Our findings will provide a more scientific and reasonable method for improving the quality control standard of S. chinensis, and it is of great significance for explaining the hepatoprotective activity of TDL and developing new hepatoprotective drugs. In addition, in this work, thirteen common peaks were identified. Compared with the results of current literature, our results were improved, which provided a basis for expounding the material basis of TDL. Due to the limitation of experimental conditions and time, only thirteen compounds were obtained, and activity tests were conducted preliminarily in vitro. Next, in order to further improve the quality control system of S. chinensis, more compounds will be prepared, and to explore more active constituents or metabolites, mass spectrometry analysis will be considered for our research.

4. Materials and Methods

4.1. Chemicals and Equipment

The following materials and reagents were used in separation, purification, and HPLC analysis: silica gel G and H (Qingdao Ocean Chemical Plant Branch, Qingdao, China), reversed-phase silica gel (Rp-18, 40–63 μm) (Amersham Biosciences, Uppsala, Sweden), octadecyl silane (ODS, 50 µm) (Merck; Darmstadt, Germany), and Sephadex LH-20 (Amersham Biosciences, Uppsala, Sweden) for column chromatography. TLC analyses were carried out using GF254 TLC plates (Qingdao Puke Separation Material Co., Ltd., Qingdao, China). All solvents used for the preparation of the extracts were analytical-grade reagents and were purchased from Tianjin Kemiou Chemical Reagent Co. (Tianjin, China) Acetonitrile (HPLC grade) and methanol (HPLC grade) were purchased from Sigma Chemical Co. (Budapest, Hungary), and ultrapure water was prepared with a Milli-Q water purification system (Millipore, Bedford, USA).
NMR spectra were recorded on an INOVA-400 and 600 MHz superconducting nuclear magnetic resonance spectrometer (TMS internal standard, Varian, USA) with deuterated reagents for NMR spectroscopy (Wuhan Spectrum Company of Chinese Academy of Sciences, Wuhan, China). HPLC analysis was performed with a DIONEX U3000 HPLC system (Diane China Co., LTD., Beijing, China quaternionic pump, DAD detector, Chromeleon 7.2 chromatography workstation). The common peaks MS data were analyzed by a HPMS5973 mass spectrometer (HP, Agilent, Palo Alto, USA).
The following materials were also used in the experiments: normal liver cell line HL-7702 (National Collection of Authenticated Cell Cultures, Beijing, China); fetal bovine serum (Gibco, USA); dimethyl sulfoxide (DMSO) and 3-(4,5-dimethyl-2-thiazolyl)-2,5-diphenyl-2-H-tetrazolium bromide (MTT) (Beijing Mr. Lai Treasure Company, Beijing, China); phosphate buffer solution (PBS), RPMI (Roswell Park Memorial Institute) 1640 medium, penicillin, streptomycin and 0.25% trypsin solution (containing phenolred) (HyClone); CCl4 (analytical reagent, AR) (Sinopharm Chemical Reagent Co., Ltd., Beijing, China); and cell culture bottles, centrifuge tubes, 96 cell culture plates and other consumables (NEST Biotechnology Co. Ltd., Wuxi, China). The medicine diphenyl dimethylester (DDB) was used as a positive control. The absorbance was read using a microplate reader (Varioskan LUX, Thermo, Waltham, USA) at 490 nm. The results were obtained in at least three independent experiments.

4.2. Plant Material

Samples of dried fruit of S. chinensis were collected from several regions of China between August and October 2014 (as shown in Table 8). Botanical identifications were performed by Professor Lisha Dong from Guiyang University of Chinese Medicine, and voucher specimens for each sample material (Nos. 20140801-20140811) were deposited at the Herbarium of the Key Laboratory of Chemistry for Natural Products of Guizhou Province and the Chinese Academy of Sciences.

4.3. Preparation of Total Dibenzocyclooctadiene Lignans (TDL)

TDL samples from eleven different batches of dried S. chinensis were prepared separately (S1–S11). Each batch of dried S. chinensis (10.0 g) was crushed, sieved to 40 mesh and then refluxed with a solid-liquid ratio (g/mL) of 1:7 in 90% ethanol (2 × 4 h). After filtration, the solution was evaporated to dryness under reduced pressure. The residue was dissolved in water and extracted 5 times with 6 volumes of ethyl acetate, the ethyl acetate layers were combined, and the solvent was reduced to obtain the ethyl acetate extract of each batch of S. chinensis. The above ethyl acetate extract dissolved in ethanol was adsorbed with an AB-8 macroporous resin (Shanghai Science and Technology Development Co., Shanghai, China) at a ratio of 1:10 and then eluted with an ethanol-water series (6 volumes of 30% ethanol and 20 volumes of 95% ethanol). Finally, the constituents eluted with 95% ethanol were collected as the TDL (S1–S11). Then, each batch of TDL (10.0 mg) was accurately weighed, dissolved in methanol, and brought to volume with methanol in a 10 mL volumetric flask. Then, 1.5 mL of the sample solution was filtered with a 0.45 μm microporous membrane for HPLC analysis.
The reference substances used for HPLC analysis were isolated by us, dissolved in HPLC-grade methanol at a concentration of 0.04 mg/mL, and then filtered with a 0.45 μm microporous membrane for HPLC analysis. Aliquots (100 μL) of each reference substance were taken and mixed to obtain the mixed standard.

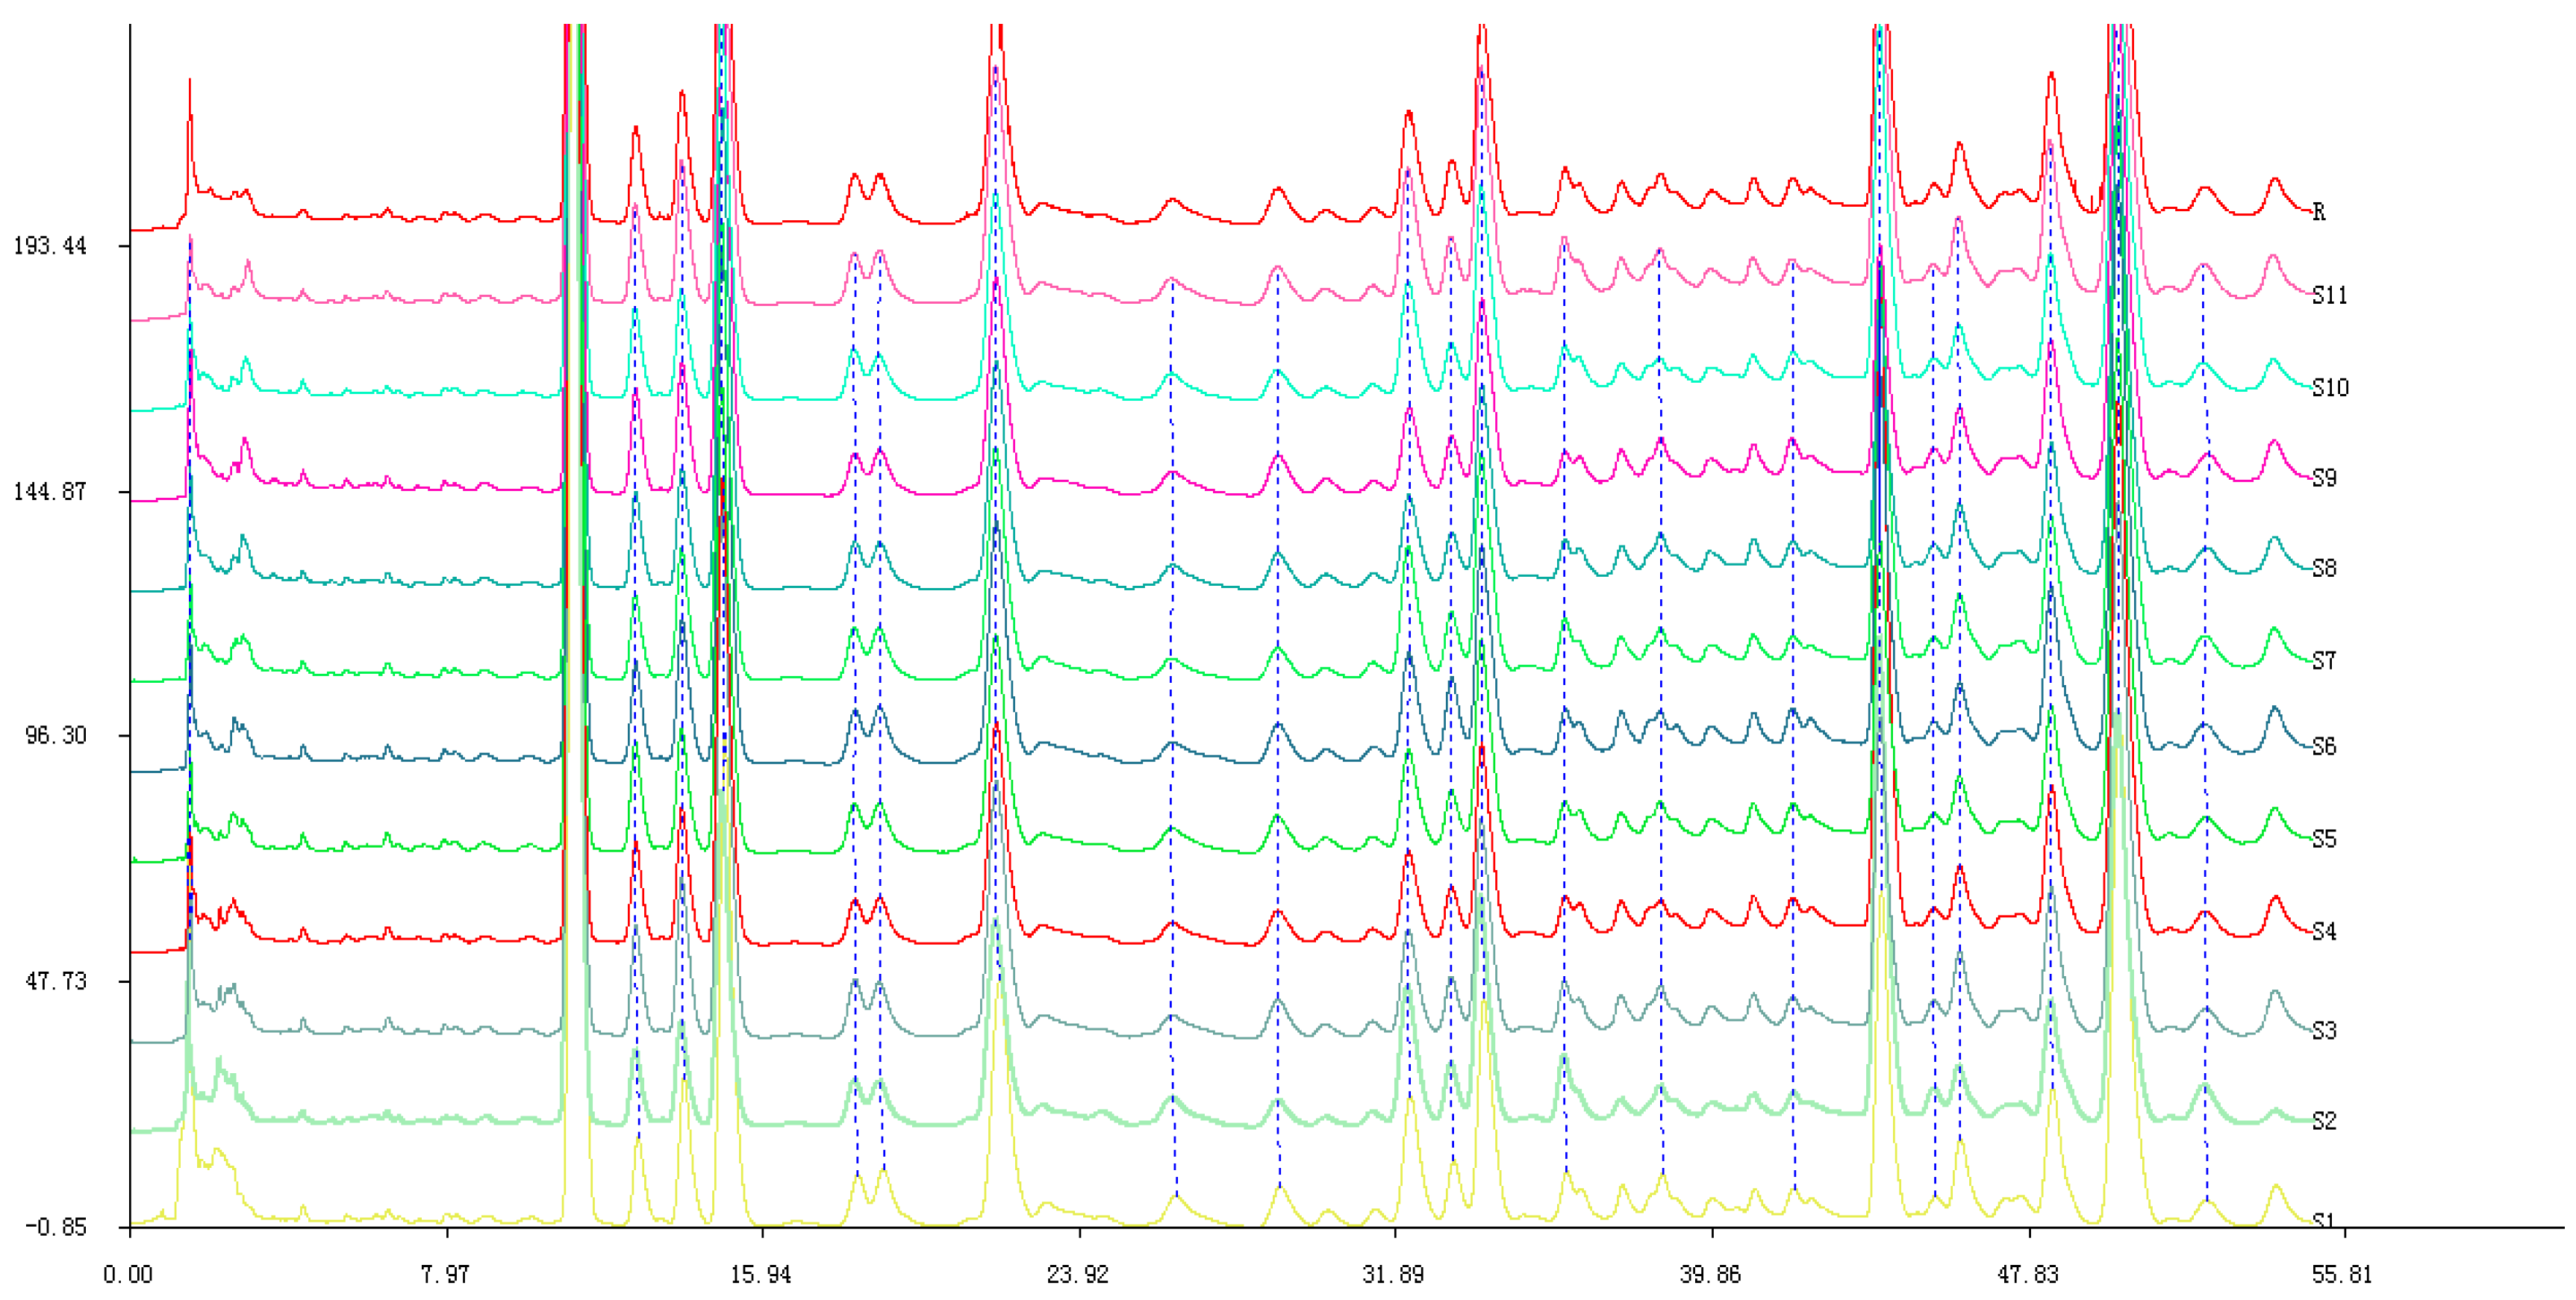
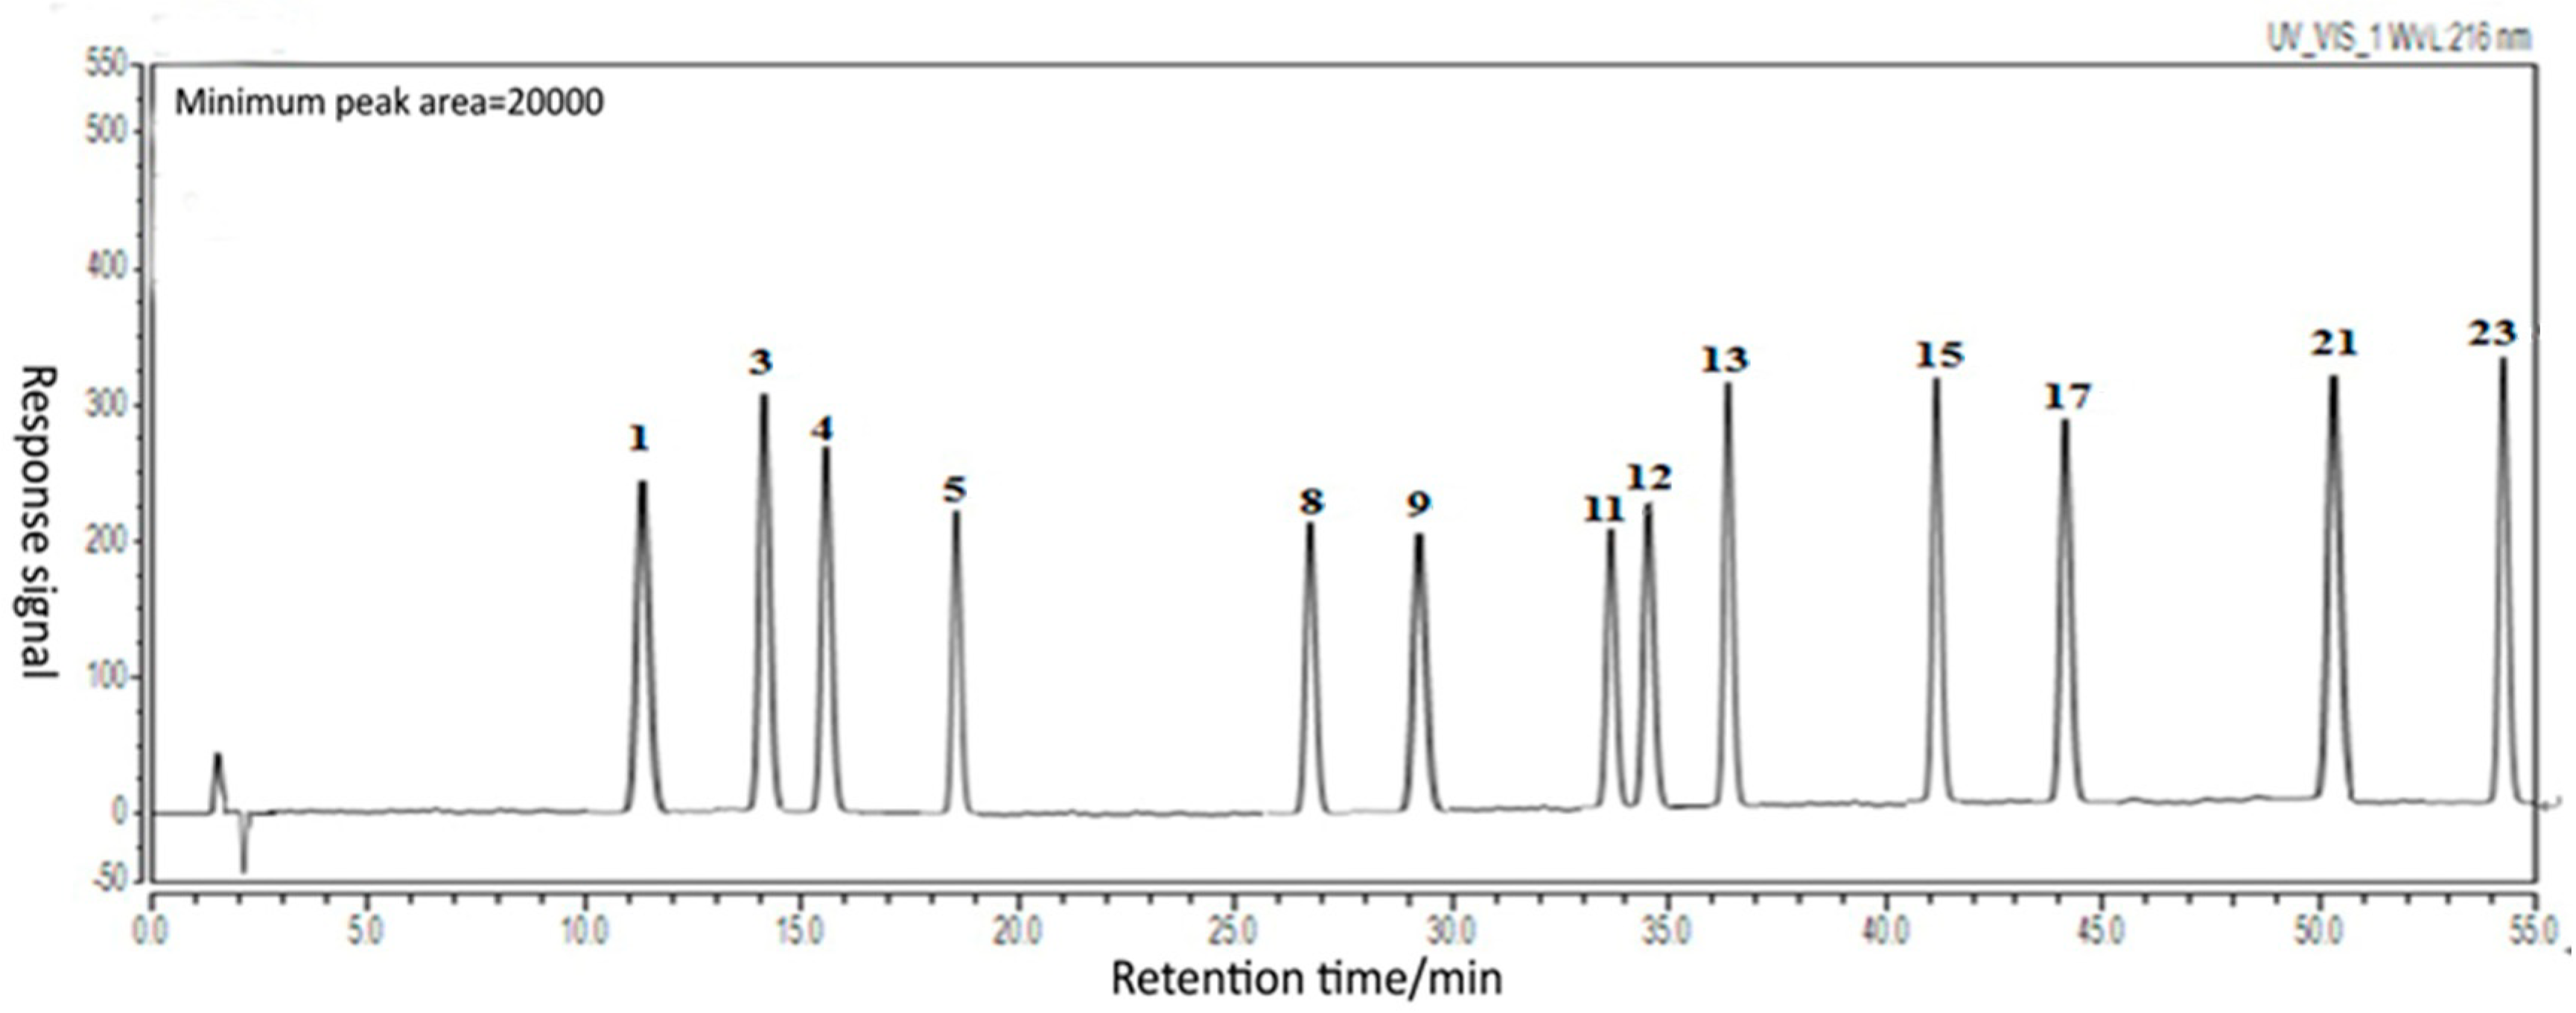
4.4. Typical HPLC Chromatograms of Different TDL Samples from Eleven Batches of S. chinensis

Eleven different batches of TDL (S1S11) were analyzed by HPLC using a DIONEX U3000 HPLC system. The chromatographic conditions were as follows: solution A: acetonitrile; solution B: water; mobile phase: A 50% from 0 to 25 min, A 65% from 25 to 35 min, A 70% from 35 to 40 min, and finally A 70% from 40 to 55 min. The wavelength was 216 nm, the sample volume was 10 μL, the column temperature was 25°C, and the flow rate was 1.0 mL/min. Separation was performed using a Kromasil 100-5 C18 column from AKZO NOBEL (particle size: 5 μm, length×diameter: 250 × 4.6 mm).

4.5. Hepatoprotective Activity of Different TDL Samples from Eleven Batches of S. chinensis against CCl4-Induced Liver Injury

The cell line was cultured as described in the relevant literature [36]. To assess cell viability, 1.0 × 10⁴ cells were plated in each well of 96-well plates, and the plates were placed in a humidified 5% CO2 incubator at 37 °C for 24 h. Solutions of the test samples (S1–S11) (25 μL, 50 μg/mL) were added to the 96-well plates and incubated for 24 h. Next, 4 μL of CCl4 was added, and incubation was continued for 12 h. After 20 μL of MTT was added to each well and incubated for 4 h, the old culture medium was discarded. Next, 150 μL of DMSO was added to each well, and the plates were oscillated for 15 min at 37°C to ensure that the crystals were dissolved completely. Finally, the absorbances (OD values) were analyzed using an enzyme-linked instrument at 490 nm to evaluate the hepatoprotective effects of the TDL (S1S11) from eleven different batches of S. chinensis against CCl4-induced liver injury. Fourteen experimental groups, including a blank group, a CCl4 model group, a positive control group and the sample groups, were used in this bioassay. Each group was tested in five parallel wells and repeated three times. The cell survival rate (%) was calculated relative to that of the normal group.

4.6. Isolation of TDL with the Best Hepatoprotective Activity

Sample S4 had the best hepatoprotective activity, so it was selected for separation and purification. As described in Section 4.3, 400 g TDL from sample S4 was obtained and mixed with 40–80 mesh silica gel at a ratio of 1:1.2. The mixed sample was separated by 7 rounds of elution through a silica gel (200–300 mesh) column with a gradient of petroleum ether:ethyl acetate (volume ratios was 30:1, 8:1, 2:1, and 1:1) to yield 6 fractions (Fr. AE). Then, the different fractions were separated by silica gel column chromatography, Sephadex LX-20 gel column chromatography, semi-prepared HPLC, and repeated recrystallization.
Fr. A was first subjected to normal-pressure silica gel chromatography (200–300 mesh, petroleum ether:ethyl acetate = 40:1). Then, the mixture was purified again with a 300–400 mesh normal-pressure silica gel column (petroleum ether-ethyl acetate = 80:1) to give compound 1 (schisandrin C, 684 mg). Fr. B was separated by silica gel chromatography (200–300 mesh, petroleum ether-ethyl acetate = 40:1), and recrystallized repeatedly to obtain compound 2 (schisandrin B, 8.412 g) and compound 3 (schisandrin A, 4.801 g)
Fr. C was subjected to silica gel chromatography (200–300 mesh, petroleum ether:acetone = 20:1) to afford 12 subfractions (Fr. C.112), and recrystallized repeatedly to obtain compound 4 (gomisin G, 321 mg) from Fr. C.12. Then, compound 5 (schisantherin A, 20 mg) was further obtained by passing the sample through two silica gel columns (300–400 mesh, chloroform:acetone = 80:1 and chloroform-methanol = 100:0–0:100 respectively). Then, the sample was purified by silica gel column (300–400 mesh, chloroform:acetone = 30:1) and semipreparative HPLC (MeOH:H2O = 68:32, v = 1.5 mL/min ) to give compound 6 (angeloylgomisin Q, 51 mg). Fr.C.10 was separated by silica gel chromatography (300–400 mesh, chloroform:acetone = 60:1), and by recrystallization to yield compound 7 (schisandrol B, 333 mg). Further purification by semi-prepared HPLC (MeOH:H2O = 70:30, v = 1.0 mL/min) afforded compound 8 (gomisin J, 13 mg) and compound 9 (schisantherin B, 9 mg).
Fr. D was separated by a silica gel (200–300 mesh, petroleum ether:acetone = 8:1). Compound 10 (tigloylgomisin H, 51 mg) was prepared by repeated silica gel column, Sephadex LH-20 column, and semi-prepared HPLC. After further purification with medium-pressure ODS (MeOH:H2O = 40:100, 60:100, 80:100 and 90:100), compound 11 (schsandrin, 20 g) was finally obtained by repeated recrystallized.
Fr. E was subjected to silica gel chromatography (200–300 mesh, petroleum ether-ethyl acetate:formic acid = 15:5:1) to afford 5 subfractions (Fr. E.15). Fr. E.2 and Fr. E.4 were separated by repeated silica gel column and Sephadex LH-20 column. Compound 12 (schisanhenol, 32 mg) was obtained by vacuum column chromatography (silica H, petroleum ether:acetone = 5:1), and compound 13 (schisanhenol B, 15 mg) was obtained by purification with an Rp-18 column (actone:H2O = 40:60–70:30).
The structures of compounds 113 were identified by 1H-NMR, 13C-NMR, MS, and comparison with reported data.

4.7. Spectrum-Effect Relationship

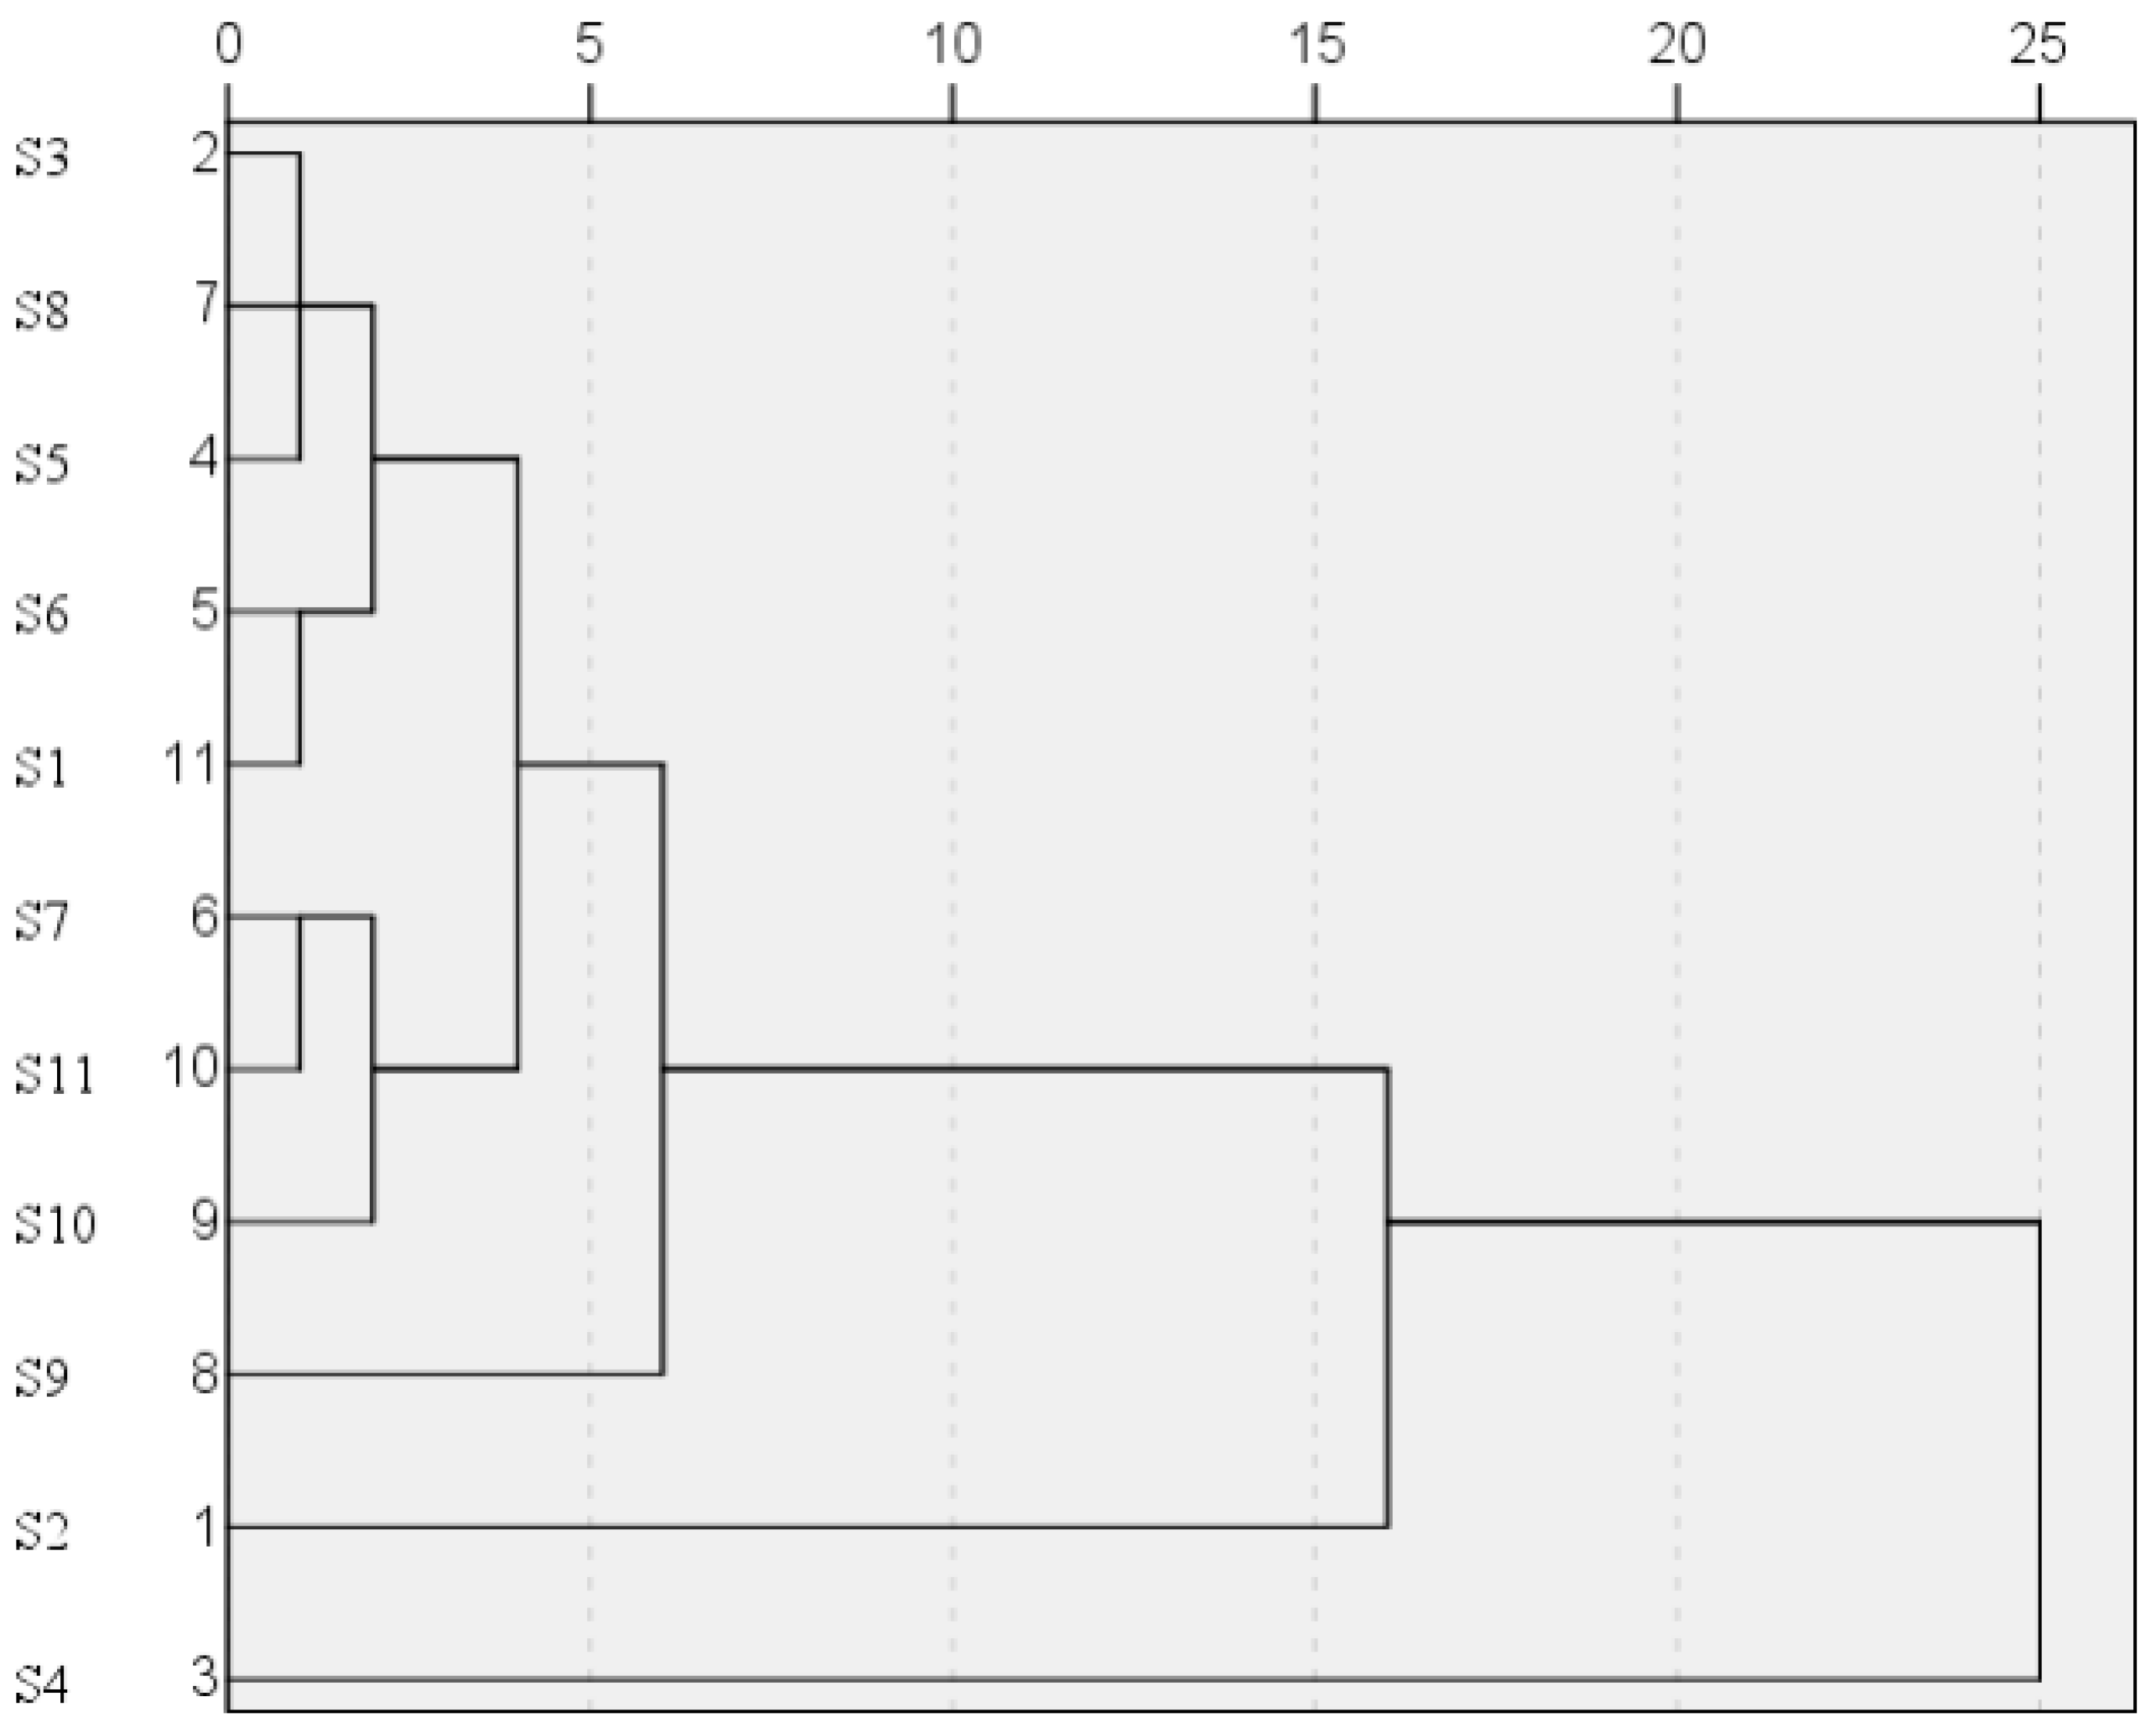
4.7.1. Similarity Analysis and Hierarchical Cluster Analysis

Similarity analysis was performed by the Similarity Evaluation System for Chromatographic Fingerprints of Traditional Chinese Medicines (Version 2021A; Beijing, China). Hierarchical cluster analysis of the eleven samples S1S11 was performed using SPSS software (version 24).

4.7.2. Partial Least Squares Regression Analysis

The twenty-three common chromatographic peak areas were set as the independent variable (X), their hepatoprotective effect were taken as dependent variables (Y), and the regression models were built sequentially. After the principal components were extracted, the linear relationships were exhibited by the partial least squares regression model. Meanwhile, the regression coefficient was revealed and considered as the index to exhibit the relative impact of the predictor variables on the response variable for this model. The partial least squares regression was performed using Mini tab 16.0 statistics software.

4.8. Preliminary Verification Test of the Spectrum-Effect Relationship

Similar to the experimental method in Section 4.5 above, we selected three compounds, schisandrin A, schisandrin B, and schisandrol B, that have a great influence on the spectrum-effect relationship for the validation experiment. Ten experimental groups, including a blank group, a CCl4 model group, a positive control group and the sample groups, were used in this bioassay. Each group was tested in five parallel wells and repeated three times. The cell survival rate (%) was calculated relative to that of the normal group.

5. Conclusions

This work established HPLC fingerprints using eleven batches of TDL from S. chinensis. The similarity and hierarchical cluster analysis more objectively explain the characteristic of the source of raw materials. In addition, the relationship between the characteristic HPLC fingerprints and the hepatoprotective effect of TDL were analyzed by partial least squares regression method, and according to the thirteen common peaks identified, the main effective components and their optimal ratios were clarified, and the mixture of three key active components schisandrin B (2), schisandrin A (3), and schisandrol B (7) in optimal ratio were screened in vitro. The results, based on above analytical techniques, showed that these three compounds were consistent with the spectrum-effect relationship on hepatoprotective effect. This report provided a scientific and rational experimental basis for perfecting the quality control standards for S. chinensis and provides important guidance for explaining the hepatoprotective effect of TDL from Fructus Schisandrae chinensis and developing hepatoprotective medicines or health products.

Supplementary Materials

The following are available online. The 1H NMR and 13C NMR spectral data for compounds 113, and the optimized extraction technique for TDL from Schisandra chinensis fruit. Table S1: The data of single factor experiments, Table S2: The factors and levels table of L9 (34) orthogonal experiment, Table S3: The orthogonal experiment table, Table S4: The results of orthogonal test, Table S5: The analysis of variance for orthogonal test.

Author Contributions

S.-Z.M. conceived, designed, and offered guidance for the experiments, and revised the manuscript; L.-L.D. and X.-D.X. performed the experiments, analyzed the spectrum-effect relationship, performed the biology experiments and wrote the manuscript; D.-P.W. offered assistance in HPLC analysis; X.-J.H. contributed as a supervisor; G.C. and J.L. offered guidance for the isolation of compounds. All authors have read and agreed to the published version of the manuscript.

Funding

This research was funded by the financial support from the Science and Technology Program of Guizhou Province (QKHPTRC[2019]5659, QKH-JC[2019]1430) and the National Natural Science Foundation of China (81460530, 31760097 and U1812403-3).

Institutional Review Board Statement

Not applicable.

Informed Consent Statement

Not applicable.

Data Availability Statement

The data presented in this study are available in the supplementary materials.

Acknowledgments

The authors are grateful to the Key Laboratory of Chemistry for Natural Products of Guizhou Province and the Chinese Academy of Sciences for their help in HPLC analysis and NMR measurements; to Dao-Ping Wang for HPLC analysis; to Tao Huang for NMR measurements; and to Professor Jing-Zhen Shi for their generous assistance in the bioactivity tests.

Conflicts of Interest

The authors declare no conflict of interest.

Sample Availability

Samples of the compounds 113 are available from the authors.

References

  1. Committee of National Pharmacopoeia. Chinese Pharmacopoeia; China Medicine Science and Technology Press: Beijing, China, 2010; pp. 61–62. [Google Scholar]
  2. Yu, L.H.; Liu, G.T. The structure-activity relationship of dibenzo (a, c) cyclooctene lignans isolated from fructus schizandrae and innovation of novel anti-hepatitis drugs. Prog Chem. 2009, 1, 66–76. [Google Scholar]
  3. Chang, J.B.; Reiner, J.; Xie, J.X. Progress on the chemistry of dibenzocyclooctadiene lignans. Chem. Rev. 2005, 105, 4581–4609. [Google Scholar] [CrossRef] [PubMed]
  4. Duan, Y.X.; Cao, J.L.; Wen, R.R. Dibenzocyclooctadiene lignans from Schisandra Neglecta and their anti-HIV-1 activities. J. Asian Nat. Prod. Res. 2011, 7, 592–598. [Google Scholar] [CrossRef]
  5. Li, L.; Pan, Q.R. Dibenzocyclooctadiene lignans-A class of novel inhibitors of multidrug resistance-associated protein. Life Sci. 2007, 80, 741–748. [Google Scholar] [CrossRef]
  6. Xu, Y.; Liu, Z.; Sun, J.; Pan, Q.R.; Sun, F.F.; Yan, Z.Y.; Hu, X. Schisandrin B prevents doxorubicin-induced chronic cardiotoxicity and enhances its anticancer activity in vivo. PLoS ONE 2011, 12, e28335–e28341. [Google Scholar] [CrossRef] [PubMed] [Green Version]
  7. Dar, A.A.; Arumugam, N. Lignans of sesame: Purification methods, biological activities and biosynthesis-a review. Bioorg. Chem. 2013, 50, 1–10. [Google Scholar] [CrossRef] [PubMed]
  8. Sowndhararajan, K.; Deepa, P.; Kim, M. An overview of neuroprotective and cognitive enhancement properties of lignans from Schisandra chinensis. Biomed. Pharmacother. 2018, 97, 958–968. [Google Scholar] [CrossRef] [PubMed]
  9. Chyau, C.C.; Ker, Y.B.; Chang, C.H.; Huang, S.H.; Wang, H.E.; Peng, C.C.; Peng, R.Y. Schisandra chinensis peptidoglycan-assisted transmembrane transport of lignans uniquely altered the pharmacokinetic and pharmacodynamic mechanisms in human HepG2 cell model. PLoS ONE 2014, 1, 1–14. [Google Scholar] [CrossRef] [PubMed]
  10. Szopa, A.; Ekiert, R.; Ekiert, H. Current knowledge of Schisandra chinensis (Turcz.) Baill. (Chinese magnolia vine) as a medicinal plant species: A review on the bioactive components, pharmacological properties, analytical and biotechnological studies. Phytochem. Rev. 2017, 2, 195–218. [Google Scholar] [CrossRef] [PubMed] [Green Version]
  11. Li, F.H.; Zhang, T.; Sun, H.; Gu, H.F.; Wang, H.Q.; Su, X.M.; Li, C.K.; Li, B.M.; Chen, R.Y.; Kang, J. A new nortriterpenoid, a sesquiterpene and hepatoprotective lignans isolated from the fruit of Schisandra chinensis. Molecules 2017, 11, 1931. [Google Scholar] [CrossRef] [PubMed] [Green Version]
  12. Hong, M.; Zhang, Y.S.; Li, S.; Tan, H.Y.; Wang, N.; Mu, S.Z.; Hao, X.J.; Feng, Y.B. A network pharmacology-based study on the hepatoprotective effect of fructus Schisandrae. Molecules 2017, 10, 1617. [Google Scholar] [CrossRef] [PubMed] [Green Version]
  13. Li, X.Y.; Yang, M.; Huang, J.Y.; Yu, X.X.; Zhao, M.Q.; Liang, Z.K.; Xie, Z.S.; Xu, X.J. Preparative separation and purification of deoxyschizandrin from Schisandrae Sphenantherae Fructus by high-speed counter-current chromatography. J. Pharm. Anal. 2013, 6, 429–433. [Google Scholar] [CrossRef] [Green Version]
  14. Yang, F.J.; Ma, C.H.; Yang, L.; Zhao, C.J.; Zhang, Y.; Zu, Y.G. Enrichment and purification of deoxyschizandrin and γ-schizandrin from the extract of Schisandra chinensis fruit by macroporous resins. Molecules 2012, 3, 3510–3523. [Google Scholar] [CrossRef] [PubMed]
  15. Zhang, X.X.; Liang, J.R.; Liu, J.L.; Zhao, Y.; Gao, J.; Sun, W.J.; Ito, Y. Quality control and identification of steroid saponins in crude extracts from Dioscorea zingiberensis C. H. Wright by fingerprint with HPLC-ELSD and HPLC-ESI-Quadrupole/Time-of-fight tandem mass spectrometry. J. Pharm. Biomed. Anal. 2014, 91, 46–59. [Google Scholar] [CrossRef] [PubMed] [Green Version]
  16. Li, Y.H.; Zhang, Y.M.; Zhang, Z.J.; Hu, Y.P.; Cui, X.M.; Xiong, Y. Quality evaluation of gastrodia elata tubers based on HPLC fingerprint analyses and quantitative analysis of multi-components by single marker. Molecules 2019, 8, 1521. [Google Scholar] [CrossRef] [PubMed] [Green Version]
  17. Zhou, D.; Yang, Q.; Yu, Z.; Chang, Y.; Tian, T.; Shi, Z.H.; Dong, H.L.; Li, H.; Guo, J.; Wang, S.W. Fingerprint analysis and quantitative determination of fourteen active components in the traditional chinese medicinal preparation Feiyangchangweiyan Capsule by HPLC-DAD-ESI-MS/MS. Iran. J. Pharm. Res. 2019, 2, 948–960. [Google Scholar]
  18. Abubakar, B.M.; Salleh, F.M.; Omar, M.S.S.; Wagiran, A. Review: DNA barcoding and chromatography fingerprints for the authentication of botanicals in herbal medicinal products. Evid. Based Complement. Altern. Med. 2017, 2017, 1–28. [Google Scholar] [CrossRef] [PubMed]
  19. Liu, W.; Wang, D.M.; Liu, J.J.; Li, D.W.; Yin, D.X. Quality evaluation of potentilla fruticose L. by high performance liquid chromatography fingerprinting associated with chemometric methods. PLoS ONE 2016, 2, 1–20. [Google Scholar]
  20. Liu, J.; Liu, H.; Dai, Z.; Ma, S.C. Quality analysis of Long dan Xie gan Pill by a combination of fingerprint and multicomponent quantification with chemometrics analysis. J. Anal. Methods Chem. 2018, 2018, 1–10. [Google Scholar] [CrossRef] [PubMed]
  21. Wang, C.; Zhang, D.J. Schisandra chinensis lignans compositions in liver principal active ingredient in vitro screening. J. Heilongjiang Bayi Agric. Univ. 2010, 2, 80–84. [Google Scholar]
  22. Ikeya, Y.; Taguchi, H.; Yosioka, I.; Kobayashi, H. The constituents of Schizandra chinensis Baill. V. The structures of four new lignans, gomisin E, and transformation of gomisin N to deangeloylgomisin B. Chem. Pharm. Bull. 1979, 27, 2695–2709. [Google Scholar] [CrossRef] [Green Version]
  23. Li, L.N.; Xue, H.; Tan, R. Dibenzocyclooctadiene lignans from roots and stems of Kadsura coccinea. Planta Med. 1985, 51, 297–300. [Google Scholar]
  24. Kochetkov, N.K.; Khorlin, A.; Chizhov, O.S.; Sheichenko, V.I. Schizandrin-lignan of unusual structures. Tetrahedron Lett. 1962, 20, 730–734. [Google Scholar] [CrossRef]
  25. Ikeya, Y.; Taguchi, H.; Yosioka, I.; Kobayashi, H. The constituents of Schizandra chinensis Baill. II. The structures of a new lignans, gomisin D. Chem. Pharm. Bull. 1979, 27, 1395–1401. [Google Scholar] [CrossRef] [PubMed] [Green Version]
  26. Ikeya, Y.; Taguchi, H.; Yosioka, I.; Kobayashi, H. The constituents of Schizandra chinensis Baill. I. Isolation and structure determination of five new lignans, gomisin A, B, C, F, and G, and the absolute structure of Schizandrin. Chem. Pharm. Bull. 1979, 27, 1383–1394. [Google Scholar] [CrossRef] [PubMed] [Green Version]
  27. Ikeya, Y.; Taguchi, H.; Yosioka, I.; Kobayashi, H. The constituents of Schizandra chinensis Baill. IX. The cleavage of the methylenedioxyl moiety with lead tetraacetate in benzene, and the structure of angeloylgomisin Q. Chem. Pharm. Bull. 1981, 29, 2893–2898. [Google Scholar] [CrossRef] [Green Version]
  28. Chen, Y.G.; Qin, G.W.; Xie, Y.Y. 13C NMR spectroscopic characteristics of dibenzocyclooctadiene lignans from plants of Schisandraceae. Chem. Res. 2001, 12, 55–59. [Google Scholar]
  29. Chen, H.Y.; Zhou, C.X.; Yao, W.; Wang, L.W.; Dou, H.; Dong, X.W.; Zhao, Y. An NMR study of two lignans isolated from Schisandra Chinensis. Chin. J. Magn. Reson. 2005, 22, 43–54. [Google Scholar]
  30. Ikeya, Y.; Taguchi, H.; Yosioka, I.; Kobayashi, H. The constituents of Schizandra chinensis Baill. VI. 13 C NMR magnetic resonance spectroscopy of dibenzocyclooctadiene lignans. Chem. Pharm. Bull. 1980, 28, 2414–2421. [Google Scholar] [CrossRef]
  31. Tigloylgomisin, H.; Ikeya, Y.; Taguchi, H.; Yosioka, I.; Kobayashi, H. The constituents of Schizandra chinensis Baill. The structures of three new lignans, angeloylgomisin H, tigloylgomisin H and benzoygomisin H, and the absolute structure of schizandrin. Chem. Pharm. Bull. 1978, 26, 328–331. [Google Scholar]
  32. Wang, H.J.; Chen, Y.Y. Studies of lignans from Schisandra rubriflora Rhed et Wils. Acta Pharm. Sin. 1985, 20, 832–841. [Google Scholar]
  33. Tan, R.; Li, L.N.; Fang, Q.C. Studies on the chemical constituents of Kadsura longipedunculata: Isolation and structure elucidation of five new ligans. Planta Med. 1984, 50, 414–417. [Google Scholar]
  34. Zhang, M.X.; Huang, G.Y.; Bai, Y.Q.; Li, H.; Yang, B. Research advances in chemical constituents and hepatoprotective effect of Schisandrae Sphenantherae Fructus and Schisandrae Chinensis Fructus. Chin. J. Chin. Mater. Med. 2021, 46, 1017–1025. [Google Scholar]
  35. Wu, X.; Zhang, H.; Fan, S.; Zhang, Y.; Yang, Z.; Fan, S.; Zhuang, P.; Zhang, Y. Quality markers based on biological activity: A new strategy for the quality control of traditional Chinese medicine. Phytomedicine 2018, 44, 103–108. [Google Scholar] [CrossRef] [PubMed]
  36. He, T.; Wang, Q.Y.; Shi, J.Z.; Fan, T.Y.; Yan, C.; Huang, L.J.; Liu, S.; Hao, X.J.; Mu, S.Z. Synthesis and the hepatoprotective activity of dibenzocyclooctadiene lignan derivatives. Bioorg. Med. Chem. Lett. 2014, 24, 1808–1811. [Google Scholar] [CrossRef]
Figure 1. The characteristic HPLC chromatogram of TDL from S. chinensis.
Molecules 26 06554 g001
Figure 2. The common peaks of characteristic HPLC chromatogram of TDL from S. chinensis.
Molecules 26 06554 g002
Figure 3. Structures of compounds 113 from total dibenzocyclooctadiene lignans of S. chinensis.
Molecules 26 06554 g003
Figure 4. Hierarchical cluster analysis of S. chinensis.
Molecules 26 06554 g004
Figure 5. The HPLC chromatogram of mixed reference substances.
Molecules 26 06554 g005
Table 1. The average peak area and relative retention time of the twenty-three common characteristic peaks.
PeaksRetention Time/minAreas
S1S2S3S4S5S6S7S8S9S10S11
111.15124.2121.9135.0118.1125.4130.2130.3119.4111.0122.6128.0
212.745.7445.3427.5306.8147.6296.4495.4925.9437.1486.3816.959
313.9010.747.49911.349.6079.08110.649.8768.2229.3158.15910.49
414.9236.6325.6839.9334.7135.2338.5234.6835.6638.0629.8235.92
518.264.2293.9604.9233.8494.2064.5864.3873.9322.0154.3504.338
618.886.1824.9995.9295.0185.5446.4795.7225.0626.6355.0475.995
721.8224.2220.2325.5521.6321.5923.7723.3822.6221.5422.6725.60
826.255.4755.0424.6114.1094.6204.6684.2184.5434.6144.8564.916
928.914.4042.9584.3603.7564.1324.4273.6613.9084.5283.4494.268
1032.2011.7513.039.7458.0908.9729.53612.088.0557.51010.8312.23
1133.283.3733.3063.1763.8603.0954.6503.3962.8453.0952.7633.369
1234.0420.3220.7519.8717.1519.7420.5421.1718.7618.4319.9021.60
1336.143.3826.2333.4452.5442.8032.9345.4332.5472.2282.8994.366
1438.546.2993.3936.5705.4765.7204.3674.1506.2936.4585.0536.923
1540.893.0013.0003.4783.1583.1503.1713.3293.5143.6082.8603.638
1641.882.8682.7632.9672.8312.9333.3032.9003.2683.8822.6923.193
1744.0826.2837.2225.0550.4223.6328.9832.9621.7919.1029.0432.65
1845.432.8202.0433.2452.0492.2112.4053.2243.5193.7252.2693.418
1946.078.1924.6377.9455.8085.4705.7687.5917.2957.5205.2628.023
2048.3813.4411.4814.3413.0812.2115.0315.2712.9513.9712.3015.67
2150.0651.7041.9853.9153.8951.5356.5855.7448.1949.7549.7455.27
2252.262.8484.4352.8572.7212.8613.1343.6392.9542.9222.9793.686
2354.014.3173.0004.8074.1543.7094.8204.1213.9124.4663.5234.828
Table 2. The protective activity of different concentrations of sample S11 against CCl4-induced liver injury ( x ¯ ± s, n = 3).
GroupThe OD ValueCell Survival Rate/%
Blank0.615 ± 0.024100.00 ± 0.00
Model0.424 ± 0.03068.87 ± 4.88
DDB a0.446 ± 0.09172.54 ± 14.81
S11–1 (0.01 mg/mL)0.437 ± 0.01271.08 ± 3.91
S11–2 (0.05 mg/mL)0.466 ± 0.02675.76 ± 4.23
S11–3 (0.10 mg/mL)0.439 ± 0.02271.30 ± 3.58
a DDB is the positive group.
Table 3. The protective activity of the eleven batches test samples against CCl4-induced liver injury ( x ¯ ± s, n = 3).
GroupThe OD ValueCell Survival Rate/%
Blank0.696 ± 0.035100.00 ± 0.00
Model0.430 ± 0.02461.80 ± 3.45
DDB0.460 ± 0.02266.06 ± 3.16
S10.473 ± 0.02268.01 ± 3.16
S20.438 ± 0.02662.93 ± 3.74
S30.441 ± 0.18063.34 ± 11.49
S40.493 ± 0.02370.83 ± 3.30
S50.460 ± 0.01866.03 ± 2.59
S60.481 ± 0.08269.11 ± 11.78
S70.470 ± 0.02767.56 ± 3.88
S80.440 ± 0.12963.27 ± 18.53
S90.436 ± 0.03562.59 ± 5.03
S100.432 ± 0.03562.07 ± 5.03
S110.473 ± 0.02667.93 ± 3.74
Note: The concentration of DDB and samples S1–S11 was 0.05 mg/mL.
Table 4. The similarity of the eleven batches of TDL samples.
S1S2S3S4S5S6S7S8S9S10S11Reference
S110.9890.9980.9830.9980.9980.9970.9980.9970.9970.9980.998
S20.98910.9870.9870.9890.9890.9930.9850.9770.9930.9910.991
S30.9980.98710.980.9990.9980.9960.9990.9960.9960.9970.998
S40.9830.9870.9810.9820.9870.9880.9790.9760.9870.9880.988
S50.9980.9890.9990.98210.9990.9960.9980.9960.9980.9960.999
S60.9980.9890.9980.9870.99910.9980.9970.9960.9980.9980.999
S70.9970.9930.9960.9880.9960.99810.9960.9930.9980.9990.998
S80.9980.9850.9990.9790.9980.9970.99610.9980.9970.9970.998
S90.9970.9770.9960.9760.9960.9960.9930.99810.9930.9940.995
S100.9970.9930.9960.9870.9980.9980.9980.9970.99310.9980.999
S110.9980.9910.9970.9880.9960.9980.9990.9970.9940.99810.998
Reference0.9980.9910.9980.9880.9990.9990.9980.9980.9950.9990.9981
Table 5. The identified common peaks of characteristic chromatogram.
PeaksCompoundRetention Time/minMolecular WeightRelative Peak Areas/%
1schisandrin (11)11.28743230.25
3gomisin J (8)14.1033882.25
4schisandrol B (7)15.1304167.51
5tigloylgomisin H (10)18.5435000.99
8angeloylgomisin Q (6)26.6905300.68
9gomisin G (4)29.3675360.97
11schisantherin A (5)33.6675360.90
12schisantherin B (9)34.4135144.57
13schisanhenol (12)36.4774021.29
15schisanhenol B (13)41.1703860.89
17schisandrin A (3)44.3404167.01
21schisandrin B (2)50.33340012.14
23schisandrin C (1)54.2973841.10
Table 6. Correlation coefficients of common peaks of partial least squares analysis.
PeaksCoefficientsPeaksCoefficientsPeaksCoefficients
1−0.28890.588170.347
2−0.309100.06718−0.394
3−0.064110.525190.281
40.275120.37820−0.008
50.104130.086210.705
6−0.254140.490220.028
7−0.580150.20423−0.375
8−0.01216−0.206
Table 7. The protective activity of schisandrin B (2), schisandrin A (3) and schisandrol B (7) against CCl4-induced liver injury ( x ¯ ± s, n = 3).
GroupThe OD ValueCell Survival Rate/%
Blank0.562 ± 0.019100.00 ± 0.00
Model0.263 ± 0.06747.57 ± 4.37
DDB0.332 ± 0.05155.72 ± 4.71
Combination 10.365 ± 0.06361.32 ± 6.97
Combination 20.217 ± 0.06035.44 ± 7.24
Combination 30.390 ± 0.06364.36 ± 6.85
Combination 40.129 ± 0.03921.44 ± 4.68
schisandrin B (2)0.096 ± 0.04415.78 ± 5.99
schisandrin A (3)0.114 ± 0.04318.89 ± 5.63
schisandrol B (7)0.139 ± 0.05422.99 ± 7.12
Note: “Combination 1” is schisandrin B (2):schisandrin A (3):schisandrol B (7) = 17:16:11, “Combination 2” is schisandrin B (2):schisandrin A (3) = 17:16, “Combination 3” is schisandrin B (2):schisandrol B (7) = 17:11, “Combination 4” is schisandrin A (3):schisandrol B (7) = 16:11.
Table 8. Sample information.
SampleOriginSampleOrigin
S1Heilongjiang, ChinaS7Hebei 2, China
S2Shanxi, ChinaS8Shaanxi, China
S3Inner Mongolia, ChinaS9Ningxia, China
S4Liaoning, ChinaS10Shandong, China
S5Jilin, ChinaS11Gansu, China
S6Hebei 1, China
Publisher’s Note: MDPI stays neutral with regard to jurisdictional claims in published maps and institutional affiliations.

