Article

Rapid Structure Determination of Bioactive 4″-Tetrahydrofurfuryl Macrozone Reaction Mixture Components by LC-SPE/Cryo NMR and MS

1
Department of Chemistry, Faculty of Natural Sciences, University of Zagreb, Horvatovac 102a, HR-10000 Zagreb, Croatia
2
Ruđer Bošković Institute, Bijenička cesta 54, HR-10000 Zagreb, Croatia
*
Author to whom correspondence should be addressed.
Molecules 2021, 26(20), 6316; https://doi.org/10.3390/molecules26206316
Submission received: 9 September 2021 / Revised: 14 October 2021 / Accepted: 18 October 2021 / Published: 19 October 2021
(This article belongs to the Special Issue Spectroscopic and Spectrometric Techniques for Structural Analysis)

Abstract

:
LC-SPE/cryo NMR and MS methodologies have been developed and employed for a rapid structure determination of 4″-tetrahydrofurfuryl macrozone reaction mixture components. Macrozones, novel conjugates of azithromycin, and thiosemicarbazones have shown very good in vitro antibacterial activities against susceptible and some resistant bacterial strains and are promising agents for further development. The post-column multiple trapping of the chromatographically separated reaction mixture components on the SPE cartridges increased the sensitivity and together with cryogenically cooled NMR probe made it possible to identify and structurally characterize main 4″-tetrahydrofurfuryl macrozone reaction mixture compounds including those present at very low concentration level. This approach has several advantages over a classical off-line procedure, efficiency and low solvent consumption being the two most important ones. All identified components were process-related. It has been demonstrated that two different kinds of compounds with respect to structure were identified, i.e., macrolide-related and thiosemicarbazone-related ones. This methodology can serve as a platform for reliable and effective macrolides reaction components structure profiling, serving as both isolation and identification tools.

1. Introduction

Azithromycin belongs to second generation macrolide antibiotics with a broad spectrum of antibacterial activity [1,2]. It is very efficient and well-tolerated anti-infective agent widely prescribed for treating upper and lower respiratory tract infections. Azithromycin is a semi-synthetic derivative of 14-membered macrolide erythromycin, but compared to erythromycin, azithromycin possesses improved pharmacokinetics, with high cell accumulation, metabolic stability, and tolerability. It shows beneficial effects in chronic inflammatory diseases and malaria as well. As an antibiotic it shares the same mode of action as other 14- and 16-membered macrolides [3] by binding to the bacterial ribosomal 23S rRNA in domain V at the peptidyl transferase region and sterically blocking the nascent peptide exit tunnel thus inhibiting the bacterial protein synthesis. Structurally, azithromycin consists of 15-membered macrocyclic lactone ring to which desosamine and cladinose sugar units are attached at positions 3 and 5, respectively (Scheme 1). Crystallography [4,5,6] and NMR spectroscopy [7,8,9,10] have revealed key structural features of macrolide antibiotic interactions with ribosome and other macromolecular receptors that serve as platform for design of novel bioactive macrolide compounds.
However, rapidly emerging bacterial resistance to existing antibiotics including macrolides in the last couple of decades presents a serious threat to human health and novel bioactive compounds are urgently needed. There are two main mechanisms by which bacteria resist macrolides a) by modifications of binding sites and b) by efflux pump activity [2,11].
We have recently designed and prepared novel conjugates of azithromycin, the macrozones, in order to overcome the bacterial resistance mechanisms [12]. Some azithromycin conjugates have already proven useful to treat pathogenic bacteria [13,14,15,16,17,18,19,20,21,22,23,24]. The macrozones, hybrid compounds of azithromycin and thiosemicarbazones, have shown excellent antibacterial activities against susceptible and resistant strains [12].
Here we present the utility of using LC-SPE/cryo-NMR and MS approach for fast and efficient characterization of 4″-tetrahydrofurfuryl macrozone reaction mixture to get insights into reaction components identity and structure. Modern and sophisticated hyphenated techniques such as LC-NMR, LC-MS and others have frequently been used to analyze complex mixtures without initial separation of the constituents that have enabled rapid screening of pharmaceutical and biological samples [25,26,27,28,29,30,31,32,33]. Initial sensitivity limitations of LC-NMR have in the past two decades been largely alleviated by technological developments that include cryo-platforms, capillary NMR with micro-coil probes and coupling of solid phase extraction system (SPE) into an LC-SPE-NMR set up [30,34,35,36,37,38]. The latter methodology has been widely used for analyzing natural products, metabolites and drug impurities but has less frequently been applied for monitoring chemical reactions and structural identification of the reaction products [39,40,41,42,43]. In the present work, we applied LC-SPE/cryo-NMR in combination with MS for rapid identification and structural characterization of bioactive macrozone reaction components.

2. Results and Discussion

The preparation of amino propyl derivative of azithromycin 1a and tetrahydrofurfuryl thiosemicarbazone acid 2 were reported in the previous paper [12]. The macrozone 3a (Figure 1) showed very good in vitro antibacterial activities against susceptible bacterial strains such as S. pneumoniae and S. pyogenes strains comparable to that of azithromycin. It exhibited four times better activity than azithromycin against efflux resistant S. pneumoniae and E. faecalis strains and also against efflux resistant S. aureus to which azithromycin is inactive. This compound shows potential for derivatizations to further improve activity against resistant bacteria.

2.1. Optimization of Chromatographic Separation

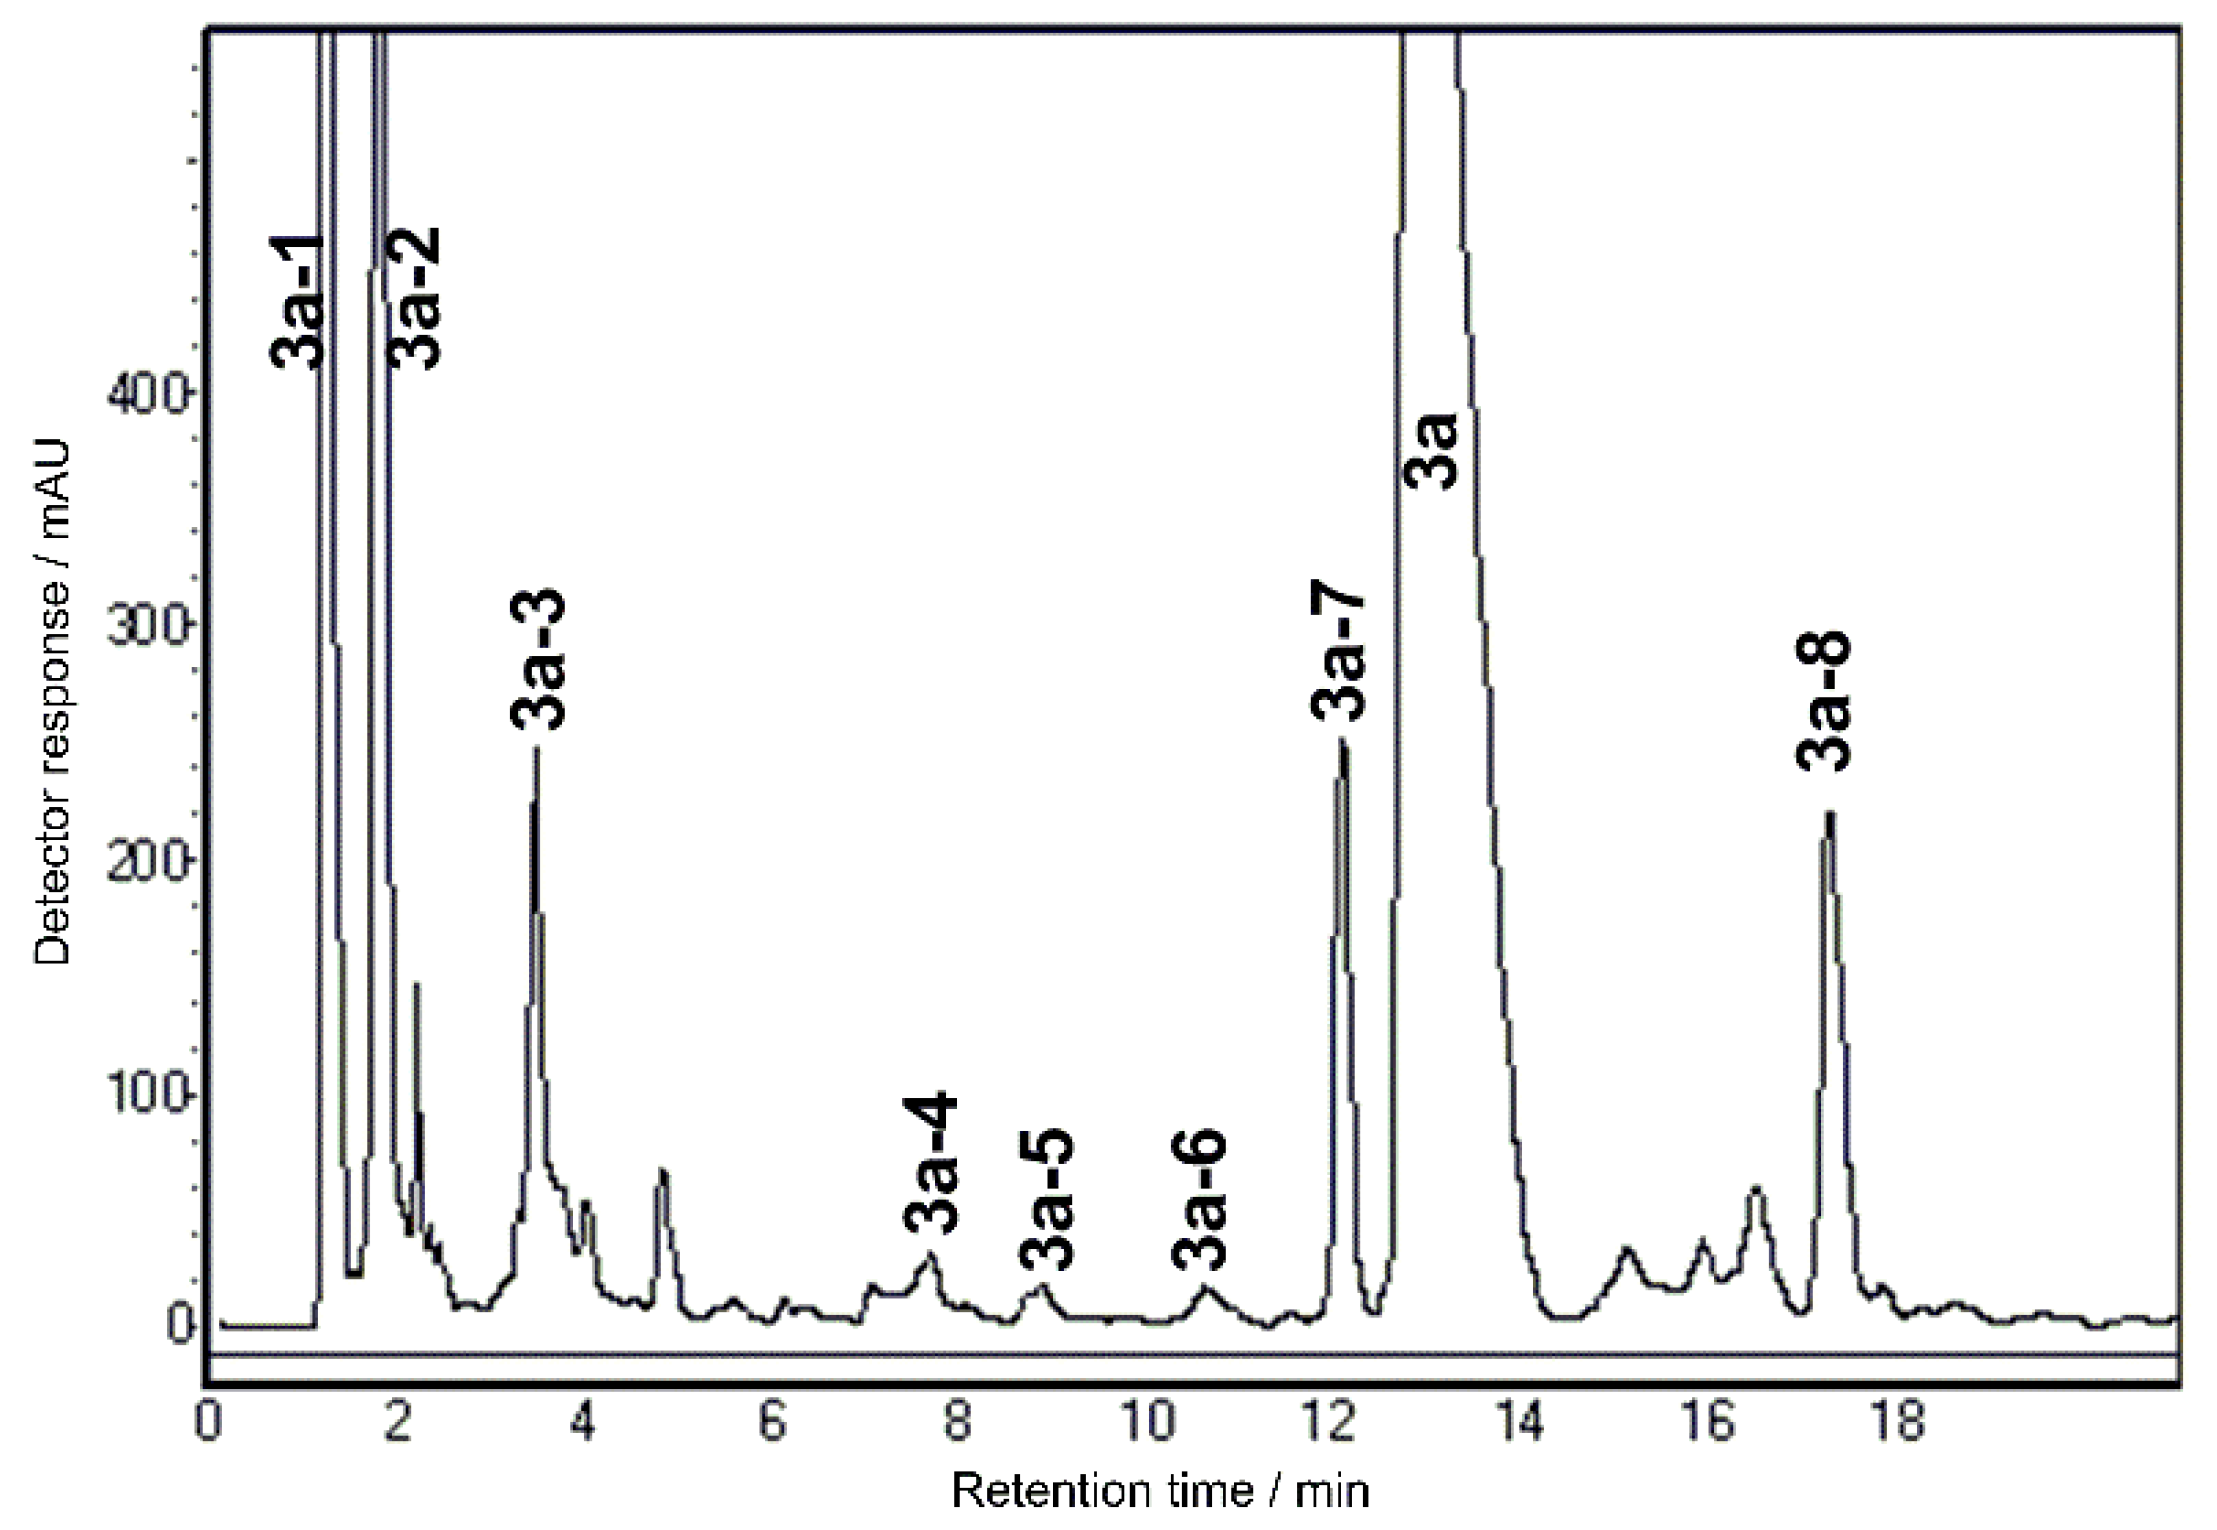
The first step in the analysis of the components present in the reaction mixture was to obtain chromatographic separation conditions that provide high quality and well-resolved chromatographic peaks. Optimised chromatographic separation of the individual reaction mixture components was achieved on Waters XBridge Phenyl column and Poroshell 120 EC-C18 column, respectively. Since retention times of the chromatographic peaks were quite shorter on a phenyl column and peak resolution was satisfying for LC-SPE trapping, Waters XBridge Phenyl column was used for further analysis. The chromatogram is displayed in Figure 2.

2.2. SPE Preconcentration

In order to obtain a sufficient amount of a compound for 2D NMR experiments, it is necessary to obtain high extraction efficiency of the individual peaks on SPE-cartridges. Therefore, extraction efficiency of macrozone reaction mixture components on different SPE-stationary phases was investigated. For that purpose, HySphere method development cartridge tray, consisted of C2, C8, CN, Resin SH, Resin GP, MM cation and MM anion SPE-stationary phases, was used. Compounds were trapped several times on each SPE-cartridge at the make-up flow rate of 3 mL min−1. After the elution of samples into 3 mm NMR tubes, 1H NMR spectra were recorded and signal-to-noise ratio was calculated. Results showed that most of the reaction mixture components were well retained at C18 SPE-cartridges. Furthermore, the influence of make-up flow rate on extraction efficiency was also evaluated. Make-up flow rate of 1.5 mL min−1 was optimal for the most cases, while more polar compounds were better retained on SPE-cartridges using the higher make-up flow rates (up to 3.0 mL min−1).

2.3. Identification of Components by Cryo NMR and MS

The main compound, the macrozone 3a, was readily identified at 13.2 min retention time with 34.6% content. Analysis of proton chemical shifts and correlation peaks in COSY, HSQC and HMBC spectra (Supplementary Material Figure S1a–d) confirmed the structure of 3a as shown in Figure 3. The assignments of proton and carbon chemical shifts are given in Table 1.
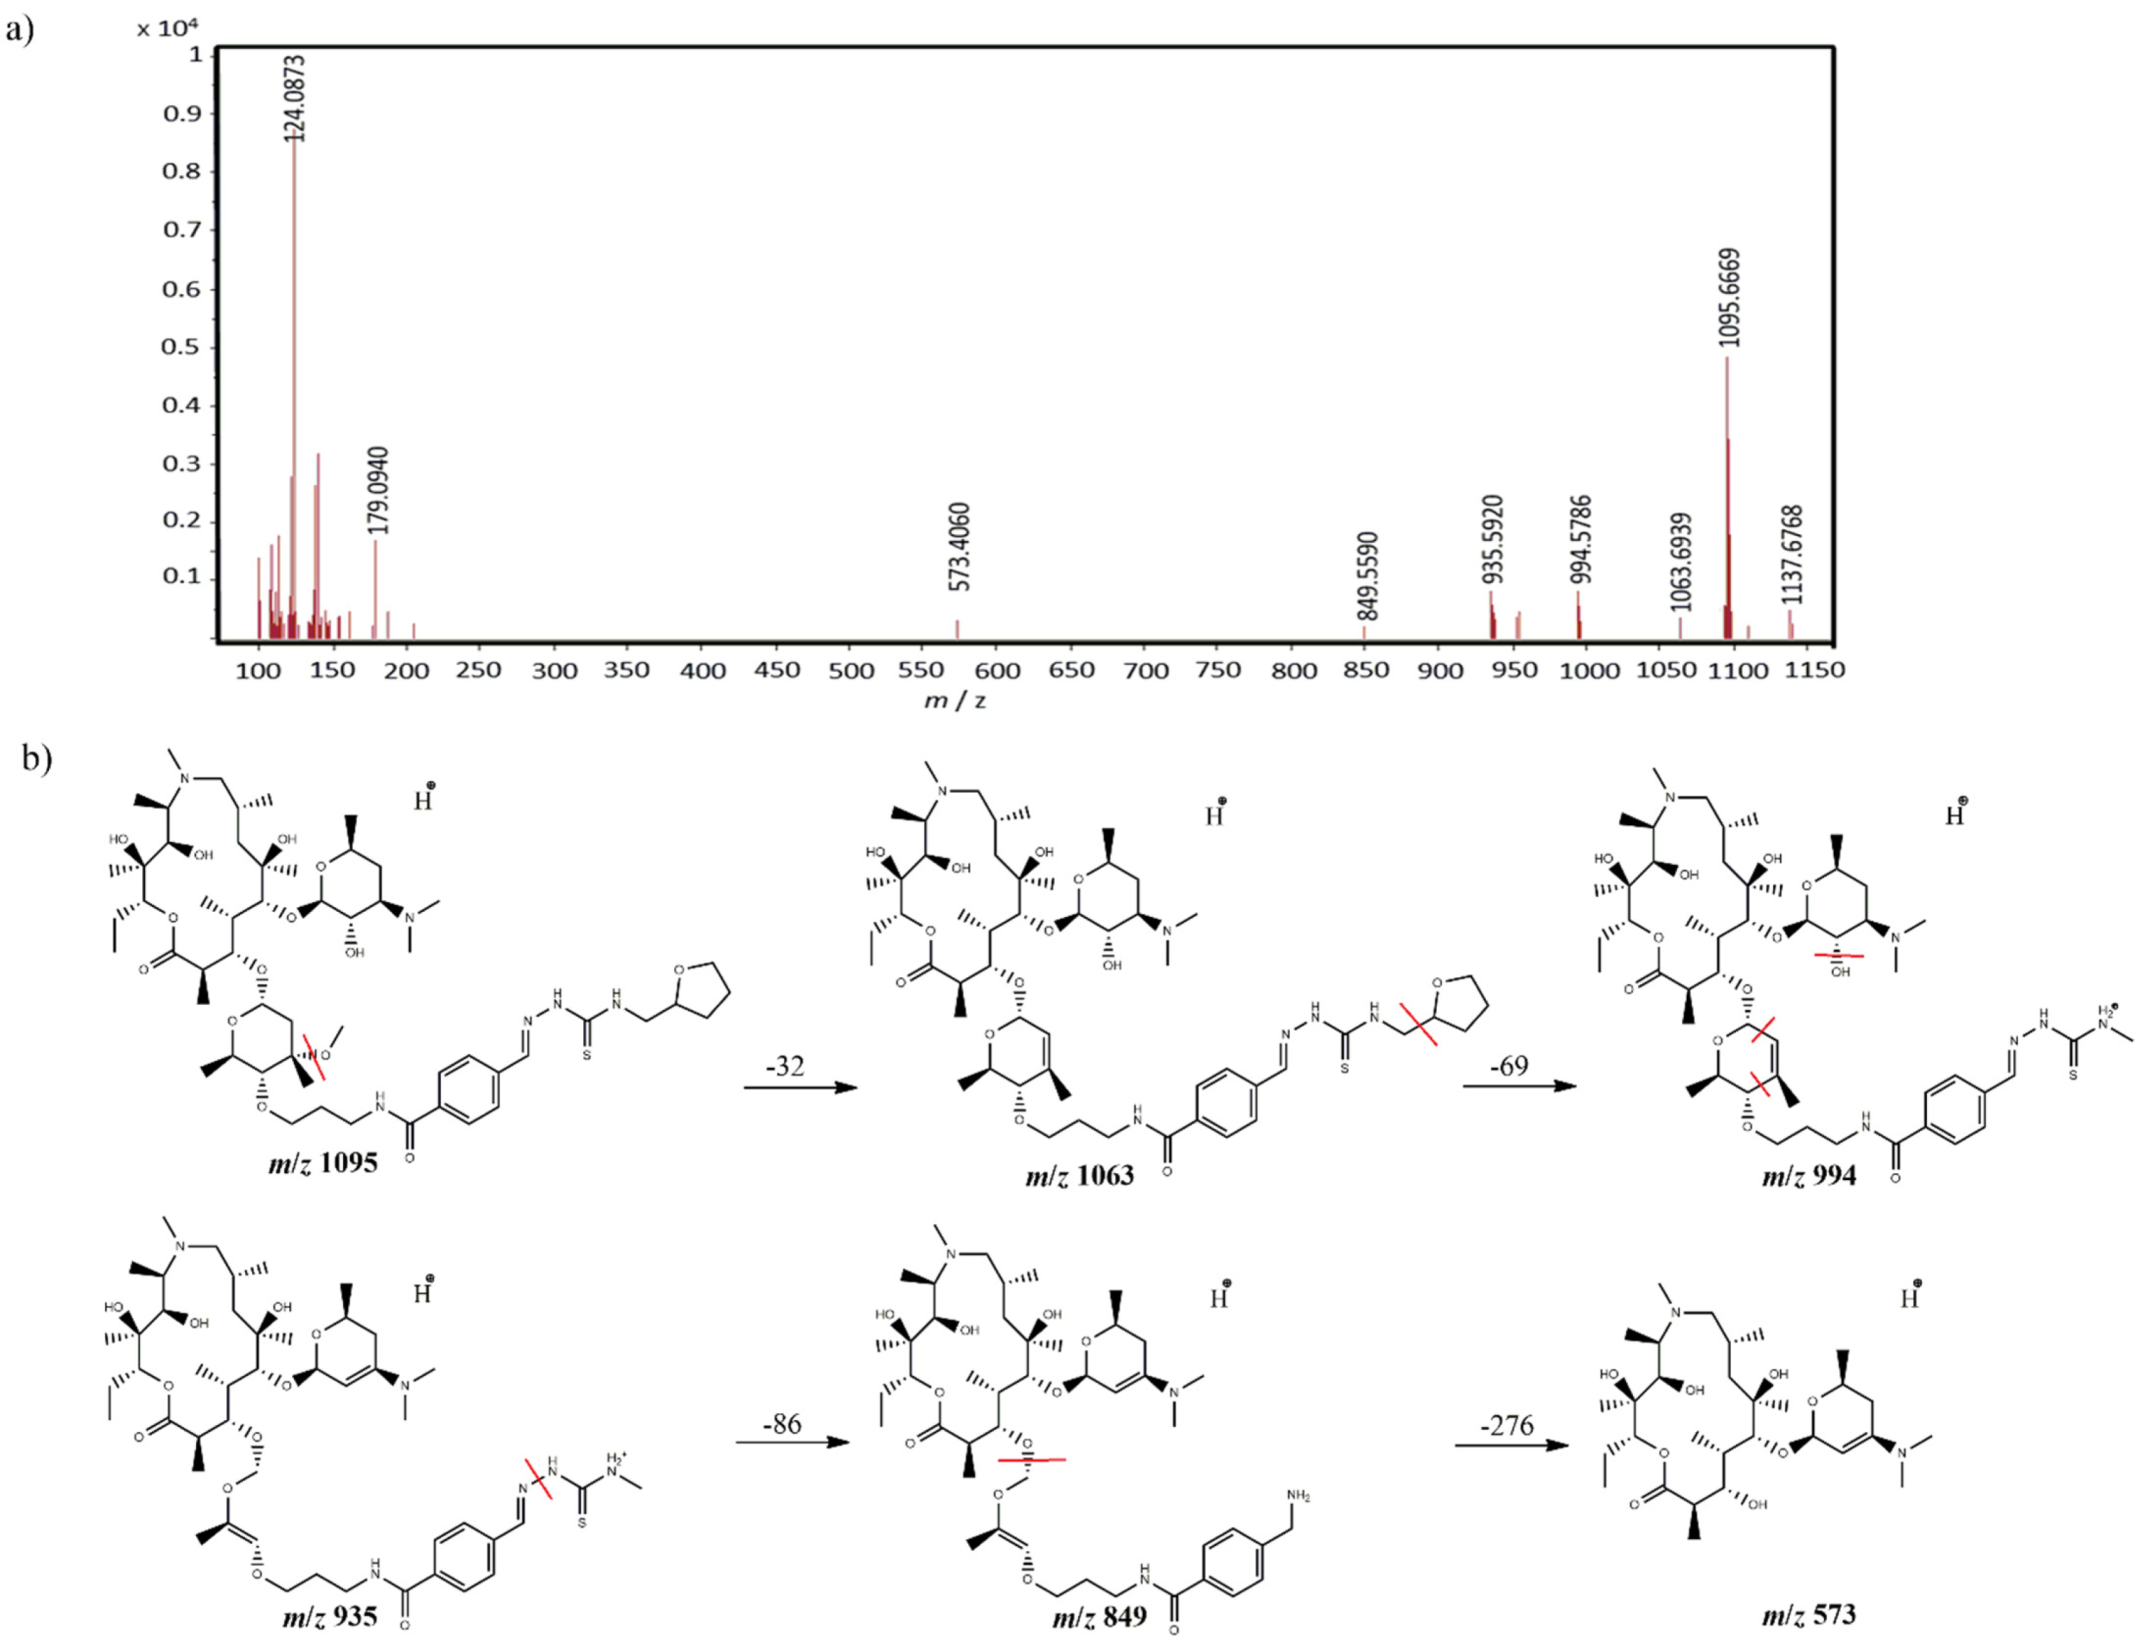
The molecular ion peak (m/z 1095.6) and the fragmentation pattern depicted in Figure 4 are in accordance with the proposed structure.
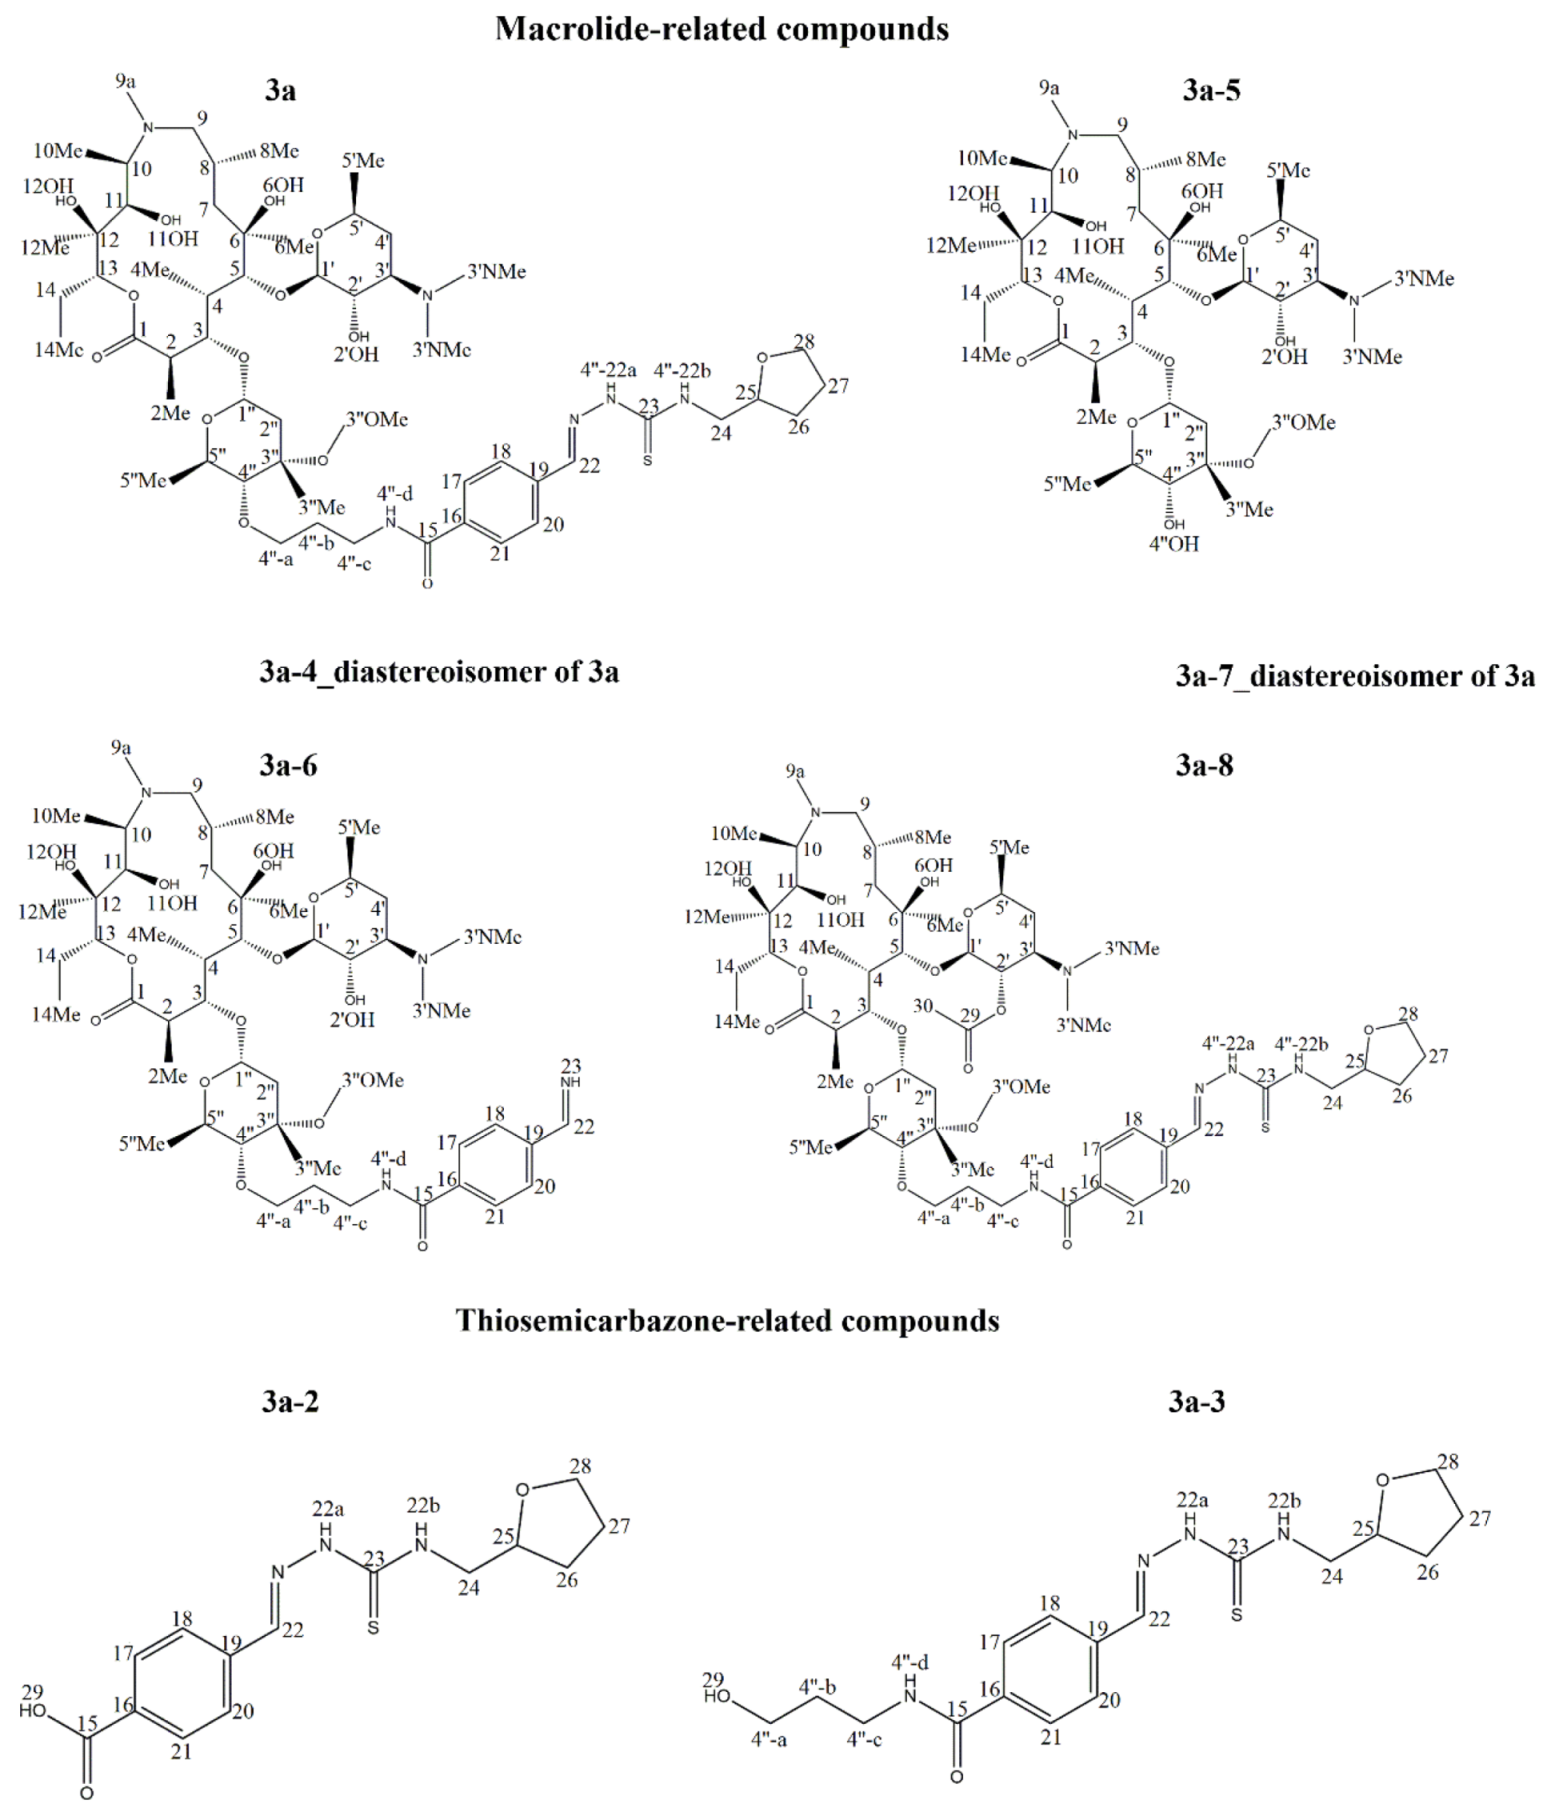
As can be seen in Figure 2 the reactant 2 and the carboxylic acid activation reagent HATU (hexafluorophosphate azabenzotriazole tetramethyl uronium) used in the reaction elute first (3a-1 and 3a-2 in the chromatogram, respectively), which is expected since those are the most polar components. NMR spectra of the compounds 3a-1 and 3a-2 are given in Supplementary (Figures S2 and S3). The proton and MS spectra of the compound 3a-3 with the peak area of 1.4% clearly shows that macrolactone ring and sugar units are missing and that this compound is related to thiosemicarbazone constituent. The molecular ion was identified at m/z 364.3 (Figure S4). Based on this data, we propose the structure as depicted in Figure 3. The reaction component 3a-4 with the content of 0.12% displayed the same molecular ion peak at m/z 1095.5 as the main compound reflecting the presence of a 3a diastereoisomer. This compound exhibits similar 1H (Figure S5) and MS patterns as the main compound confirming a diastereoisomeric structure. Even with using higher make-up flow rates, the final concentration was not sufficient for recording a reliable NOESY spectrum to possibly identify a stereoisomeric center.
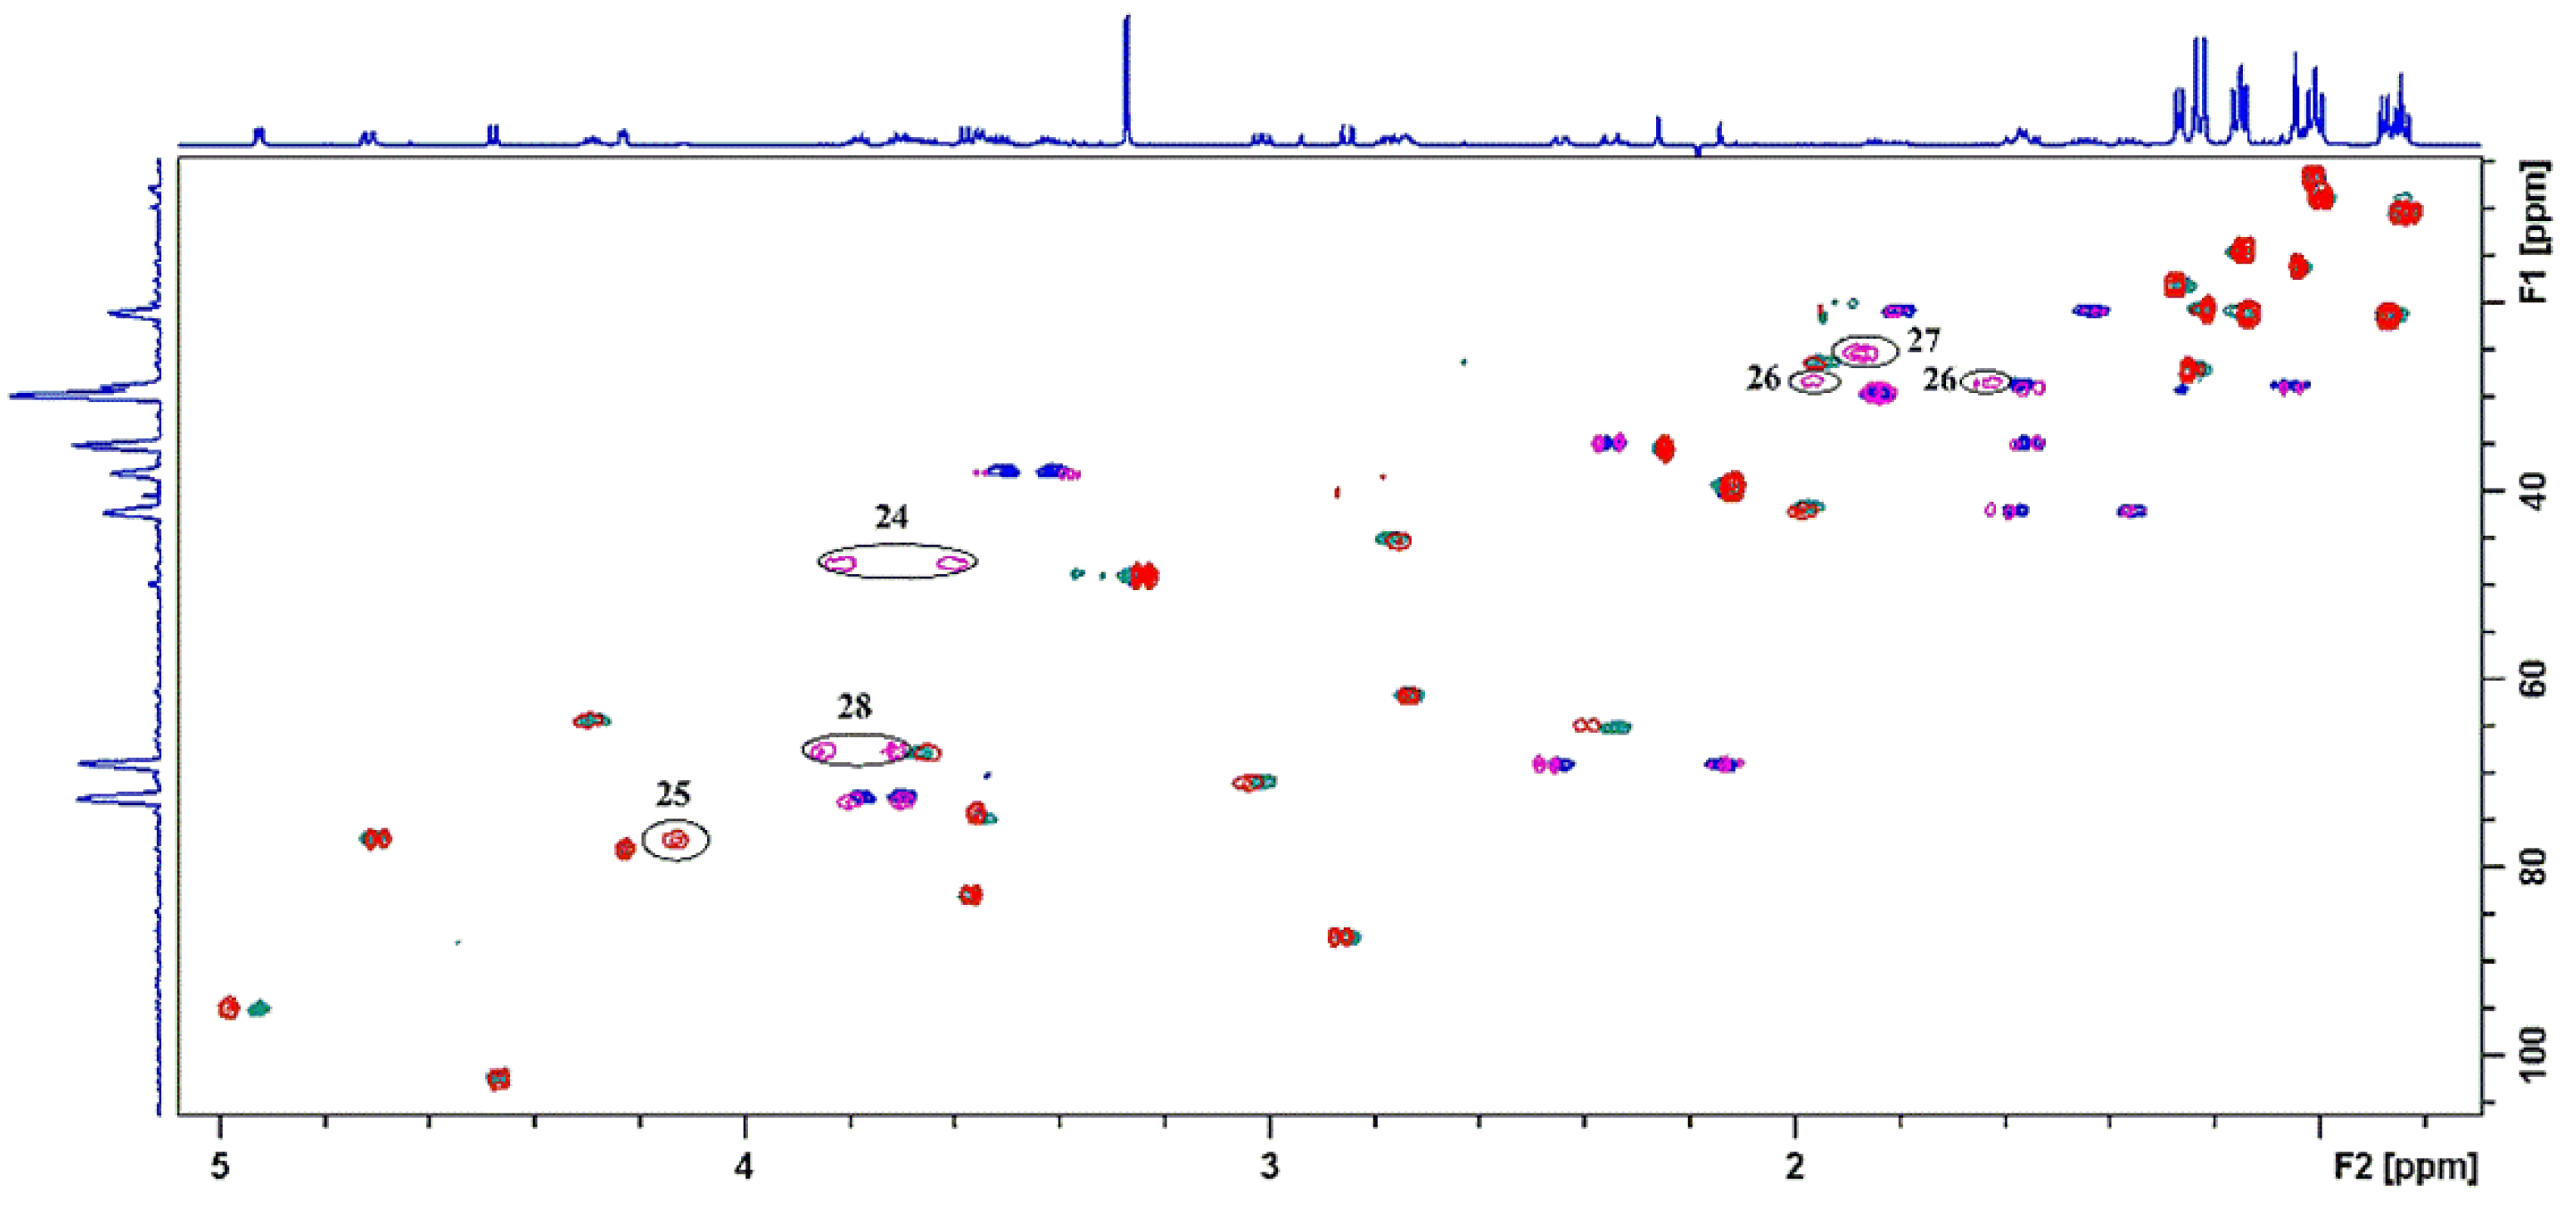
A low-level component 3a-5, present with the amount of only 0.3% at the retention time of 9.0 minutes was unambiguously identified as azithromycin, by its 1H, COSY and MS spectra (Figure S6). A close inspection of 1H spectrum and connectivities in COSY, HSQC and HMBC spectra of 3a-6 (0.59%, 10.6 min) revealed that thioureido-furfuryl moiety was not present in the molecule. In Figure 5, it is clearly seen from the overlapped HSQC spectra that cross peaks (circled in black) indicative of thioureido-furfuryl side chain present in the spectrum of 3a are missing in the spectrum of 3a-6. The molecular ion peak observed at m/z 938.7 (Figure S7d) corroborates this observation. All other cross peaks characteristic of the main compound were present in the spectra. These findings pointed toward the structure depicted in Figure 3.
The component 3a-7 present at 2.5% level at the retention of 12.1 min displayed the same molecular ion m/z as the main compound 3a (m/z 1095.6) implying the presence of an additional diastereoisomer. Analysis of NMR spectra has led to straightforward assignments of proton and carbon chemical shifts similar to 3a. (Table S1, Figure S8a–e). However, the trapping efficiency was not good enough, and the final concentration was again too low for unambiguous NOESY analysis.
The analysis of 1H chemical shifts and COSY, HSQC, and HMBC cross peaks of 3a-8 (4.4%, 17.3 min) revealed the same patterns found for 3a except for an additional methyl, H30, and carbonyl group C29 (Figure 3) observed at 39.5 and 175.1 ppm, respectively, and displaying a common HMBC correlation peak. Other HMBC correlations unambigously pointed toward the 2′-methyl ester of 3a whose structure is displayed in Figure 3. This compound is an intermediate in the synthesis of amino propyl derivative 1a [12]. The spectra are given in Supplementary Materials (Figure S9a–d).
In conclusion, we have shown here that LC-SPE/cryo NMR methodology in combination with MS can successfully be applied for rapid screening of bioactive macrozone reaction mixture and straightforward identification and structure characterization of the main components.

3. Materials and Methods

3.1. Reagents

4″-tetrahydrofurfuryl macrozone was synthesized in our laboratory according to the procedure reported in a previously published article [12]. HPLC-grade acetonitrile was purchased from Fisher Scientific (Loughborough, UK). HPLC-grade ammonium bicarbonate was obtained from Sigma-Aldrich (St. Louis, MO, USA). Deionized water was produced by Millipore Milli-Q Advantage A10 purification system (Molsheim, France). MS-grade acetonitrile was purchased from Carlo Erba (Val de Reuil, France). Deuterated acetonitrile (99.8%-D) was procured from Euriso-Top SAS (Saint-Aubin Cedex, France).

3.2. Sample Preparation

The reaction mixture of 4″-tetrahydrofurfuryl-macrozone (3a) was evaporated to dryness and stored at 4 °C. Prior to LC-SPE analysis samples were dissolved in acetonitrile at concentration of 14.3 mg mL−1. For the MS analysis dry extracts of isolated compounds were prepared at concentration ranging from 0.11 µg mL−1 to 0.52 µg mL−1 by dissolving in MS-grade acetonitrile.

3.3. Liquid Chromatography

Chromatographic analysis was performed on Agilent 1260 Infinity HPLC system consisting of quaternary pump G1311B, an autosampler G1329B, thermostated column compartment G1316A and a photo diode array detector G1315D. The chromatographic data were collected by OpenLab CDS Chemstation A.01.08.108. To optimize chromatographic separation of macrozone reaction mixture components several C18 chromatographic columns and phenyl column were used, including the Ascentis Express C18 (100 × 4.6 mm; 2.7 µm, Sigma-Aldrich, St. Louis, MO, USA), Kinetex C18 (150 × 4.6 mm; 5 µm, Phenomenex, Torrance, CA, USA), Zorbax SB-C18 (150 × 4.6 mm; 3.5 µm, Agilent, Santa Clara, CA, USA), Poroshell 120 EC-C18 (250 × 4.6 mm; 4 µm, Agilent, USA), Hypersil ODS (150 × 4.6 mm; 5 µm, Agilent, Santa Clara, CA, USA), XBridge C18 (150 × 4.6 mm; 3.5 µm, Waters Corporation, Milford, MA, USA) and XBridge Phenyl (150 × 4.6 mm; 3.5 µm, Waters Corporation, Milford, MA, USA). The best chromatographic separation was achieved on Waters XBridge Phenyl chromatographic column at 25 °C using a gradient elution with mobile phase consisting of (A) acetonitrile and (B) ammonium bicarbonate solution (10 mM) corrected to pH 10 with ammonia solution. Gradient elution program with a flow rate of 1.000 ml min−1 was as follows: 0–20 min (50% A–68% A), 20‒21 min (68% A–100% A), 21–30 min (100% A), 30‒30.1 min (100% A–50% A), 30.1–35 min (50% A). Injection volume was 15 µL and detection wavelength was 210 nm.

3.4. On-line HPLC-SPE

Post-column solid-phase extraction of the macrozone reaction mixture components was performed on Prospekt 2 SPE unit (Spark Holland, Netherland). Analytes were trapped on HySphere C18 HD SPE-cartridges (2 mm × 10 mm) using the multi-trapping mode. Threshold absorbance levels for analyte trapping were set at 210 nm. Sample injection volume was 15 µL. The post-column diluent (make-up solvent) was solution B with a flow rate of 1.5 ml min−1. After the peak trapping, SPE-cartridges were dried in nitrogen stream for 59 min. Components were eluted from SPE-cartridges to 3 mm NMR tubes with 150 µL of acetonitrile-d3 and NMR spectra were recorded. LC-SPE data were collected and analyzed with HyStar 3.2 software.

3.5. NMR Spectroscopy

NMR spectra with NOESY-type solvent suppression module were recorded on Bruker Avance III HD 400 MHz and Bruker Avance NEO 600 MHz spectrometers equipped with broadband observed (BBO) Prodigy and inverse TCI Prodigy cryoprobes, respectively, and z-gradient accessories. After LC separation and peak trapping on the SPE unit, the separated components were dissolved in acetonitrile-d3 and measured in 3 mm tubes with MATCH inserts for adapting the tubes to 5 mm Bruker spinners. All experiments were carried out at 298 K using TMS as an internal standard.
Proton spectra were measured with 128–512 scans, depending on the concentration of extracted components. Spectral width was 11,904 Hz and a digital resolution was 1.45 Hz per point. In the gCOSY experiment, 2048 points in the f2 dimension and 256 increments in the f1 dimension were used. For each increment, 6–32 scans and the spectral width of 9615 Hz were applied. Digital resolution was 9.39 Hz and 75.12 Hz per point in f2 and f1 dimensions, respectively.
The gHSQC spectra were acquired with 20–150 scans. In gHSQC, experiment spectral width was 9615 Hz in f2 and 27,166 Hz in f1 dimension. 4K data points were applied in the time domain and for each data set 256 increments were collected for gHSQC, as well as for gHMBC spectra. The gHMBC spectra were acquired with 40–160 scans using the spectral width of 9090 Hz in f2 domain and 33,204 Hz in f1 domain.

3.6. MS Analysis

Mass spectra were recorded on an amaZon ETD ion trap mass spectrometer (Bruker Daltonik, Bremen, Germany) equipped with the standard ESI ion source. Nitrogen was used as a drying and nebulizing gas. Nebulizer pressure was 8 psi, drying gas flow rate was 5 L min−1, drying gas temperature was 200 °C. For the mass spectrometry analysis dry extracts of LC isolated fractions were prepared at a concentration ranging from 0.11 mg mL−1 to 0.52 mg mL−1 by dissolving them in 1 mL of MS-grade acetonitrile. The samples were further diluted 1000 times in electrospray solution (acetonitrile/water with 0.1% formic acid, 50/50, v:v). Prepared samples were infused into the ESI source of the mass spectrometer by a syringe pump at a flow rate of 1 μL min−1. The mass spectrometer was operated in positive polarity mode, the potential on the capillary cap was 4500 V. Helium was used as the collision gas. Full scan ESI-MS spectra were obtained in a positive ion acquisition mode ranging from 100 m/z to 1500 m/z. Tandem mass spectra were recorded by performing collision-induced dissociation (CID) type of fragmentation. Parent ions are isolated in ±2 Da wide m/z window and fragmented by applying 0.5 V of collision energy.

Supplementary Materials

The following are available online, Figure S1: (a) proton spectrum, (b) COSY spectrum, (c) HSQC spectrum and (d) HMBC spectrum of the 4″-tetrahydrofurfuryl macrozone 3a; Figure S2: (a) proton spectrum, (b) COSY spectrum, (c) HSQC spectrum and (d) HMBC spectrum of the compound 3a-1 (HATU).; Figure S3: (a) proton spectrum, (b) COSY spectrum, (c) HSQC spectrum and (d) HMBC spectrum of the compound 3a-2 (reactant 2).; Figure S4: (a) proton spectrum of the 3a-3 (signals from solvent impurities are marked with asterisk* and signals from ethanol are marked with double asterisk**), (b) MS spectrum of the 3a-3 and (c) overlaid proton spectra of the 3a, 3a-2 and 3a-3; Figure S5: (a) overlaid proton spectra of the compounds 3a and 3a-4 (signals from solvent impurities are marked with asterisk*), (b) COSY spectrum and (c) MS spectrum of the compound 3a-4.; Figure S6. (a) proton spectrum of the compound 3a-5, (b) COSY spectrum of the compound 3a-5 and (c) MS spectrum of the compound 3a-5, Figure S7. (a) proton spectrum, (b) HSQC spectrum, (c) HMBC spectrum and (d) MS spectrum of the compound 3a-6, Figure S8. (a) overlaid proton spectra of the 3a-7 and 3a, (b) COSY spectrum, (c) overlaid HSQC spectrum of the 3a-7 and 3a (blue and green contours belong to the 3a-7, while red and pink contours belong to the 3a; signals from unknown impurities are marked with asterisk*), (d) HMBC spectrum and (e) MS spectrum of the compound 3a-7, Figure S9. (a) proton spectrum, (b) COSY spectrum, (c) HSQC spectrum, (d) HMBC spectrum of the compound 3a-8. HMBC correlation of a methyl group protons H30 with a carbonyl group C29 is marked in black, Table S1: 1H and 13C chemical shifs of compound 3a-7.

Author Contributions

Conceptualization, P.N.; writing—original draft preparation, P.N.; writing—review and editing, P.N. and I.H.; Synthesis and identification, I.H., L.E.S., J.G., I.M. and P.N.; LC-SPE analysis, I.H. and L.E.S.; NMR analysis, I.M., I.H. and P.N.; MS analysis, S.K.; Supervision, P.N. All authors have read and agreed to the published version of the manuscript.

Funding

This research was funded by the Croatian Science Foundation, grant number IP-2018-01-8098, The Macrozones.

Institutional Review Board Statement

Not applicable.

Informed Consent Statement

Not applicable.

Data Availability Statement

The data presented in this study are available within the article and in Supplementary Materials.

Acknowledgments

The authors are acknowledged to Mirjana Bukvić and Ivan Grgičević for their helpful comments and suggestions regarding synthesis. This work has been financially supported by the National Science Foundation (project HRZZ IP-2018-01-8098, The Macrozones).

Conflicts of Interest

The authors declare no conflict of interest.

Sample Availability

Samples of the compounds are available from the authors.

References

  1. Arsić, B.; Novak, P.; Rimoli, M.G.; Barber, J.; Kragol, G.; Sodano, F. Macrolides. Properties, Synthesys and Applications. In CHEMMEDCHEM, 1st ed.; De Gruyter: Berlin, Germany, 2018; pp. 1–100. [Google Scholar]
  2. Parnham, M.J.; Eraković Faber, V.; Gimarellos-Bourboulis, E.J.; Perletti, G.; Verleden, G.M.; Vos, R. Azithromycin: Mechanism of action and their relevance for clinical applications. Pharm. Therap. 2014, 143, 225–245. [Google Scholar] [CrossRef]
  3. Arsić, B.; Barber, J.; Čikoš, A.; Mladenović, M.; Stanković, N.; Novak, P. 16-Membered Macrolide Antibiotics: A Review. Int. J. Antimicrob. Agents 2018, 51, 283–298. [Google Scholar] [CrossRef]
  4. Schlünzen, F.; Zarivach, R.; Harm, J.; Bashan, A.; Tocilj, A.; Albrecht, R.; Yonath, A.; Franceschi, F. Structural basis for the interaction of antibiotics with the peptidyl transferase centre in eubacteria. Nature 2001, 413, 814–821. [Google Scholar] [CrossRef]
  5. Hansen, J.L.; Ippolito, J.A.; Ban, N.; Nissen, P.; Moore, P.B.; Steitz, T.A. The structures of four macrolide antibiotics bound to the large ribosomal subunit. Mol. Cell 2002, 10, 117–128. [Google Scholar] [CrossRef]
  6. Dunkle, J.A.; Xiong, L.; Mankin, A.S.; Cate, J.H.D. Structures of the Escherichia coli ribosome with antibiotics bound near the peptidyl transferase center explain spectra of drug action. Proc. Natl. Acad. Sci. USA 2010, 107, 17152–17157. [Google Scholar] [CrossRef] [Green Version]
  7. Novak, P.; Tatić, I.; Tepeš, P.; Koštrun, S.; Barber, J. A Systematic Approach to Understanding Ribosome-Macrolide Interactions: NMR and Modeling Studies of Oleandomycin and its Derivatives. J. Phys. Chem. A 2006, 110, 580–588. [Google Scholar] [CrossRef] [PubMed]
  8. Novak, P.; Barber, J.; Čikoš, A.; Arsić, B.; Plavec, J.; Lazarevski, G.; Tepeš, P.; Košutić-Hulita, N. Free and bound state structures of 6-O-methyl homoerithromycins and epitope mapping of their interactions with ribosomes. Bioorg. Med. Chem. 2009, 17, 5857–5867. [Google Scholar] [CrossRef] [PubMed]
  9. Kosol, S.; Schrank, E.; Bukvić Krajačić, M.; Wagner, G.E.; Meyer, H.; Göbl, C.; Rechberger, G.N.; Zangger, K.; Novak, P. Probing the Interactions of Macrolide Antibiotics with Membrane-Mimetics by NMR Spectroscopy. J. Med. Chem. 2012, 55, 5632–5636. [Google Scholar] [CrossRef] [PubMed]
  10. Glanzer, S.; Pulido, S.A.; Tutz, S.; Wagner, G.E.; Kriechbaum, M.; Gubensäk, N.; Trifunovic, J.; Dorn, M.; Fabian, W.M.F.; Novak, P.; et al. Structural and functional implications of the interaction between macrolide antibiotics and bile acids. Chem. Eur. J. 2015, 21, 4350–4358. [Google Scholar] [CrossRef] [PubMed] [Green Version]
  11. Wilson, D.N. Ribosome-targeting antibiotics and mechanisms of bacterial resistance. Nat. Rev. Microbiol. 2014, 12, 35–48. [Google Scholar] [CrossRef]
  12. Grgičević, I.; Mikulandra, I.; Bukvić, M.; Banjanac, M.; Habinovec, I.; Bertoša, B.; Novak, P. Discovery of Macrozones, new antimicrobial thiosemicarbazone-based azithromycin conjugates: Design, synthesis and in vitro biological evaluation. Int. J. Antimicrob. Agents 2020, 56, 106147. [Google Scholar] [CrossRef]
  13. Bukvić Krajačić, M.; Novak, P.; Cindrić, M.; Brajša, K.; Dumić, M.; Kujundžić, N. Azithromycin-sulfonamide conjugates as inhibitors of resistant Streptococcus pyogenes strains. Eur. J. Med. Chem. 2007, 42, 138–145. [Google Scholar] [CrossRef]
  14. Bukvić Krajačić, M.; Novak, P.; Dumić, M.; Cindrić, M.; Čipčić Paljetak, H.; Kujundžić, N. Novel Ureas and Thioureas of 15-membered Azalides with Antibacterial Activities Against Key Respiratory Pathogens. Eur. J. Med. Chem 2009, 44, 3459–3470. [Google Scholar] [CrossRef]
  15. Bukvić Krajačić, M.; Dumić, M.; Novak, P.; Cindrić, M.; Koštrun, S.; Fajdetić, A.; Alihodžić, S.; Brajša, K.; Kujundžić, N. Discovery of Novel Ureas and Thioureas of 3-Decladinosyl-3-hydroxy 15-Membered Azalides Active Against Efflux-mediated Resistant Streptococcus Pneumoniae. Bioorg. Med. Chem. Lett. 2011, 21, 853–856. [Google Scholar] [CrossRef] [PubMed]
  16. Fan, B.-Z.; Hiasa, H.; Lv, W.; Brody, S.; Yang, Z.-Y.; Aldrich, C.; Cushman, M.; Liang, J.-H. Design, synthesis and structure-activity relationships of novel 15-membered macrolides: Quinolone/quinoline-containing sidechains tethered to the C-6 position of azithromycin acylides. Eur. J. Med. Chem. 2020, 193, 112222. [Google Scholar] [CrossRef] [PubMed]
  17. Fajdetić, A.; Vinter, A.; Čipčić Paljetak, H.; Padovan, J.; Jakopović, I.P.; Kapić, S.; Alihodžić, S.; Filić, D.; Modrić, M.; Košutić-Hulita, N.; et al. Synthesis, activity and pharmacokinetics of novel antibacterial 15-membered ring macrolones. Eur. J. Med. Chem. 2011, 46, 3388–3397. [Google Scholar] [CrossRef]
  18. Pavlović, D.; Mutak, S. Synthesis and antibacterial evaluation of novel 4″-glycyl linked quinolyl-azithromycins with potent activity against macrolide-resistant pathogens. Bioorg. Med. Chem. 2016, 24, 1255–1267. [Google Scholar] [CrossRef] [PubMed]
  19. Ma, S.; Jiao, B.; Liu, Z.; Wang, H.; Xian, R.; Zheng, M.; Lou, H. Synthesis and antibacterial activity of 4″,11-di-O-arylalkylcarbamoyl azithromycin derivatives. Bioorg. Med. Chem. Lett. 2009, 19, 1698–1701. [Google Scholar] [CrossRef] [PubMed]
  20. Ma, X.; Zhang, L.; Wang, R.; Cao, J.; Liu, C.; Fang, Y.; Wang, J.; Ma, S. Novel C-4″ modified azithromycin analogs with remarkably enhanced activity against erythromycin-resistant Streptococcus pneumoniae: The synthesis and antimicrobial evaluation. Eur. J. Med. Chem. 2011, 46, 5196–5205. [Google Scholar] [CrossRef]
  21. Wang, Y.; Cong, C.; Chai, W.C.; Dong, R.; Jia, L.; Song, D.; Zhou, Z.; Ma, S. Synthesis and antibacterial activity of novel 400-O-(1-aralkyl-1,2,3-triazol-4-methylcarbamoyl) azithromycin analogs. Bioorg. Med. Chem. Lett. 2017, 27, 3872–3877. [Google Scholar] [CrossRef]
  22. Tevyashova, A.N.; Korolev, A.M.; Mirchink, E.P.; Isakova, E.B.; Osterman, I.A. Synthesis and evaluation of biological activity of benzoxaborole derivatives of azithromycin. J. Antibiot. 2019, 72, 22. [Google Scholar] [CrossRef]
  23. Tevyashova, A.N.; Bychkova, E.N.; Korolev, A.M.; Isakova, E.B.; Mirchink, E.P.; Osterman, I.A.; Erdei, R.; Szücs, Z.; Batta, G. Synthesis and evaluation of biological activity for dual-acting antibiotics on the basis of azithromycin and glycopeptides. Bioorg. Med. Chem. Lett. 2019, 29, 276–280. [Google Scholar] [CrossRef]
  24. Janas, A.; Przybylski, P. 14- and 15-membered lactone macrolides and their analogues and hybrids: Structure, molecular mechanism of action and biological activity. Eur J. Med. Chem. 2019, 182, 111662. [Google Scholar] [CrossRef]
  25. Singh, S.; Handa, T.; Narayanam, M.; Sahu, A.; Junwal, M.; Shah, R.P. A critical review on the use of modern sophisticated hyphenated tools in the characterization of impurities and degradation products. J. Pharm. Biomed. Anal. 2012, 69, 148–173. [Google Scholar] [CrossRef]
  26. Görög, S. Critical review of reports on impurity and degradation product profiling in the last decade. Trends Anal. Chem. 2018, 101, 2–16. [Google Scholar] [CrossRef]
  27. Godejohan, M. Characterization of a paracetamol metabolite using on-line LC-SPE-NMR-MS and a cryogenic NMR probe. J. Chromatogr. A 2004, 1058, 191–196. [Google Scholar] [CrossRef]
  28. Grosso, C.; Jäger, A.K.; Staerk, D. Coupling of a high-resolution monoamine oxidase-A inhibitor assay and HPLC-SPE-NMR for advanced bioactivity profiling of plant extracts. Phytochem. Anal. 2013, 2, 141–147. [Google Scholar] [CrossRef]
  29. Rinaldi, F.; Fan, J.; Pathirana, C.; Palaniswamy, V. Semi-preparative LC-SPE-cryoflow NMR for impurity identifications: Use of mother liquor as a better source of impurities. Magn. Reson. Chem. 2013, 51, 517–522. [Google Scholar] [CrossRef]
  30. Sturm, S.; Seger, C. Liquid chromatography–nuclear magnetic resonance coupling as alternative to liquid chromatography–mass spectrometry hyphenations: Curious option or powerful and complementary routine tool? J. Chromatogr. A 2012, 1259, 50–61. [Google Scholar] [CrossRef]
  31. Novak, P.; Tepeš, P.; Cindrić, M.; Ilijaš, M.; Dragojević, S.; Mihaljević, K. Combined use of liquid chromatography-nuclear magnetic resonance spectroscopy and liquid chromatography-mass spectrometry for the characterisation of an acarbose degradation product. J. Chromatogr. A 2004, 1033, 299–303. [Google Scholar] [CrossRef]
  32. Novak, P.; Tepeš, P.; Ilijaš, M.; Fistrić, I.; Bratoš, I.; Avdagić, A.; Gabelica Marković, V.; Dumić, M. LC-NMR and LC-MS identification of an impurity in a novel antifungal drug icofungipen. J. Pharm. Biomed. Anal. 2009, 50, 68–72. [Google Scholar] [CrossRef]
  33. Novak, P.; Tepeš, P.; Fistrić, I.; Bratoš, I.; Gabelica, V. The Application of LC-NMR and LC-MS for the Separation and Rapid Structure elucidation of an Unknown Impurity in drug 5-Aminosalicylic Acid. J. Pharm. Biomed. Anal. 2006, 40, 1268–1272. [Google Scholar] [CrossRef]
  34. Wolfender, J.L.; Querioz, E.F.; Hostettmann, K. Phytochemistry in the microgram domain—A LC-NMR perspective. Magn. Reson. Chem. 2005, 43, 697–709. [Google Scholar] [CrossRef]
  35. Kühnle, M.; Holtin, K.; Albert, K. Capillary NMR detection in separation science. J. Sep. Sci. 2009, 32, 719–726. [Google Scholar] [CrossRef]
  36. Sandvoss, M.; Bardsley, B.; Beck, T.L.; Lee-Smith, E.; North, S.E.; Moore, P.J.; Edwards, A.J.; Smith, R.J. HPLC-SPE-NMR in pharmaceutical developments: Capabilities and applications. Magn. Reson. Chem. 2005, 43, 762–770. [Google Scholar] [CrossRef]
  37. Harča, M.; Habinovec, I.; Meštrović, E.; Biljan, I.; Novak, P. Rapid Identification of Unknown Impurities in 3-Bromo-5-(trifluoromethyl)aniline by LC-SPE/NMR. Croat. Chem. Acta 2016, 89, 543–547. [Google Scholar] [CrossRef]
  38. Lambert, M.; Wolfender, J.L.; Staerk, D.; Christensen, S.B.; Hostettmann, K.; Jaroszewski, J.W. Identification of Natural Products Using HPLC-SPE Combined with CapNMR. Anal. Chem. 2007, 79, 727–735. [Google Scholar] [CrossRef]
  39. Seger, C.; Godejohann, M.; Spraul, M.; Stuppner, H.; Hadacek, F. Reaction product analysis by high-performance liquid chromatography-solid-phase extraction-nuclear magnetic resonance Application to the absolute configuration determination of naturally occurring polyyne alcohols. J. Chromatogr. A 2006, 1136, 82–88. [Google Scholar] [CrossRef]
  40. Larsen, J.; Staerk, D.; Cornett, C.; Hansen, H.S.; Jaroszewski, J.W. Identification of reaction products between drug substances and excipients by HPLC–SPE–NMR: Ester and amide formation between citric acid and 5-aminosalicylic acid. J. Pharm. Biomed. Anal. 2009, 49, 839–842. [Google Scholar] [CrossRef] [Green Version]
  41. Habinovec, I.; Jednačak, T.; Novak, P. Rapid identification of bioactive carbohydrazide reaction products by an LC-DAD-SPE-NMR approach. ADMET DMPK 2015, 3, 352–358. [Google Scholar] [CrossRef]
  42. Meier, U.C. Detection and identification of hydrolysis products of sulfur mustards at trace levels in environmental samples using liquid chromatography solid phase extraction combined with off-line nuclear magnetic resonance analysis. J. Chromatogr. A 2013, 1286, 159–165. [Google Scholar] [CrossRef]
  43. Sahu, A.; Balhara, A.; Raju, N.; Kumar, B.K.; Sharma, P.; Singh, D.K.; Singh, S. Characterization of degradation products of celiprolol hydrochloride using hyphenated mass and NMR techniques. J. Pharm. Biomed. Anal. 2021, 197, 113953. [Google Scholar] [CrossRef]
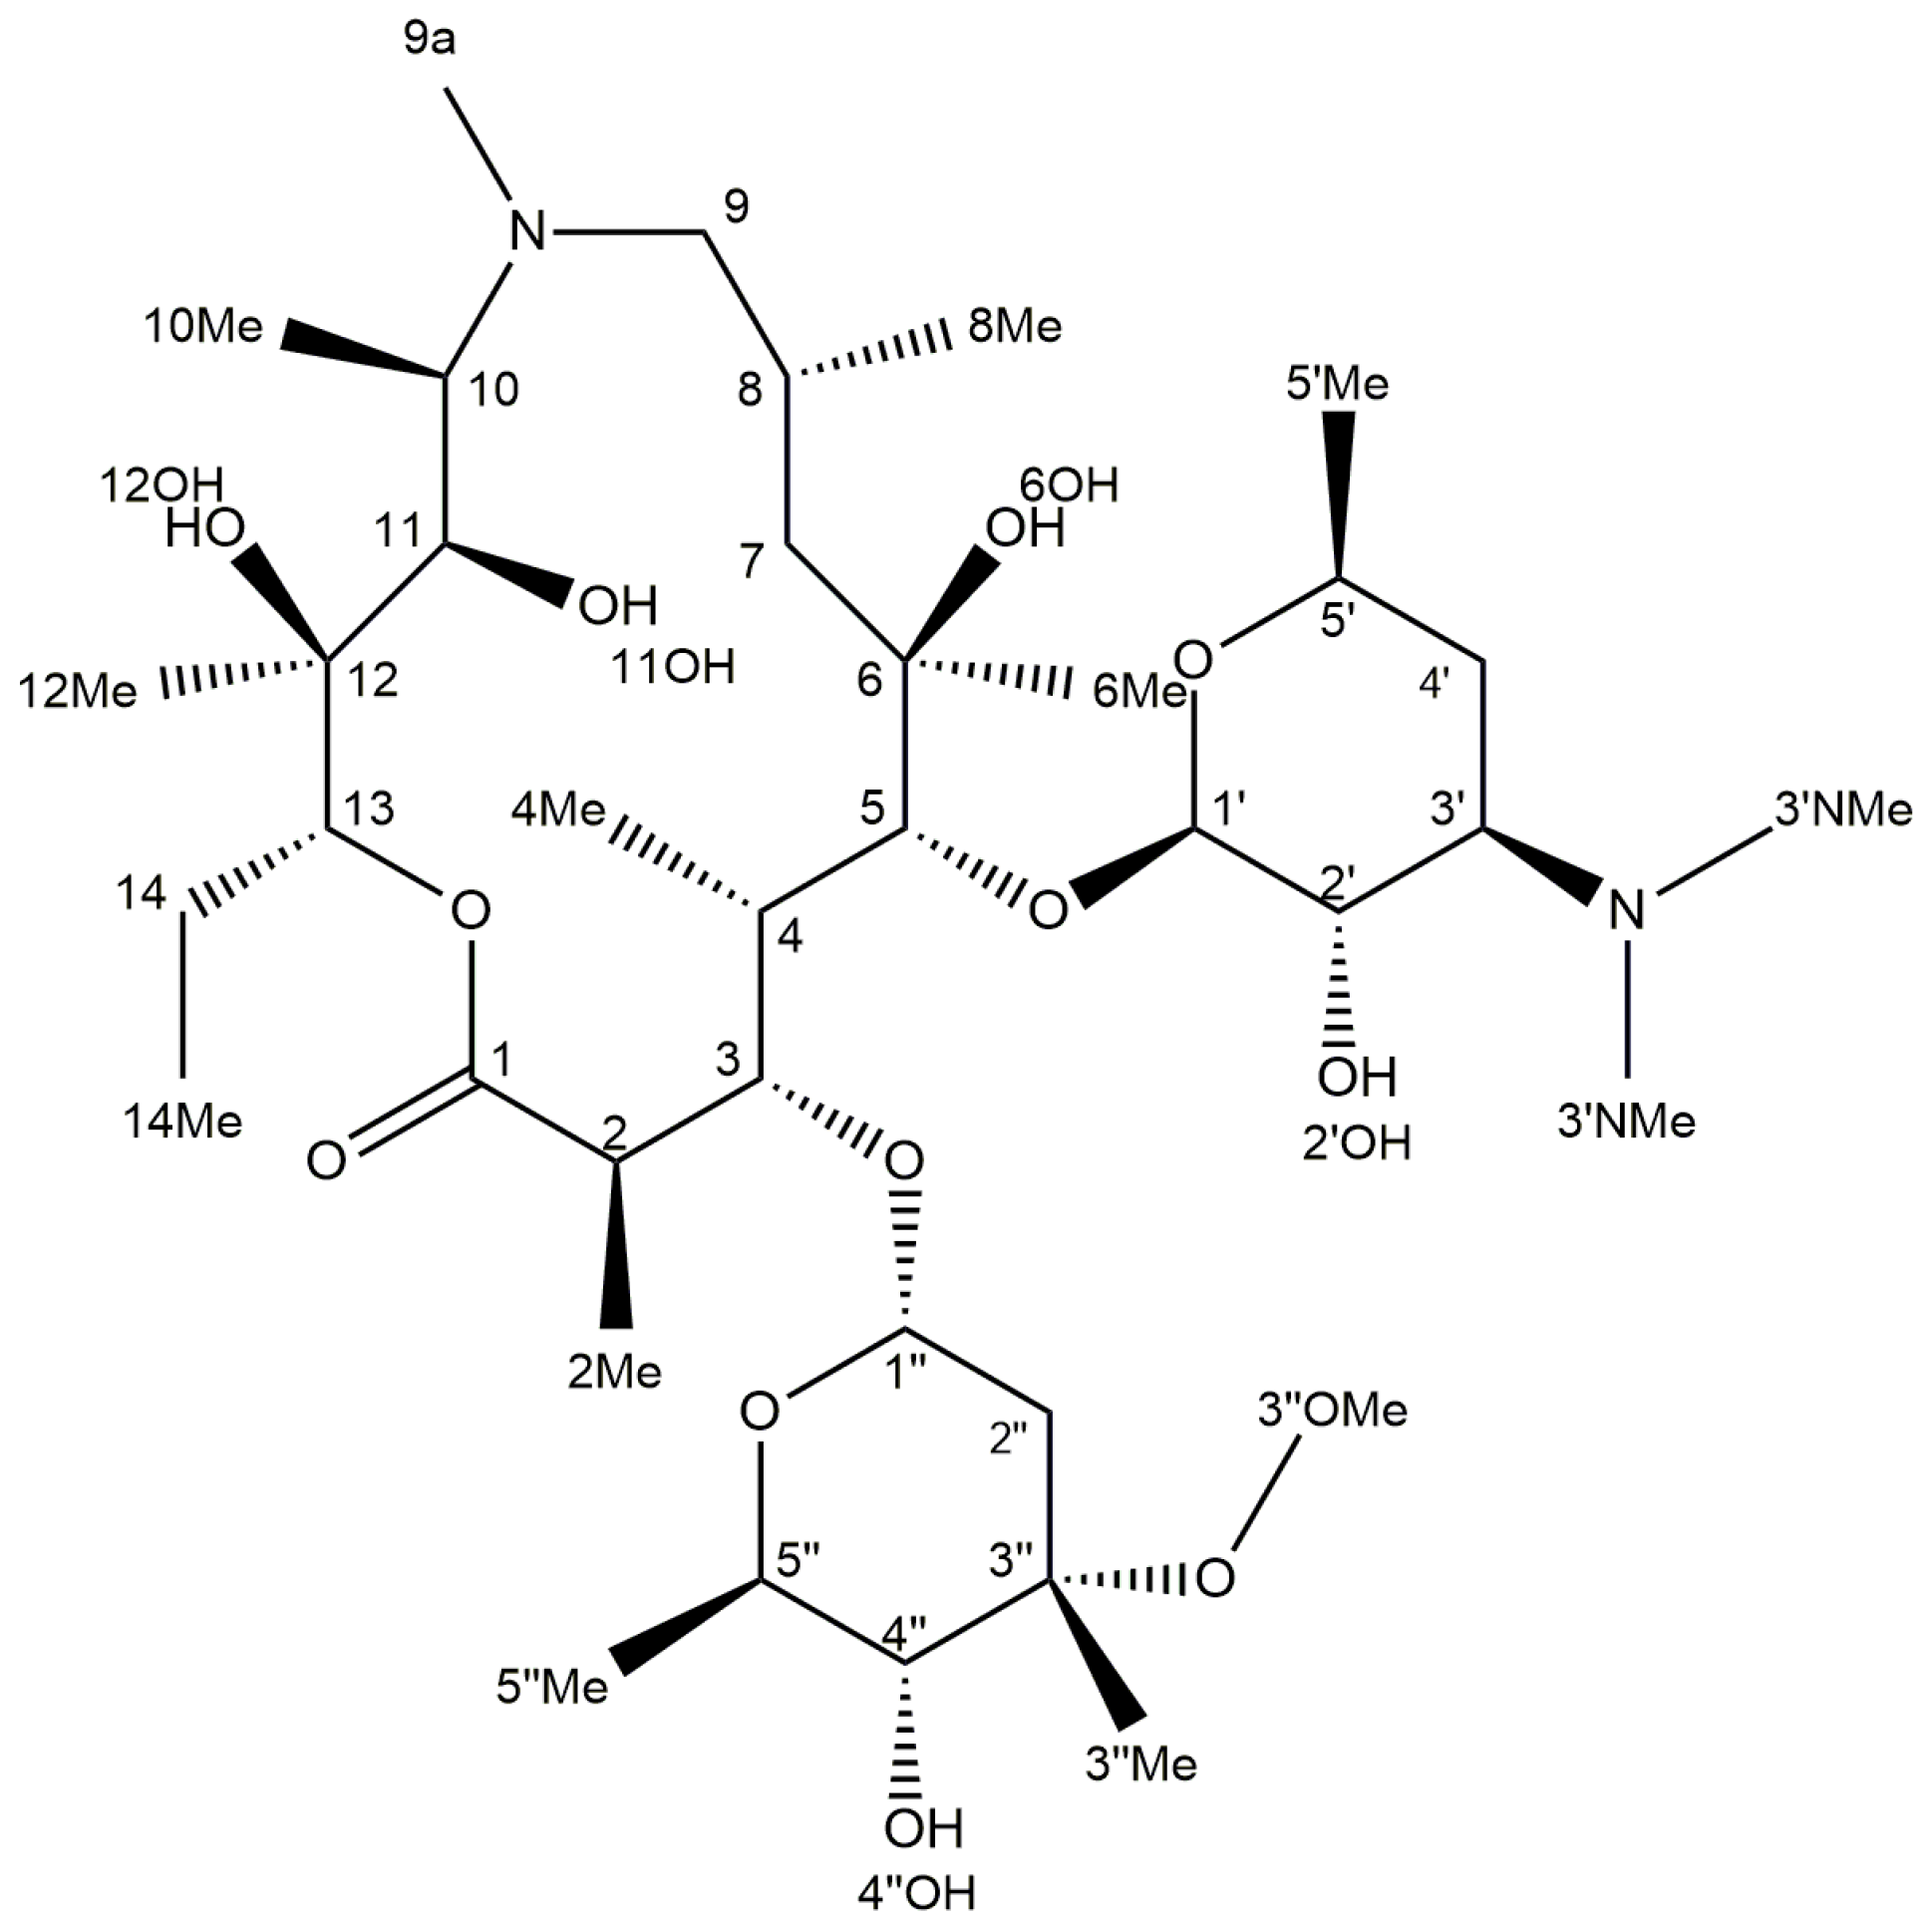
Scheme 1. The structure of azithromycin and the atom numbering.
Molecules 26 06316 sch001
Figure 1. The final reaction step for preparing 4″-tetrahydrofurfuryl macrozone 3a and the atom numbering.
Molecules 26 06316 g001
Figure 2. LC-DAD chromatogram of the macrozone 3a reaction mixture with assigned main components.
Molecules 26 06316 g002
Figure 3. The stuctures of 3a and its reaction mixture components. The compounds 3a-4 and 3a-7 are diastereoisomers of 3a.
Molecules 26 06316 g003
Figure 4. (a) MS/MS spectrum and (b) fragmentation pattern of 4″-tetrahydrofurfuryl macrozone 3a.
Molecules 26 06316 g004
Figure 5. Superimposed HSQC spectra of 3a (red and pink contours) and 3a-6 (green and blue contours) with characteristic thioureido-furfuryl cross peaks highlighted.
Molecules 26 06316 g005
Table 1. 1H and 13C chemical shifs of 4″-tetrahydrofurfuryl macrozone 3a.
Compound3a
Atomδ(1H)/ppmδ(13C)/ppmAtomδ(1H)/ppmδ(13C)/ppm
1-178.98227.97141.6
22.7645.34″-22a-a-
2Me1.1514.664″-22b8.00-
34.2378.1523-178.03
41.9942.1243.83; 3.6047.8
4Me1.008.99254.1477.1
53.5783.1261.97; 1.6328.44
6-74.0271.9125.34
6Me1.2627.27283.86; 3.7267.6
6OH-a-1′4.47102.6
7eq; 7ax1.61; 1.3742.12′3.0571.1
81.9826.42′OH-a-
8Me0.8721.513′2.4065.14
9eq; 9ax2.48; 2.1469.123′NMe22.1239.7
9a-N2.2535.64′eq; 4′ax1.55; 1.0729.13
102.7662.15′3.6667.9
10Me1.026.555′Me1.1421.24
113.6667.91″4.9895.1
11OH-a-2″eq; 2″ax2.34; 1.5634.9
12-74.43″-73.3
12Me1.0516.133″Me1.2120.92
12OH-a-3″OMe3.2649.2
134.7077.24″2.8787.5
14eq; 14ax1.82; 1.4421.04″-a3.85; 3.7373.5
14Me0.8410.654″-b1.8429.6
15-166.024″-c3.55; 3.4138.2
16-135.744″-d7.50-
17; 217.85127.535″4.3064.4
18; 207.81127.245″Me1.2818.18
19-136.75
-a not assigned due to a H/D exchange.
Publisher’s Note: MDPI stays neutral with regard to jurisdictional claims in published maps and institutional affiliations.