Article

Semi-Rigid (Aminomethyl) Piperidine-Based Pentadentate Ligands for Mn(II) Complexation

1
Department of Science and Technological Innovation, Università del Piemonte Orientale, 15121 Alessandria, Italy
2
Bracco Research Center, Bracco Imaging SpA, 10010 Colleretto Giacosa, Italy
*
Author to whom correspondence should be addressed.
Molecules 2021, 26(19), 5993; https://doi.org/10.3390/molecules26195993
Submission received: 8 September 2021 / Revised: 24 September 2021 / Accepted: 29 September 2021 / Published: 2 October 2021
(This article belongs to the Special Issue Recent Advances on MRI Contrast Agents)

Abstract

:
Two pentadentate ligands built on the 2-aminomethylpiperidine structure and bearing two tertiary amino and three oxygen donors (three carboxylates in the case of AMPTA and two carboxylates and one phenolate for AMPDA-HB) were developed for Mn(II) complexation. Equilibrium studies on the ligands and the Mn(II) complexes were carried out using pH potentiometry, 1H-NMR spectroscopy and UV-vis spectrophotometry. The Mn complexes that were formed by the two ligands were more stable than the Mn complexes of other pentadentate ligands but with a lower pMn than Mn(EDTA) and Mn(CDTA) (pMn for Mn(AMPTA) = 7.89 and for Mn(AMPDA-HB) = 7.07). 1H and 17O-NMR relaxometric studies showed that the two Mn-complexes were q = 1 with a relaxivity value of 3.3 mM−1 s−1 for Mn(AMPTA) and 3.4 mM−1 s−1 for Mn(AMPDA-HB) at 20 MHz and 298 K. Finally, the geometries of the two complexes were optimized at the DFT level, finding an octahedral coordination environment around the Mn2+ ion, and MD simulations were performed to monitor the distance between the Mn2+ ion and the oxygen of the coordinated water molecule to estimate its residence time, which was in good agreement with that determined using the 17O NMR data.

1. Introduction

Mn2+ is an endogenous metal ion that is involved in several biochemical processes and it is present in serum at concentrations of 0.5–1.2 µg/L [1]. Thus, living organisms can efficiently deal with small excess amounts of free metal ions in organs and tissues. Its relative toxicity (LD50 = 0.22 mmol/kg) [1] has made it attractive in the last decade as a replacement for gadolinium in contrast agents for magnetic resonance imaging (MRI) since Gd(III) is also toxic in its free form, even in very low amounts, and can be associated with a pathology called nephrogenic systemic fibrosis, which affects patients with compromised renal functionality [2]. Manganese(II) represents a valid alternative to gadolinium(III) in MRI applications because it has a high paramagnetism due to its five unpaired electrons; moreover, it is endowed with a long electronic relaxation time and it can coordinate easily exchangeable water molecules [3,4,5,6,7]. As with Gd(III)-based MRI contrast agents, the relatively high concentrations of Mn(II) that are needed for MRI applications (0.05–0.30 mmol kg–1) require the cation to be “caged” by an organic ligand to prevent undesired side reactions in vivo that would compromise its role and cause toxic effects. Such chelators are normally polyamino-polycarboxylates that are capable of strongly binding the metal ion while leaving at least one free coordination position for an exchangeable water molecule: this is an almost compulsory requirement for having a significant contrast enhancement effect with this type of MRI agent. In particular, since Mn(II) typically forms six- or seven-coordinated complexes, using hexa- or pentadentate chelators (Figure 1) was proposed to match the good stability with the presence of at least one binding site available for H2O. The only Mn-based MRI contrast agent that was approved for clinical use was Teslascan®, where the metal ion is caged by a DPDP (dipyridoxyl diphosphate) ligand (Figure 1) [8]. However, such an agent was recently withdrawn by both the European and US markets because of poor clinical performance and toxicity concerns. Since then, several alternatives have been reported, among which, the Mn-complexes of cis-1,4-DO2A and its derivatives (1,4-DO2A = 1,4,7,10-tetraazacyclododecane-1,4-diacetic acid) [9,10], PC2A derivatives (PC2A = tetraazabicyclo[9.3.1]pentadeca-1(15),11,13-triene-3,9-triacetic acid) [11,12], trans-CDTA (trans-1,2-diaminocyclohexane-N,N,N′,N′-tetraacetic acid, Figure 1) [13] and PyC3A (N-picolyl-N,N′,N′-trans-1,2-cyclohexylenediaminetriacetate, Figure 1) [14] seem to be the most promising for general MRI applications.
Among the many requirements that a metal complex needs to satisfy to be exploited as a contrast agent, in vivo kinetic inertness plays the main role. From this perspective, increasing the rigidity of the chelator may lead to improved stability of the metal complex [13,15]. For example, the source of such rigidity can be a macrocyclic ligand or a cycloalkane/aromatic ring incorporated in the molecular structure of the ligand. In this respect, the presence of a pyridine ring in the chelator structure was recently exploited in a series of penta- or hexadentate non-macrocyclic ligands that were used for the preparation of Mn(II) complexes endowed with enhanced relaxivities, such as PAADA, DPAA and DPAMeA [16,17].
Our group recently reported about two pentadentate ligands based on 2-aminomethylpiperidine (AMP) and bearing acetic and/or hydroxybenzyl pendant arms (namely AMPTA and AMPDA-HB, Figure 1) that were successfully applied for the preparation and test of aluminumfluoride complexes for PET applications [18]. We hypothesized that the presence of the piperidine heterocyclic ring could induce greater rigidity of the Mn(II) complex and therefore greater stability, as occurs in the case of the Mn(CDTA) complex compared to the flexible Mn(EDTA). In addition, the replacement of one acetate arm with a 2-hydroxybenzyl group may increase the binding effectiveness to Mn(II) as the phenolate group is a strong electron donor that can efficiently coordinate various metal ions due to its higher basicity compared to a carboxylate. Moreover, as mentioned above, it is expected that the presence of a rigid aryl ring confers more stability to the corresponding complexes. A few linear or macrocyclic ligands bearing phenol groups were reported in the literature, especially to chelate transition metals, while their applications with lanthanides are rather limited [19,20,21,22].
Thus, in the present work, we describe an improved synthesis of the ligand AMPDA-HB and the detailed investigation on Mn(AMPTA) and Mn(AMPDA-HB) chelates, including 1H and 17O NMR relaxometric, potentiometric and computational studies.

2. Results and Discussion
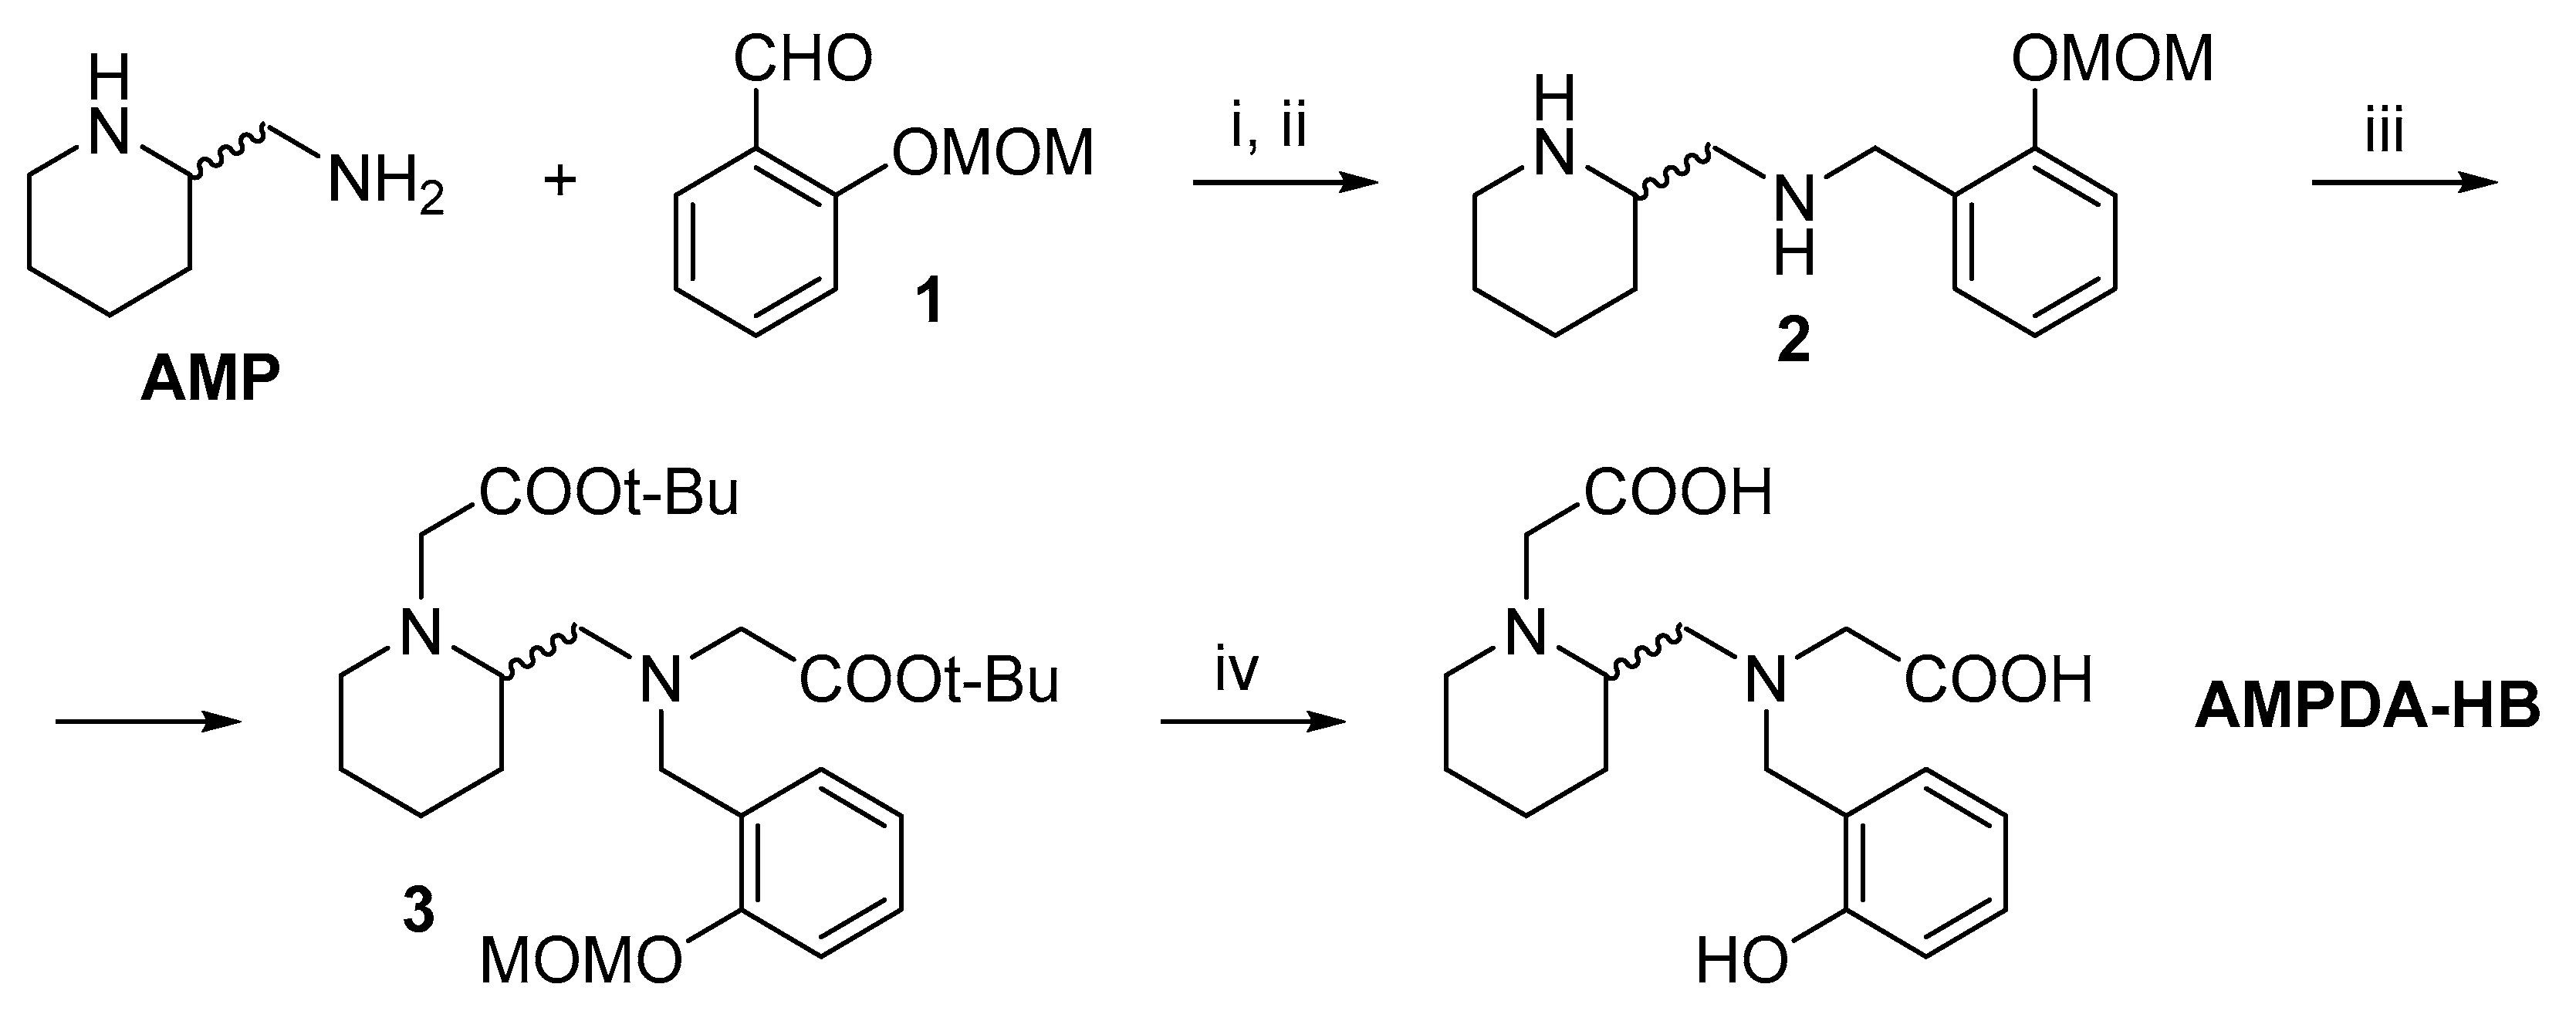
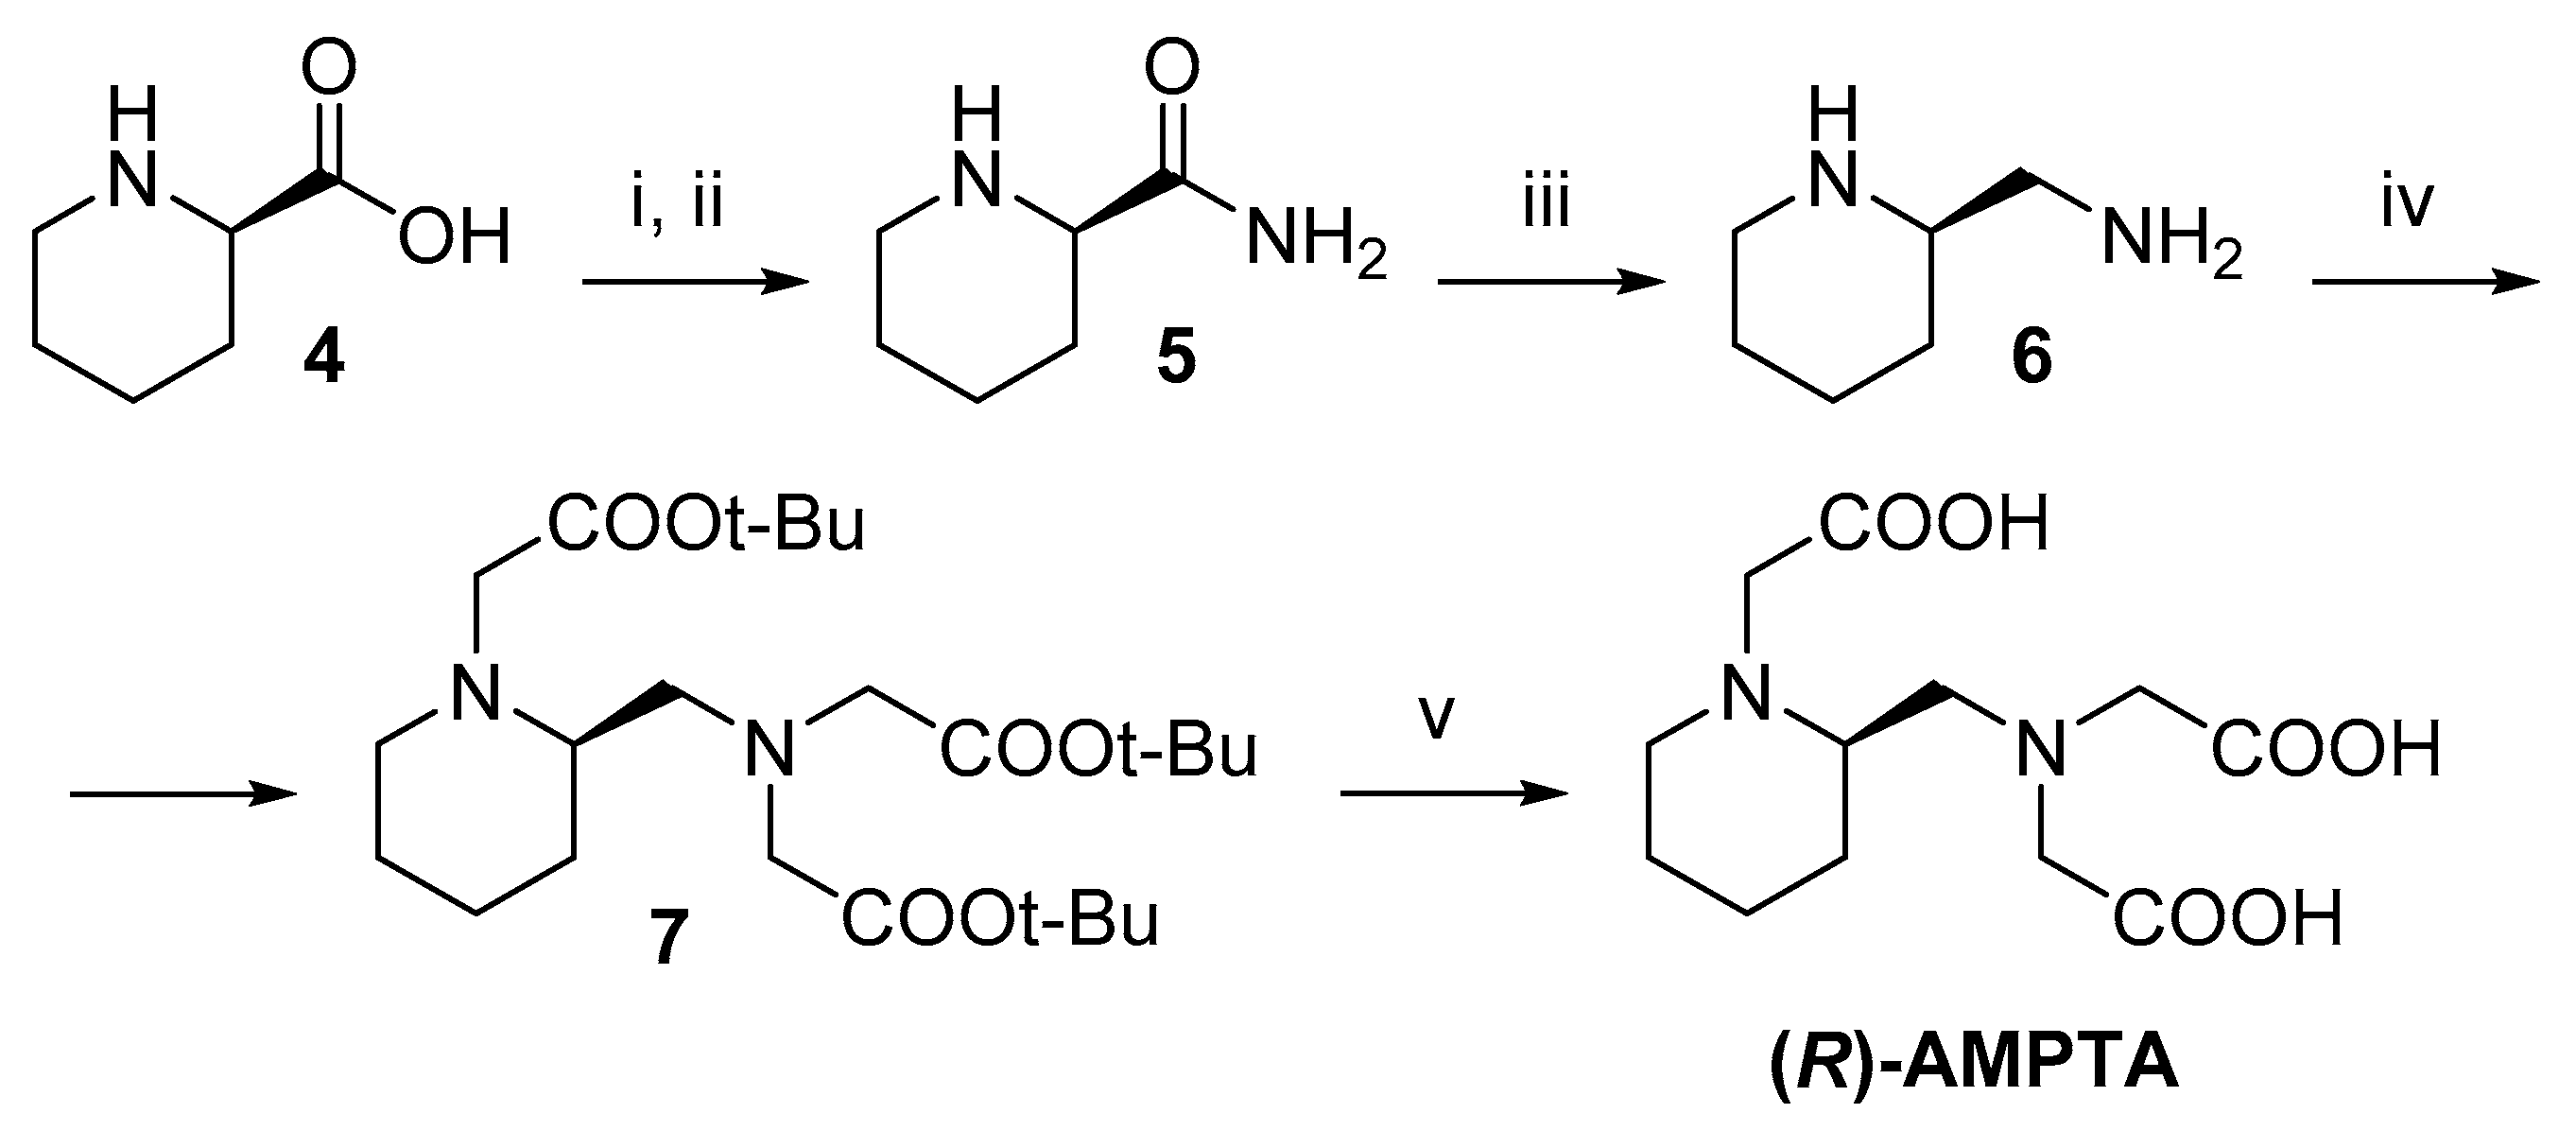
2.1. Synthesis

The ligand AMPTA was prepared following the procedure previously reported by our group [18]. For AMPDA-HB, an improved synthesis was developed (Scheme 1), where salicylaldehyde was initially protected at its hydroxyl moiety with a methoxymethyl (MOM) group (1) by using methoxymethylchloride [23] and then reacted with racemic 2-AMP via reductive amination to give the intermediate 2. The remaining available positions on each nitrogen atom were alkylated with tert-butyl bromoacetate and the obtained diester 3 was finally treated with trifluoroacetic acid (TFA) to deprotect both the carboxylate and hydroxyl moieties, leading to the intended AMPDA-HB ligand.
Compared with the previous procedure, the slight disadvantage of the further step required (i.e., the MOM protection of salicylaldehyde) was far overcome by the cleaner output that translated into higher yields: keeping the OH group free appeared to have a detrimental effect on both the alkylation (42% yield) and the deprotection (19%) steps, with a total yield of just 2%. In particular, the formation of 2-oxopiperidine bicyclic byproducts was observed due to acid-catalyzed intramolecular aminolysis. Instead, the temporary conversion of the hydroxyl moiety into a methoxymethoxy group allowed for obtaining the diester with an 82% yield and the final compound with a 53% yield, increasing the total yield to 31% relative to the initial amount of AMP. Other strategies, such as the protection of the OH group of salicylaldehyde by using acetate, did not lead to satisfactory results.
The R-enantiomer of AMPTA was also prepared (Scheme 2), starting from D-pipecolinic acid ((R)-piperidine-2-carboxylic acid, 4) via amide 5, which was obtained according to a reported procedure [24], and was, in turn, reduced to amine 6 with LiAlH4. Exhaustive alkylation with tert-butyl bromoacetate (7), followed by deprotection of the carboxylates under acidic conditions (TFA), led to the intended ligand, whose ESI MS and NMR characterization data were identical to what was reported for the racemic analogs, as expected.
This chelator was used to prepare the corresponding Mn complex to confirm the correspondence between its relaxometric properties and the results obtained for the racemic mixture.
Complexations were carried out by stirring an equimolar aqueous solution of ligand and manganese (II) chloride at pH 6.5.

2.2. Equilibrium Studies

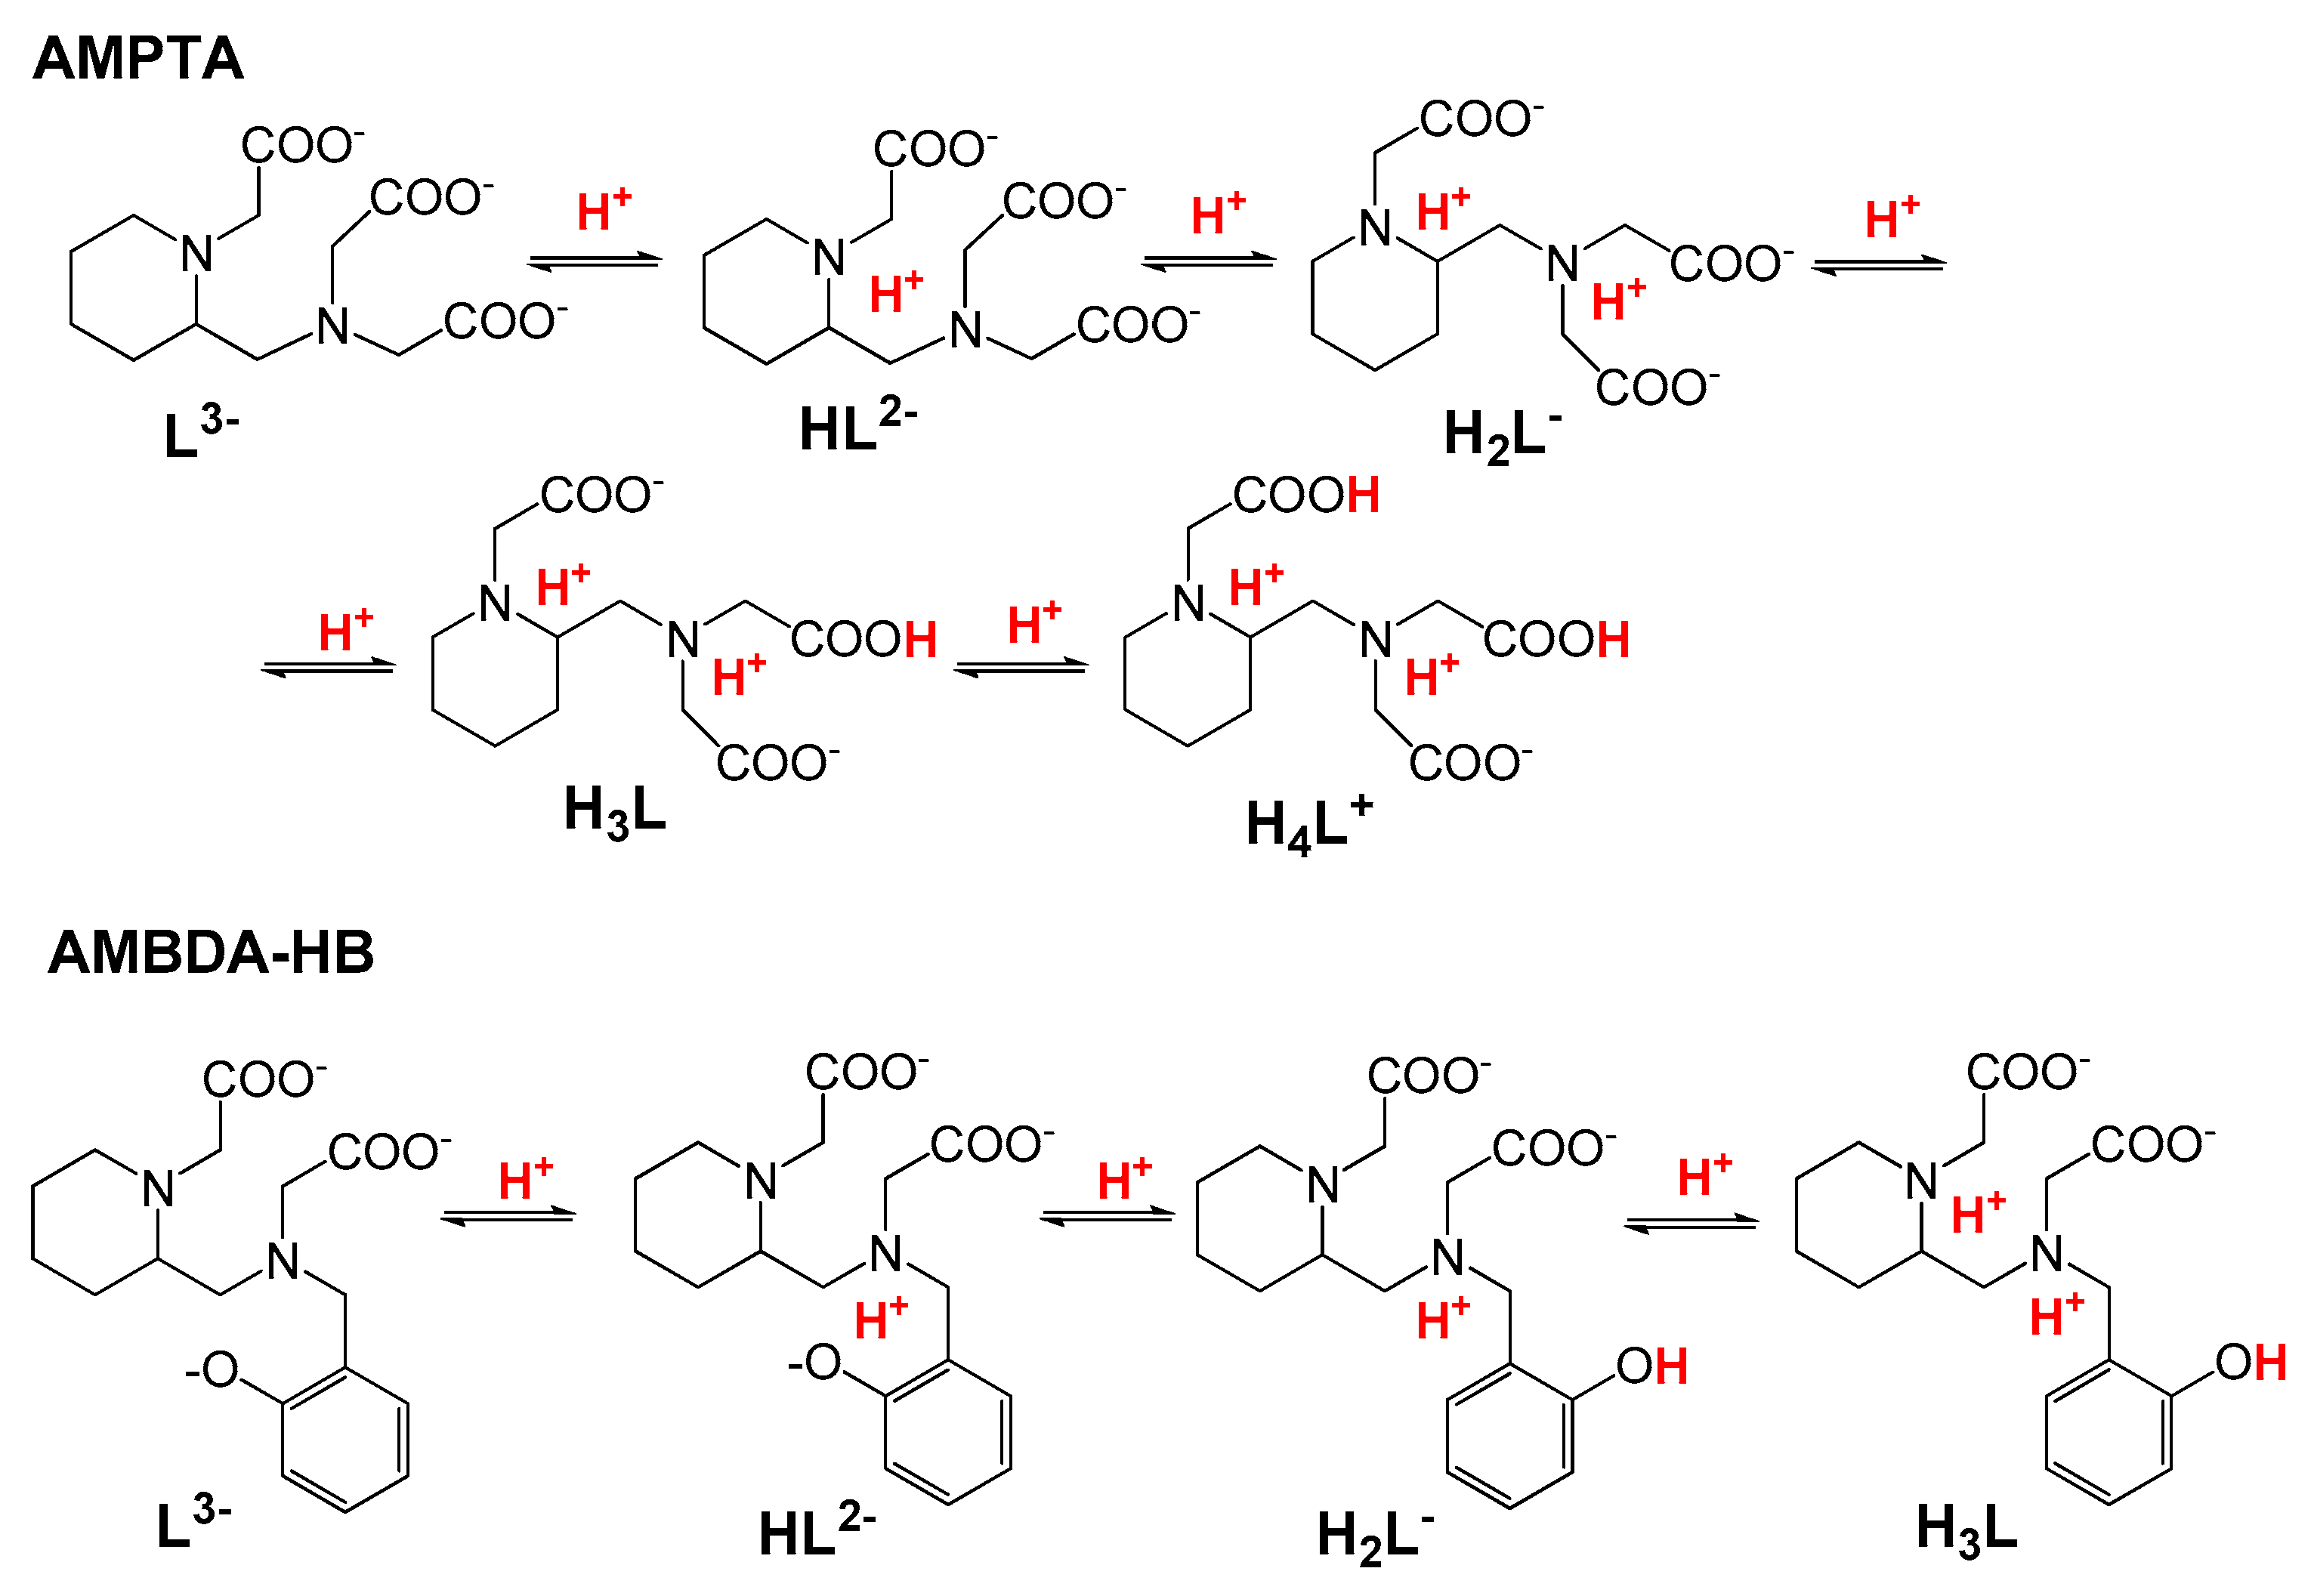
2.2.1. Protonation Equilibria

The protonation constants of H3AMPTA and H2AMPDA-HB, defined by Equation (1), were determined using pH potentiometry, 1H-NMR spectroscopy and UV-vis spectrophotometry. The logKiH values of H3AMPTA and H2AMPDA-HB are listed in Table 1 and compared with those of pentadentate H2DPAMeA and H2DPAPhA ligands (Figure 1).
K i H = [ H i L ] [ H i 1 L ] [ H + ] · · · · · · i = 1 , 2 5
The protonation sequence of AMPTA was determined through 1H-NMR spectroscopy by following the chemical shift of the non-labile protons as a function of pH (Figure 2). The 1H-NMR titration curves displayed large changes in the chemical shifts as a function of pH, which could be assigned to the protonation/deprotonation of the specific donor atoms in the AMPTA ligand. Since the protonation/deprotonation was fast on the NMR time scale, the chemical shifts of the observed signals could be expressed as a weighted average of the shifts of the different species involved in the protonation processes according to Equation (2) [25]:
δ H ( o b s ) =   x i δ H H i L
where δ H ( o b s ) is the observed chemical shift of a given signal, while xi and δ H H i L are the molar fractions and the chemical shifts of the involved species, respectively. The protonation/deprotonation of AMPDA-HB was studied using spectrophotometry on the absorption band of the aromatic group of the ligand, following the absorbance values at 295 nm. The UV spectra and the absorbance values at 295 nm of AMPDA-HB are shown in Figure 3. The absorbance of the ligand can be expressed as a sum of the absorption of each protonated species according to Equation (3) [26]:
A = [ H i L ] ε H H i L l
where A is the absorbance at a given wavelength; [HiL] and ε H H i L are the concentration and the molar absorptivity of the species, respectively; and l is the path length of the cell. The observed chemical shifts ( δ H ( o b s ) ) and absorbance values (A) were fitted to Equations (2) and (3), respectively (the molar fractions xi and the concentration of the different protonated species were expressed using the protonation constants KiH). The fittings of the experimental data points are shown in Figure 2 and Figure 3. The obtained logKiH values are listed in Table 1.
The 1H-NMR spectra of AMPTA at pH > 10 contained several broad multiplets and only a few of them were used to determine the protonation sequence of the AMPTA ligand (Figure 2). Starting from basic pH, the addition of one equivalent of acid to AMPTA resulted in a significant downfield shift of the signals of e, g and f protons, indicating that the first protonation took place at the nitrogen atoms of the piperidine group (the protonation occurred partially at the N atom of the piperidine and the iminodiacetic acid (IMDA) group). In the pH range of 4–8, the signals of the g, h and f protons were mainly affected by the second protonation process, which occurred at the N atom of the IMDA group. However, the signal of the e proton of the piperidine group was also shifted slightly to higher frequencies (downfield), which could be explained by the fact that, parallel with the protonation of the IMDA nitrogen, the first proton was transferred to the piperidine nitrogen due to the electrostatic repulsion between the protonated nitrogen atoms. At pH < 4, the downfield shift of the signals of the g, h and f protons confirmed that the logK3H and logK4H were related to the protonation of the IMDA carboxylates and the piperidine nitrogen, respectively (Scheme 3). The values of logK1H and logK2H obtained from the 1H NMR study agreed well with the related protonation constants of AMPTA, as determined using pH potentiometry (Table 1).
The spectrophotometric study of AMPDA-HB over a range of pHs (Figure 3) revealed that the protonation of the ligand resulted in a significant decrease of the absorbance values at 295 nm. The protonation of L3− and HL2− resulted in the decrease of the absorbance values by 0.1 and 0.14 at 295 nm. According to the ΔAbs values, it could be assumed that the first protonation took place at the nitrogen that was functionalized with the hydroxybenzyl group (the protonation occurred partially at the N atom and the phenolate -O¯ group due to the H-bond formation), whereas the second protonation process of AMPDA-HB took place on the phenolate -O¯ group in the pH range 8–11. Comparison of the protonation constant of phenol (logKH = 10.0, 0.1 M NaClO4, 25 °C) [27] with the logK2H value of AMPDA-HB also confirmed that the second protonation of AMPDA-HB ligand took place at the phenolate -O. Finally, the further protonations of AMPDA-HB occurred at the non-protonated piperidine nitrogen atom and the carboxylate pendant arms (Scheme 3). The protonation constants of the AMPDA-HB ligand that were obtained by the spectrophotometric studies agreed well with the corresponding logKiH values that were determined using pH potentiometry (Table 1).
A comparison of the protonation constants of AMPTA and AMPDA-HB revealed that the logK1H value of AMPDA-HB was higher by about 0.8 logK units, which could be explained by the H-bond formation between the basic phenolate -O¯ and the protonated nitrogen atom. For comparison, the protonation constants of EDTA and CDTA were also determined (Table 1 and Supplementary Materials). Interestingly, the logK1H values of AMPTA and AMPDA-HB ligands were 2 logK units higher than those of the CDTA and EDTA ligands, which could be explained by the formation of Na(CDTA) and Na(EDTA) complexes, which resulted in the lower first protonation constants of these hexadentate ligands (Na(CDTA): logKNaL = 4.66; Na(EDTA): logKNaL = 1.43) [28,29]. The logβ4H values, presented in Table 1, indicated that the total basicity of AMPDA-HB was about 8 orders of magnitude higher than that of AMPTA due to the presence of the very basic phenol group. However, the logβ4H value of pentadentate AMPTA was comparable with that of hexadentate CDTA and EDTA ligands and significantly higher than the other pentadentate DPAMeA and DPAPhA ligands.

2.2.2. Thermodynamic Properties of Mn(II) Complexes

The stability and protonation constants of the Mn(II) complexes that were formed with AMPTA, AMPDA-HB, EDTA and CDTA are defined by Equations (4) and (5):
K M L = [ M L ] [ M ] [ L ]
K M H i L = [ M H i L ] [ M H i 1 L ] [ H + ] · · · · · · i = 1 , 2
The stability and protonation constants of the Mn(II) complexes were calculated from the titration curves obtained at 1:1 metal-to-ligand concentration ratios. The best-fitting curve was obtained by using the model that included the formation of ML, MHL and MH2L species in equilibrium. The stability and protonation constants of the Mn(AMPTA), Mn(AMPDA-HB), Mn(EDTA) and Mn(CDTA) complexes obtained using pH potentiometric titration are presented in Table 2 and compared to those of Mn(DPAMeA) and Mn(DPAPhA) [15].
The stability constant of Mn(AMPTA) was about 2.5 logK units smaller than that of Mn(AMPDA-HB) due to the lower total basicity of the AMPTA ligand (logβ4H, Table 1). In contrast, the logKMnL values of Mn(AMPTA) and Mn(AMPDA-HB) were higher by 1–1.5 and 3–4 logK units than those of the Mn(II) complexes that were formed with the pentadentate DPAMeA and DPAPhA ligands, respectively. The higher stability constants of the Mn(AMPTA) and Mn(AMPDA-HB) complexes could be explained by the higher basicity of the nitrogen donor atoms in the ligand backbone. Interestingly, the stability constant of Mn(AMPDA-HB) was similar to that of the Mn(II) complexes of hexadentate EDTA and CDTA ligands due to the presence of the basic phenolate group in the AMPDA-HB ligand. To compare the conditional stabilities, the pMn values of the complexes were calculated for identical conditions, i.e., [Mn2+]tot = 1 μM, [L]tot = 10 μM, pH = 7.4. The pMn value of Mn(AMPTA) was higher by about 0.5 logK units than that of the Mn(II) complexes with the pentadentate AMPDA-HB, DPAMeA and DPAPhA ligands; this could be explained by the higher total basicity of the AMPTA ligand than those of DPAMeA and DPAPhA, whereas the lower pMn value of Mn(AMPDA-HB) was caused by the presence of the protonated Mn(HL) species in the pH range of 4–6. The protonation of Mn(AMPDA-HB) occurred on the phenolic -O group, as confirmed via spectrophotometric studies on the Mn2+-AMPDA-HB system (Figure S9). The pMn value of Mn(AMPTA) was significantly smaller than that of Mn(II) complexes that were formed with hexadentate EDTA and CDTA ligands due to the lower denticity of the AMPTA ligand (one carboxylate group less than EDTA and CDTA).

2.3. 1H and 17O NMR Relaxometric Studies

The proton relaxivity (r1) measures the enhancement of the relaxation rate of water proton nuclei in the presence of 1 mM paramagnetic agent solution. The relaxivity values for [Mn(AMPTA)] and [Mn(AMPDA-HB)] that were recorded at pH 7.4 (298 K, 20 MHz) were 3.3 and 3.4 mM−1 s−1, respectively. These values are in line with those reported for monohydrated Mn(II) complexes, such as [Mn(EDTA)]2− (3.3 mM−1 s−1) [9] and [Mn(DPAA)] (3.5 mM−1 s−1, Table 3). r1 values as a function of pH and the species distribution obtained with the equilibrium constants (Table 1 and Table 2) characterizing the Mn2+-AMPTA and Mn2+-AMPDA-HB systems are shown in Figure 4. The relaxivity of [Mn(AMPTA)]- remained constant in a broad pH range (ca. 5–11) and increased below pH 5 due to the dissociation of the Mn(II) complex (Figure 4). A different pH dependence of the r1 values was reported for [Mn(AMPDA-HB)]-, which showed a slight decrease in r1 from pH 6 to 11 (from 3.7 to 2.4 mM−1 s−1) and an increase in r1 below pH 6 due to the protonation of the Mn(II) complex, followed by Mn2+ dissociation at lower pH.
1H NMRD (proton nuclear magnetic relaxation dispersion) profiles of aqueous solutions of [Mn(AMPTA)] and [Mn(AMPDA-HB)] (Figure 5) were recorded at 298 and 310 K in the range of magnetic field strengths of 2.3 × 10⁻⁴ to 3.0 T, which corresponds to proton Larmor frequencies of 0.01–127 MHz. The NMRD profiles reproduced the typical shape of low molecular weight complexes in the fast water exchange regime, whose relaxivity was largely dominated by rotational dynamics. Moreover, the r1 values at 310 K were lower than those measured at 298 K over the entire range of investigated proton Larmor frequencies, indicating that r1 was not limited by the water exchange rate but rather by the fast rotational motion of the complex.
The NMRD profile at 298 K of the enantiomerically pure [Mn((R)-AMPTA)] was also acquired (Figure 5), which was exactly superimposable onto the NMRD profile of the racemic Mn(II) complex. Therefore, we can conclude that the two enantiomers did not exhibit substantial differences in terms of structural and relaxometric properties, as expected.
As proposed by Geraldes and Peters [30], the hydration number q can be determined by the correlation between the relaxivity measured at 0.01 MHz (and 298 K) and the molecular weight of the complex. For both [Mn(AMPTA)] and [Mn(AMPDA-HB)], the calculation gave q = 0.9, confirming the formation of monohydrated complexes in solution. This result appeared to contrast with the bis-hydration that was claimed for Mn complexes with pentadentate PAADA and DPAMeA ligands (Figure 1 and Table 3). We can assume that the heterocyclic piperidine ring hindered the coordination of a second water molecule more markedly than a flat pyridine ring.
In addition, the reduced transverse 17O NMR relaxation rates (1/T2r) and chemical shifts (Δωr) of [Mn(AMPTA)] and [Mn(AMPDA-HB)] were measured as a function of temperature to gain information on the exchange rate of the coordinated water molecule. The two complexes presented a slight increase in the 1/T2r value with decreasing temperature over the full temperature range, which is typical of systems under the fast exchange regime (Figure 6).
The simultaneous fit of the 1H NMRD and 17O NMR data (the equations used in the fitting are summarized in the Supplementary Materials) afforded the structural and dynamic molecular parameters shown in Table 3, which were compared to the parameters reported previously for related Mn(II) complexes. Some of the parameters were fixed during the fit: the distance of closest approach for the outer-sphere contribution aMnH at 3.6 Å; the distance between the Mn(II) ion and the proton nuclei of the coordinated water molecules (rMnH) at 2.83 Å; the diffusion coefficient D298 (2.24 × 10⁻⁵ cm2 s−1) and its activation energy ED (20 kJ mol−1) were fixed to common values, while the number of water molecules in the inner coordination sphere of Mn(II) was fixed to q = 1 (Table 3).
The water exchange rate that was obtained for [Mn(AMPTA)] and [Mn(AMPDA-HB)] (298tM = 1/kex = 1.8 ± 0.3 and 2.5 ± 0.3 ns, respectively) was fast, as already noted for the majority of Mn(II) complexes. The rotational correlation times (298τR) and the 17O hyperfine coupling constants (AO/ħ) for both complexes fell within the range that is typically observed for small Mn(II) complexes. Finally, the parameters that are related to the electron spin relaxation of the metal ion (the electronic correlation time for the modulation of the zero-field-splitting interaction τV and the mean square zero-field-splitting energy Δ2) were also similar to those obtained for other Mn(II) complexes (Table 3).

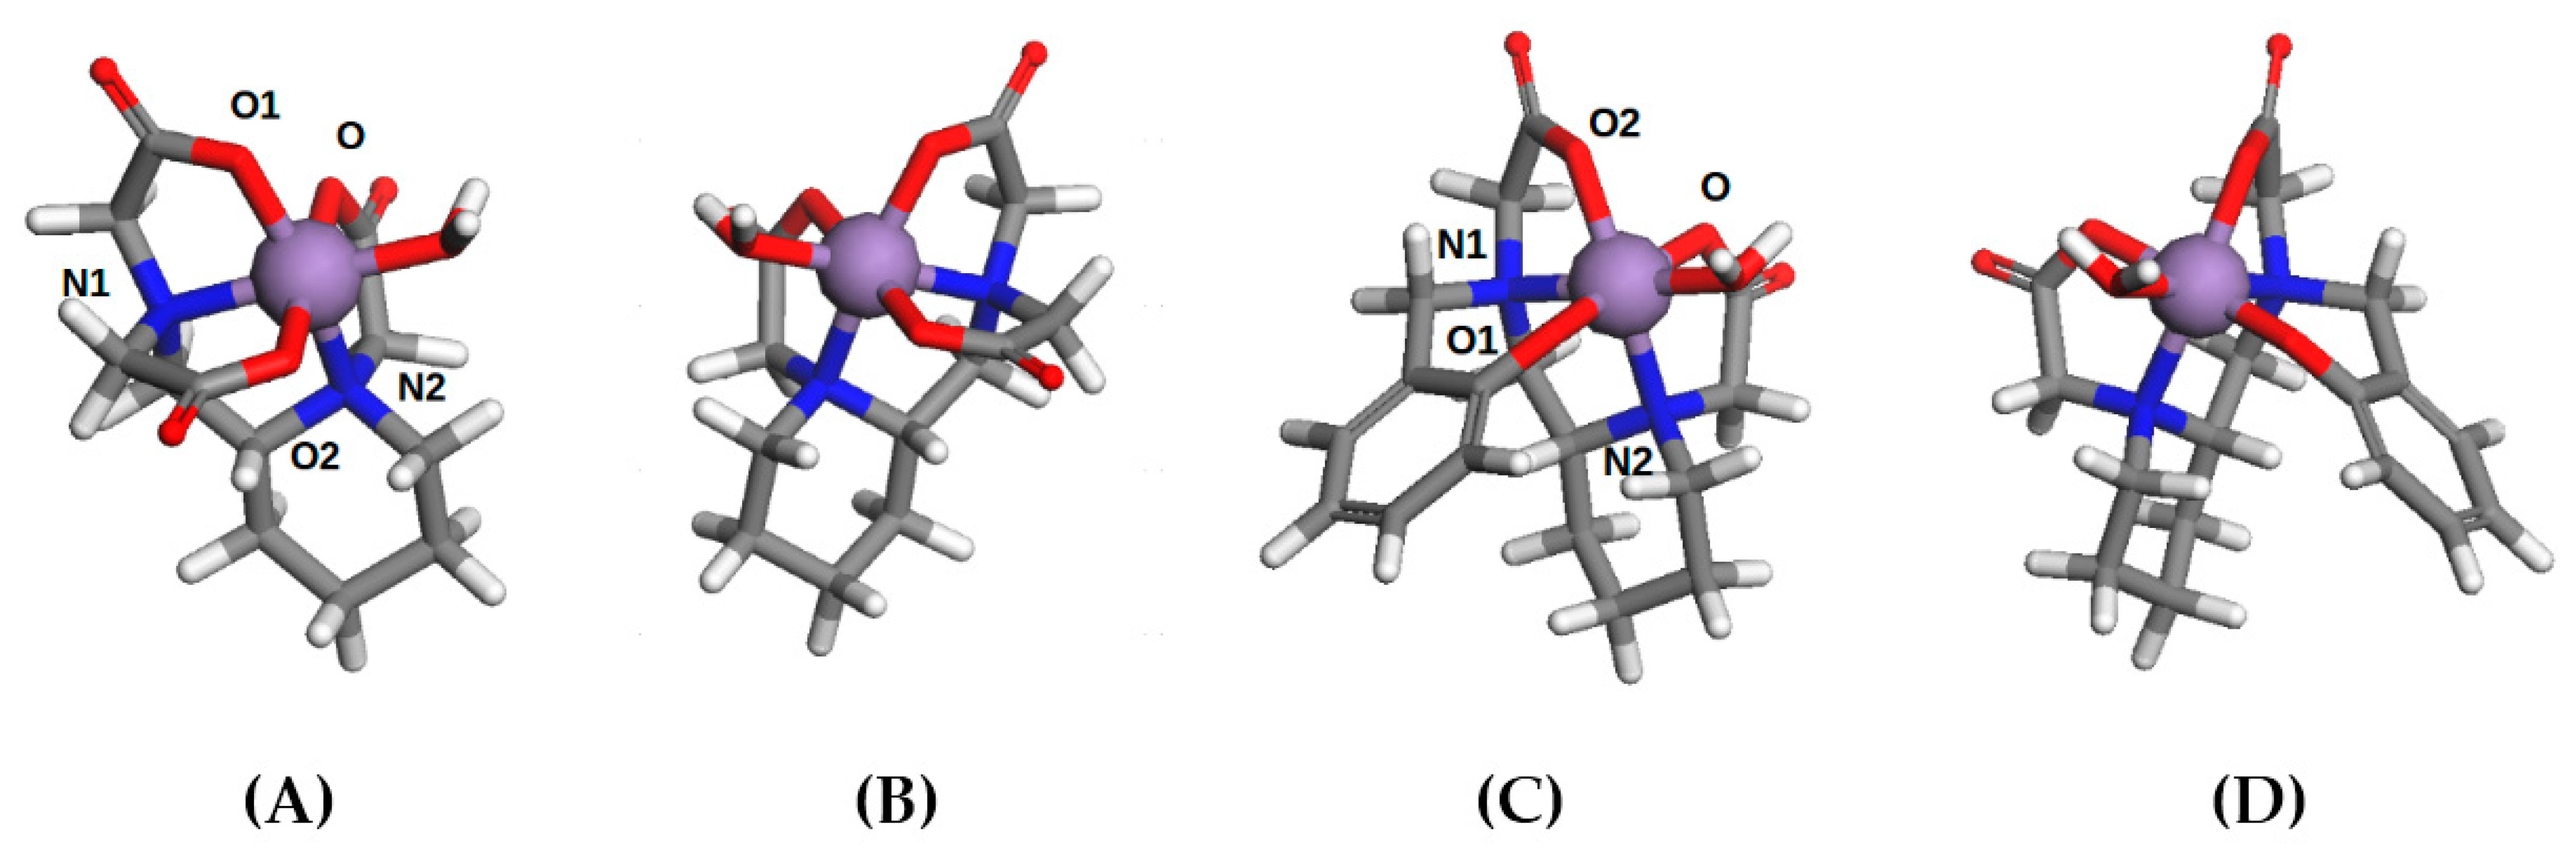
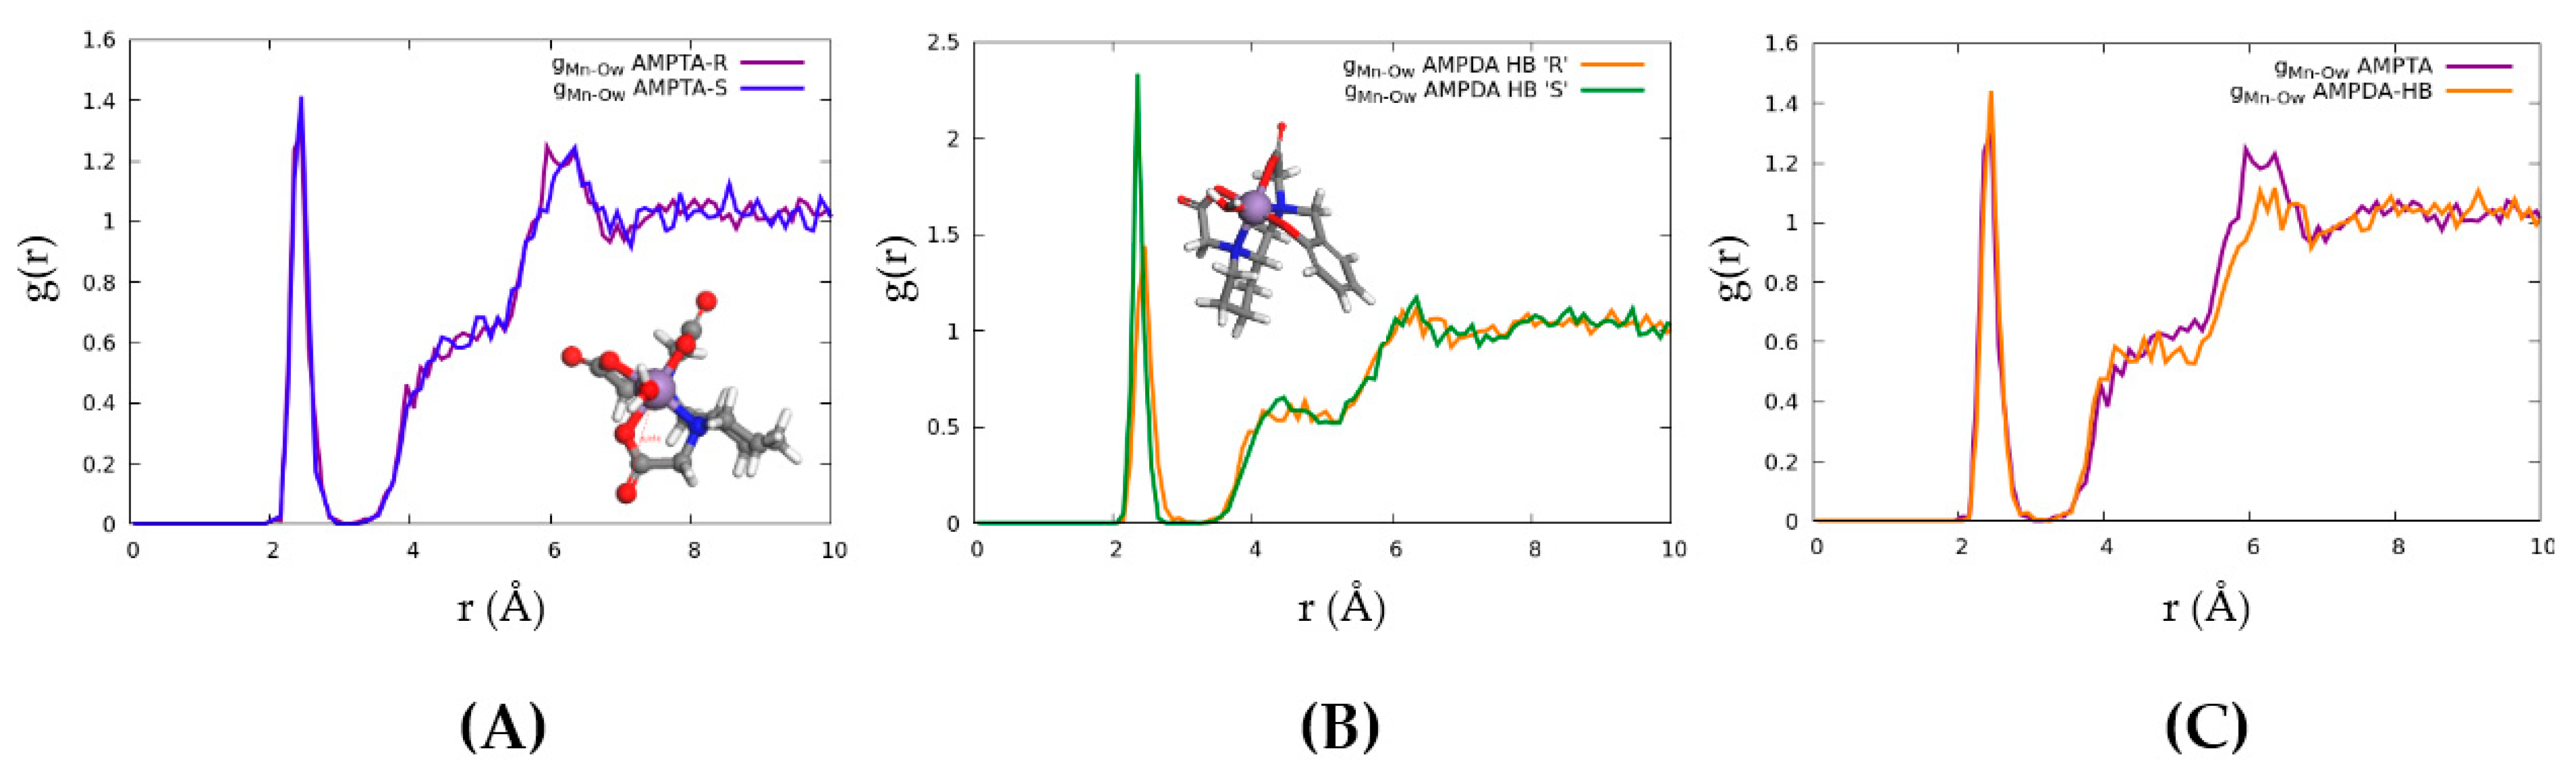
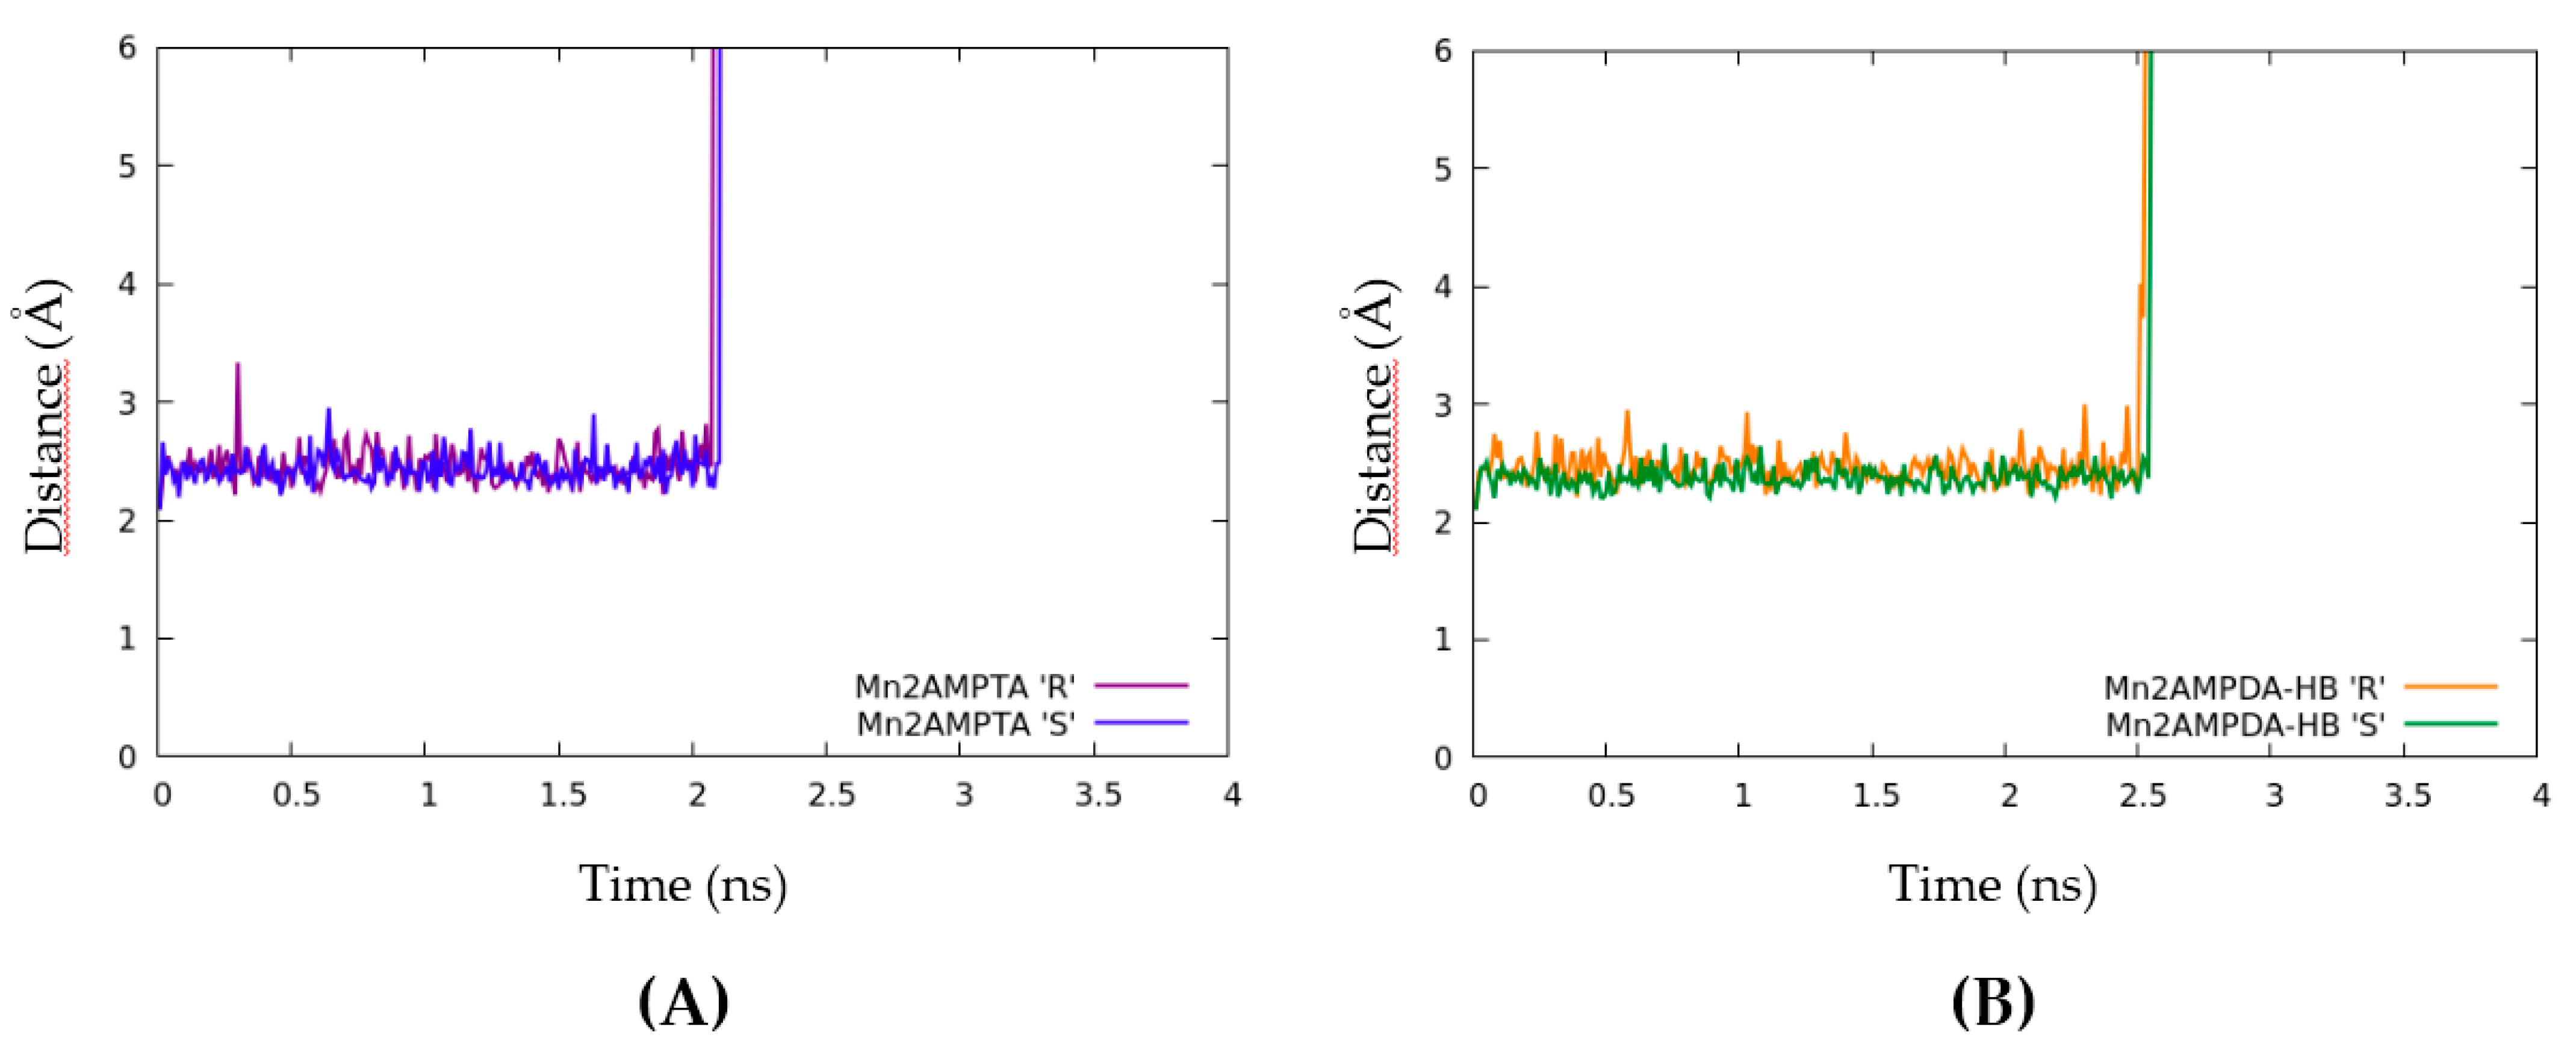
2.4. Computational Modelling

The geometries of [Mn((R/S)-AMPTA)·(H2O)] and [Mn((R/S)-AMPDA-HB·(H2O)] were optimized at the DFT level, where an octahedral coordination environment was found around the Mn2+ ion, as shown in Figure 7. The calculated bond distances from Mn2+ are reported in the Supplementary Materials (Tables S1 and S2): in particular, the coordinated water molecule was found at 2.093 Å in the AMPTA- and 2.103 Å in the AMPDA-HB complex.
Then, a series of MD simulations were performed on all the systems, in particular, to monitor the distance between the Mn(II) ion and the oxygen of the coordinated water molecule to estimate the residence time. The time evolution of the Mn–Owater distances for the two complexes are reported in Figure 8: from the computed dynamics, the residence time was 2.07 ns for [Mn((R/S)-AMPTA)·(H2O)] and 2.50 ns for [Mn((R/S)-AMPDA-HB·(H2O)]. The former result was in excellent agreement with the experimental τm discussed above (2.1 ns), and the model predicted that the phenolate group would strengthen the coordination bond of water to the metal, resulting in a longer residence time.
Some insights about the solvent microscopic structure around the complexes were provided by the radial distribution function (g) of water oxygen (Ow) relative to Mn(II), averaged over the MD configurations. In Figure 9, we report a comparison of g(Ow–Mn) for the two complexes: at large distances, g tended to unity, corresponding to the bulk value; for both complexes, a sharp peak due to the water molecule coordinated to Mn(II) is present at 2.1–2.5 Å, then a depletion region followed up to 4 Å, corresponding to the solute molecule excluded volume. Finally, a rather broad peak was detected around 6 Å, showing a weakly structured solvation shell around the complexes; this last peak was less pronounced in [Mn(AMPDA-HB)·(H2O)] due to the greater steric hindrance of the phenyl group.

3. Materials and Methods

All chemicals were purchased from commercial sources and were used without purification. Water was purified (18 MΩ cm) using a standard Milli-Q system (Millipore, Bedford, MA, USA). “PE” (petroleum ether) refers to petroleum ether with a boiling point in the range of 40–60 °C. NMR spectra (including 1H-decoupled 13C NMR) were recorded on a Bruker Avance III spectrometer (Bruker, Milano, Italy) operating at 11.74 T and 298 K, corresponding to a protonic resonance frequency of 499.8 MHz. 1H and 13C NMR chemical shifts are reported relative to TMS and are referenced using the residual proton solvent resonances. Samples were prepared in 5 mm NMR tubes by dissolving the compounds in appropriate deuterated solvents. Splitting patterns are described as singlet (s), broad singlet (bs), doublet (d), double doublet (dd), triplet (t) or multiplet (m). ESI mass spectra were recorded on a Waters SQD 3100 (Waters Corporation, Milford, MA, USA). Analytical HPLC-MS was carried out on a Waters modular system equipped with Waters 1525 binary pump, Waters 2487 UV/Vis and Waters SQD 3100 (ESCI ionization mode) detectors using an XBridgeTM Phenyl 3.5 μm 4.6 mm × 150 mm column (Waters). Semi-preparative HPLC purifications were performed with a XBridgeTM Prep Phenyl 5 μm OBDTM 19 mm × 100 mm column (Waters). The HPLC methods are indicated for each procedure (Table 4).

3.1. Synthesis

3.1.1. Synthesis of 2-(Methoxymethoxy)benzaldehyde (1)

Salicylaldehyde (1.00 mL, 9.58 mmol) was added to a 2.1 M solution of MOM-Cl in toluene (9 mL, 19.16 mmol), followed by DIPEA (2.08 mL, 11.97 mmol), and the mixture was stirred at room temperature for 3 h. Then, 1 M NH4Cl (3 mL) was added and stirring was continued for a further 10 min; the reaction mixture was transferred into a separatory funnel, where the organic phase was separated and the water phase was extracted with EtOAc (5 mL). The combined organic phases were washed with saturated NaHCO3 (5 mL) and H2O (5 mL), dried over anhydrous MgSO4, filtered and evaporated under vacuum. Pale yellow oil: 1.3 g (81%).
1H-NMR (500 MHz, 25 °C, CDCl3), δ (ppm): 10.51 (CHO), 7.84 (dd, 3JHH = 7.7 Hz, 4JHH = 1.7 Hz, CHAr), 7.52 (dt, 3JHH = 8.5 Hz, 4JHH = 1.7 Hz, CHAr), 7.22 (d, 3JHH = 8.5 Hz, 1H, CHAr), 7.08 (t, 3JHH = 7.7 Hz, 1H, CHAr), 5.31 (s, 2H, OCH2O), 3.53 (s, 3H, CH3). 13C NMR (125 MHz, 25 °C, CDCl3), δ (ppm): 189.7 (CHO), 159.7 (COCH2), 135.9 (CHAr), 128.4 (CHAr), 125.5 (CCHO), 121.9 (CHAr), 115.1 (CHAr), 94.6 (CH2), 56.5 (CH3).

3.1.2. Synthesis of 2-(N-(2-(Methoxymethoxy)benzyl)aminomethyl)piperidine (2)

2-Aminomethylpiperidine (1 mL, 8.24 mmol) was dissolved in dry MeOH (20 mL), AcOH (2 drops) was added, followed by intermediate 1 (1.37 g, 8.24 mmol), which was also dissolved in dry MeOH (5 mL) and added dropwise to the previous solution. The resulting yellow mixture was stirred at room temperature for 1 h, then NaBH4 (1.50 g, 39.65 mmol) was added portion-wise at 0 °C and the mixture was stirred for a further 2 h while turning colorless. H2O (1 mL) was added and the suspension was agitated for 30 min before removing the solvents under reduced pressure. The residue was suspended in EtOH (20 mL), stirred for 30 min and filtered. The filtrate was dried under vacuum, leading to the crude product as a yellow oil (1.57 g, 72%).
1H-NMR (500 MHz, 25 °C, CDCl3), δ (ppm): 7.26 (d, 3JHH = 7.7 Hz, 1H, CHAr), 7.21 (t, 3JHH = 7.7 Hz, 1H, CHAr), 7.08 (d, 3JHH = 7.7 Hz, 1H, CHAr), 6.97 (t, 3JHH = 7.7 Hz, 1H, CHAr), 5.22 (s, 2H, OCH2O), 3.80 (s, 2H, NCH2Ar), 3.49 (s, 3H, CH3), 3.06 (m, 1H, CHCHH’N), 2.6–2.5 (m, 3H, CHCHH’N + NCHH’CH2 + CHCH2N), 2.47 (m, 1H, NCHH’CH2), 1.95 (bs, 1H, NH), 1.79 (m, 1H, NCH2CHH’), 1.58 (m, 2H, CHCHH’CHH’), 1.5–1.3 (m, 2H, NCH2CHH’ + CHCHH’CH2), 1.09 (m, 1H, CHCH2CHH’). 13C NMR (125 MHz, 25 °C, CDCl3), δ (ppm): 149.7 (COCH2), 129.9 (CHAr), 129.3 (CCH2), 128.2 (CHAr), 121.6 (CHAr), 113.9 (CHAr), 94.4 (OCH2O), 56.5 (CH3), 56.1 (NCH), 55.1 (NCH2CH2), 49.3 (NCH2Ar), 46.7 (CHCH2N), 30.8 (CHCH2CH2), 26.6 (CHCH2CH2), 24.7 (NCH2CH2). ESI+ MS: m/z 265.1 [M + H+], calc. for [C15H25N2O5]+ = 265.19 g/mol.

3.1.3. Synthesis of 2-(N-(2-(Methoxymethoxy)benzyl)aminomethyl)piperidine-N,N′-di-tert-butyl acetate (3)

Intermediate 2 (0.22 g, 0.83 mmol) was dissolved in CH3CN (10 mL). Na2CO3 (0.26 g, 2.49 mmol) and was added, followed by tert-butyl bromoacetate (0.49 mL, 3.32 mmol), and the mixture was stirred at room temperature overnight. The solvent was evaporated under reduced pressure and the residue was suspended in EtOAc (20 mL) and washed with H2O (2 × 10 mL) and brine (10 mL). The organic phase was dried over anhydrous MgSO4, filtered and evaporated under vacuum, and the product was obtained as a pale yellow oil (0.33 g, 82%).
1H-NMR (500 MHz, 25 °C, CDCl3), δ (ppm): 7.36 (dd, 3JHH = 7.5 Hz, 4JHH = 1.5 Hz, 1H, CHAr), 7.18 (m, 1H, CHAr), 7.07 (d, 3JHH = 8.2 Hz, 4JHH = 1.0 Hz, 1H, CHAr), 6.95 (m, 1H, CHAr), 5.18 (d, 2JHH = 6.7 Hz, 1H, OCHH’O), 5.16 (d, 2JHH = 6.7 Hz, 1H, OCHH’O), 3.83 (d, 2JHH = 13.7 Hz, NCHH’Ar), 3.78 (d, 2JHH = 13.7 Hz, NCHH’Ar), 3.47 (m, 5H, NCH2CO + OCH3), 3.24 (d, 2JHH = 16.9 Hz, 1H, NCHH’CO), 3.19 (d, 2JHH = 16.9 Hz, 1H, NCHH’CO), 2.95 (dd, 2JHH = 13.1 Hz, 3JHH = 5.1 Hz, 1H, CHCHH’N), 2.78 (m, 2H, NCH + NCHH’CH2), 2.64 (dd, 2JHH = 13.1 Hz, 3JHH = 5.8 Hz, 1H, CHCHH’N), 2.55 (m, 1H, NCHH’CH2), 1.83 (m, 1H, CHCH2CHH’), 1.65 (m, 1H, NCH2CHH’), 1.55 (m, 1H, CHCH2CH2), 1.45 (s, 9H, 3 × CH3tBu), 1.42 (s, 9H, 3 × CH3tBu), 1.28 (m, 2H, NCH2CHH’ + CHCH2CHH’). 13C NMR (125 MHz, 25 °C, CDCl3), δ (ppm): 170.9 (C=O), 155.7 (COCH2), 130.9 (CHAr), 128.2 (CHAr), 127.8 (CCH2), 121.5 (CHAr), 114.1 (CHAr), 94.5 (OCH2O), 80.6 (CtBu), 57.9 (CHCH2N), 57.4 (NCH), 56.1 (NCH2CO), 56.0 (OCH3), 55.3 (NCH2CO), 53.5 (NCH2CH2), 52.6 (NCH2Ar), 30.9 (CHCH2CH2), 28.1 (CH3tBu), 25.7 (CHCH2CH2), 23.7 (NCH2CH2). ESI+ MS: m/z 493.4 [M + H+] (calc. for [C27H45N2O6]+: 493.33 g/mol).

3.1.4. Synthesis of AMPDA-HB

Intermediate 3 (0.33 g, 0.67 mmol) was dissolved in TFA (3 mL) and the mixture was stirred at room temperature for 3 h. The solvent was evaporated under reduced pressure and the residue was dissolved again in TFA (1 mL) and precipitated in Et2O (10 mL). The suspension was centrifuged (4000 rpm, 15 min, 10 °C) and the precipitate was washed/centrifuged with Et2O (3 × 10 mL) and dried under vacuum. The product was purified using semi-preparative HPLC-MS and obtained after lyophilization as a white monotrifluoroacetate salt (0.16 g, 53%).
The characterization data (HPLC MS, 1H and 13C NMR) were in agreement with those previously reported [18].

3.1.5. Synthesis of (R)-2-(Aminomethyl)piperidine (6)

Amide 5 (0.54 g, 4.22 mmol) was dissolved in dry THF (2 mL) and a 2 M solution of LiAlH4 in THF (6.33 mL, 12.66 mmol) was added at 0 °C. After stirring for 10 min, the mixture was heated to reflux for 3 h; then it was left to cool down to room temperature and the flask was placed in an ice bath. H2O (1 mL) was added dropwise slowly and the resulting suspension was stirred for a further 30 min and then filtered. After removal of the solvents from the filtrate under reduced pressure, the residue was suspended in EtOAc (20 mL) and filtered again, where the filtrate was dried over anhydrous MgSO4, filtered and evaporated under vacuum, leading to the intended compound 6 as a white solid (0.42 g, 87%).
The characterization data (ESI MS, 1H and 13C NMR) were consistent with those obtained from the commercial racemic analogous compound.

3.1.6. Synthesis of (R)-2-(Aminomethyl)piperidine-N,N′,N′-tri-tert-butyl acetate (7)

Intermediate 6 (0.072 g, 0.63 mmol) was dissolved in MeCN (5 mL). K2CO3 (0.39 g, 2.84 mmol) was added, followed by tert-butyl bromoacetate (0.42 mL, 2.84 mmol), and the mixture was stirred at 50 °C overnight. The solvent was evaporated under reduced pressure and the residue was suspended in EtOAc (10 mL) and washed with H2O (2 × 5 mL) and brine (5 mL). The organic phase was dried over anhydrous MgSO4, filtered and evaporated under vacuum. The crude product was purified using flash chromatography (SiO2, PE/EtOAC 90:10→60:40, Rf80:20 = 0.22), leading to the intended compound as a pale yellow oil (0.21 g, 74%).
The characterization data (ESI MS, 1H and 13C NMR) were consistent with those reported for the analogous racemic compound [18].

3.1.7. Synthesis of (R)-2-AMPTA

Intermediate 7 (0.29 g, 0.63 mmol) was dissolved in DCM (5 mL). TFA (5 mL) was added and the mixture was stirred at rt for 15 h. The solvents were evaporated under reduced pressure and the residue was dissolved again in TFA (1 mL) and precipitated in Et2O (10 mL). The suspension was centrifuged (4000 rpm, 15 min, 10 °C) and the precipitate was washed/centrifuged with Et2O (3 × 10 mL). The product was purified using semi-preparative HPLC-MS, and the product was obtained as a white solid (54 mg, 30%).
The characterization data (ESI MS, 1H and 13C NMR) were consistent with those reported for the analogous racemic compound [18].

3.2. Equilibrium Measurements

The chemicals used for the experiments were of the highest analytical grade. The MnCl2 solutions were prepared from MnCl2·4H2O (Sigma, St. Louis, MI, USA; 99.9%). The concentration of the MnCl2 solution was determined via complexometric titration with standardized Na2H2EDTA and eriochrome black T as the indicator. The concentrations of the H3AMPTA, H2AMPDA-HB, H4CDTA (Sigma, 99.9 %) and H4EDTA (Sigma, 99.9%) were determined using pH potentiometric titration in the presence and absence of a large (40-fold) excess of CaCl2. The pH potentiometric titrations were made with standardized 0.2 M NaOH.
The stability and protonation constants of the Mn(II) complexes formed with AMPTA, AMPDA-HB, EDTA and CDTA ligands were determined using pH potentiometric studies. For the pH measurements and titrations, a Metrohm 888 Titrando automatic titration workstation combined electrode (Metrohm-6.0234.110, Metrohm, Herisau, Switzerland) was used. Equilibrium measurements were carried out at a constant ionic strength (0.15 M NaCl) in 6 mL samples at 25 °C. The solutions were stirred and N2 was bubbled through them. The titrations were made in the 1.7–12.0 pH range. KH-phthalate (pH = 4.008) and borax (pH = 9.180) buffers were used to calibrate the pH meter. For the calculation of [H+] from the measured pH values, the method proposed by Irving et al. [31] was used as follows: a 0.01 M HCl solution was titrated with standardized NaOH solution at 0.15 M NaCl ionic strength; the differences (A) between the measured (pHread) and calculated pH (−log[H+]) values were used to obtain the equilibrium H+ concentration from the pH values measured in the titration experiments (A = 0.03). The waiting time between the two pH measurements was 60 sec. For the equilibrium calculations, the stoichiometric water ionic product (pKw) was also needed to calculate [OH] values under basic conditions. The VNaOH–pHread data pairs of the HNO3-NaOH titration obtained in the pH range 10.5–12.0 were used to calculate the pKw value (pKw = 13.85).
The protonation of the AMPDA-HB and the formation of the Mn(AMPDA-HB) complex were followed by spectrophotometric studies of the AMPDA-HB ligand and Mn2+-AMPDA-HB system at the absorption band of the phenyl group in the wavelength range of 210–350 nm. The concentrations of Mn2+ and AMPDA-HB were 0.1 mM. The absorption spectra of the AMPDA-HB ligand and Mn2+-AMPDA-HB solutions were recorded in the pH range of 2.0–12.5. All spectrophotometric measurements were performed at 25 °C in 0.15 M NaCl solution. The pH was adjusted via the stepwise addition of concentrated NaOH or HCl solutions. The spectrophotometric measurements were made with the use of a PerkinElmer Lambda 365 UV-Vis spectrophotometer (PerkinElmer, Waltham, MA, USA) using 1.0 cm cells. The protonation and stability constants were calculated with the PSEQUAD program [32].
The protonation process of the H3AMPTA ligand was also followed by 1H NMR spectroscopy. For these experiments, a 0.01 M solution of the ligand in D2O was prepared in the presence of 0.15 M NaCl. The pH was adjusted via the stepwise addition of a solution of NaOD or DCl (both prepared in D2O). The pH values reported for the ligand were corrected for the deuterium effect by using the relationship pD = pH + 0.4 [33]. The calculations were performed using the computer program Micromath Scientist, version 2.0 (Salt Lake City, UT, USA).

3.3. 1H NMRD and 17O NMR Measurements

The Mn2+ complexes were prepared by mixing solutions of MnCl2 and the ligand (in ca. 5% molar excess) and adjusting the pH to 7.4 with HCl or NaOH. The exact concentration of the aqueous solutions for the 1H NMRD and 17O NMR measurements was determined by measuring the bulk magnetic susceptibility shifts of the t-BuOH 1H NMR signal at 11.7 T [34]. Proton relaxation measurements (1/T1) and the resulting 1/T1 NMRD profiles were measured on a Fast-Field Cycling (FFC) Stelar SmarTracer Relaxometer (Stelar s.r.l., Mede (PV), Italy) over a continuum of magnetic field strengths from 0.00024 to 0.25 T (corresponding to 0.01–10 MHz proton Larmor frequencies). The relaxometer operates under computer control with an absolute uncertainty in 1/T1 of ±1%. Precise control of the temperature was achieved during the measurements by means of a Stelar VTC-91 airflow heater equipped with a calibrated copper-constantan thermocouple (uncertainty of ± 0.1 °C). Furthermore, the real temperature inside the probe head was additionally monitored using a Fluke 52 k/j digital thermometer (Fluke, Zürich, Switzerland). Additional data in the 20–120 MHz frequency range were obtained with a High Field Relaxometer (Stelar) equipped with the HTS-110 3T Metrology Cryogen-free Superconducting Magnet. The data were collected using the standard inversion recovery sequence (20 experiments, 2 scans) with a typical 90° pulse width of 3.5 ms, and the reproducibility of the data was within ± 0.5%.
17O NMR spectra were recorded on a Bruker Avance III spectrometer (11.7 T) equipped with a 5 mm probe and a standard temperature control unit. Aqueous solutions of the complexes (ca. 6–10 mM) containing 2.0% of the 17O isotope (Cambridge Isotope) were used. The observed transverse relaxation rates were calculated from the signal width at half-height as a function of temperature in the 278–350 K range.

3.4. Theoretical Models

DFT optimizations were performed with the NWCHEM program with the hybrid functional B3LYP [35]. For all atoms, the Ahlrichs’ cc-pVDZ basis set was used [36]. Solvent effects were included with the implicit conductor-like screening model (COSMO) with the water dielectric constant (ε = 78.4) [37]; dispersion energies were obtained with the semi-empirical approach proposed by Grimme [38].
MD simulations were performed with the LAMMPS software package [39] using the UFF force field [40]. The starting geometries of the metal complexes were obtained using DFT calculations, while the partial atomic charges were obtained with the ‘Qeq’ package implemented in Material Studio suite, using a convergence limit of 1.0 × 10⁻⁶ e (Material Studio 6.0; Accelrys Software Inc., San Diego, CA, 2011). We used the TIP3P model of Price et al. [41] to describe the solvent, fixing the atomic parameters of water molecules using the SHAKE procedure [42]. For each system, the solute molecule was immersed in a 25 Å × 25 Å × 25 Å cubic periodic box using the Packmol package to obtain a solution density of about 1.01 g/mL [43]. One Na+ counterion was added to neutralize the negative charge of the Mn complex. Van der Waals parameters for Na, optimized for the TIP3P model, were taken from the published work of Joung et al. [44]. During each MD, the first 5 ps of the NVE simulation was performed by allowing only water molecules to move, followed by a 4 ns NVT run at 298 K. The temperature was conserved using the Nosé–Hoover thermostat.

4. Conclusions

The Mn(II) complexes of two pentadentate ligands based on the (2-aminomethyl)-piperidine structure were investigated using potentiometry, spectrophotometry, 1H and 17O NMR relaxometry and DFT calculations. In particular, the ligand containing three acetate pendant arms (AMPTA) showed the lower overall basicity but higher stability of the Mn complex (pMn = 7.89), whereas the ligand with two acetate and one 2-hydroxybenzyl pendants (AMPDA-HB) showed the higher total basicity but lower stability of the metal complex due to the protonation of the phenol group at pH < 6 (pMn = 7.07). Both Mn complexes were mono-hydrated with relaxivities in the order of 3.3–3.4 mM−1 s−1 (at 20 MHz and 298 K). The water exchange rate for both complexes was very fast, with τM values around 2–2.5 ns; these values were confirmed using molecular dynamics calculations. Finally, DFT calculations allowed for confirming the octahedral coordination geometries for both Mn complexes.
The present contribution expands the library of Mn-based chelates that are characterized in the context of MRI contrast agents as an alternative to the classical Gd(III) complexes, with the aim of obtaining improved and more reliable information on the correlation between solution structure and molecular relaxation parameters.

Supplementary Materials

The following are available online, Table S1: Calculated bond distances for Mn complexes with AMPTA, Table S2: Calculated bond distances for Mn complexes with AMPDA-HB, Figure S1: 1H-NMR spectrum in CDCl3 of protected salicylaldehyde 1, Figure S2: 13C-NMR spectrum in CDCl3 of protected salicylaldehyde 1, Figure S3: 1H-NMR spectrum in CDCl3 of intermediate 2, Figure S4: 13C NMR spectrum in CDCl3 of intermediate 2, Figure S5: 1H NMR spectrum in CDCl3 of intermediate 3, Figure S6: 13C-NMR spectrum in CDCl3 of intermediate 3, Figure S7: ESI+ MS, UV and specific ion HPLC chromatograms of AMPDA-HB prepared according to the new method, Figure S8: ESI+ MS, UV and specific ion HPLC chromatograms of (R)-AMPTA, Figure S9: Absorption spectra and absorbance values at 295 nm of the Mn2+-AMPDA-HB system as a function of pH, Figure S10: Species distribution and relaxivity values of the Mn2+-CDTA system as a function of pH.

Author Contributions

Conceptualization, L.T.; methodology, L.T. and J.M.; synthesis and characterization, J.M. and E.C.; validation, J.M. and L.T.; relaxometry, L.T. and J.M.; equilibrium study, Z.B. and E.C.; computational modeling, A.F. and M.C.; writing—original draft preparation, J.M., L.T., Z.B. and M.C.; writing—review and editing, L.T. and J.M.; supervision, L.T. and M.C.; funding acquisition, L.T. All authors have read and agreed to the published version of the manuscript.

Funding

This research was funded by the University of Piemonte Orientale (Ricerca Locale 2019).

Institutional Review Board Statement

Not applicable.

Informed Consent Statement

Not applicable.

Data Availability Statement

The data are available on request from the corresponding author.

Conflicts of Interest

The authors declare no conflict of interest.

Sample Availability

Samples of the compounds are not available from the authors.

References

  1. O’Neal, S.L.; Zheng, W. Manganese Toxicity Upon Overexposure: A Decade in Review. Curr. Environ. Health Rep. 2015, 2, 315–328. [Google Scholar] [CrossRef] [Green Version]
  2. Yang, L.; Krefting, I.; Gorovets, A.; Marzella, L.; Kaiser, J.; Boucher, R.; Rieves, D. Nephrogenic Systemic Fibrosis and Class Labeling of Gadolinium-based Contrast Agents by the Food and Drug Administration. Radiology 2012, 265, 248–253. [Google Scholar] [CrossRef]
  3. Botta, M.; Carniato, F.; Esteban-Gomez, D.; Platas-Iglesias, C.; Tei, L. Mn(II) compounds as an alternative to Gd-based MRI probes. Future Med. Chem. 2019, 11, 1461–1483. [Google Scholar] [CrossRef]
  4. Schwert, D.D.; Davies, J.A.; Richardson, N. Non-gadolinium-based MRI contrast agents. In Contrast Agents I: Magnetic Resonance Imaging; Springer: Berlin, Germany, 2002; Volume 221, pp. 165–199. ISBN 0340-10223-540-42247-1. [Google Scholar]
  5. Bock, N.A.; Silva, A.C. Manganese: A unique neuroimaging contrast agent. Future Neurol. 2007, 2, 297–305. [Google Scholar] [CrossRef]
  6. Caravan, P.; Farrar, C.T.; Frullano, L.; Uppal, R. Influence of molecular parameters and increasing magnetic field strength on relaxivity of gadolinium- and manganese-based T1 contrast agents. Contrast Media Mol. Imaging 2009, 4, 89–100. [Google Scholar] [CrossRef] [PubMed] [Green Version]
  7. Kubicek, V.; Toth, E. Design and Function of Metal Complexes as Contrast Agents in Mri. In Advances in Inorganic Chemistry, Volume 61: Metal Ion Controlled Reactivity; Academic Press: San Diego, CA, USA, 2009; pp. 63–129. ISBN 0898-8838978-0-12-375033-4. [Google Scholar]
  8. Elizondo, G.; Fretz, C.J.; Stark, D.D.; Rocklage, S.M.; Quay, S.C.; Worah, D.; Tsang, Y.M.; Chen, M.C.; Ferrucci, J.T. Ferrucci. Preclinical evaluation of MnDPDP: New paramagnetic hepatobiliary contrast agent for MR imaging. Radiology 1991, 178, 73–78. [Google Scholar] [CrossRef] [PubMed]
  9. Rolla, G.A.; Platas-Iglesias, C.; Botta, M.; Tei, L.; Helm, L. 1H and 17O NMR Relaxometric and Computational Study on Macrocyclic Mn(II) Complexes. Inorg. Chem. 2013, 52, 3268–3279. [Google Scholar] [CrossRef] [PubMed]
  10. Forgács, A.; Tei, L.; Baranyai, Z.; Tóth, I.; Zékány, L.; Botta, M. A Bisamide Derivative of [Mn(1,4-DO2A)]—Solution Thermodynamic, Kinetic, and NMR Relaxometric Studies. Eur. J. Inorg. Chem. 2016, 1165–1174. [Google Scholar] [CrossRef]
  11. Garda, Z.; Molnár, E.; Hamon, N.; Barriada, J.L.; Esteban-Gómez, D.; Váradi, B.; Nagy, V.; Pota, K.; Kálmán, F.K.; Tóth, I.; et al. Complexation of Mn(II) by Rigid Pyclen Diacetates: Equilibrium, Kinetic, Relaxometric, Density Functional Theory, and Superoxide Dismutase Activity Studies. Inorg. Chem. 2021, 60, 1133–1148. [Google Scholar] [CrossRef]
  12. Devreux, M.; Henoumont, C.; Dioury, F.; Boutry, S.; Vacher, O.; Elst, L.V.; Port, M.; Muller, R.N.; Sandre, O.; Laurent, S. Mn2+ Complexes with Pyclen-Based Derivatives as Contrast Agents for Magnetic Resonance Imaging: Synthesis and Relaxometry Characterization. Inorg. Chem. 2021, 60, 3604–3619. [Google Scholar] [CrossRef]
  13. Kálmán, F.K. and Tircsó, G. Kinetic inertness of the Mn2+ complexes formed with AAZTA and some open-chain EDTA derivatives. Inorg. Chem. 2012, 51, 10065–10067. [Google Scholar] [CrossRef] [Green Version]
  14. Gale, E.M.; Atanasova, I.P.; Blasi, F.; Ay, I.; Caravan, P. A Manganese Alternative to Gadolinium for MRI Contrast. J. Am. Chem. Soc. 2015, 137, 15548–15557. [Google Scholar] [CrossRef] [Green Version]
  15. Vágner, A.; Gianolio, E.; Aime, S.; Maiocchi, A.; Tóth, I.; Baranyai, Z.; Tei, L. High kinetic inertness of a bis-hydrated Gd-complex with a constrained AAZTA-like ligand. Chem. Commun. 2016, 52, 11235–11238. [Google Scholar] [CrossRef] [Green Version]
  16. Forgács, A.; Pujales-Paradela, R.; Regueiro-Figueroa, M.; Valencia, L.; Esteban, D.; Botta, M.; Platas-Iglesias, C. Platas-Iglesias. Developing the family of picolinate ligands for Mn2+ complexation. Dalt. Trans. 2017, 46, 1546–1558. [Google Scholar] [CrossRef] [Green Version]
  17. Pujales-Paradela, R.; Carniato, F.; Uzal-Varela, R.; Brandariz, I.; Iglesias, E.; Platas-Iglesias, C.; Botta, M.; Esteban-Gómez, D. A pentadentate member of the picolinate family for Mn(ii) complexation and an amphiphilic derivative. Dalt. Trans. 2019, 48, 696–710. [Google Scholar] [CrossRef]
  18. Russelli, L.; Martinelli, J.; De Rose, F.; Reder, S.; Herz, M.; Schwaiger, M.; Weber, W.; Tei, L.; D’Alessandria, C. Room Temperature Al18F Labeling of 2-Aminomethylpiperidine-Based Chelators for PET Imaging. ChemMedChem 2020, 15, 284–292. [Google Scholar] [CrossRef] [PubMed]
  19. Esteves, C.V.; Madureira, J.; Lima, L.M.P.; Mateus, P.; Bento, I.; Delgado, R. Copper(II) and Gallium(III) Complexes of trans-Bis(2-hydroxybenzyl) Cyclen Derivatives: Absence of a Cross-Bridge Proves Surprisingly More Favorable. Inorg. Chem. 2014, 53, 4371–4386. [Google Scholar] [CrossRef] [PubMed]
  20. Tsionou, M.I.; Knapp, C.E.; Foley, C.A.; Munteanu, C.R.; Cakebread, A.; Imberti, C.; Eykyn, T.R.; Young, J.D.; Paterson, B.M.; Blower, P.J.; et al. Comparison of macrocyclic and acyclic chelators for gallium-68 radiolabelling. Rsc Adv. 2017, 7, 49586–49599. [Google Scholar] [CrossRef] [PubMed] [Green Version]
  21. Woods, M.; Kiefer, G.E.; Bott, S.; Castillo-Muzquiz, A.; Eshelbrenner, C.; Michaudet, L.; McMillan, K.; Mudigunda, S.D.K.; Grin, D.; Tircso, G.; et al. Synthesis, Relaxometric and Photophysical Properties of a New pH-Responsive MRI Contrast Agent: The Effect of Other Ligating Groups on Dissociation of a p-Nitrophenolic Pendant Arm. J. Am. Chem. Soc. 2004, 126, 9248–9256. [Google Scholar] [CrossRef] [PubMed] [Green Version]
  22. Enel, M.; Leygue, N.; Balayssac, S.; Laurent, S.; Galaup, C.; Elst, L.V.; Picard, C. Picard. New polyaminocarboxylate macrocycles containing phenolate binding units: Synthesis, luminescent and relaxometric properties of their lanthanide complexes. Dalt. Trans. 2017, 46, 4654–4668. [Google Scholar] [CrossRef] [PubMed]
  23. Berliner, M.A.; Belecki, K. Simple, Rapid Procedure for the Synthesis of Chloromethyl Methyl Ether and Other Chloro Alkyl Ethers. J. Org. Chem. 2005, 70, 9618–9621. [Google Scholar] [CrossRef]
  24. Dawidowski, M.; Herold, F.; Wilczek, M.; Kleps, J.; Wolska, I.; Turło, J.; Chodkowski, A.; Widomski, P.; Bielejewska, A. The synthesis and conformational analysis of optical isomers of 4-phenyl-perhydropyrido[1,2-a]pyrazine-1,3-dione: An example of ‘solid state–frozen’ dynamics in nitrogen-bridged bicyclic 2,6-diketopiperazines. Tetrahedron Asymmetry 2009, 20, 1759–1766. [Google Scholar] [CrossRef]
  25. Pagano, J.M.; Goldberg, D.E.; Fernelius, W.C. A thermodynamic study of homopiperazine, piperazine and N-(2-aminoethyl)-piperazine and their complexes with copper(II) ion. J. Phys. Chem. 1961, 65, 1062–1064. [Google Scholar] [CrossRef]
  26. Beck, N.T.; Nagypal, I. Chemistry of Complex Equilibria; Akadémia Kiadó Budapest and Nostrand Reinhold Company: London, UK, 1990. [Google Scholar]
  27. Kimura, E.; Koike, T.; Uenishi, K.; Hediger, M.; Kuramoto, M.; Joko, S.; Arai, Y.; Kodama, M.; Iitaka, Y. New-dimensional cyclam. Synthesis, crystal structure, and chemical properties of macrocyclic tetraamines bearing a phenol pendant. Inorg. Chem. 1987, 26, 2975–2983. [Google Scholar] [CrossRef]
  28. Carr, J.; Swartzfager, D.G. Separation of conformational stereoisomers in a triarylmethane. J. Am. Chem. Soc. 1973, 95, 8172–8173. [Google Scholar]
  29. Carr, J.; Swartzfager, D.G. Complexometric titration for the determination of sodium ion. Anal. Chem. 1971, 43, 1238–1241. [Google Scholar] [CrossRef]
  30. Peters, J.A.; Geraldes, C.F.G.C. A Semi-Empirical Method for the Estimation of the Hydration Number of Mn(II)-Complexes. Inorganics 2018, 6, 116. [Google Scholar] [CrossRef] [Green Version]
  31. Irving, H.; Miles, M.; Pettit, L. A study of some problems in determining the stoicheiometric proton dissociation constants of complexes by potentiometric titrations using a glass electrode. Anal. Chim. Acta 1967, 38, 475–488. [Google Scholar] [CrossRef]
  32. Zékány, L.; Nagypál, I. Computational Method for Determination of Formation Constants; Legett, D.J., Ed.; Plenum Press: New York, NY, USA, 1985; p. 291. [Google Scholar]
  33. Glasoe, P.K.; Long, F.A. Use of glass electrodes to measure acidities in deuterium oxide1,2. J. Phys. Chem. 1960, 64, 188–190. [Google Scholar] [CrossRef]
  34. Corsi, M.; Platas-Iglesias, C.; van Bekkum, H.; Peters, J.A. Determination of paramagnetic lanthanide(III) concentrations from bulk magnetic susceptibility shifts in NMR spectra. Magn. Reson. Chem. 2001, 39, 723–726. [Google Scholar] [CrossRef]
  35. Becke, A.D. Densityfunctional thermochemistry. III. The role of exact exchange. J. Chem. Phys. 1993, 98, 5648–5652. [Google Scholar] [CrossRef] [Green Version]
  36. Schafer, H.; Horn, H.; Ahlrichs, R. Fully optimized contracted Gaussian basis sets for atoms Li to Kr. J. Chem. Phys. 1992, 97, 2571–2577. [Google Scholar] [CrossRef]
  37. Klamt, A.; Schuurmann, G.J.G.J. COSMO: A new approach to dielectric screening in solvents with explicit expressions for the screening energy and its gradient. J. Chem. Soc. Trans. 1993, 2, 799–805. [Google Scholar]
  38. Grimme, S.; Antony, J.; Ehrlich, S.; Krieg, H. A consistent and accurate ab initio parametrization of density functional dispersion correction (DFT-D) for the 94 elements H-Pu. J. Chem. Phys. 2010, 132, 154104. [Google Scholar] [CrossRef] [Green Version]
  39. Plimpton, S. Fast parallel algorithms for short-range molecular dynamics. J. Comput. Phys. 1995, 117, 1–19. [Google Scholar] [CrossRef] [Green Version]
  40. Rappe, A.K.; Casewit, C.J.; Colwell, K.S.; Goddard, W.A.; Skiff, W.M. UFF, a full periodic table force field for molecular mechanics and molecular dynamics simulations. J. Am. Chem. Soc. 1992, 114, 10024–10035. [Google Scholar] [CrossRef]
  41. Price, J.; Brooks, C.L. A modified TIP3P water potential for simulation with Ewald summation. J. Chem. Phys. 2004, 121, 10096–10103. [Google Scholar] [CrossRef]
  42. Ryckaert, J.-P.; Ciccotti, G.; Berendsen, H.J.C. Numerical integration of the cartesian equations of motion of a system with constraints; molecular dynamics of n-alkanes. J. Comput. Phys. 1977, 23, 327–341. [Google Scholar] [CrossRef] [Green Version]
  43. Martínez, L.; Andrade, R.; Birgin, E.G.; Martínez, J.M. Packmol: A package for building initial configurations for molecular dynamics simulations. J. Comput. Chem. 2009, 30, 2157–2164. [Google Scholar] [CrossRef]
  44. Joung, I.S.; Cheatham, T.E. Determination of Alkali and Halide Monovalent Ion Parameters for Use in Explicitly Solvated Biomolecular Simulations. J. Phys. Chem. B 2008, 112, 9020–9041. [Google Scholar] [CrossRef] [Green Version]
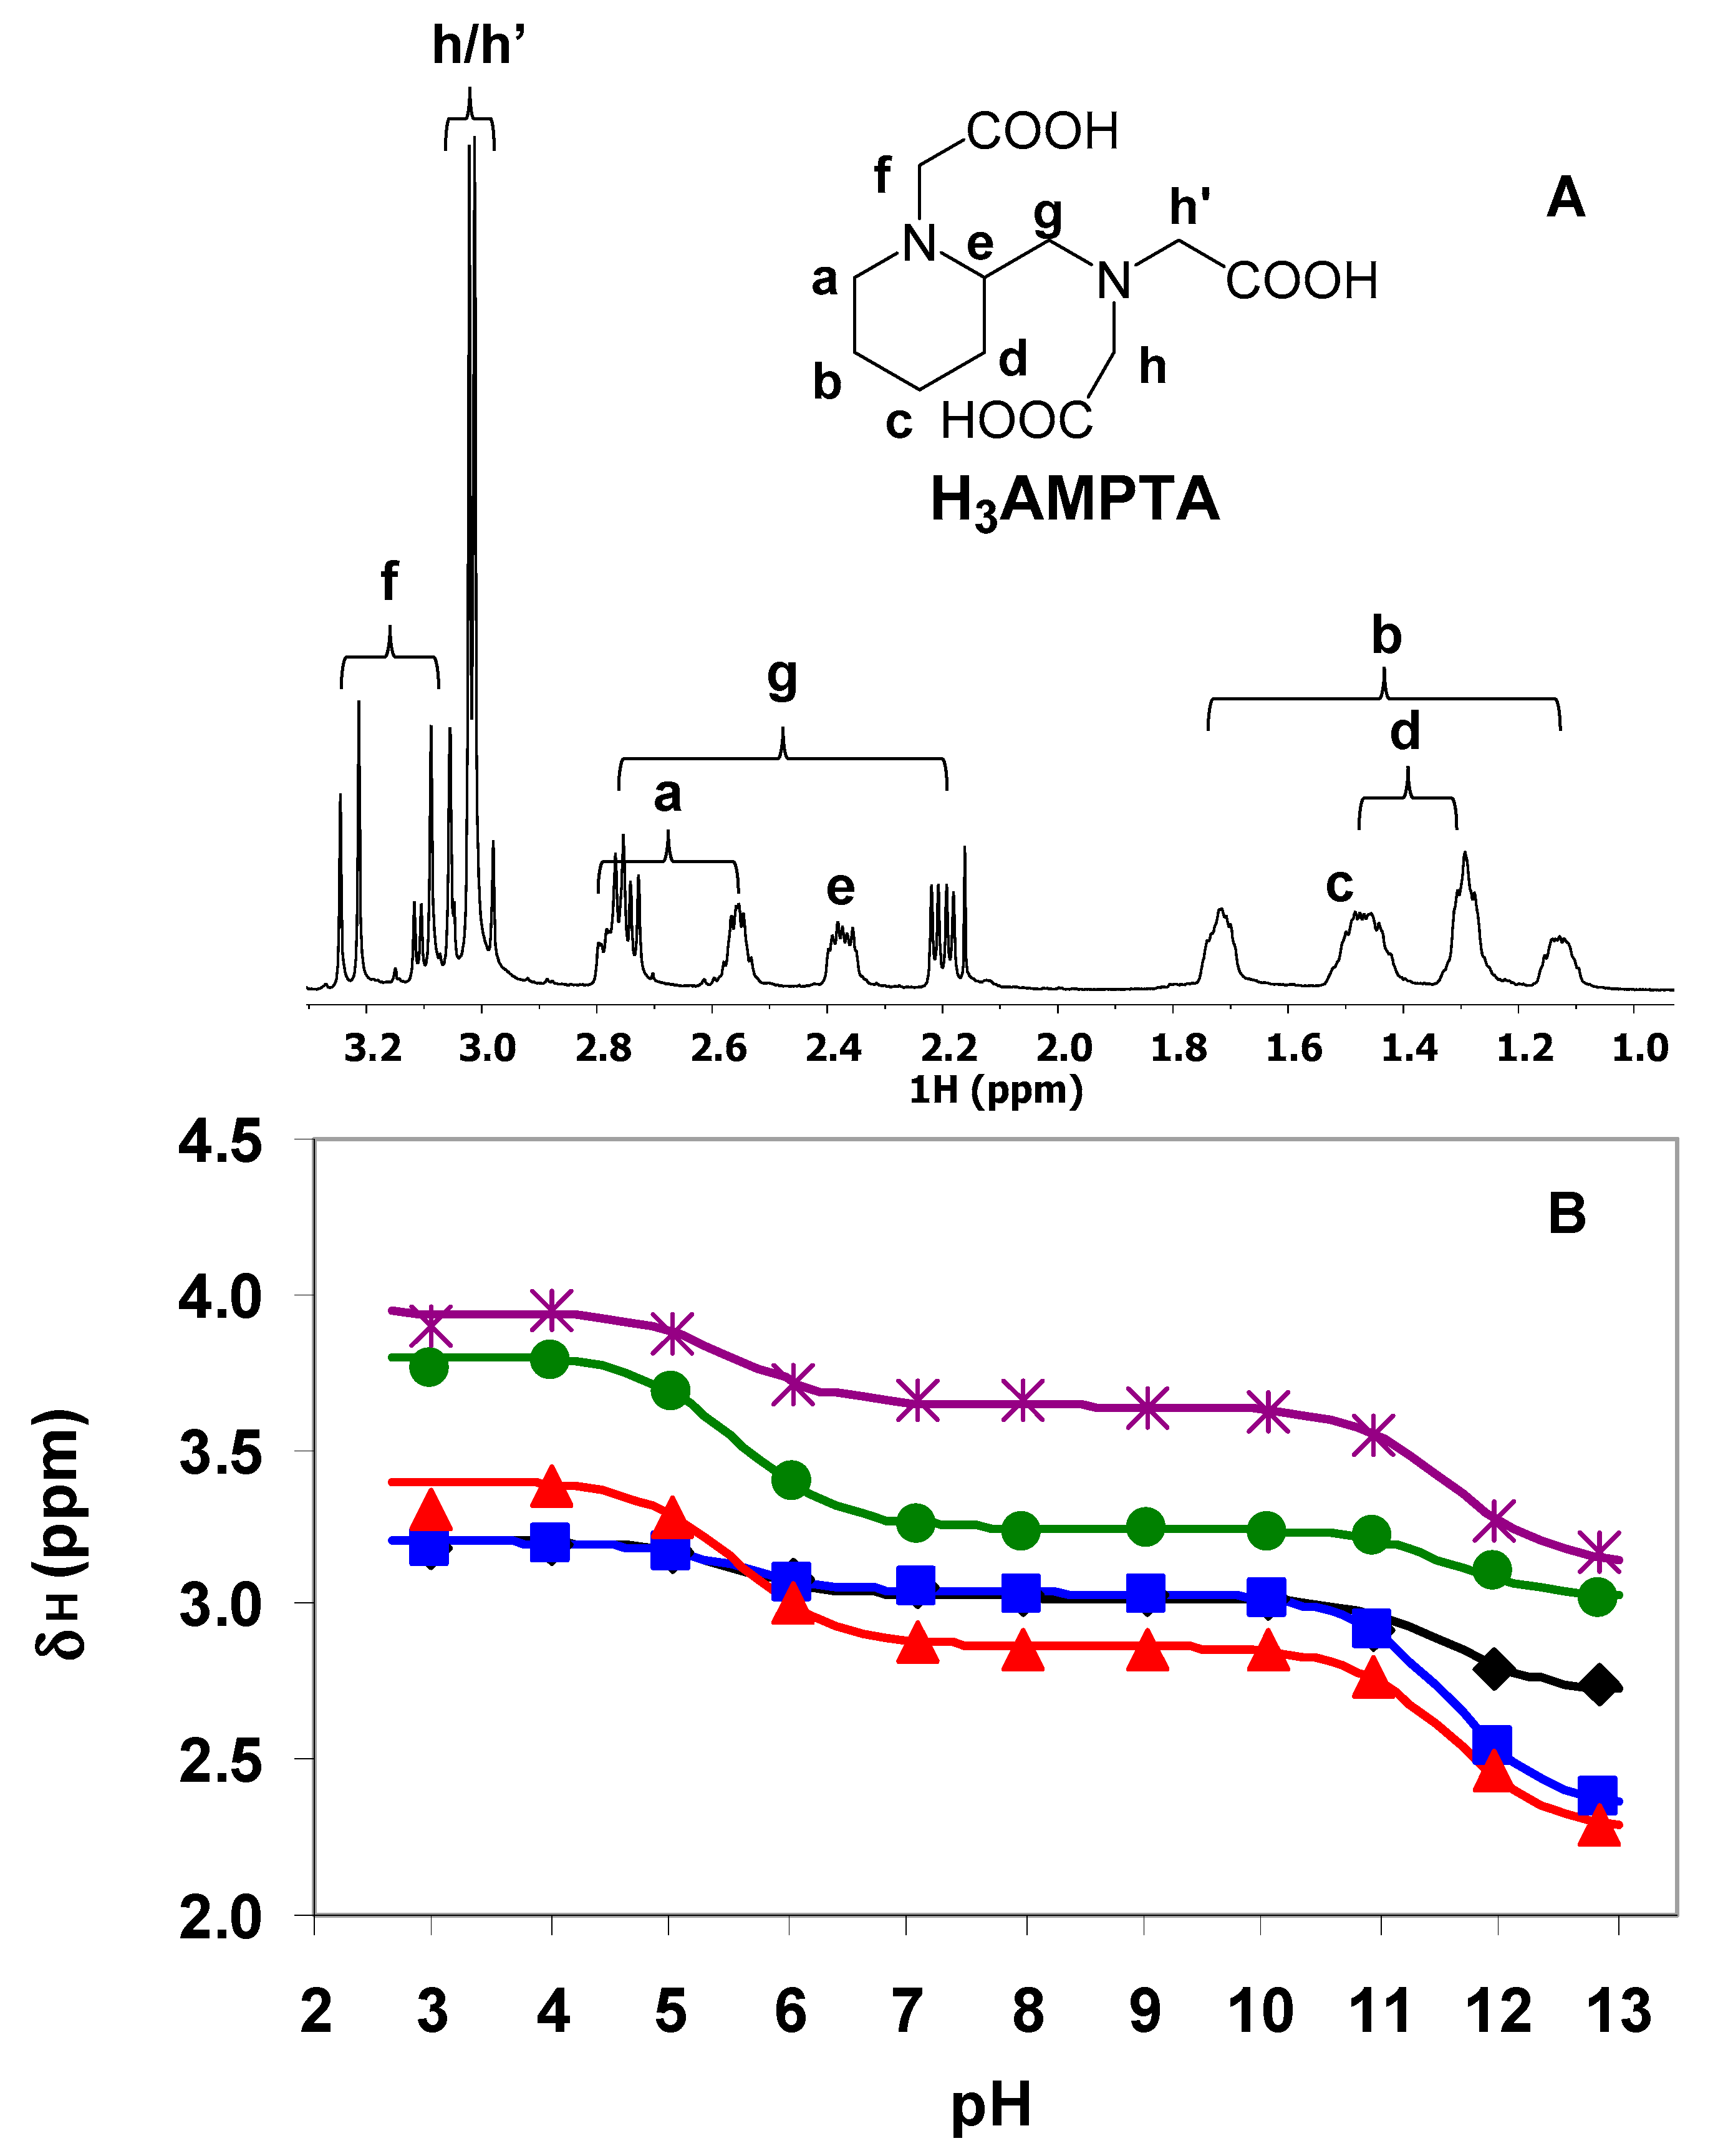
Figure 1. Molecular structures of the ligands mentioned in the text.
Molecules 26 05993 g001
Scheme 1. Synthesis of AMPDA-HB from AMP: (i) AcOH, MeOH, rt, 1 h; (ii) NaBH4, 0 °C, 2 h; (iii) tert-butyl bromoacetate, Na2CO3, CH3CN, rt, on; (iv) TFA, rt, 3 h.
Molecules 26 05993 sch001
Scheme 2. Synthesis of (R)-AMPTA: (i) SOCl2, MeOH, refl., 2 h; (ii) NH3 in MeOH, rt, 2 d; (iii) LiAlH4, THF, 0 °C, 3 h; (iv) BrCH2COOt-Bu, K2CO3, CH3CN 50 °C, on; (v) TFA, DCM, rt, on.
Molecules 26 05993 sch002
Figure 2. (A) 1H-NMR spectrum of AMPTA and (B) chemical shifts of the different protons as a function of pH. (A): pH = 12.84; 500 MHz, D2O, 0.15 M NaCl, 25 °C. B: a (◆), e (■), g ( Molecules 26 05993 i001), h/h’ ( Molecules 26 05993 i002) and f ( Molecules 26 05993 i003), [AMPTA] = 0.01 M, 0.15 M NaCl, 25 °C.
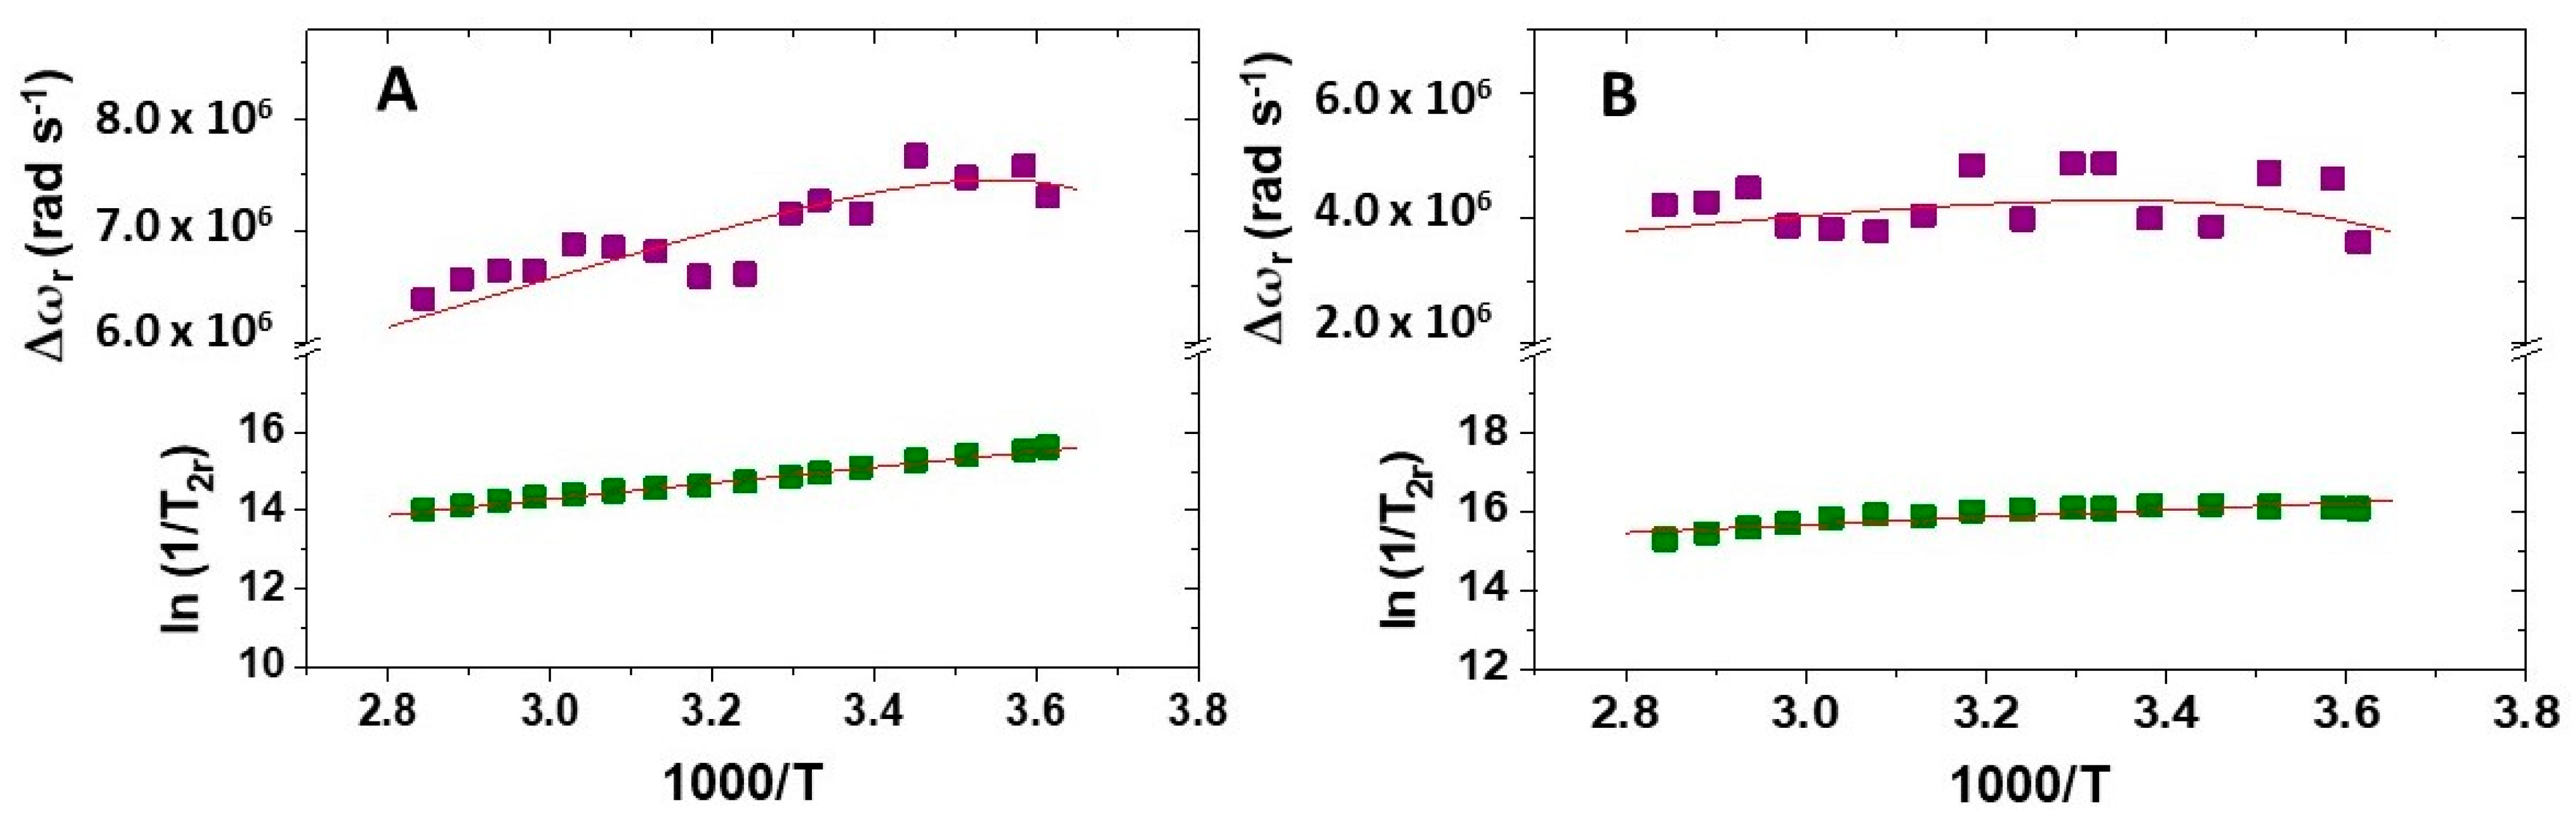
Molecules 26 05993 g002
Figure 3. (A) Absorption spectra and (B) species distribution and the absorbance values at 295 nm of the AMPDA-HB ligand as a function of pH ([AMPDA-HB] = 1.0 × 10⁻⁴ M, l = 1.0 cm, 0.15 M NaCl, 25 °C).
Molecules 26 05993 g003
Scheme 3. Protonation scheme of the AMPTA and AMPDA-HB ligands.
Molecules 26 05993 sch003
Figure 4. (A) Species distribution and relaxivity values (◆) as a function of pH of the Mn2+-AMPTA system; (B) species distribution and relaxivity values (◆) as a function of pH of the Mn2+-AMPDA-HB system; ([Mn2+] = [L] = 1.0 mM, 20 MHz, 0.15 M NaCl, 25 °C).
Molecules 26 05993 g004
Figure 5. 1H NMRD profiles recorded at 298 (●) and 310 K ( Molecules 26 05993 i004) for (A) [Mn(AMPTA)] and (B) [Mn(AMPDA-HB)]. The blue triangles represent the 1H NMRD profile at 298 K of enantiomerically pure [Mn((R)-AMPTA)]. The lines represent the fit of the data, as explained in the text.
Molecules 26 05993 g005
Figure 6. Reduced transverse 17O NMR relaxation rates and chemical shifts versus reciprocal temperature measured for (A) [Mn(AMPTA)] and (B) [Mn(AMPDA-HB)] at 11.74 T. The lines represent the fit of the data, as explained in the text.
Molecules 26 05993 g006
Figure 7. Structures optimized using DFT calculations: (A) [Mn((S)-AMPTA)·(H2O)]; (B) [Mn((R)-AMPTA)·(H2O)]; (C) [Mn((S)-AMPDA-HB)·(H2O)]; (D) [Mn((R)-AMPDA-HB)·(H2O)].
Molecules 26 05993 g007
Figure 8. Time evolution of the distance between Mn2+ ion and the coordinated water molecule for (A) [Mn((R/S)-AMPTA)·(H2O)] and (B) [Mn((R/S)-AMPDA-HB·(H2O)].
Molecules 26 05993 g008
Figure 9. Radial distribution function of water oxygen relative to Mn(II). (A): [Mn((R/S)-AMPTA)·(H2O)]; (B) [Mn((R/S)-AMPDA-HB·(H2O)]; (C) comparison of g(Ow–Mn) for the R-enantiomer of both complexes.
Molecules 26 05993 g009
Table 1. Protonation constants of AMPTA and AMPDA-HB compared to other ligands (0.15 M NaCl, 25 °C); standard deviations are shown in parentheses.
AMPTAAMPDA-HBDPAMeA15DPAPhA15CDTAEDTA
Meth.pH Pot.1H pH Pot.UVpH Pot.pH Pot.pH Pot.pH Pot.
logK1H11.67 (1)11.59 (3)12.4 (1)12.0 (1)7.825.489.54 (1)9.28 (1)
logK2H5.47 (2)5.59 (3)10.14 (2)9.92 (5)3.714.515.97 (1)6.04 (1)
logK3H2.74 (2)-4.76 (3)-2.614.283.60 (1)2.72 (1)
logK4H1.62 (2)-1.91 (4)--2.702.52 (1)1.99 (1)
logK5H------1.46 (1)1.11 (6)
logβ4H21.4929.1914.1416.9721.6320.03
Table 2. The stability and protonation constants of the Mn(II) complexes of AMPTA, AMPDA-HB, DPAMeA, DPAPhA, CDTA and EDTA ligands (0.15 M NaCl, 25 °C).
AMPTAAMPDA-HBDPAMeA [16]DPAPhA [16]CDTAEDTA
logKMnL11.20 (1)13.69 (4)10.139.5514.32 (1)12.95 (1)
logKMnHL3.77 (4)6.80 (4)2.574.842.90 (1)2.65 (2)
logKMnH2L-5.60 (5)-2.511.89 (4)2.51 (4)
pMn a7.897.077.287.2713.1112.00
a pMn = −log [Mn2+]free, [Mn2+]tot = 1 μM, [L]tot = 10 μM, pH = 7.4.
Table 3. Relaxometric parameters for Mn(AMPTA) and Mn(AMPDA-HB), which were obtained from the simultaneous analysis of 17O NMR and 1H NMRD data and compared to other relevant Mn(II) complexes.
AMPTAAMPDA-HBDPAA [16]DPAMeA [16]PAADA [17]
r1 at 25/37 °C, 20 MHz (mM−1 s−1)3.3/2.63.4/2.73.5/2.75.3/4.24.0/3.3
k R 298 (107 s−1)56 ± 340 ± 512.630.690.0
ΔH (kJ mol−1)25.5 ± 0.528.3 ± 0.342.728.128.3
τ R 298 (ps)54.1 ± 0.960.6 ± 1.547.647.840.1
Er (kJ mol−1)20.2 ± 0.518.5 ± 1.122.825.322.6
τ v 298 (ps)27.8 ± 1.721.5 ± 1.419.439.212.0
Δ2 (1019 s−2)7.3 ± 0.59.2 ± 0.65.52.412.8
AO/ħ (106 rad s−1)−28.6 ± 0.4−33.0 ± 0.5−31.5−45.8−38.6
q29811122
Table 4. HPLC-UV analytical method for compound 1 (tR = 11.1 min).
Solvent A = H2O (TFA 0.1%), Solvent B = ACN (TFA 0.1%), Flow = 1 mL/min.
Time%A%B
07030
27030
160100
190100
Publisher’s Note: MDPI stays neutral with regard to jurisdictional claims in published maps and institutional affiliations.

