
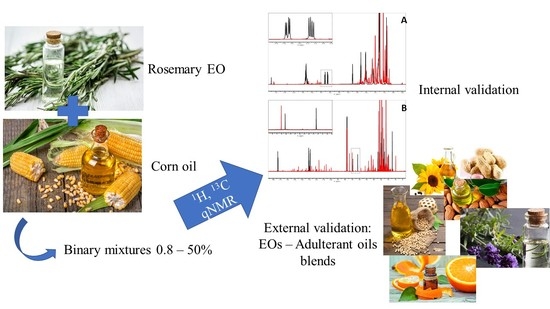
A Novel qNMR Application for the Quantification of Vegetable Oils Used as Adulterants in Essential Oils

 , , , , and
Abstract
:
1. Introduction
2. Results and Discussion
3. Materials and Methods
3.1. Materials
3.2. Sample Preparation
3.3. NMR Spectroscopy and Spectra Acquisition Procedures
3.4. Quantitative NMR analysis
3.5. Method Validation
4. Conclusions
Author Contributions
Funding
Institutional Review Board Statement
Informed Consent Statement
Data Availability Statement
Acknowledgments
Conflicts of Interest
Sample Availability
References
- Chizzola, R. Regular monoterpenes and sesquiterpenes (essential oils). In Natural Products: Phytochemistry, Botany and Metabolism of Alkaloids, Phenolics and Terpenes; Ramawat, K., Mérillon, J.M., Eds.; Springer: Heidelberg, Germany, 2013; pp. 2973–3008. ISBN 9783642221446. [Google Scholar]
- Degenhardt, J.; Köllner, T.G.; Gershenzon, J. Monoterpene and sesquiterpene synthases and the origin of terpene skeletal diversity in plants. Phytochemistry 2009, 70, 1621–1637. [Google Scholar] [CrossRef]
- Burt, S. Essential oils: Their antibacterial properties and potential applications in foods—A review. Int. J. Food Microbiol. 2004, 94, 223–253. [Google Scholar] [CrossRef]
- Fernández-López, J.; Viuda-Martos, M. Introduction to the special issue: Application of essential oils in food systems. Foods 2018, 7, 56. [Google Scholar] [CrossRef] [Green Version]
- Raveau, R.; Fontaine, J.; Lounès-Hadj Sahraoui, A. Essential oils as potential alternative biocontrol products against plant pathogens and weeds: A review. Foods 2020, 9, 365. [Google Scholar] [CrossRef] [Green Version]
- Ibáñez, M.D.; Blázquez, M.A. Phytotoxic Effects of Commercial Eucalyptus citriodora, Lavandula angustifolia, and Pinus sylvestris Essential Oils on Weeds, Crops, and Invasive Species. Molecules 2019, 24, 2847. [Google Scholar] [CrossRef] [Green Version]
- U.S. Food & Drug Administration CFR—Code of Federal Regulations Title 21. Available online: www.accessdata.fda.gov/scripts/cdrh/cfdocs/cfcfr/CFRSearch.cfm?CFRPart=182&showFR=1 (accessed on 14 June 2021).
- Pellati, F.; Orlandini, G.; Van Leeuwen, K.A.; Anesin, G.; Bertelli, D.; Paolini, M.; Benvenuti, S.; Camin, F. Gas chromatography combined with mass spectrometry, flame ionization detection and elemental analyzer/isotope ratio mass spectrometry for characterizing and detecting the authenticity of commercial essential oils of Rosa damascena Mill. Rapid Commun. Mass Spectrom. 2013, 27, 591–602. [Google Scholar] [CrossRef] [PubMed]
- Beale, D.J.; Morrison, P.D.; Karpe, A.V.; Dunn, M.S. Chemometric analysis of lavender essential oils using targeted and untargeted GC-MS acquired data for the rapid identification and characterization of oil quality. Molecules 2017, 22, 1339. [Google Scholar] [CrossRef] [PubMed] [Green Version]
- Do, T.K.T.; Hadji-Minaglou, F.; Antoniotti, S.; Fernandez, X. Authenticity of essential oils. TrAC—Trends Anal. Chem. 2015, 66, 146–15710. [Google Scholar] [CrossRef]
- Rubiolo, P.; Sgorbini, B.; Liberto, E.; Cordero, C.; Bicchi, C. Essential oils and volatiles: Sample preparation and analysis. A review. Flavour Fragr. J. 2010, 25, 282–290. [Google Scholar] [CrossRef]
- Bounaas, K.; Bouzidi, N.; Daghbouche, Y.; Garrigues, S.; de la Guardia, M.; El Hattab, M. Essential oil counterfeit identification through middle infrared spectroscopy. Microchem. J. 2018, 139, 347–356. [Google Scholar] [CrossRef]
- Cerceau, C.I.; Barbosa, L.C.A.; Alvarenga, E.S.; Maltha, C.R.A.; Ismail, F.M.D. 1 H-NMR and GC for detection of adulteration in commercial essential oils of Cymbopogon ssp. Phytochem. Anal. 2020, 31, 88–97. [Google Scholar] [CrossRef] [PubMed]
- Truzzi, E.; Marchetti, L.; Bertelli, D.; Benvenuti, S. Attenuated total reflectance–Fourier transform infrared (ATR–FTIR) spectroscopy coupled with chemometric analysis for detection and quantification of adulteration in lavender and citronella essential oils. Phytochem. Anal. 2021. [Google Scholar] [CrossRef] [PubMed]
- Kemprai, P.; Protim Mahanta, B.; Kumar Bora, P.; Jyoti Das, D.; Lakshmi Hati Boruah, J.; Proteem Saikia, S.; Haldar, S. A 1 H NMR spectroscopic method for the quantification of propenylbenzenes in the essential oils: Evaluation of key odorants, antioxidants and post-harvest drying techniques for Piper betle L. Food Chem. 2020, 331. [Google Scholar] [CrossRef] [PubMed]
- Marchetti, L.; Pellati, F.; Benvenuti, S.; Bertelli, D. Use of 1H NMR to Detect the Percentage of Pure Fruit Juices in Blends. Molecules 2019, 24, 2592. [Google Scholar] [CrossRef] [Green Version]
- Bertelli, D.; Lolli, M.; Papotti, G.; Bortolotti, L.; Serra, G.; Plessi, M. Detection of honey adulteration by sugar syrups using one-dimensional and two-dimensional high-resolution nuclear magnetic resonance. J. Agric. Food Chem. 2010, 58, 8495–8501. [Google Scholar] [CrossRef]
- Santos, P.M.; Pereira-Filho, E.R.; Colnago, L.A. Detection and quantification of milk adulteration using time domain nuclear magnetic resonance (TD-NMR). Microchem. J. 2016, 124, 15–19. [Google Scholar] [CrossRef]
- Gougeon, L.; Da Costa, G.; Le Mao, I.; Ma, W.; Teissedre, P.L.; Guyon, F.; Richard, T. Wine Analysis and Authenticity Using 1 H-NMR Metabolomics Data: Application to Chinese Wines. Food Anal. Methods 2018, 11, 3425–3434. [Google Scholar] [CrossRef]
- Marchetti, L.; Rossi, M.C.; Pellati, F.; Benvenuti, S.; Bertelli, D. HR-1H NMR spectroscopy and multivariate statistical analysis to determine the composition of herbal mixtures for infusions. Phytochem. Anal. 2021, 32, 544–553. [Google Scholar] [CrossRef]
- Truzzi, E.; Marchetti, L.; Benvenuti, S.; Ferroni, A.; Rossi, M.C.; Bertelli, D. Novel Strategy for the Recognition of Adulterant Vegetable Oils in Essential Oils Commonly Used in Food Industries by Applying 13C NMR Spectroscopy. J. Agric. Food Chem. 2021, 69, 8276–8286. [Google Scholar] [CrossRef]
- Cavanagh, H.M.A.; Wilkinson, J.M. Lavender essential oil: A review. Aust. Infect. Control. 2005, 10, 35–37. [Google Scholar] [CrossRef] [Green Version]
- Fontes Pinheiro, P.; Tebaldi de Queiroz, V.; Miossi Rondelli, V.; Vidal Costa, A.; de Paula Marcelino, T.; Pratissoli, D. Insecticidal activity of citronella grass essential oil on Frankliniella schultzei and Myzus persicae. Ciênc. Agrotec. 2013, 37, 138–144. [Google Scholar] [CrossRef] [Green Version]
- Borges, R.S.; Ortiz, B.L.S.; Pereira, A.C.M.; Keita, H.; Carvalho, J.C.T. Rosmarinus officinalis essential oil: A review of its phytochemistry, anti-inflammatory activity, and mechanisms of action involved. J. Ethnopharmacol. 2019, 229, 29–45. [Google Scholar] [CrossRef]
- Dosoky, N.S.; Setzer, W.N. Biological activities and safety of citrus spp. Essential oils. Int. J. Mol. Sci. 2018, 19, 1966. [Google Scholar] [CrossRef] [Green Version]
- Kaur, H.; Bhardwaj, U.; Kaur, R. Cymbopogon nardus essential oil: A comprehensive review on its chemistry and bioactivity. J. Essent. Oil Res. 2021, 33, 205–220. [Google Scholar] [CrossRef]
- Watanabe, R.; Sugai, C.; Yamazaki, T.; Matsushima, R.; Uchida, H.; Matsumiya, M.; Takatsu, A.; Suzuki, T. Quantitative nuclear magnetic resonance spectroscopy based on PULCON methodology: Application to quantification of invaluable marine toxin, okadaic acid. Toxins 2016, 8, 294. [Google Scholar] [CrossRef] [PubMed] [Green Version]
- Alexandri, E.; Ahmed, R.; Siddiqui, H.; Choudhary, M.I.; Tsiafoulis, C.G.; Gerothanassis, I.P. High Resolution NMR Spectroscopy as a Structural and Analytical Tool for Unsaturated Lipids in Solution. Molecules 2012, 22, 1663. [Google Scholar] [CrossRef] [PubMed]
- Orsavova, J.; Misurcova, L.; Vavra Ambrozova, J.; Vicha, R.; Mlcek, J. Fatty acids composition of vegetable oils and its contribution to dietary energy intake and dependence of cardiovascular mortality on dietary intake of fatty acids. Int. J. Mol. Sci. 2015, 16, 12871–12890. [Google Scholar] [CrossRef]
- Rueda, A.; Seiquer, I.; Olalla, M.; Giménez, R.; Lara, L.; Cabrera-Vique, C. Characterization of fatty acid profile of argan oil and other edible vegetable oils by gas chromatography and discriminant analysis. J. Chem. 2014, 2014. [Google Scholar] [CrossRef]
- Vingering, N.; Oseredczuk, M.; du Chaffaut, L.; Ireland, J.; Ledoux, M. Fatty acid composition of commercial vegetable oils from the French market analysed using a long highly polar column. Oléagineux Corps Gras Lipides 2010, 17, 185–192. [Google Scholar] [CrossRef]
- De Toledo, L.G.; Dos Santos Ramos, M.A.; Spósito, L.; Castilho, E.M.; Pavan, F.R.; De Oliveira Lopes, É.; Zocolo, G.J.; Silva, F.A.N.; Soares, T.H.; dos Santos, A.G.; et al. Essential oil of Cymbopogon nardus (L.) Rendle: A strategy to combat fungal infections caused by Candida species. Int. J. Mol. Sci. 2016, 17, 1252. [Google Scholar] [CrossRef] [Green Version]
- Belitz, H.D.; Grosch, W.; Schieberle, P. Food Chemistry, 4th ed.; Springer: Heidelberg, Germany, 2009. [Google Scholar]
- Wang, M.; Zhao, J.; Ali, Z.; Avonto, C.; Khan, I.A. A novel approach for lavender essential oil authentication and quality assessment. J. Pharm. Biomed. Anal. 2021, 199, 114050. [Google Scholar] [CrossRef]
- Jamwal, R.; Amit Kumari, S.; Sharma, S.; Kelly, S.; Cannavan, A.; Singh, D.K. Recent trends in the use of FTIR spectroscopy integrated with chemometrics for the detection of edible oil adulteration. Vib. Spectrosc. 2021, 113, 103222. [Google Scholar] [CrossRef]
- Cebi, N.; Taylan, O.; Abusurrah, M.; Sagdic, O. Detection of Orange Essential Oil, Isopropyl Myristate, and Benzyl Alcohol in Lemon Essential Oil by FTIR Spectroscopy Combined with Chemometrics. Foods 2020, 10, 27. [Google Scholar] [CrossRef] [PubMed]
- Lankhorst, P.P.; Chang, A.N. The application of NMR in compositional and quantitative analysis of oils and lipids. In Modern Magnetic Resonance; Webb, G., Ed.; Springer International Publishing: Cham, Switzerland, 2018; pp. 1743–1764. ISBN 9783319283883. [Google Scholar]
- Zołnierczyk, A.K.; Mączka, W.K.; Grabarczyk, M.; Wińska, K.; Woźniak, E.; Anioł, M. Isoxanthohumol—Biologically active hop flavonoid. Fitoterapia 2015, 103, 71–82. [Google Scholar] [CrossRef] [PubMed]
- Bharti, S.K.; Roy, R. Quantitative 1H NMR spectroscopy. TrAC—Trends Anal. Chem. 2012, 35, 5–26. [Google Scholar] [CrossRef]
- Molyneux, R.J.; Wong, Y.I. Nuclear Magnetic Resonance Spectroscopic Determination of α- and β-Acid Homolog Composition in Hops. J. Agric. Food Chem. 1975, 23, 1201–1204. [Google Scholar] [CrossRef]
- Balbino, S. Vegetable oil yield and composition influenced by environmental stress factors. In Oilseed Crops; Ahmad, P., Ed.; John Wiley & Sons, Ltd.: Chichester, UK, 2017; pp. 80–101. [Google Scholar]


| Experiment | Signal | Number of Nuclei | Inter-Day RSD% (n = 3) | Intra-Day RSD% (n = 5) | LOD | LOQ |
|---|---|---|---|---|---|---|
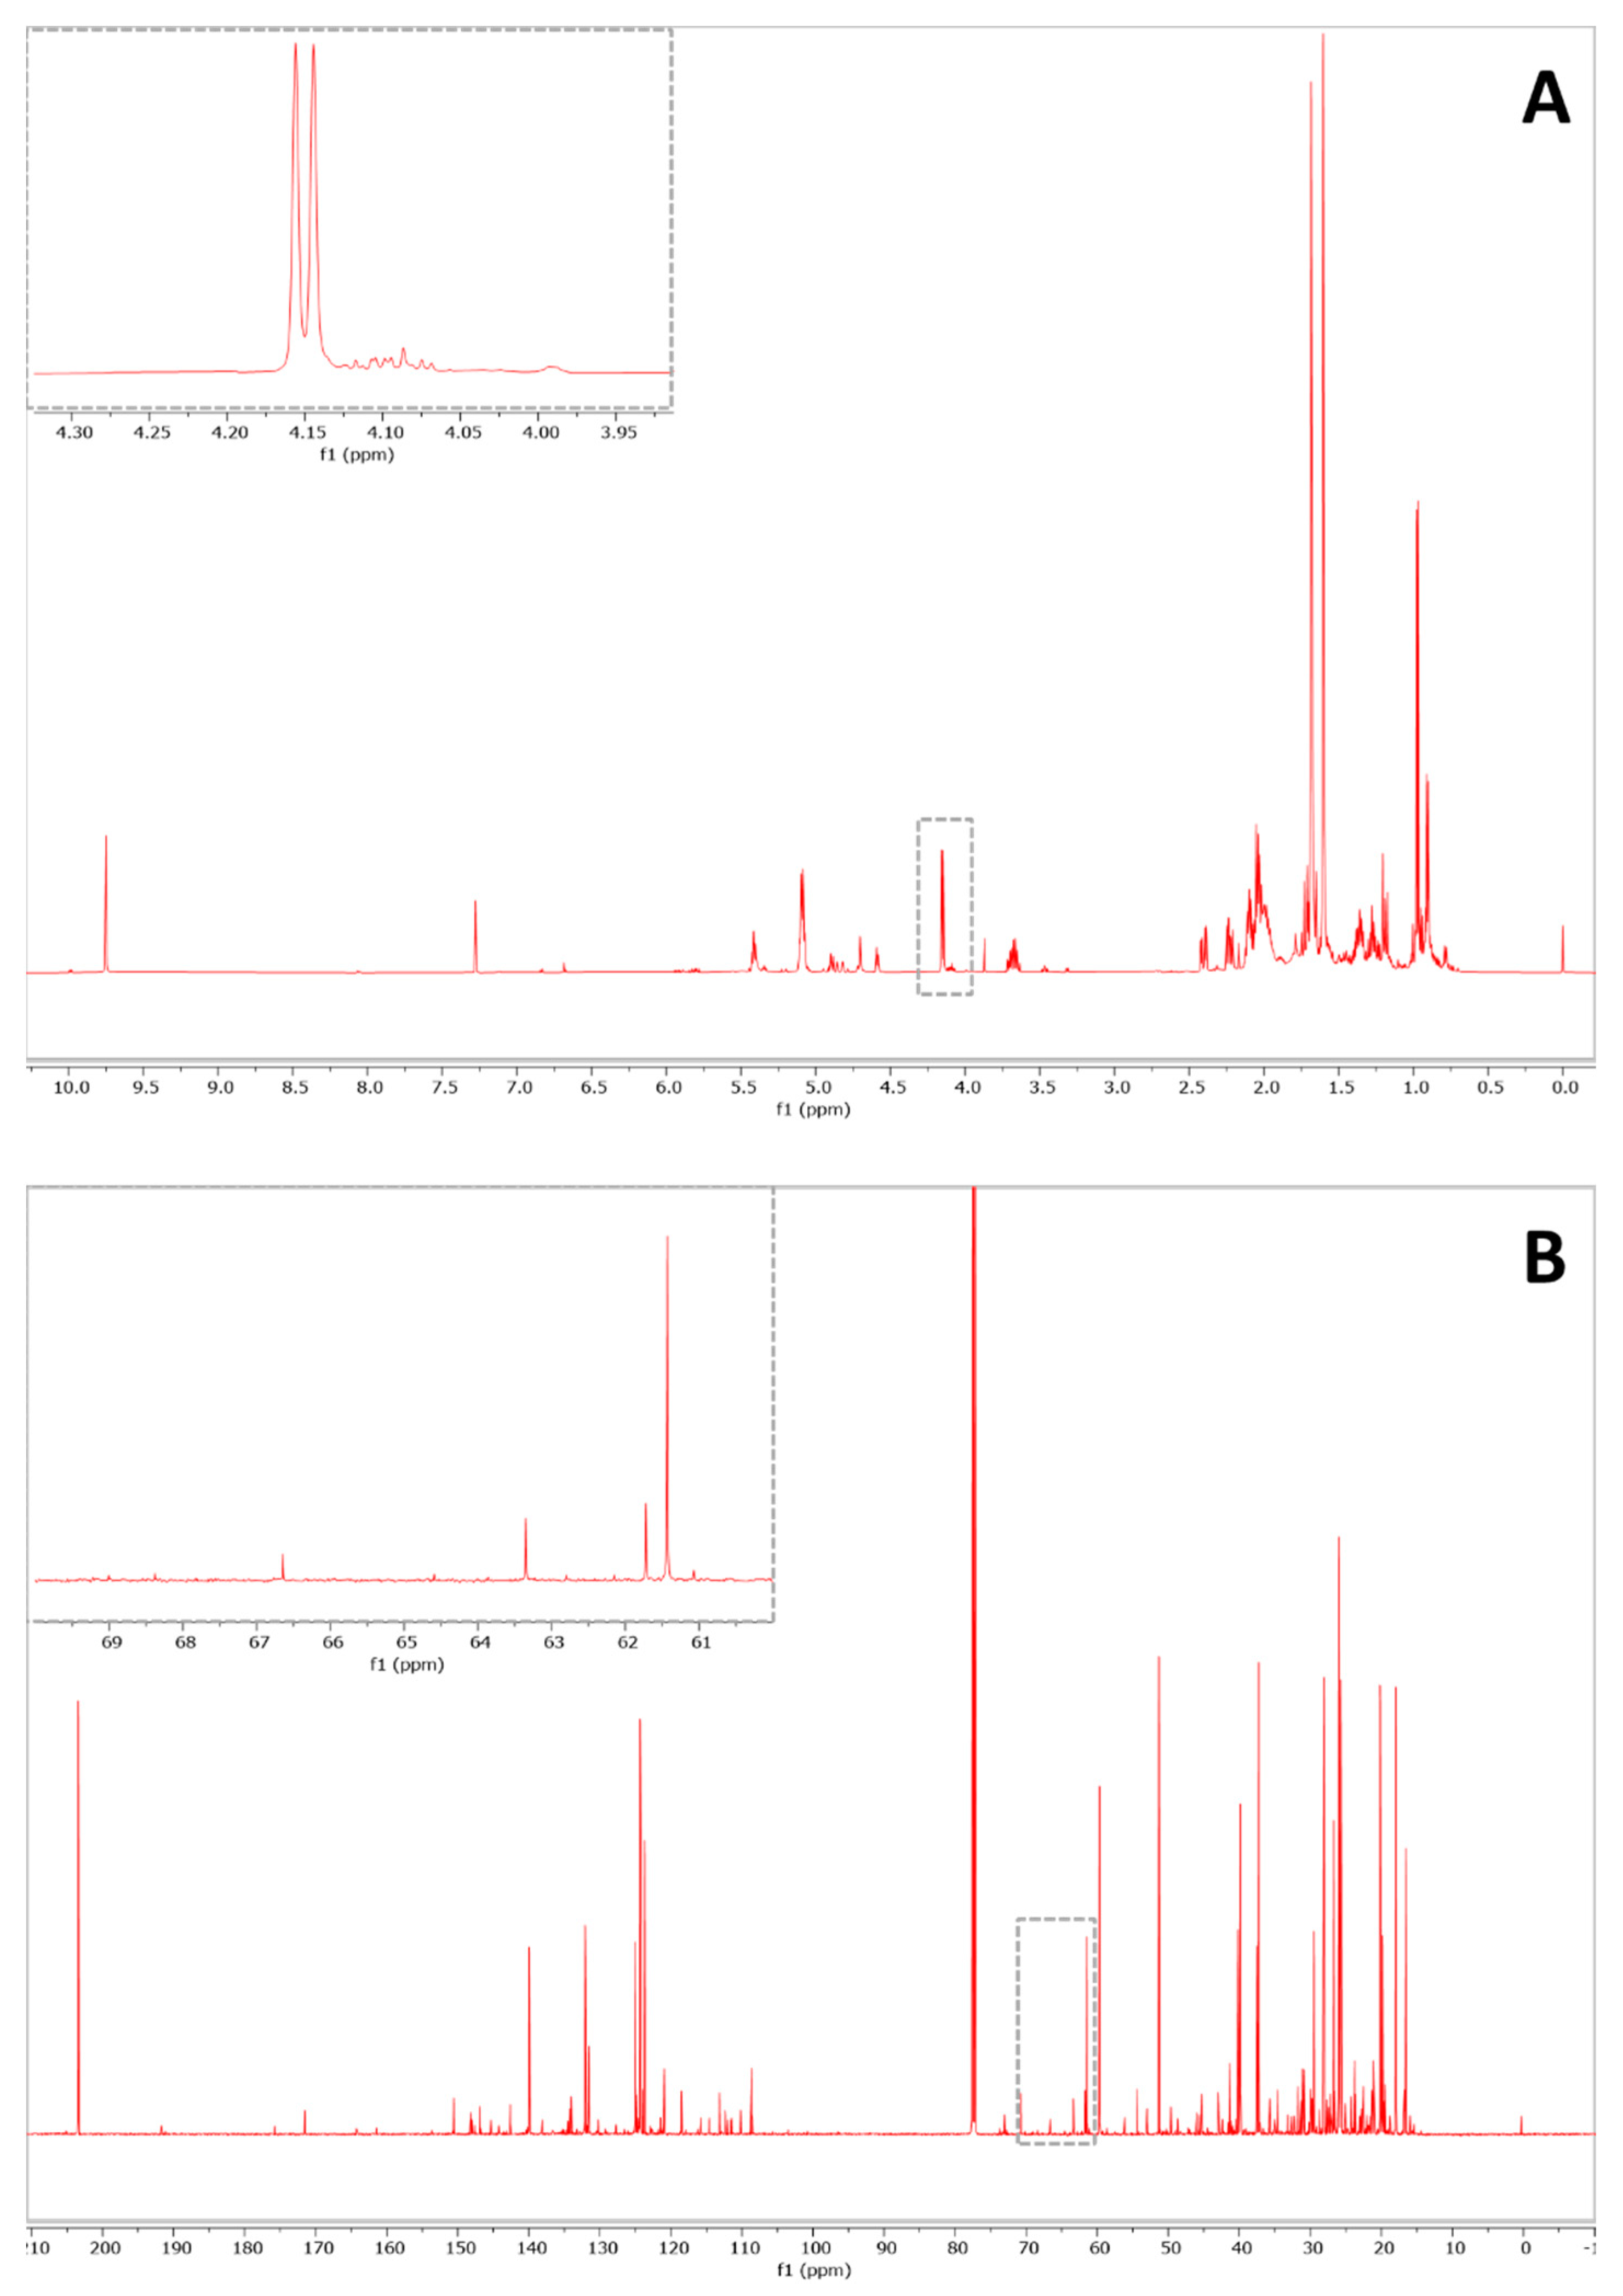
| 1H-NMR | CH2-COOR sn 1′ 3′ (4.12–4.28 ppm) | 4 | 3.21 | 2.10 | 0.02% | 0.07% |
| 13C-NMR | CH2-COOR sn 1′ 3′ (62.4 ppm) | 2 | 7.03 | 6.95 | 0.64% | 2.12% |
| 13C-NMR | CH2-COOR sn 2′ (69.2 ppm) | 1 | 1.08 | 2.91 | 0.82% | 2.72% |
| Expected (% w/w) | Measured (% w/w) | |||
|---|---|---|---|---|
| 1H | Accuracy % | 13C | Accuracy % | |
| 50.30 | 46.20 | 91.85 | 46.90 | 93.24 |
| 50.28 | 48.11 | 95.68 | 46.28 | 92.04 |
| 25.39 | 21.96 | 86.49 | 21.83 | 85.98 |
| 25.36 | 21.48 | 84.70 | 20.26 | 79.89 |
| 13.01 | 11.83 | 90.93 | 11.16 | 85.78 |
| 12.50 | 11.76 | 94.08 | 11.44 | 91.52 |
| 6.37 | 5.81 | 91.21 | 5.93 | 93.09 |
| 6.16 | 5.87 | 95.29 | 5.57 | 90.42 |
| 3.2 | 2.79 | 87.19 | 2.48 | 77.50 |
| 3.11 | 2.65 | 85.21 | 2.51 | 80.71 |
| 1.56 | 1.32 | 84.62 | <LOQ | - |
| 1.56 | 1.50 | 96.15 | <LOQ | - |
| 0.79 | 0.84 | 106.33 | <LOD | - |
| 0.77 | 0.84 | 109.09 | <LOD | - |
| Vegetable Oil | Triglycerides Molar Mass (g/mol) |
|---|---|
| Corn | 872.33 |
| Peanut | 882.09 |
| Almond | 878.32 |
| Sunflower | 887.04 |
| Soybean | 872.17 |
| EO/Adulterant | Expected (% w/w) | Measured Adulterant (% w/w) | |||
|---|---|---|---|---|---|
| 1H | Accuracy % | 13C | Accuracy % | ||
| Lavender/almond | 51.10 | 44.24 | 86.58 | 45.78 | 89.59 |
| Lavender/sunflower | 40.03 | 39.81 | 99.45 | 38.09 | 95.15 |
| Lavender/peanut | 36.16 | 34.32 | 94.91 | 31.75 | 87.80 |
| Lavender/almond | 13.54 | 12.81 | 94.61 | 12.13 | 89.59 |
| Lavender/soy | 3.29 | 3.18 | 96.66 | 3.03 | 92.10 |
| Lavender/peanut | 0.90 | 0.76 | 84.56 | <LOQ | - |
| Citronella/soy | 53.74 | 48.18 | 89.65 | 48.43 | 90.12 |
| Citronella/peanut | 40.00 | 40.37 | 100.93 | 39.40 | 98.50 |
| Citronella/sunflower | 36.61 | 29.19 | 79.73 | 29.57 | 80.77 |
| Citronella/soy | 16.89 | 15.31 | 90.65 | 15.26 | 90.35 |
| Citronella/sunflower | 5.49 | 4.62 | 84.15 | 4.25 | 77.47 |
| Citronella/almond | 3.93 | 3.50 | 89.11 | 3.22 | 81.98 |
| Orange/sunflower | 51.37 | 52.06 | 101.34 | 50.98 | 99.24 |
| Orange/soy | 50.83 | 46.33 | 91.15 | 47.50 | 93.45 |
| Orange/almond | 48.39 | 44.14 | 91.22 | 44.08 | 91.09 |
| Orange/peanut | 6.09 | 5.90 | 96.88 | 6.21 | 101.97 |
| Orange/almond | 3.72 | 3.02 | 81.18 | 2.87 | 77.15 |
| Orange/sunflower | 0.95 | 0.95 | 99.89 | <LOQ | - |
| EO/Adulterant | Measured Adulterant (% w/w) | |
|---|---|---|
| 1H | 13C | |
| Cymbopogon martinii (Roxb.)/corn | 32.80 | 33.11 |
| Thymus capitatus (Cav.)/sunflower | 41.67 | 43. 34 |
| Mentha arvensis (L.)/soy | 10.27 | 10.29 |
| Origanum vulgare (L.)/corn | 17.81 | 17.46 |
Publisher’s Note: MDPI stays neutral with regard to jurisdictional claims in published maps and institutional affiliations. |
© 2021 by the authors. Licensee MDPI, Basel, Switzerland. This article is an open access article distributed under the terms and conditions of the Creative Commons Attribution (CC BY) license (https://creativecommons.org/licenses/by/4.0/).
Share and Cite
Truzzi, E.; Marchetti, L.; Benvenuti, S.; Righi, V.; Rossi, M.C.; Gallo, V.; Bertelli, D. A Novel qNMR Application for the Quantification of Vegetable Oils Used as Adulterants in Essential Oils. Molecules 2021, 26, 5439. https://doi.org/10.3390/molecules26185439
Truzzi E, Marchetti L, Benvenuti S, Righi V, Rossi MC, Gallo V, Bertelli D. A Novel qNMR Application for the Quantification of Vegetable Oils Used as Adulterants in Essential Oils. Molecules. 2021; 26(18):5439. https://doi.org/10.3390/molecules26185439
Chicago/Turabian StyleTruzzi, Eleonora, Lucia Marchetti, Stefania Benvenuti, Valeria Righi, Maria Cecilia Rossi, Vito Gallo, and Davide Bertelli. 2021. "A Novel qNMR Application for the Quantification of Vegetable Oils Used as Adulterants in Essential Oils" Molecules 26, no. 18: 5439. https://doi.org/10.3390/molecules26185439
APA StyleTruzzi, E., Marchetti, L., Benvenuti, S., Righi, V., Rossi, M. C., Gallo, V., & Bertelli, D. (2021). A Novel qNMR Application for the Quantification of Vegetable Oils Used as Adulterants in Essential Oils. Molecules, 26(18), 5439. https://doi.org/10.3390/molecules26185439