1. Introduction
An increasing number of nanomaterials (NMs) are entering the market in consumer products spanning from health care and leisure to electronics, cosmetics and foodstuff. Nanotechnology is a truly enabling technology, with unlimited potential for innovation and numerous benefits derived from the NM unique size-related properties that are widely recognised [
1,
2]. However, the novel and dynamic properties and range of forms of NMs make the development of a well-founded and robust legislative framework to ensure the safe development of nano-enabled products particularly challenging. Legislation requiring the labelling of the presence of NMs in cosmetics [
3], food [
4] and biocidal products [
5] containing NMs exists at EU level, where a recommendation for a definition of NMs has been published [
6] specifying 50% of the particles by number to be less than 100 nm. Assessing whether the requirements for labelling are implemented correctly requires effective control, based on reliable measurements that are able to determine number-based particle size distributions. Of the most commonly used techniques for the determination of the diameters of NM, only electron microscopy (EM), particle tracking analysis (PTA), and single-particle inductively coupled plasma mass spectrometry (spICP-MS) deliver number-based particle size distributions. While some of these techniques have been around for decades (e.g., EM), others have been on the market over 10 years (PTA) or are recent extensions of established methods such as ICP-MS to detect particles in addition to total metal concentration. Thus, method development and optimisation for NMs size and concentration determination is a continuous process. Over time, these are refined to implement technical advances in terms of sample introduction and/or detection as well as software advances to enhance particle detection, counting and image analysis including high-throughput computational approaches which are emerging rapidly, driven by both regulatory and research demands. Recently, ISO and CEN documents have become available, describing the use of these techniques and optimized protocols for the size determination of NMs [
7,
8,
9]. However, as can be expected of rapidly evolving techniques, data on interlaboratory comparisons (ILCs) to determine the performance of the methods or laboratories applying these methods are quite sparse. Transmission electron microscopy (TEM) is an exception since it is one of the most widely used methods for the characterisation of NMs and several ILCs have been organised in the past. These include ILCs of gold nanoparticles (NPs) [
10], gold nanorods [
11], cellulose nanocrystals [
12], titania aggregates [
13] and carbon black aggregates [
14]. spICP-MS was among the methods investigated in the EU-funded project “NanoLyse” which aimed at developing and validating methods for the detection and quantification of nanoparticles (NPs) in food. Within that project, an ILC for the determination of median particle size and particle number concentration of silver NPs in food simulants was organised [
15]. At a later point in time a similar interlaboratory method performance study for the size determination and quantification of silver NPs in chicken meat by spICP-MS was organised [
16]. Similarly, the EU-funded “QualityNano” project organised a set of ILCs assessing the capability of PTA for the determination of gold NPs in water and medium containing the model protein bovine serum albumin, as well as particle mixtures [
17]. Recently, the results of a further ILC using PTA for the size determination of gold NP in aqueous media and that of an ILC of spICP-MS for the size determination of TiO
2 particles in confectionery products were published [
18,
19].
PTA, spICP-MS and TEM are, with other analytical techniques, part of the ACEnano toolbox. ACEnano is an EU-funded project which aims at developing, optimising, benchmarking and validating methods for the detection and characterisation of NP with a focus on extending the applicability of those methods that are already quite well established for NM characterisation in simple media to more complex and more realistic matrices including biological and environmentally relevant media and commercially formulated matrices. Within this project, several ILCs for the determination of particle size and concentration have been organised to test and benchmark the performance of routinely available analytical methods. Methods for which ILCs have been organised so far include PTA, spICP-MS and TEM/SEM, as well as dynamic light scattering (DLS), asymmetrical flow field-flow fractionation (AF4), the Brunauer, Emmett and Teller method (BET) for specific surface area and ultraviolet-visible spectrophotometry (UV/VIS). In this publication we report the results of the ILCs for a number of these techniques measuring pure NPs in aqueous suspension as well as in commercially available consumer products including sunscreen lotion and toothpaste.
3. Discussion
In the field of nanotechnology, analytical characterisation plays a vital role in understanding the behaviour and toxicity of NMs. Characterisation needs to be thorough and the technique chosen should be well-suited for the property to be determined, the material being analysed and the medium in which it is present. One way to test the performance of methods and laboratories is the organization of ILCs. The objective of the ACEnano project is not only to develop new methods and bring existing methods to a higher level of readiness, but also to test and benchmark existing methods for their performance. This is important since these methods are currently used to determine, for instance, whether a material is an NM or not, which under EU legislation leads to differences in terms of data needs for regulatory approval. In ACEnano the performance of these methods and laboratories are tested, starting with the analysis of pristine materials and/or aqueous suspensions of pristine materials, one ILC for each method. Following that, more complex samples, i.e., consumer products, were offered for analyses in a final ILC.
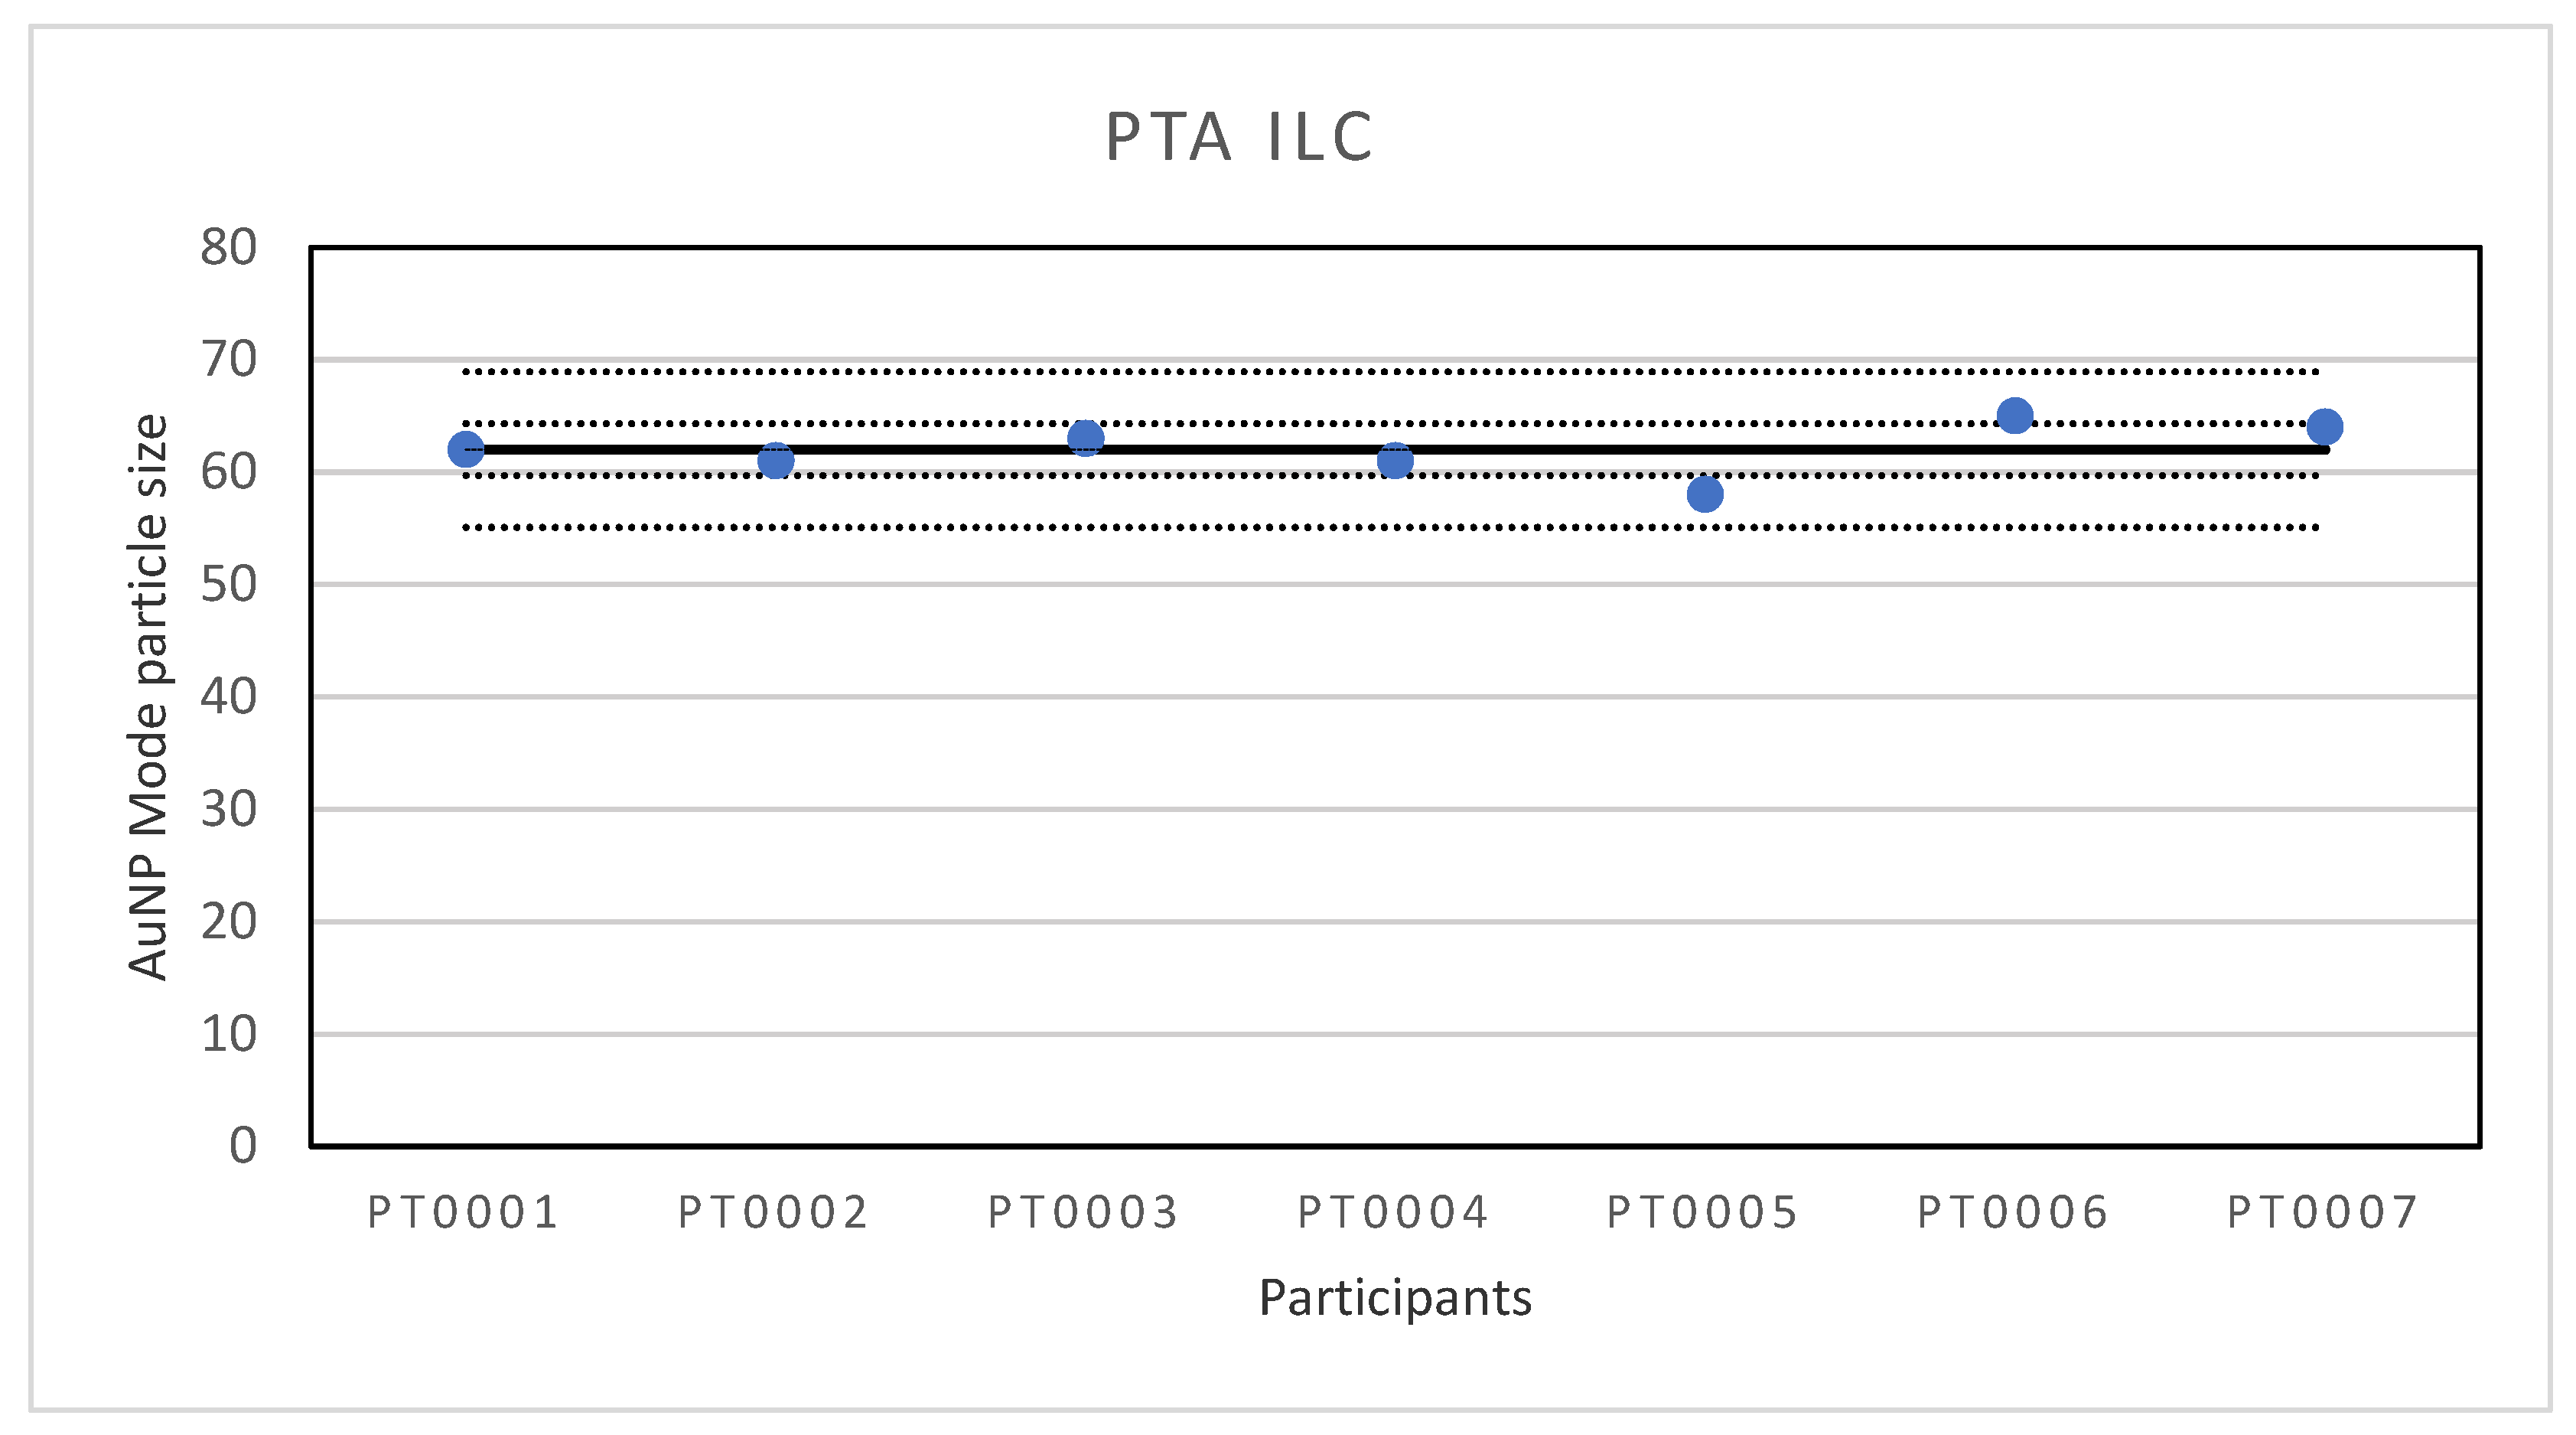
The first ILC was organised for the determination of particle size of Au NPs with PTA. With a lowest reported particle size of 58 nm and the highest value of 65 nm, the results of the ILC were very good. This was also the case for the robust standard deviation which was only 4% and much better than the fit-for-purpose value of 10%. The results are far better than in an earlier test round where it was found that the repeatability of multiple measurements on the instruments was generally good but the reproducibility was not, often resulting in deviating particle sizes. After the investigation, it was found that the systems reporting the largest size variations were either not maintained as recommended or the analysis was affected by inconsistency in sample preparation whereby the dilution step can create variations caused by different pipetting equipment, user operation and/or measurement set up including the flow cell not being clean, the wrong camera level being used, the image not being focused properly, and setting the analysis detection threshold incorrectly. As a follow-up it was decided to replace the older instruments by modern equivalents and to write an SOP for the measurements. In part, the good performance in this ILC will be the result of the fact that all participants were equipped with modern PTA instruments of the same type and configuration and a detailed SOP was provided to ensure consistency in sample preparation and analysis approach.
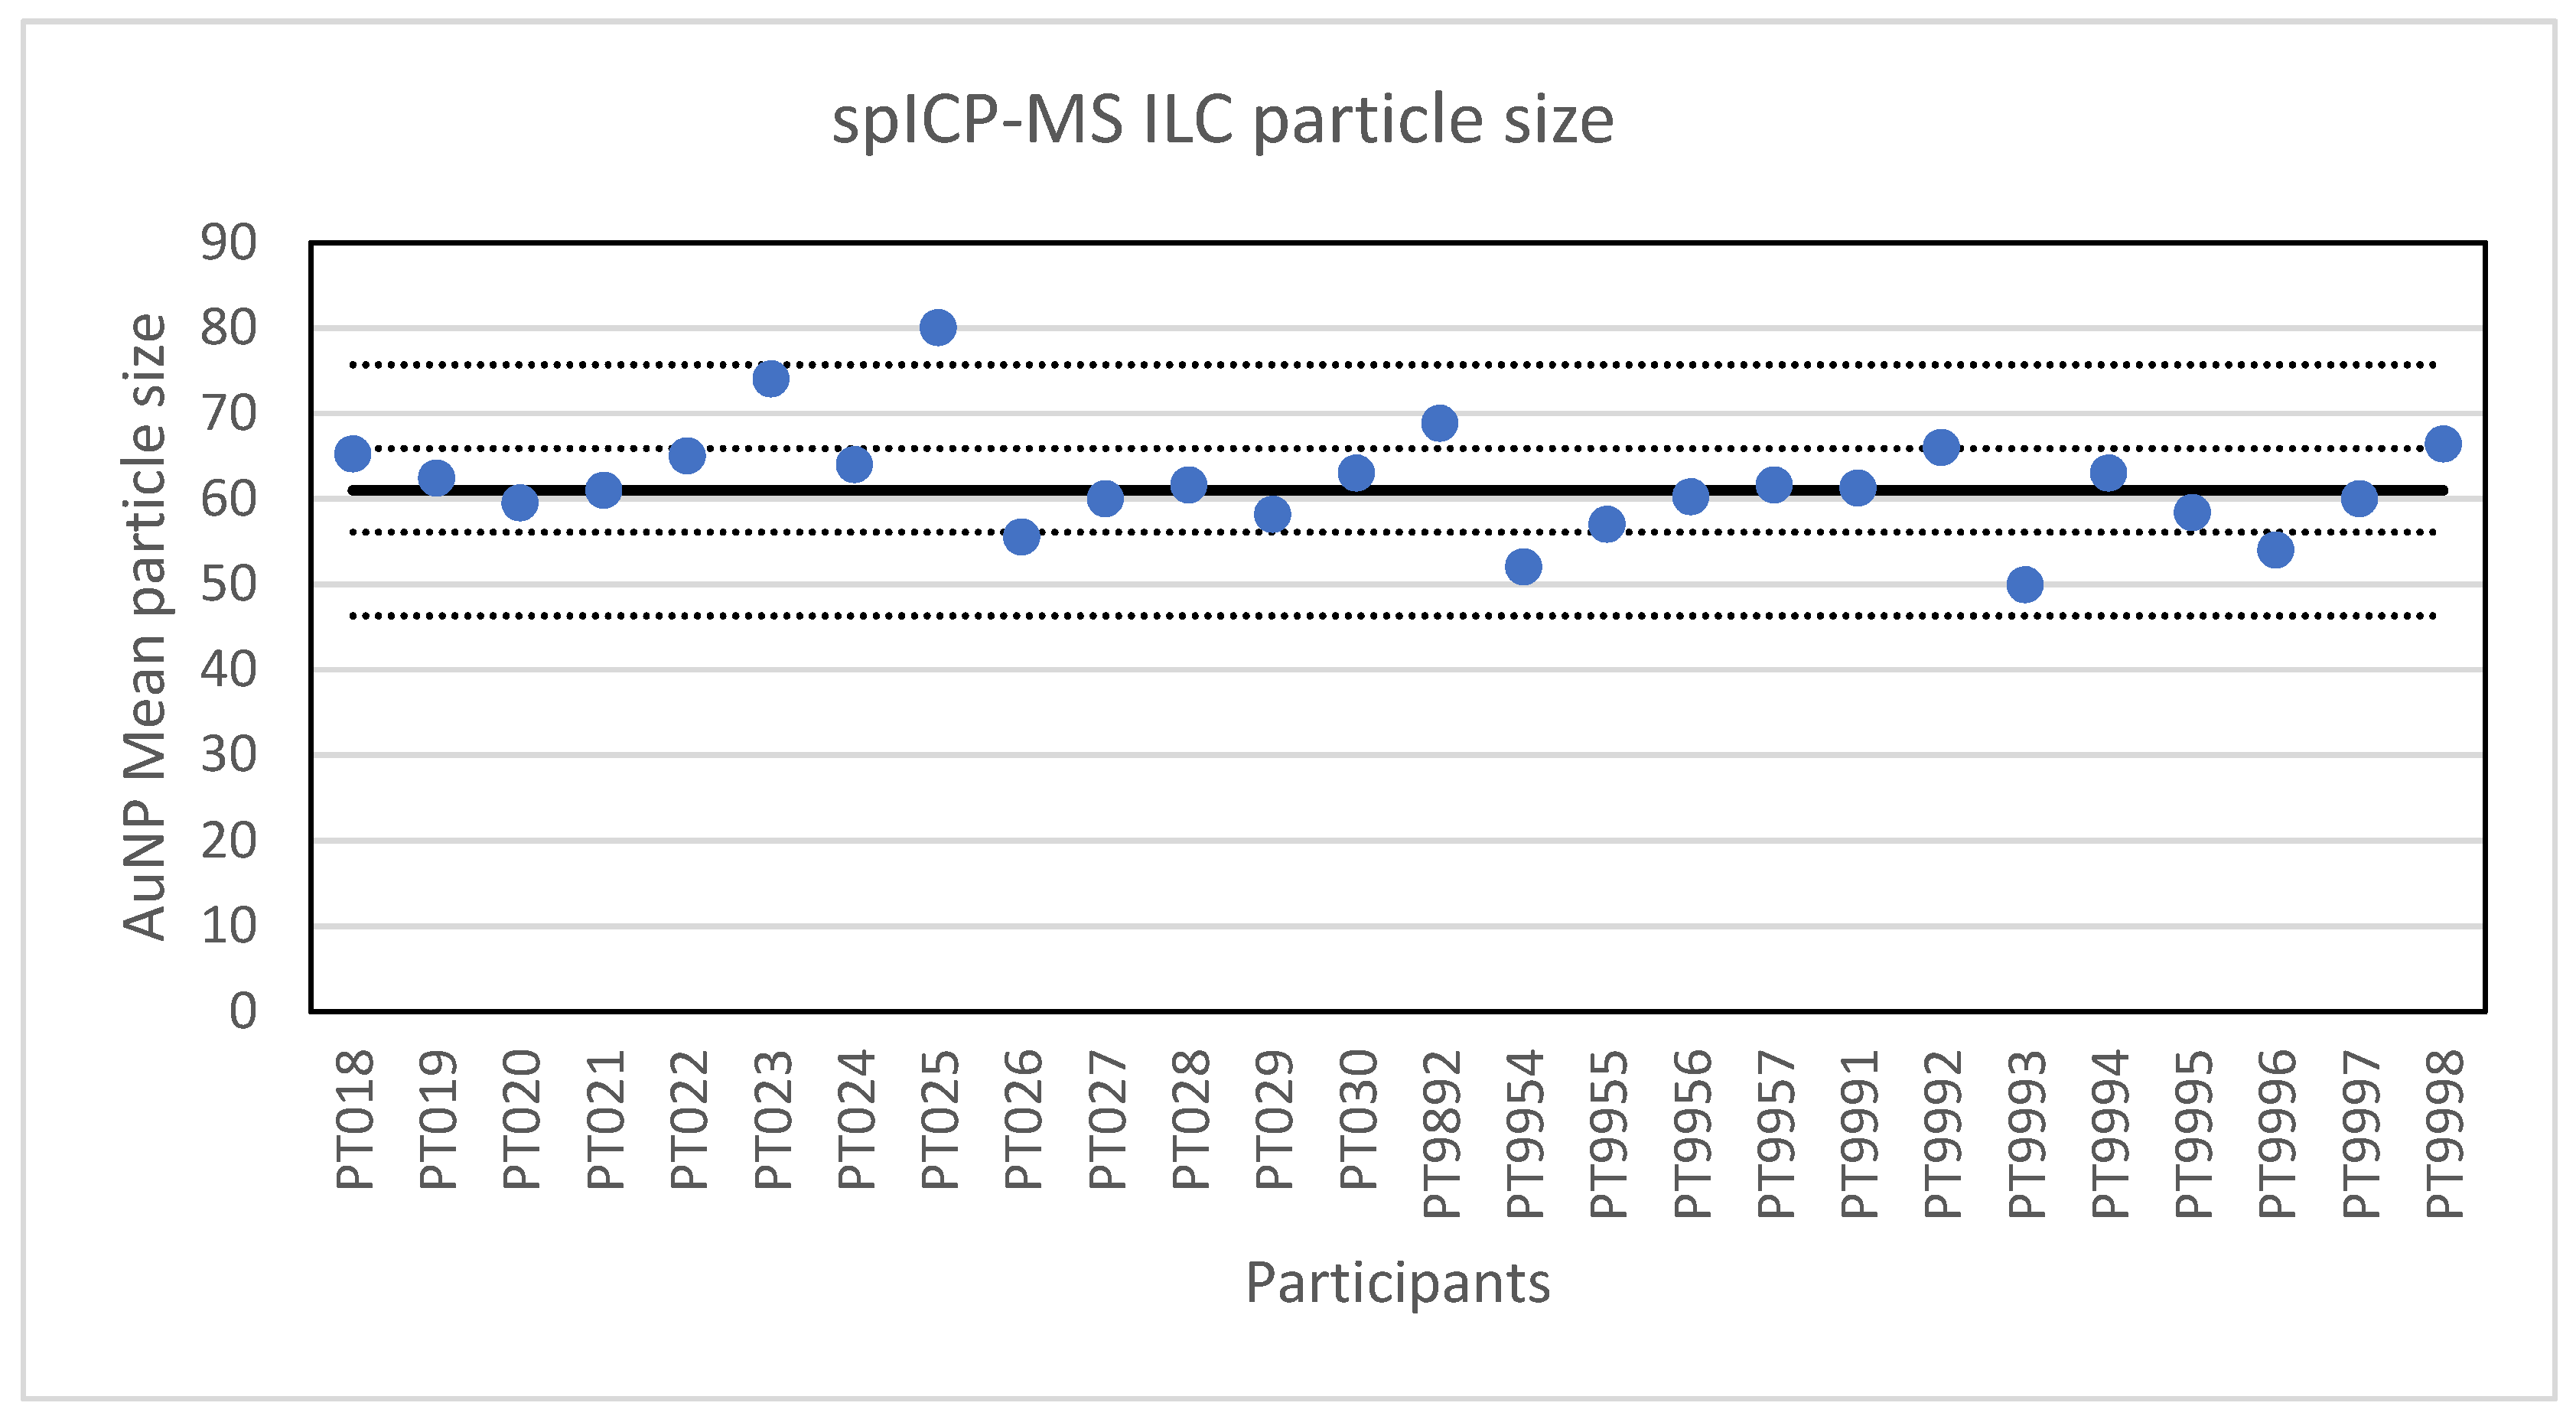
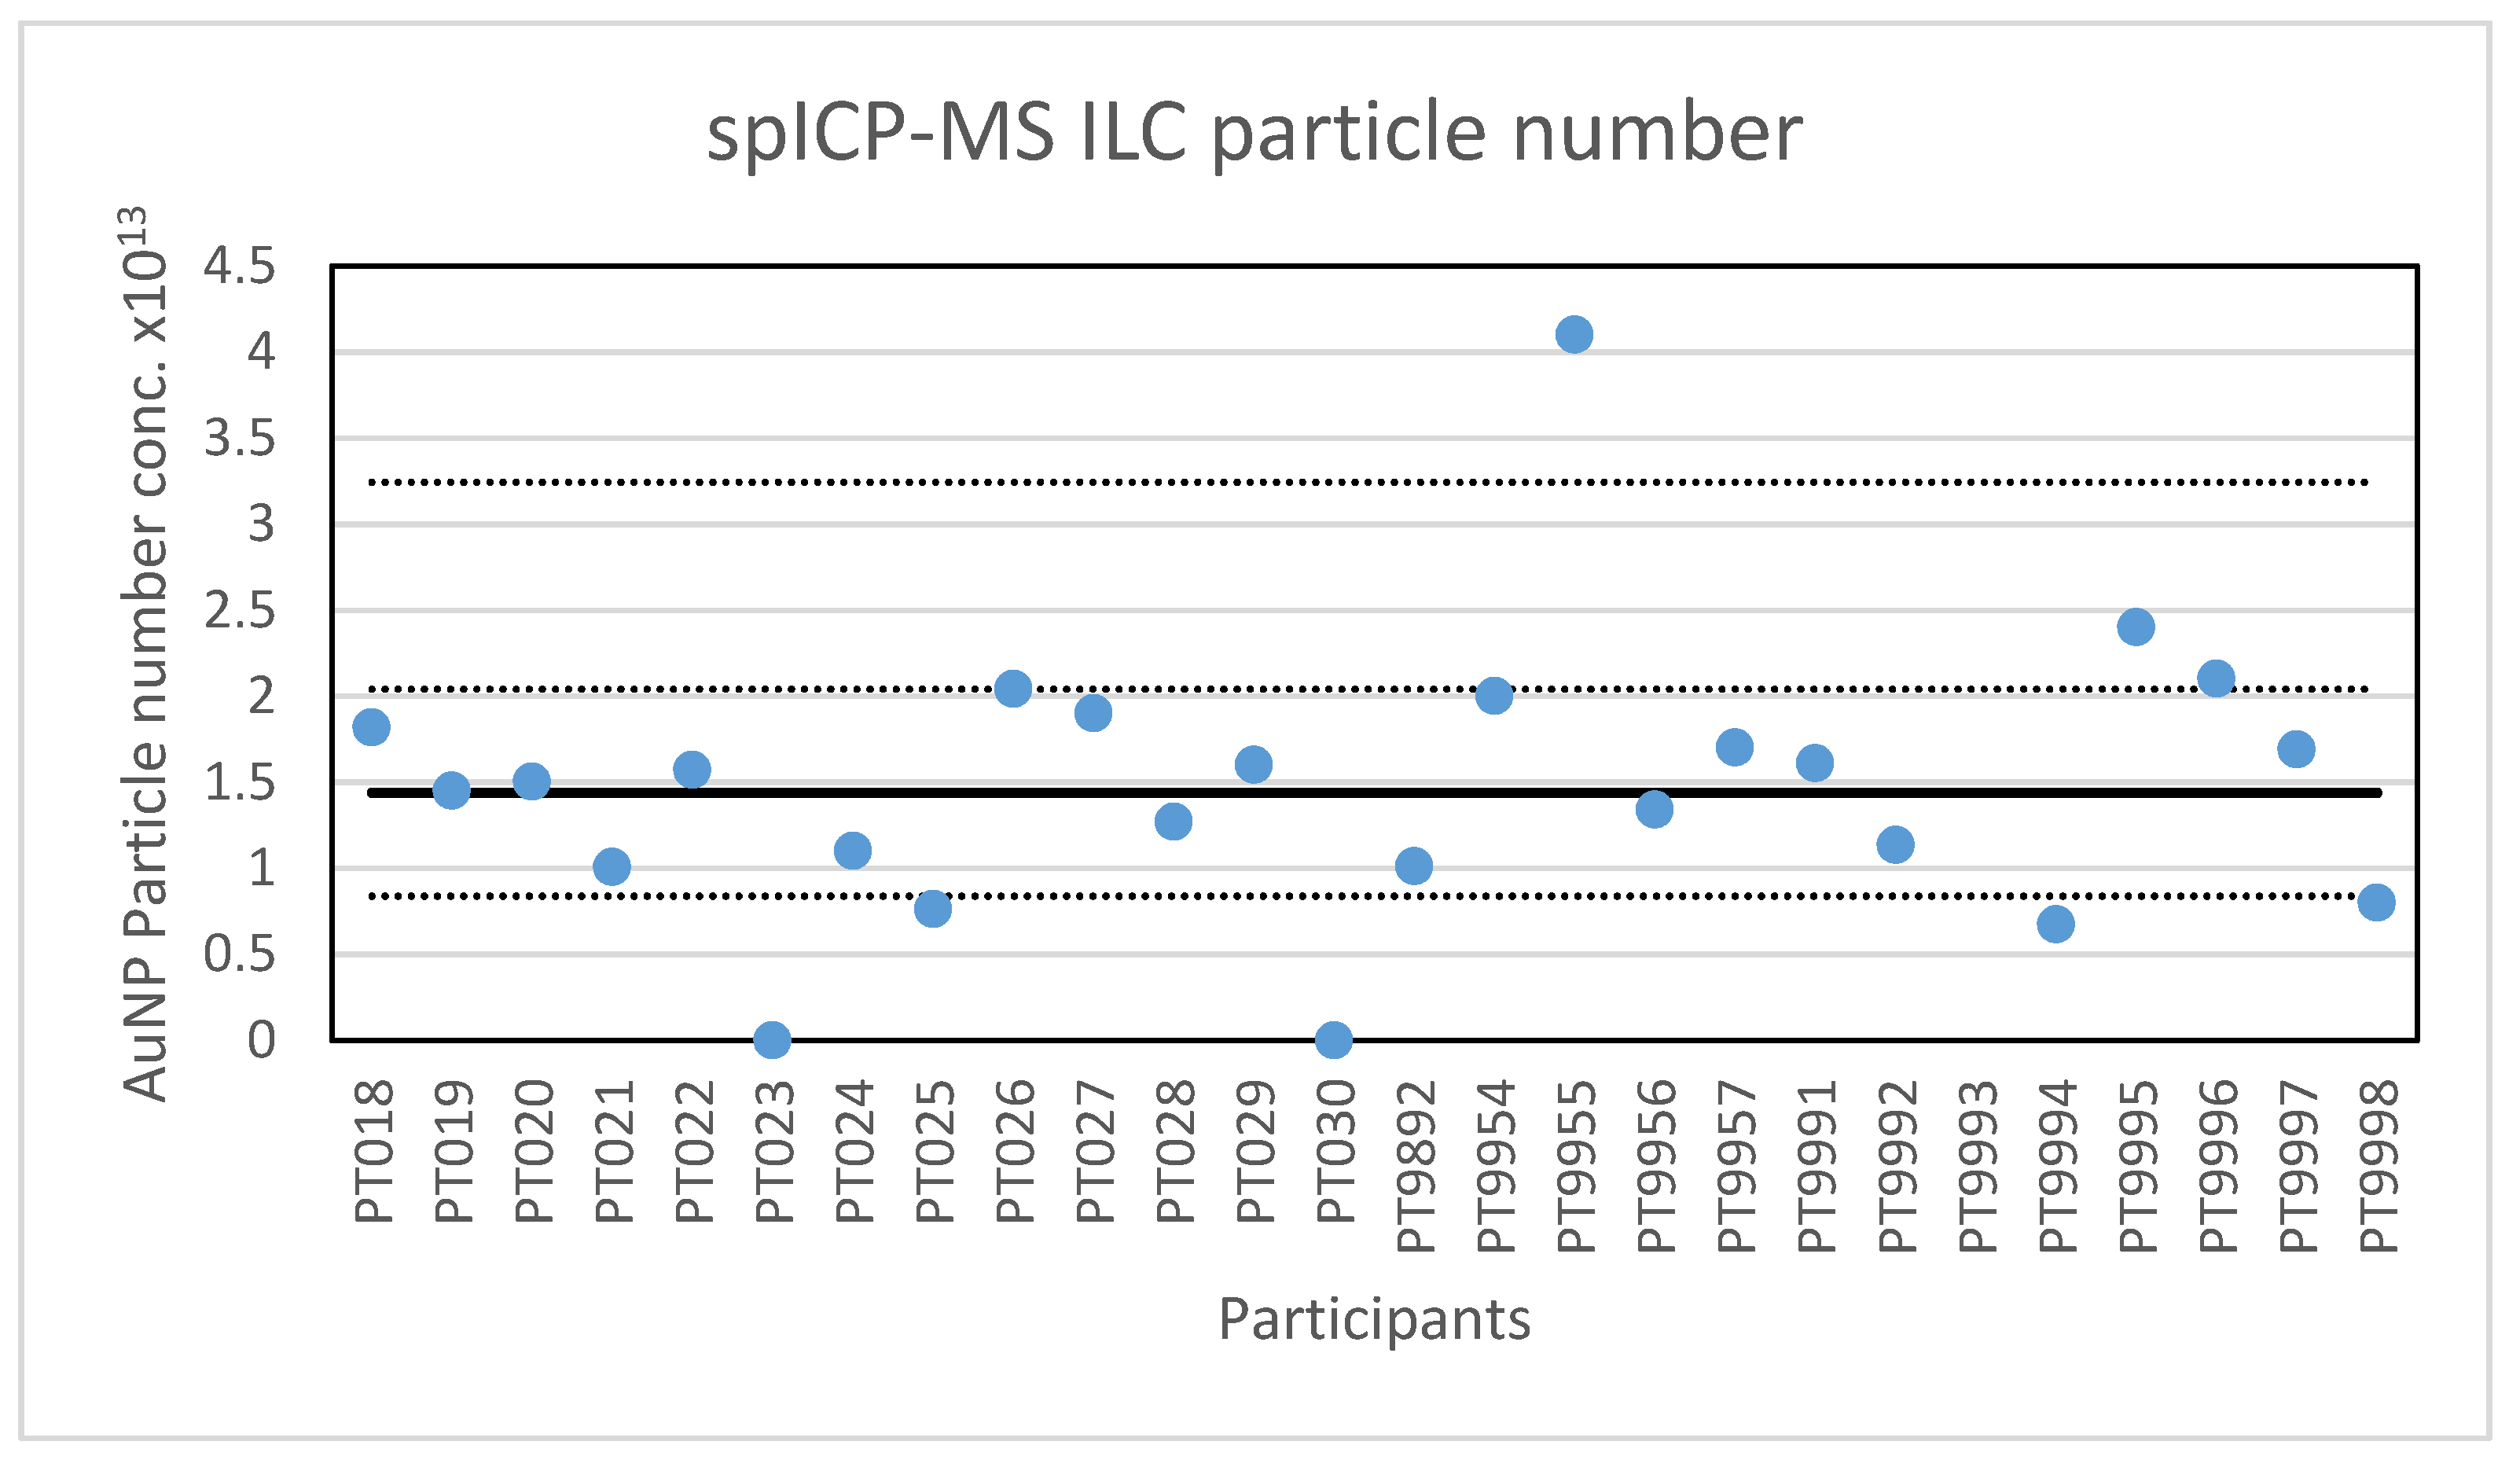
The second method selected for an ILC was spICP-MS. The results of the ILC look very promising, twenty-four out of twenty-six laboratories scored satisfactory results with particle sizes in the range of 52 to 74 nm. The two not satisfactory results reported particle sizes of 49.9 and 80 nm. Additionally, the robust standard deviation of 8% is better than the fit-for-purpose value of 10% and better than the reproducibility standard deviations of 20–35% that were achieved in an earlier ILC on the determination of silver NPs [
13]. The results are comparable to the results obtained in an intercomparison for DLS and centrifugal liquid sedimentation (CLS) where between-laboratory standard deviations of 5–6% were achieved and in which the participants were carefully selected for their experience with DLS [
27], while the participants in this ILC were not and did not receive any advice or training in spICP-MS. Therefore, we conclude that the results are satisfactory and that the laboratories that participated in the ILC are able to accurately determine the particle size of NP with spICP-MS. However, the determination of the particle number concentration produced far more deviating results than the mean particle diameter resulting in a robust standard deviation of 42%. The reason for this higher variation is not clear. One contributing factor could be that some participants reported particle numbers as determined (i.e., in the diluted preparation), some in the preparation and some in the original vial. To exclude this effect, some participants were asked to confirm the basis of their calculation and re-evaluate their results. A second contributing factor could be loss of particles over time, however, this was not indicated by the stability study which showed a small increase in the particle number concentration over time. A third contributing factor could be differences in the quality of the sample preparation (sonication) and dilution step. The relative robust standard deviation of 42% in this study is better than the between-laboratory standard deviation of 66–106% in an earlier ILC with Ag NPs in water [
13]. While the results indicate that this determination is still difficult, it did show some improvement in time as labs became more experienced in using the method, and as hardware and software improved.
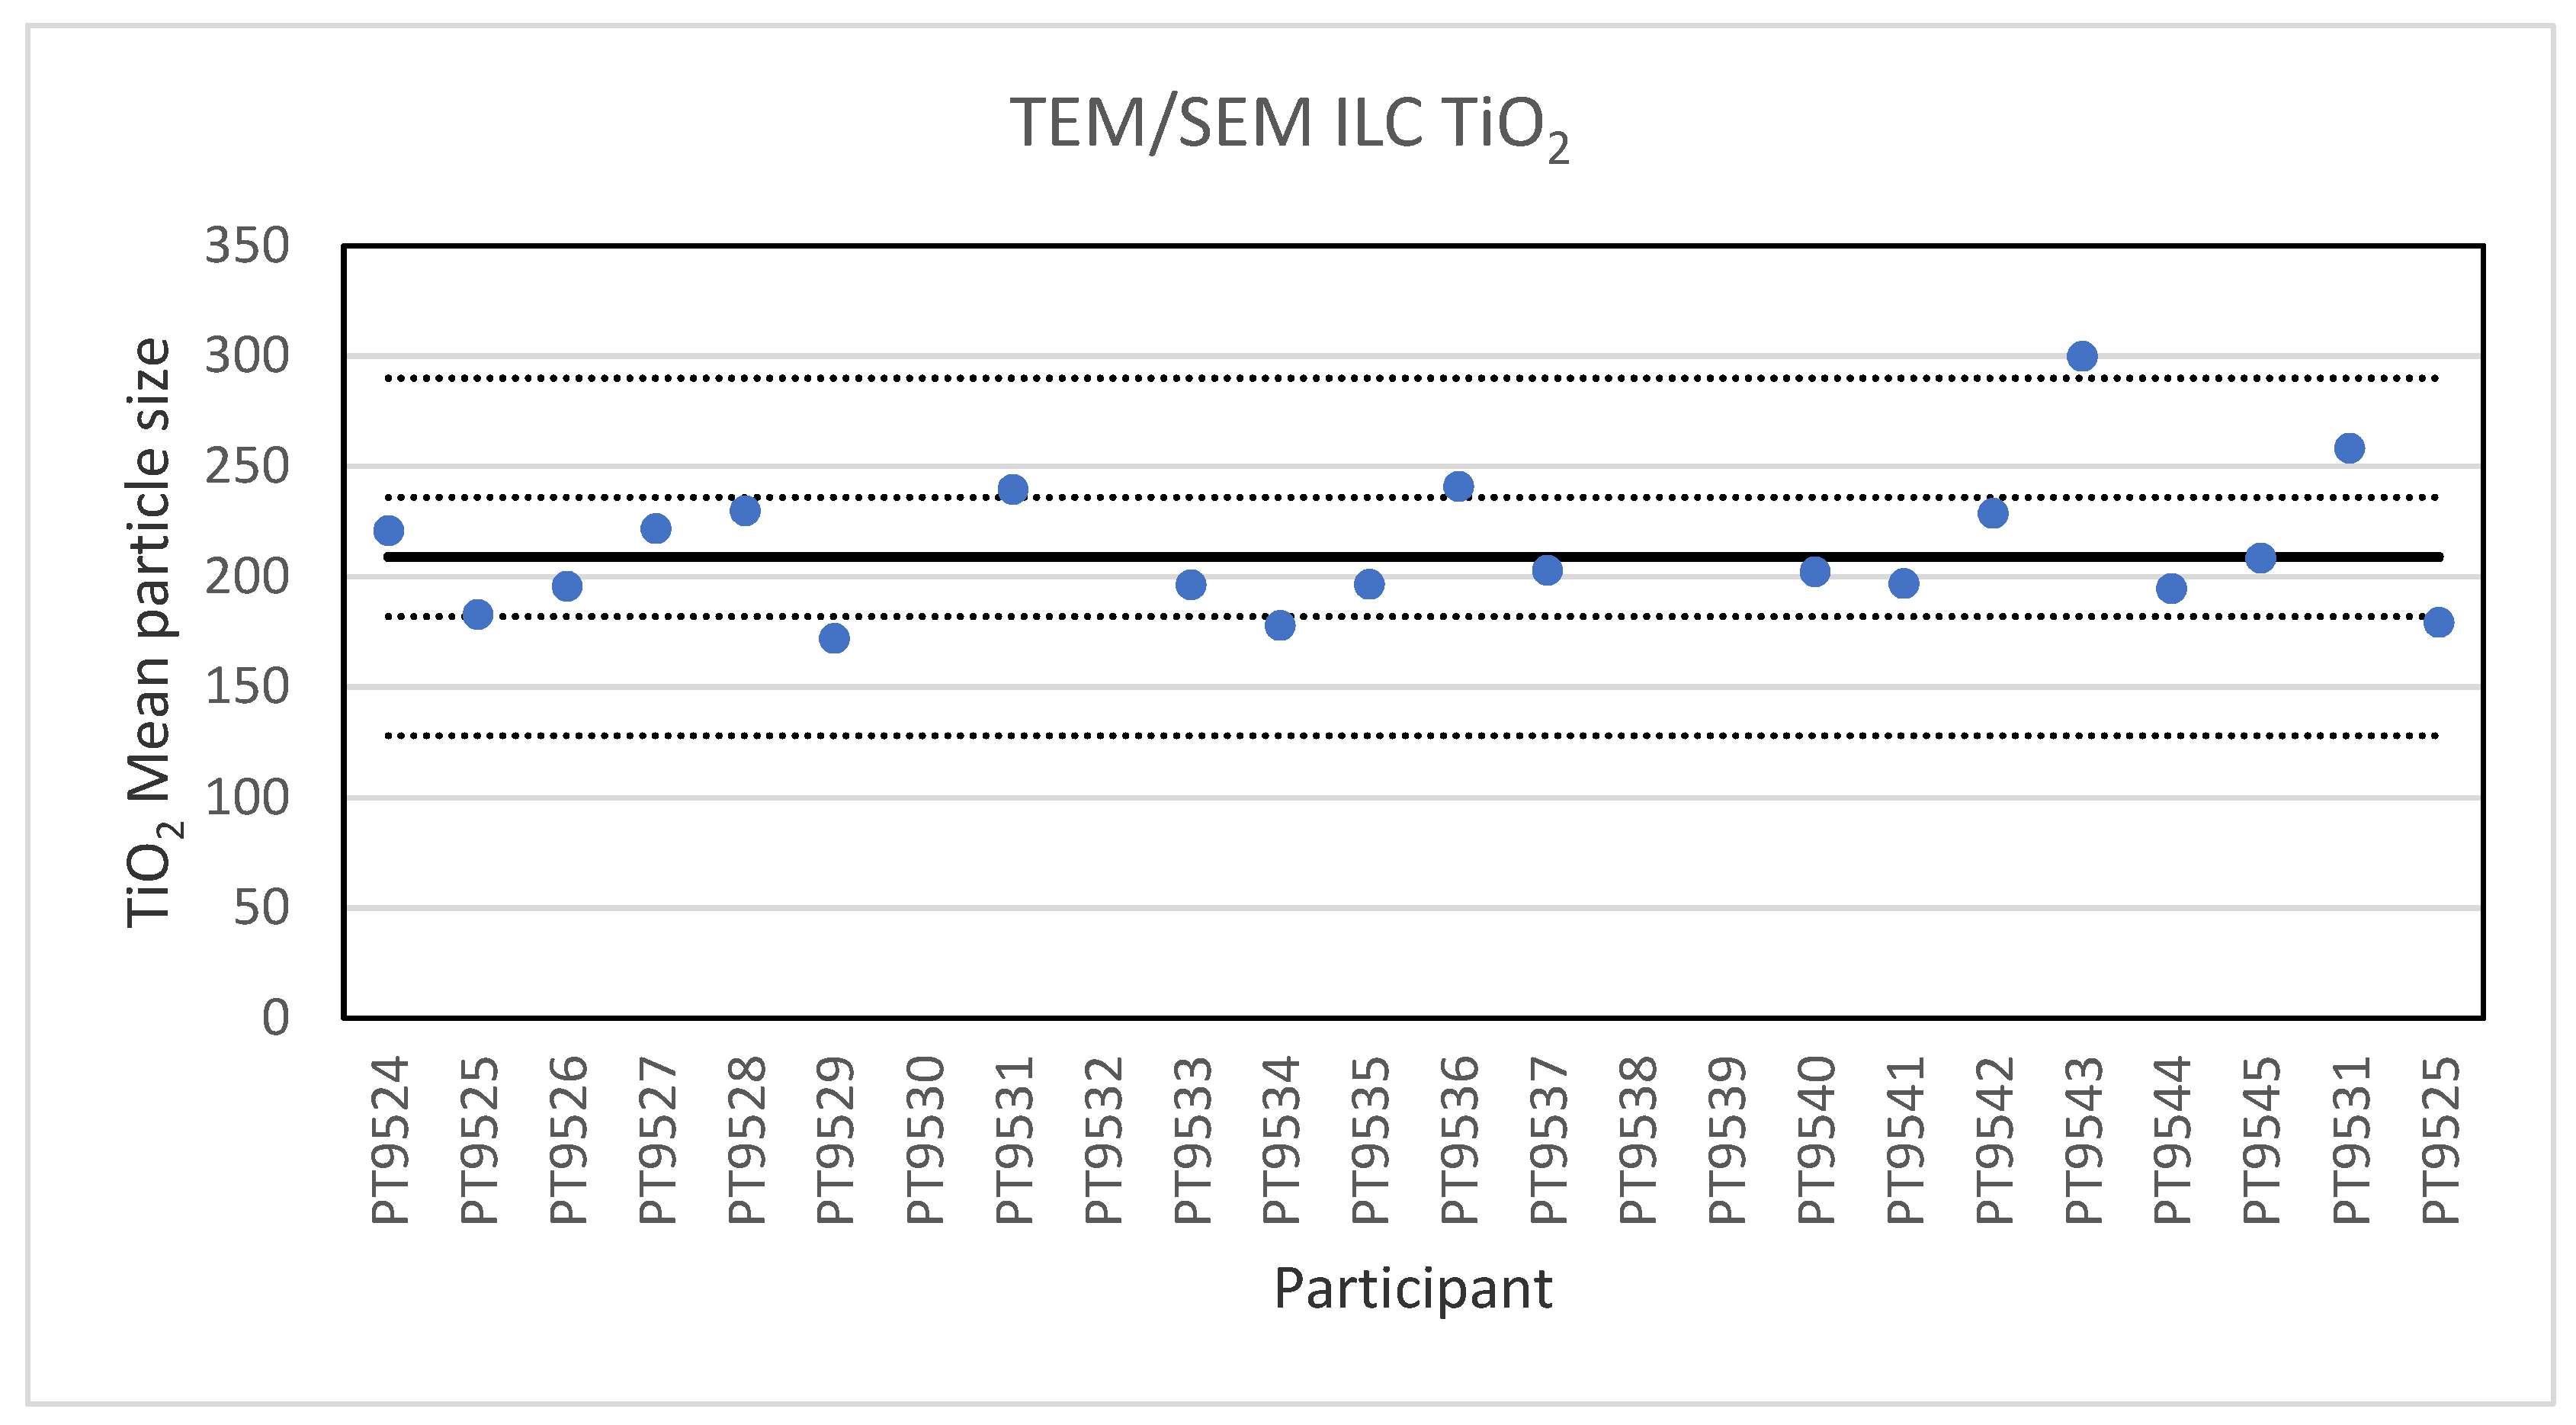
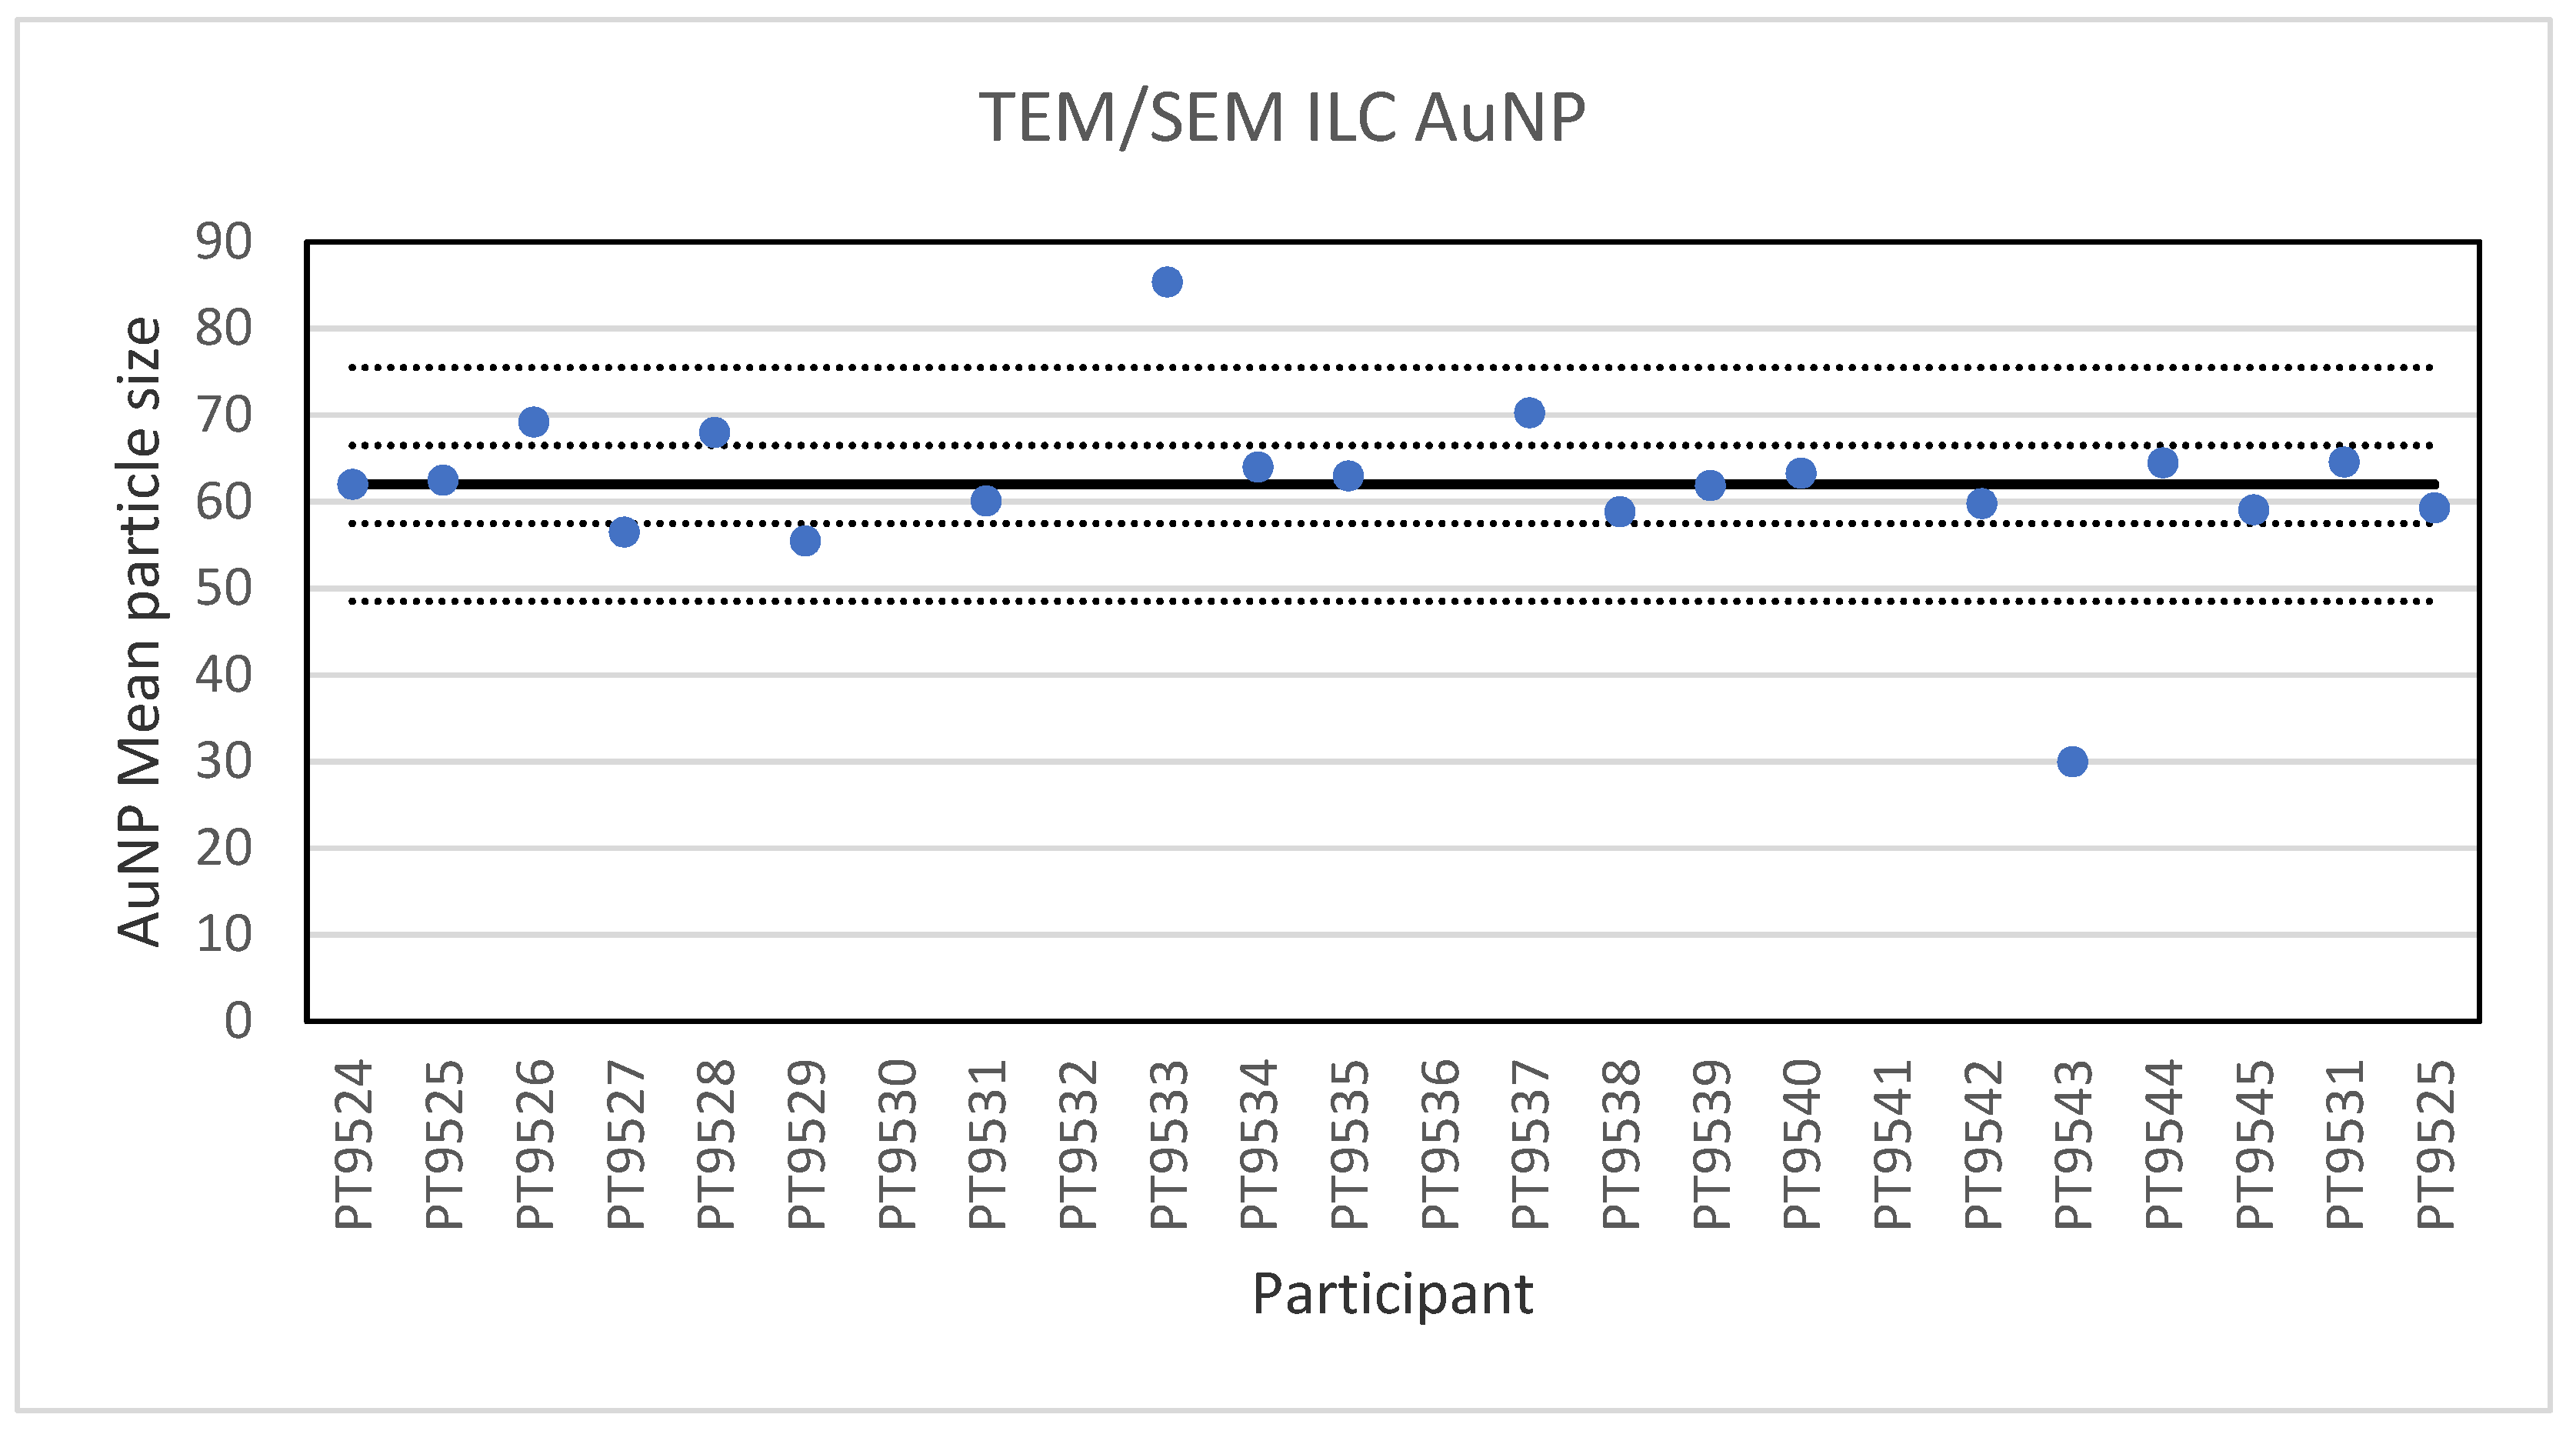
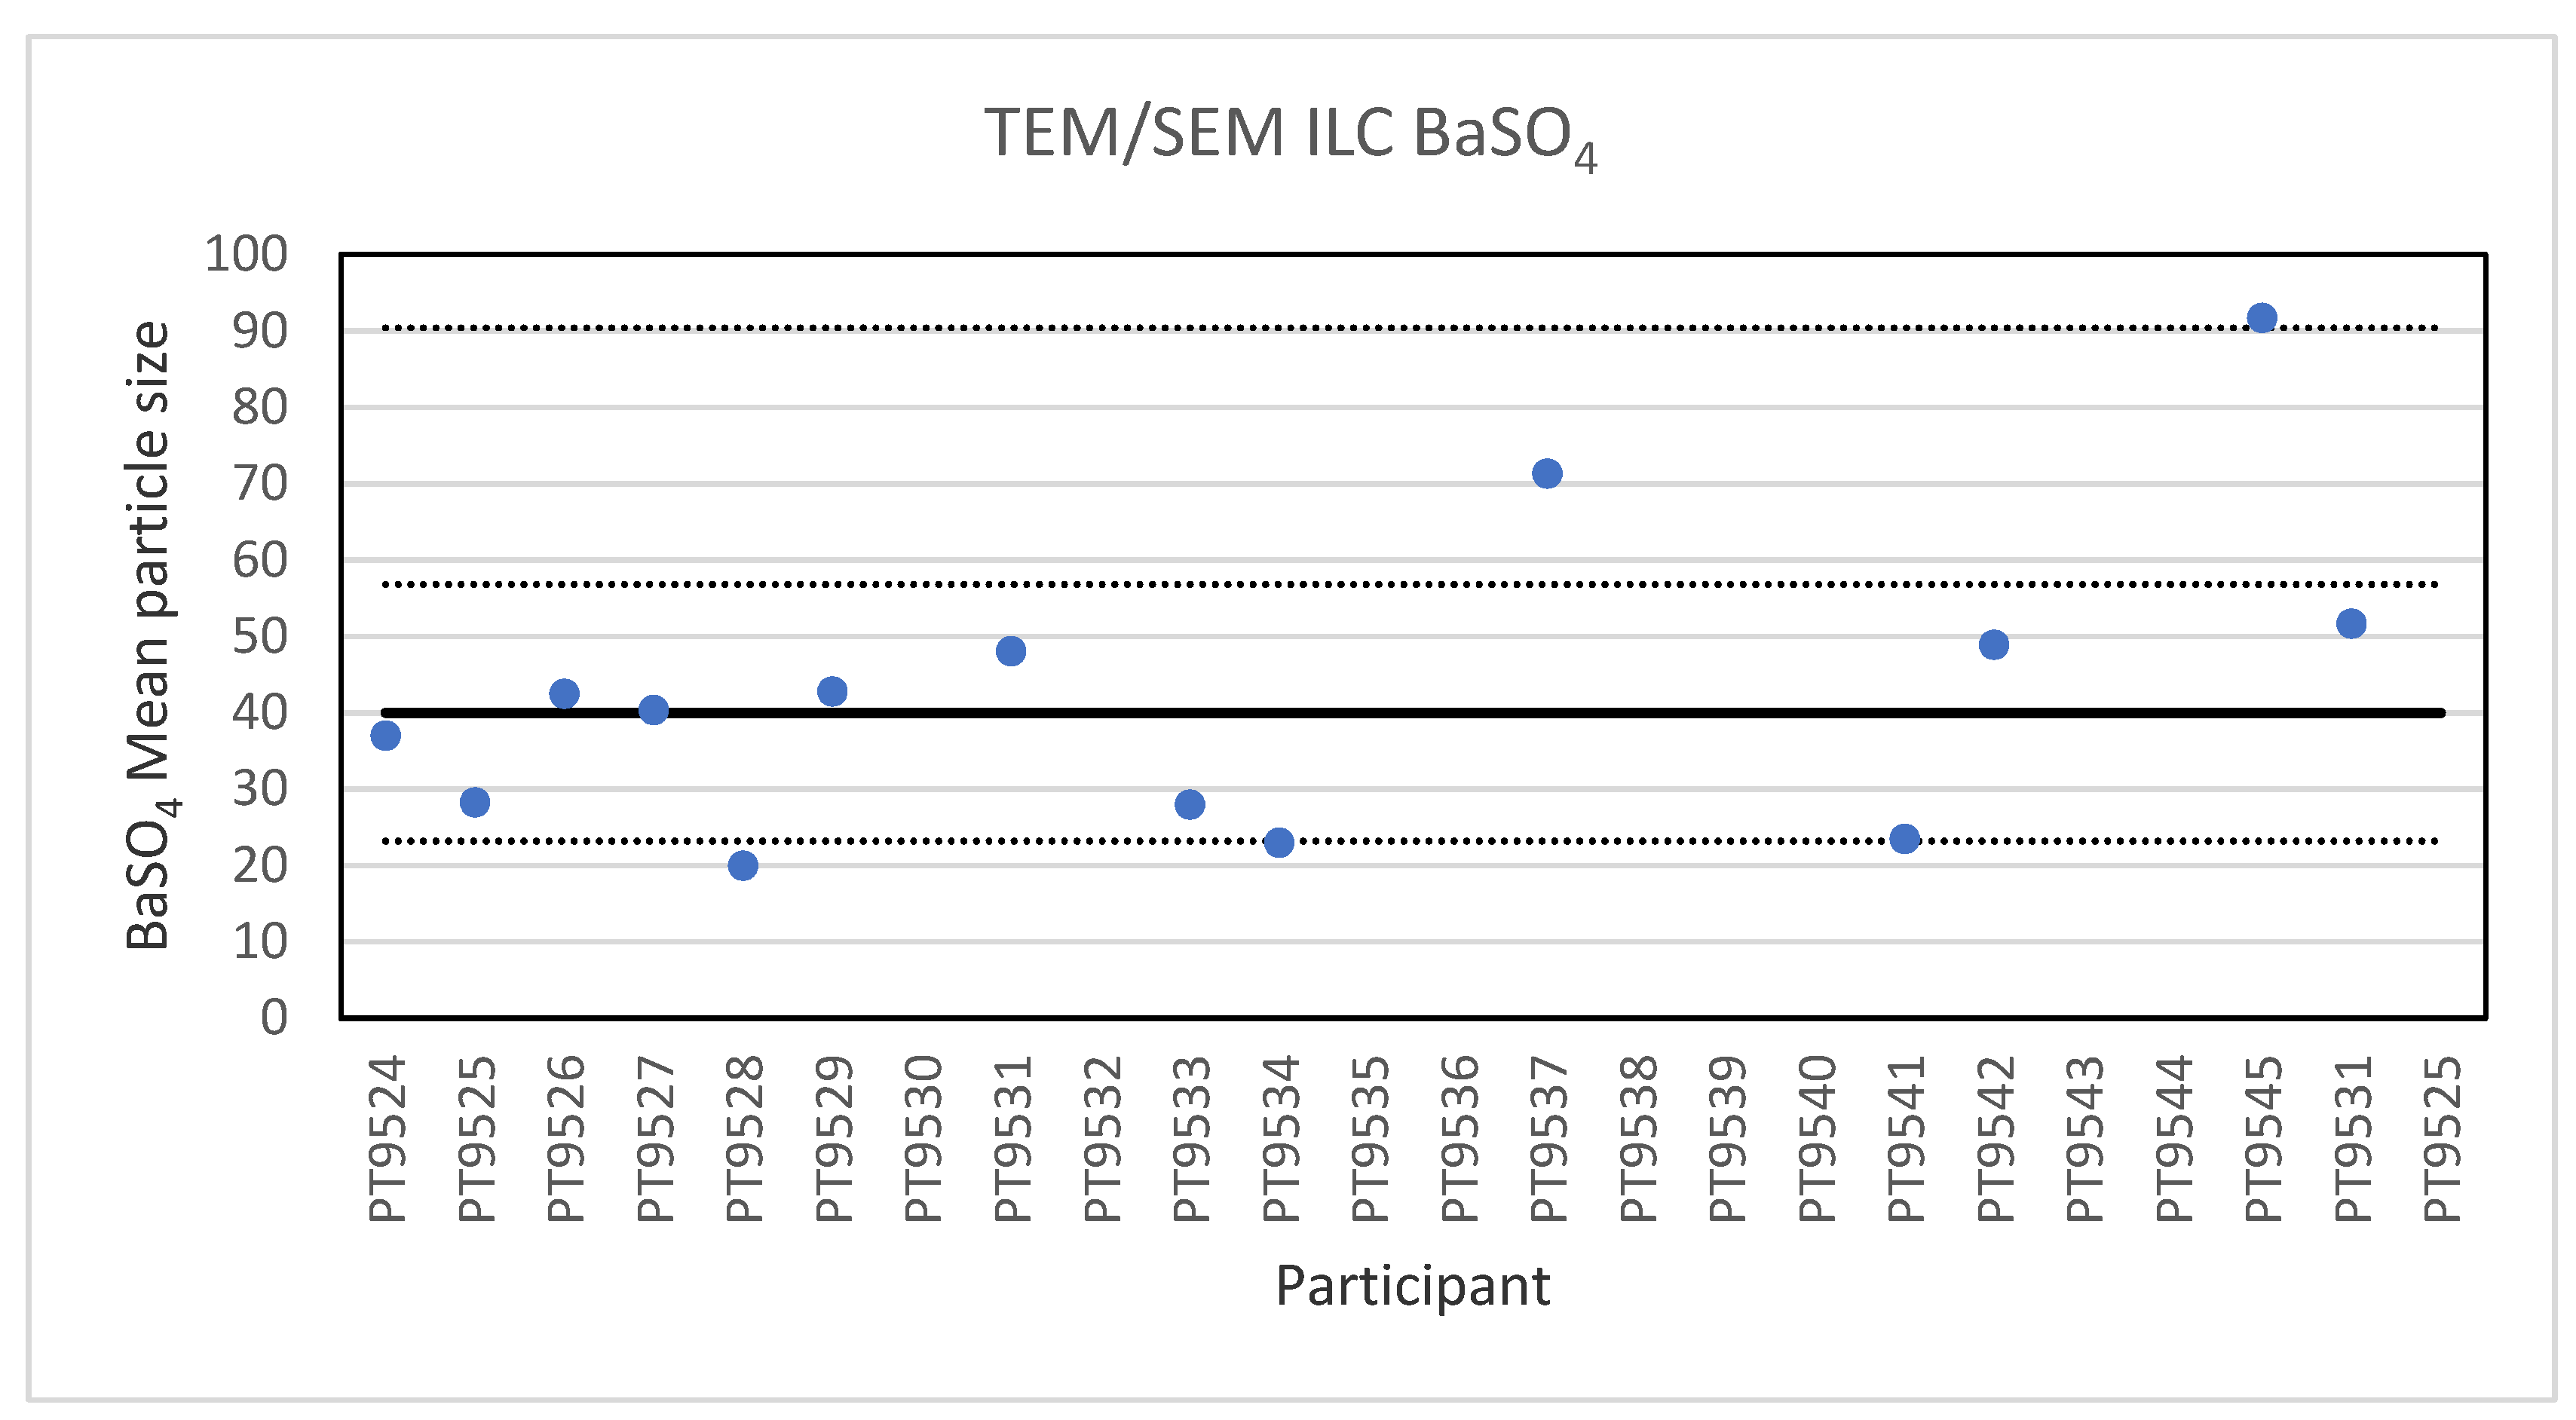
Electron microscopy is the only technique used in this series of ILCs with which NP can actually be directly imaged and which is capable of determining particle sizes as small as 1 nm. In this ILC, transmission as well as scanning electron microscopy (TEM/SEM) have been used. In general, the ILC for electron microscopy showed good results, wherein over 80% of the laboratories reported satisfactory results. In the cases where particles were spherical and showed a low tendency to agglomerate, such as the 60 nm Au NPs, accurate and precise results were produced. The particle sizes reported generally ranged from 55 to 70 nm with two outliers with sizes of 30 and 85.4 nm. The consensus value was 62 nm which compares well with the particle size provided by the supplier which is 60 ± 6 nm. In the case of irregular shaped particles, such as the 200 nm TiO2 particles, the robust standard deviation was higher than the fit-for-purpose value of 10%. One reason for this is probably that the irregular shape and a tendency to form agglomerates makes sizing of individual particles much more operator-dependent. Nevertheless, the consensus value of 209 nm was very close to the specified particle size of the reference material of 215.7 ± 56.3 nm. Difficulties were also observed for the strongly agglomerating 40 nm BaSO4 particles where a robust standard deviation of 42% was found. As with the TiO2 particles, the consensus value of 40 nm was in excellent agreement with the specified size of the reference material of 40.4 ± 20.2 nm. In general, when particles had irregular shapes and/or showed a tendency to agglomerate it is clear that the particle size determination was more problematic, resulting in an increased variation in the reported particle size.
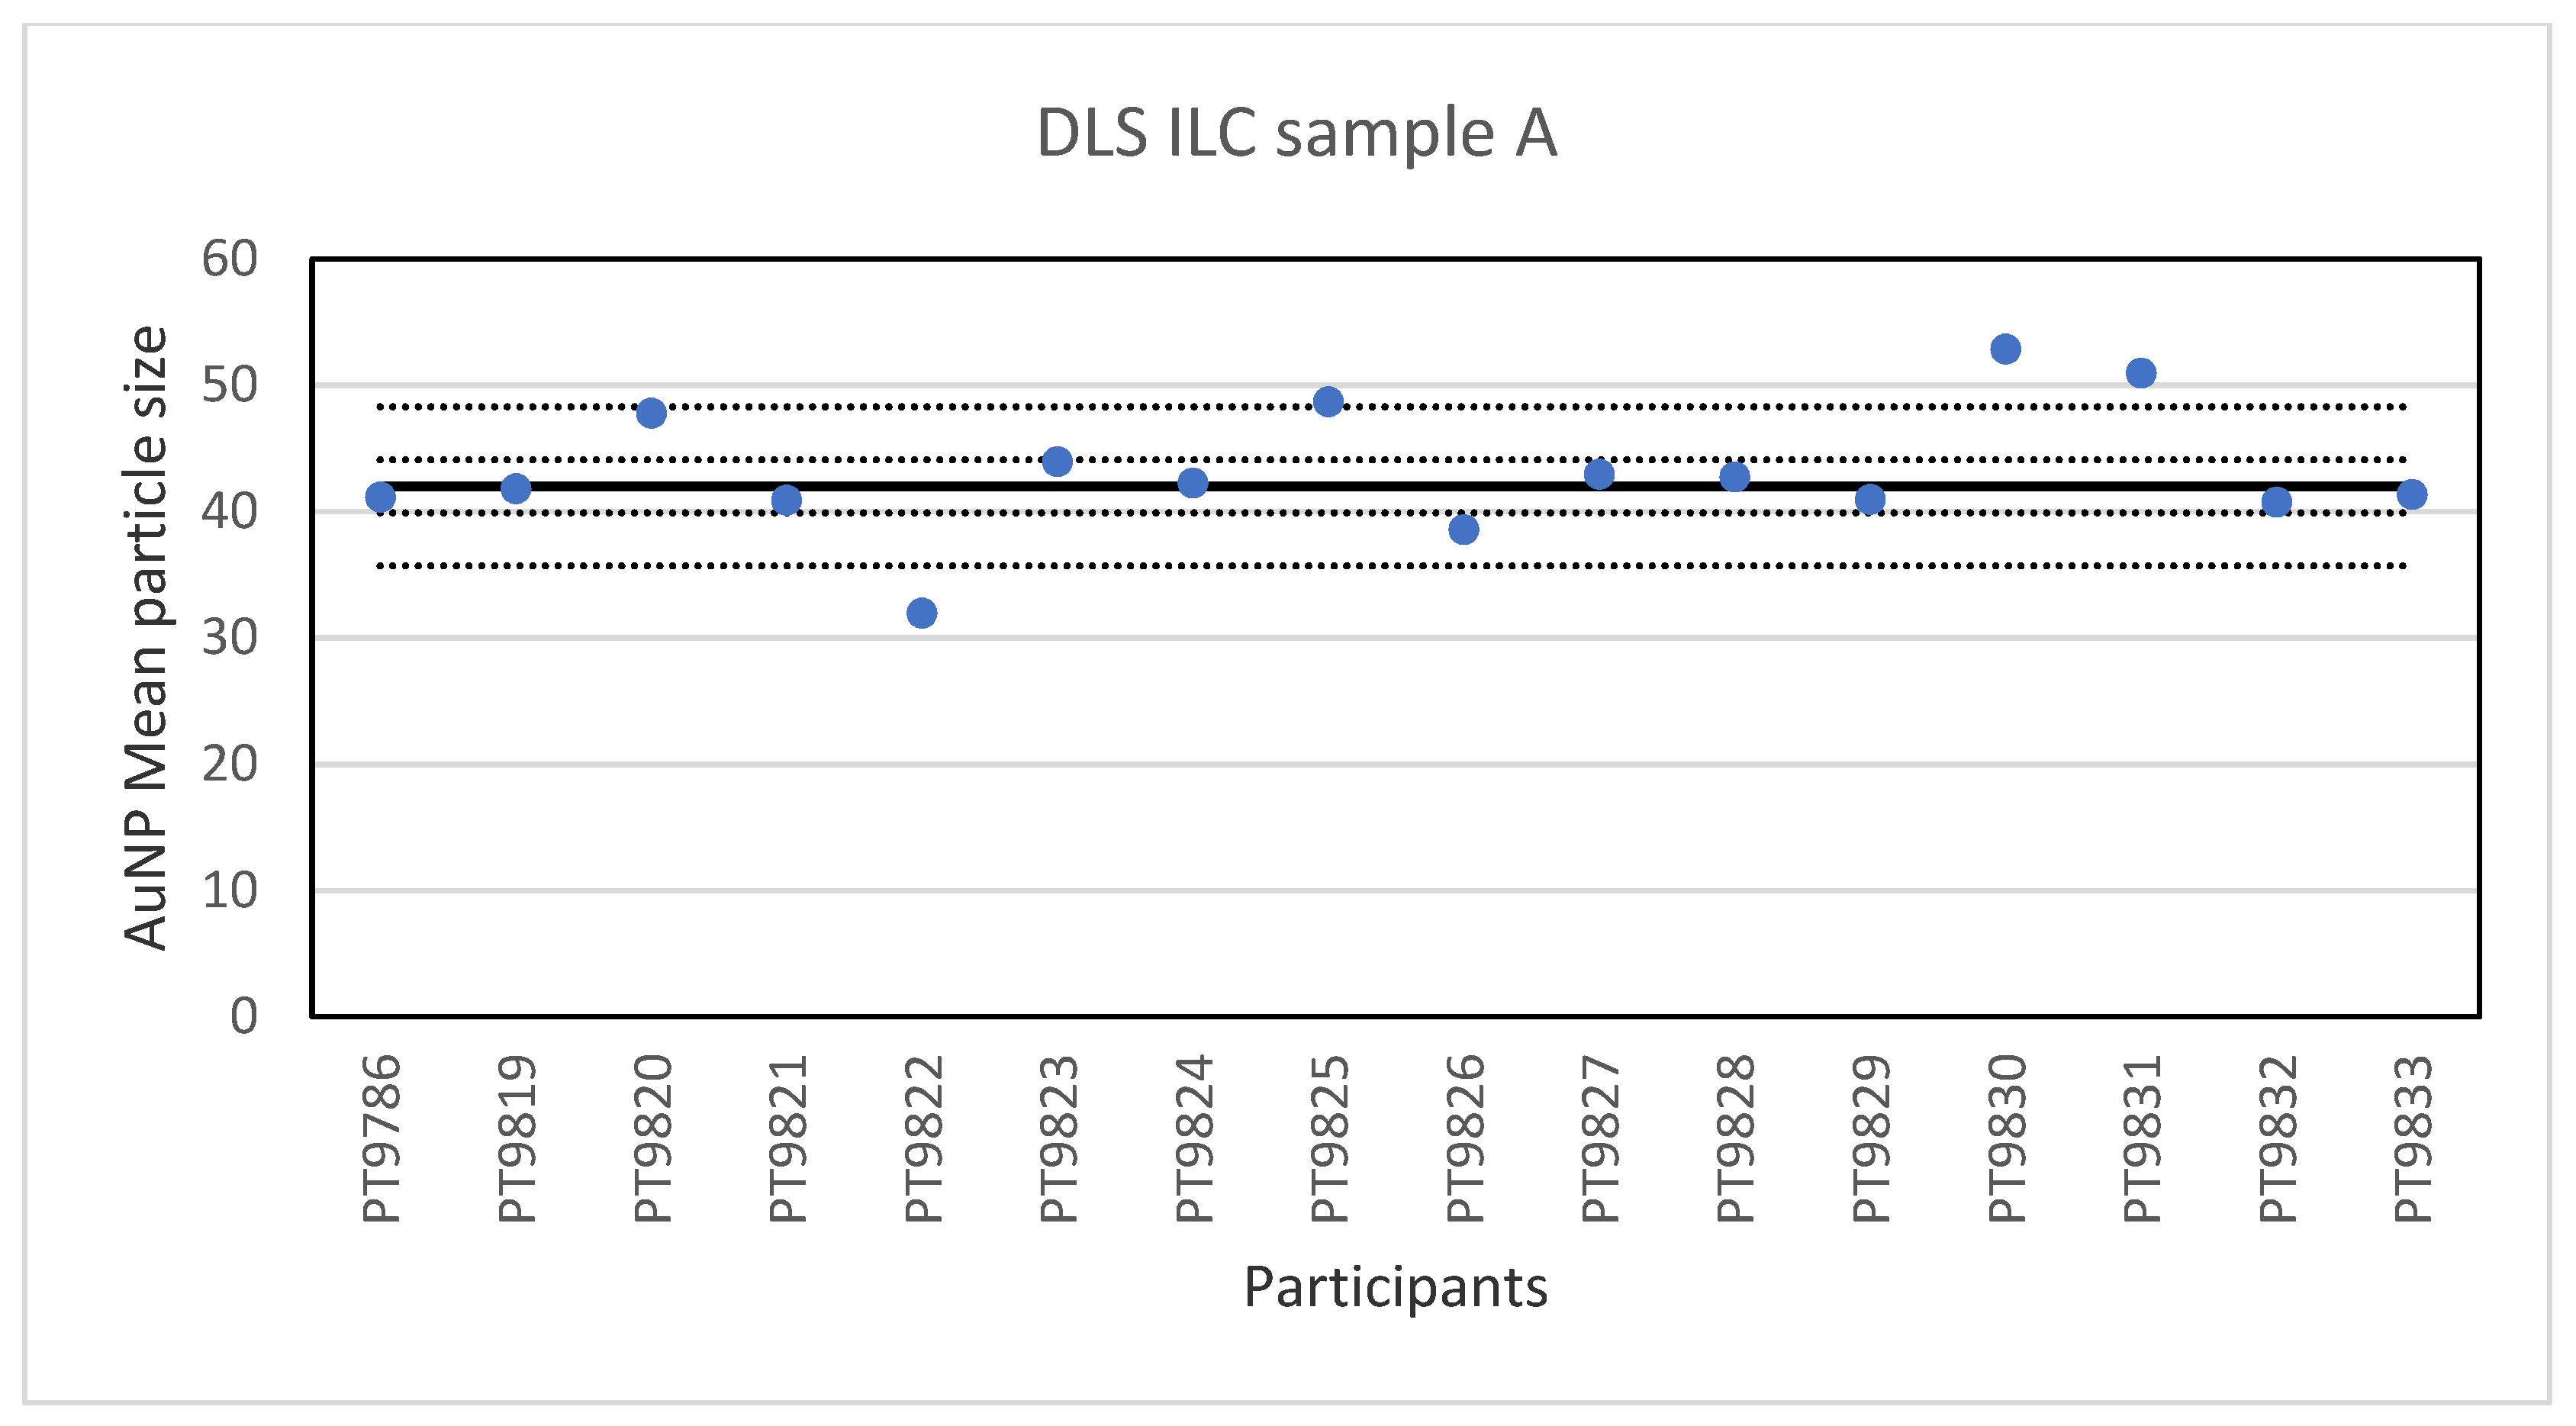
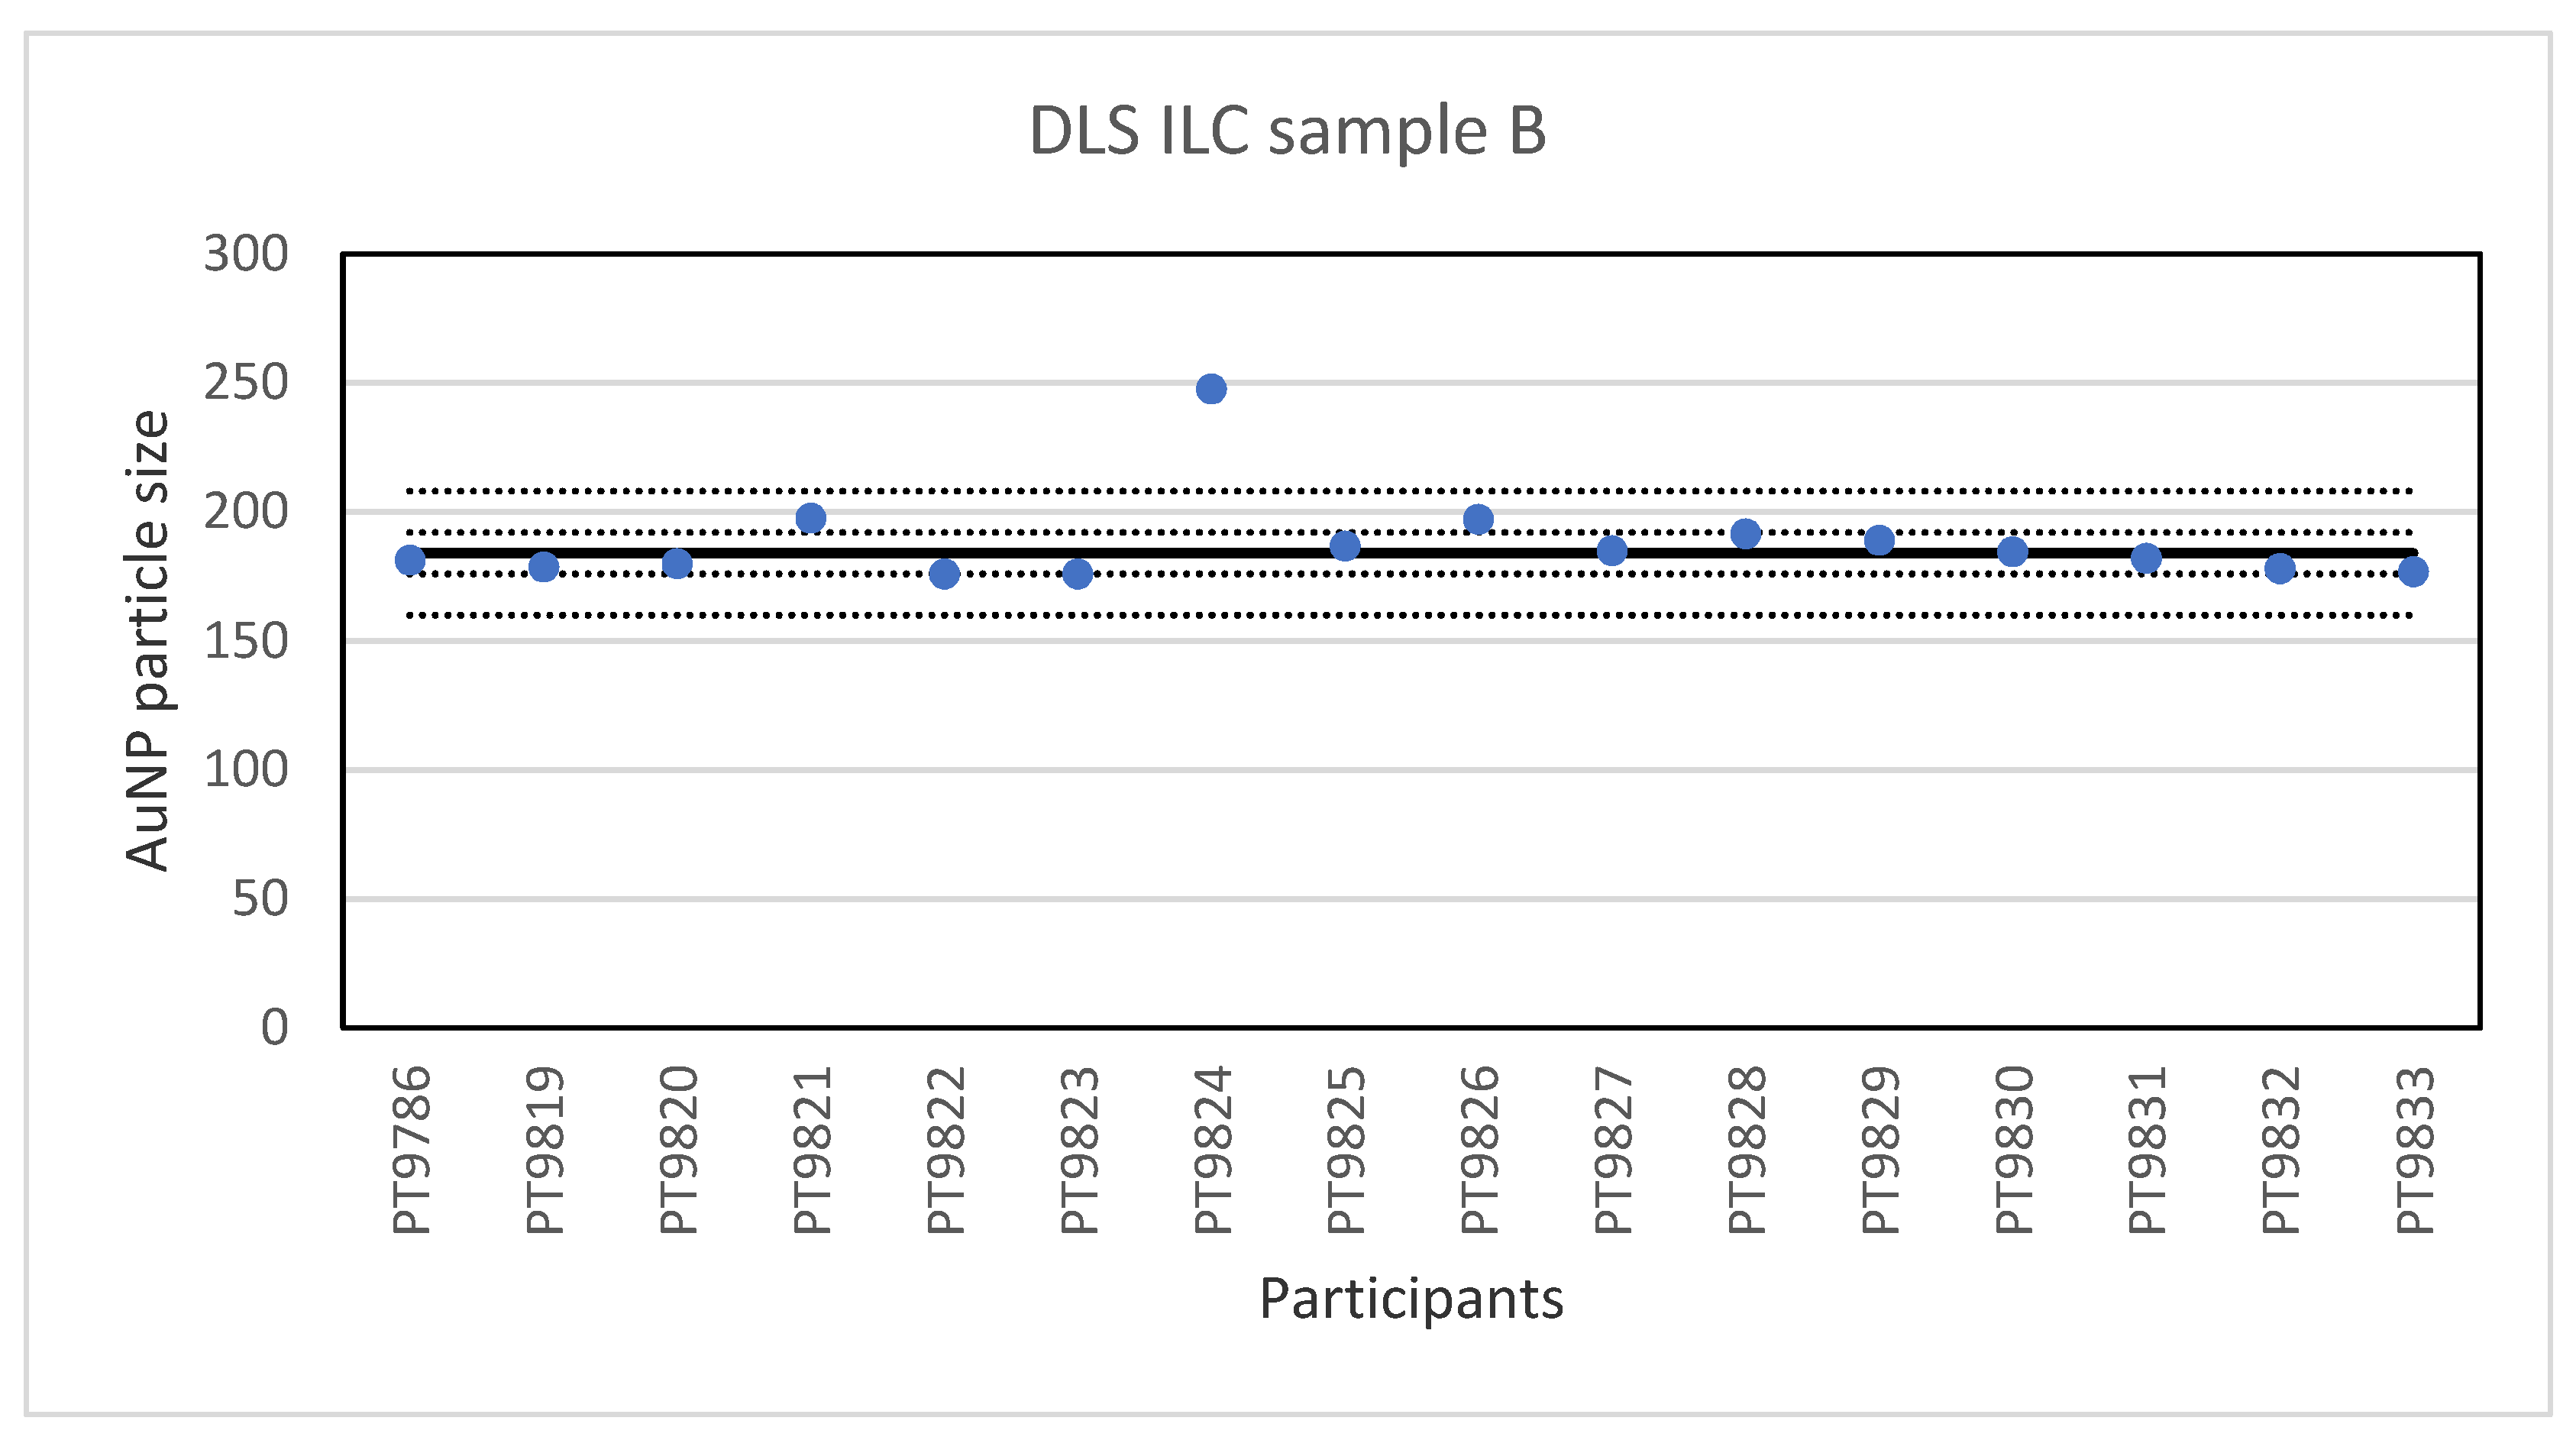
While PTA, spICP-MS and TEM/SEM were the only techniques capable of reporting a number-based particle size distribution, two more ILCs were organised utilising other popular techniques to determine particle size, DLS and AF4. The results for the single-size samples A and B show that DLS is very well capable of accurately determining the particle size of relatively monodisperse spherical particles. This is not surprising since long-established and dedicated instruments and ISO standards are available for this method. On average, the relative robust standard deviation was 4–5% which compares well with the results of an earlier intercomparison organised for DLS and in which between-laboratory standard deviations of 5–6% were achieved [
27]. To make the determination more challenging, the participants were also asked to measure particle sizes in a 1:1 mixture (sample C) of the particle populations from samples A and B. While the particle sizes found for the small and large particle in sample C were almost the same as in the single-size samples A and B, the variation in the results was much larger. The relative robust standard deviation was 16–19% compared to the 4–5% in the single-size measurements. The results clearly indicate that measuring particle size in the presence of different sized particles is more challenging and leads to higher relative robust standard deviations, in this case about four times larger compared to the single-sized particle measurements.
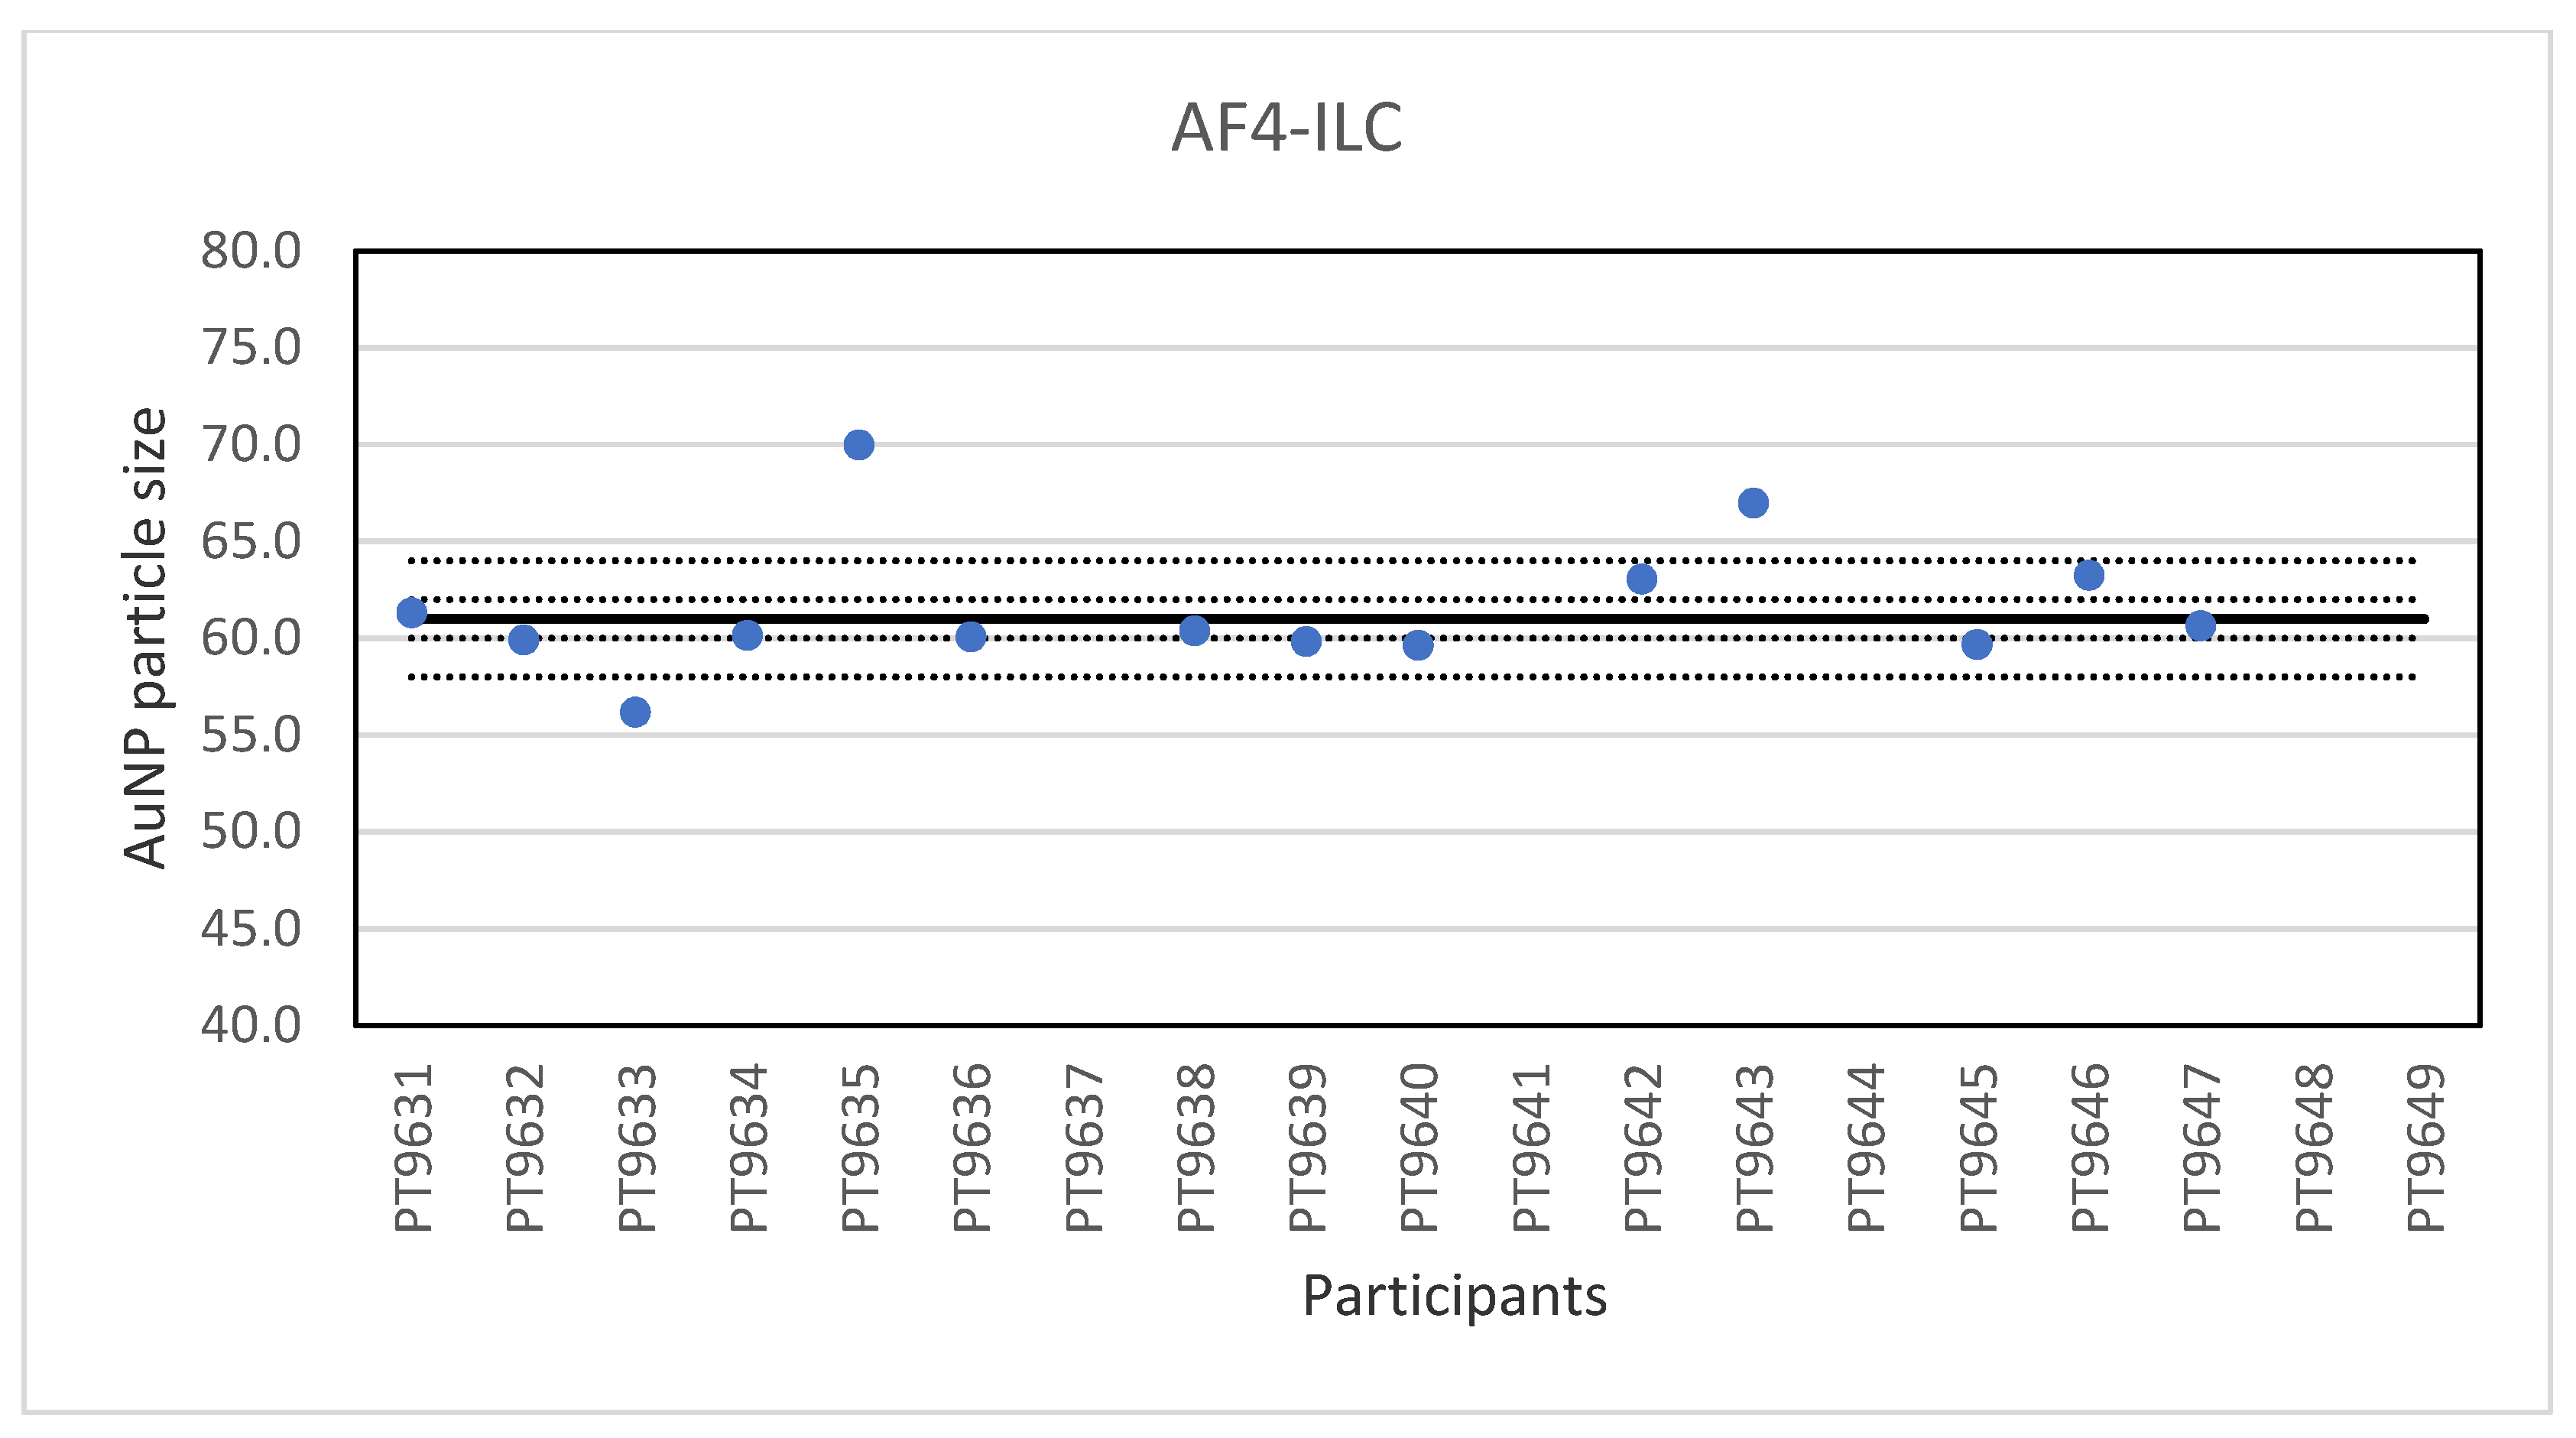
Another ILC was organised for AF4 which is a fractionation method used for the characterisation of NP, polymers and proteins. Samples were prepared from 60 nm Au NP by dilution in the same matrix as the original material. A set of suspensions of citrate-stabilised gold NP with particle sizes from 20–100 nm were included to prepare a particle size calibration curve. Participants were encouraged to use their in-house method and practical experience to select the most appropriate instrument settings. With particle sizes reported ranging from 55.6 to 70 nm and a very low relative robust standard deviation of about 2% the results of the ILC were excellent.
It is interesting to compare the results of PTA, spICP-MS, TEM/SEM and AF4 for a well-defined spherical particle such as the 60 nm Au particle since these four methods use different principles and do not determine the same kind of particle diameter. PTA and AF4 determine the hydrodynamic diameter of the particle while spICP-MS determines a mass-based spherical equivalent diameter and TEM/SEM a geometrical diameter [
28]. The results of the independent ILCs were as follows: PTA 62 ± 2.3 nm; spICP-MS 61 ± 4.9 nm; TEM/SEM 62 ± 4.5 nm; AF4 61 ± 1.0 nm. As expected, these results are in good agreement, even using these different methods and agree well with the manufacturer’s specification of 60 ± 6 nm.
Finally, two consumer products, a sun screen lotion and a toothpaste, were selected for an ILC allowing the participants to use PTA, spICP-MS, TEM/SEM or a multiple of these techniques to determine the particle size of the TiO2 particles in these products. Participants were asked to determine the mean particle size and the D50 value, the median particle size where 50% of the particles is smaller than that size and 50% larger. This, of course, is related to the EU definition of an NM for regulatory purposes where, for 50% or more of the particles in the number size distribution, one or more external dimensions are in the size range of 1–100 nm. As a consequence, if the D50 value is below 100 nm the material is an NM and this should have been declared on the packaging of the product.
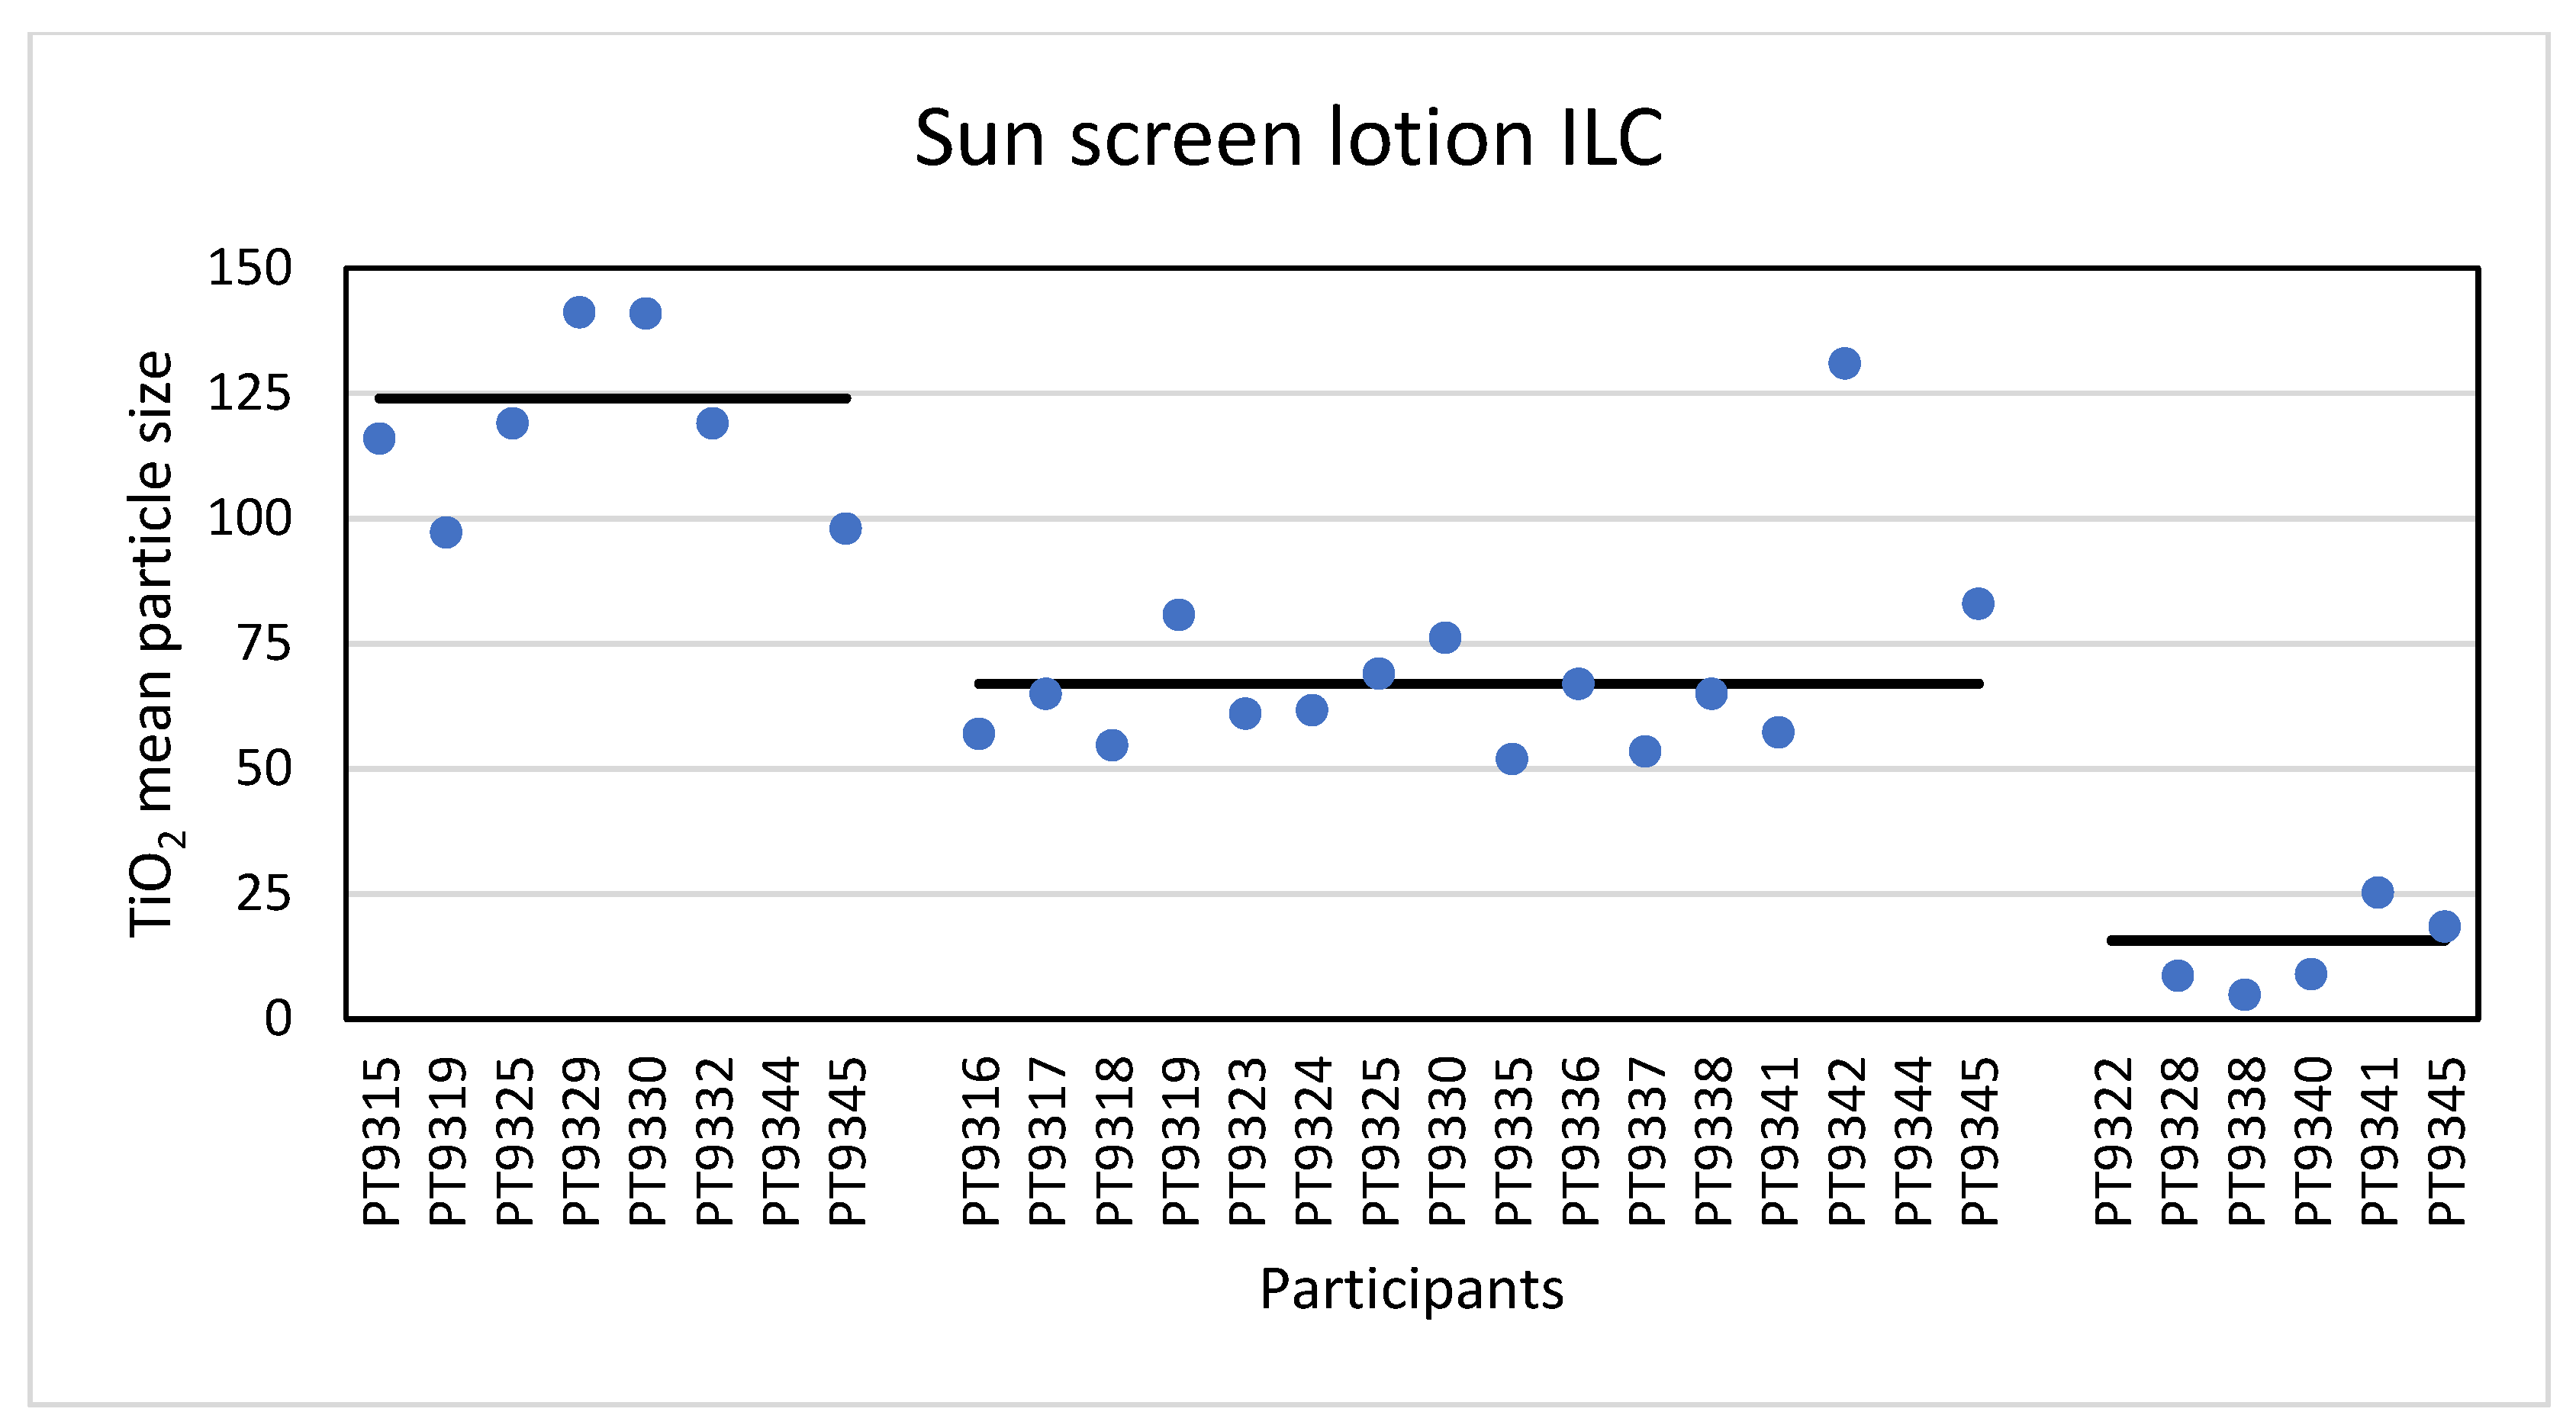
Eight laboratories reported results for the TiO
2 particles in the sunscreen product as determined with PTA. The consensus value for mean particle size was 124 nm with a robust standard deviation of 26 nm. This is comparable to the fit-for-purpose value. The consensus value for D
50 was 120 nm and six of the participating laboratories scored a D
50 > 100 nm. From the D
50 value as determined with PTA, it would be concluded that the particles in the sunscreen lotion are not an NM. However, it was found out later that the sunscreen lotion contained not only TiO
2 particles but also ZnO particles which were not declared on the packaging. While the particle number concentration of the ZnO particles was much lower than that of the TiO
2 particles, the particle sizes of the ZnO particles were much larger than the TiO
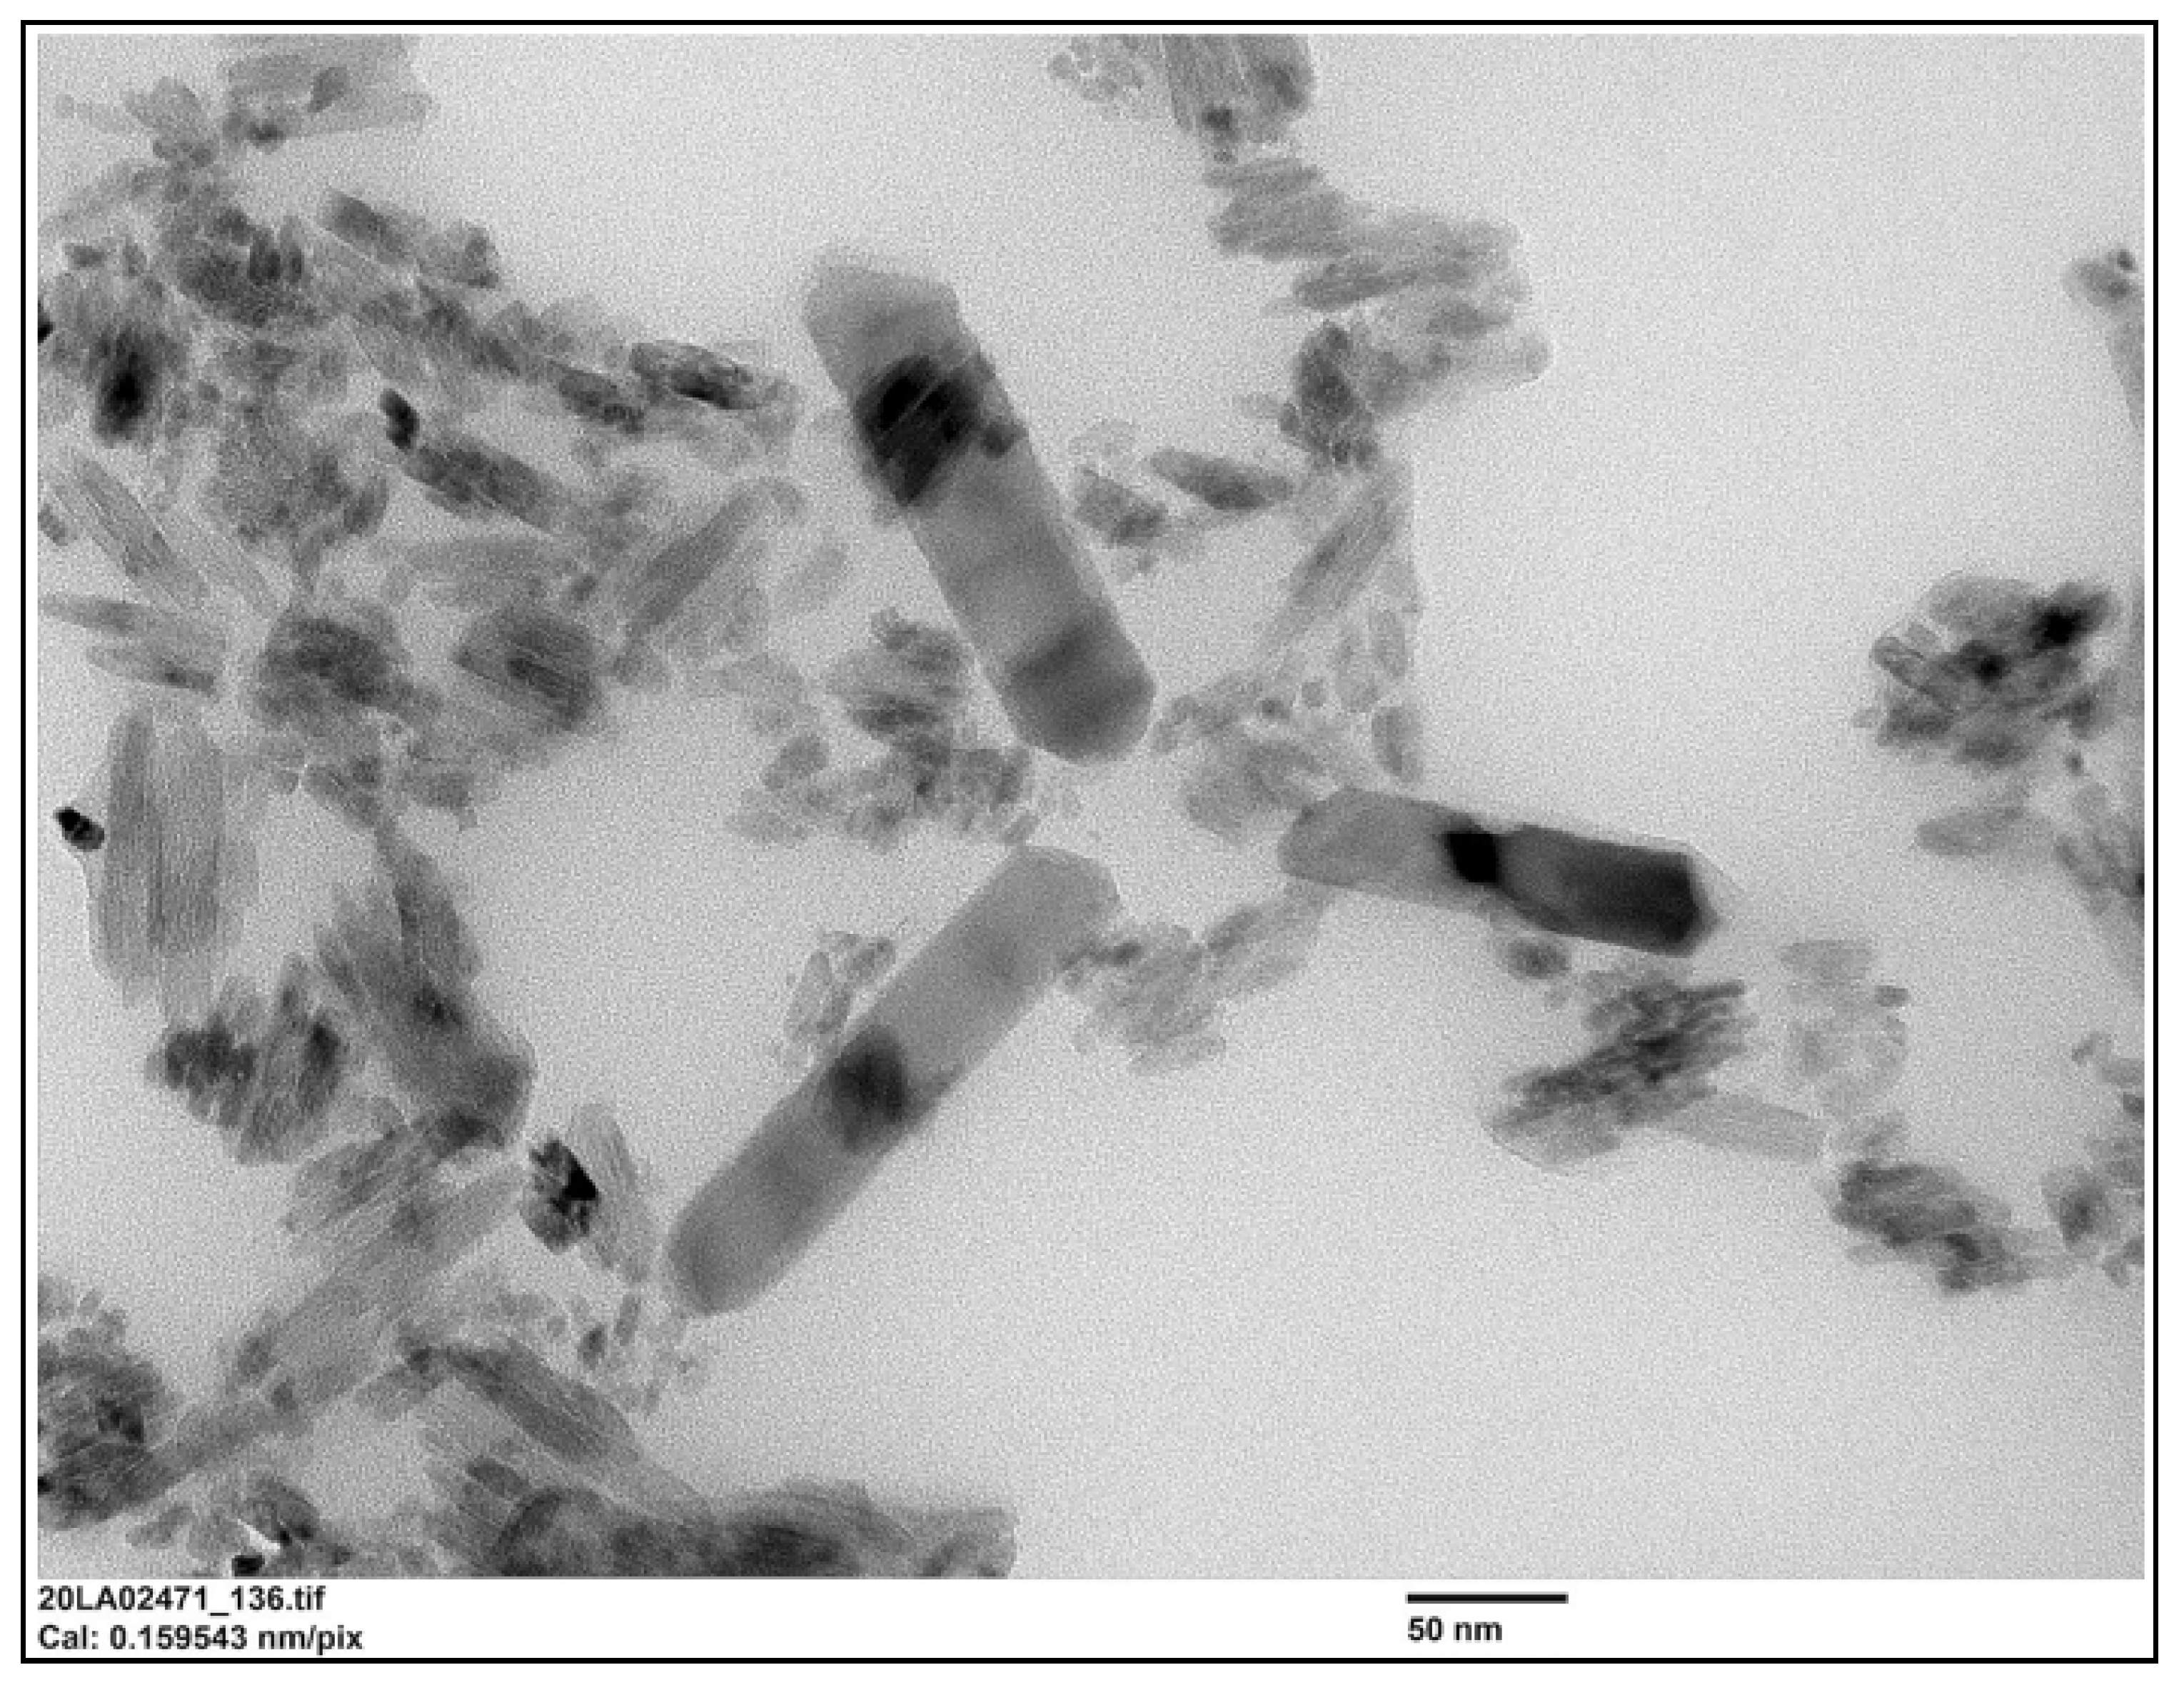
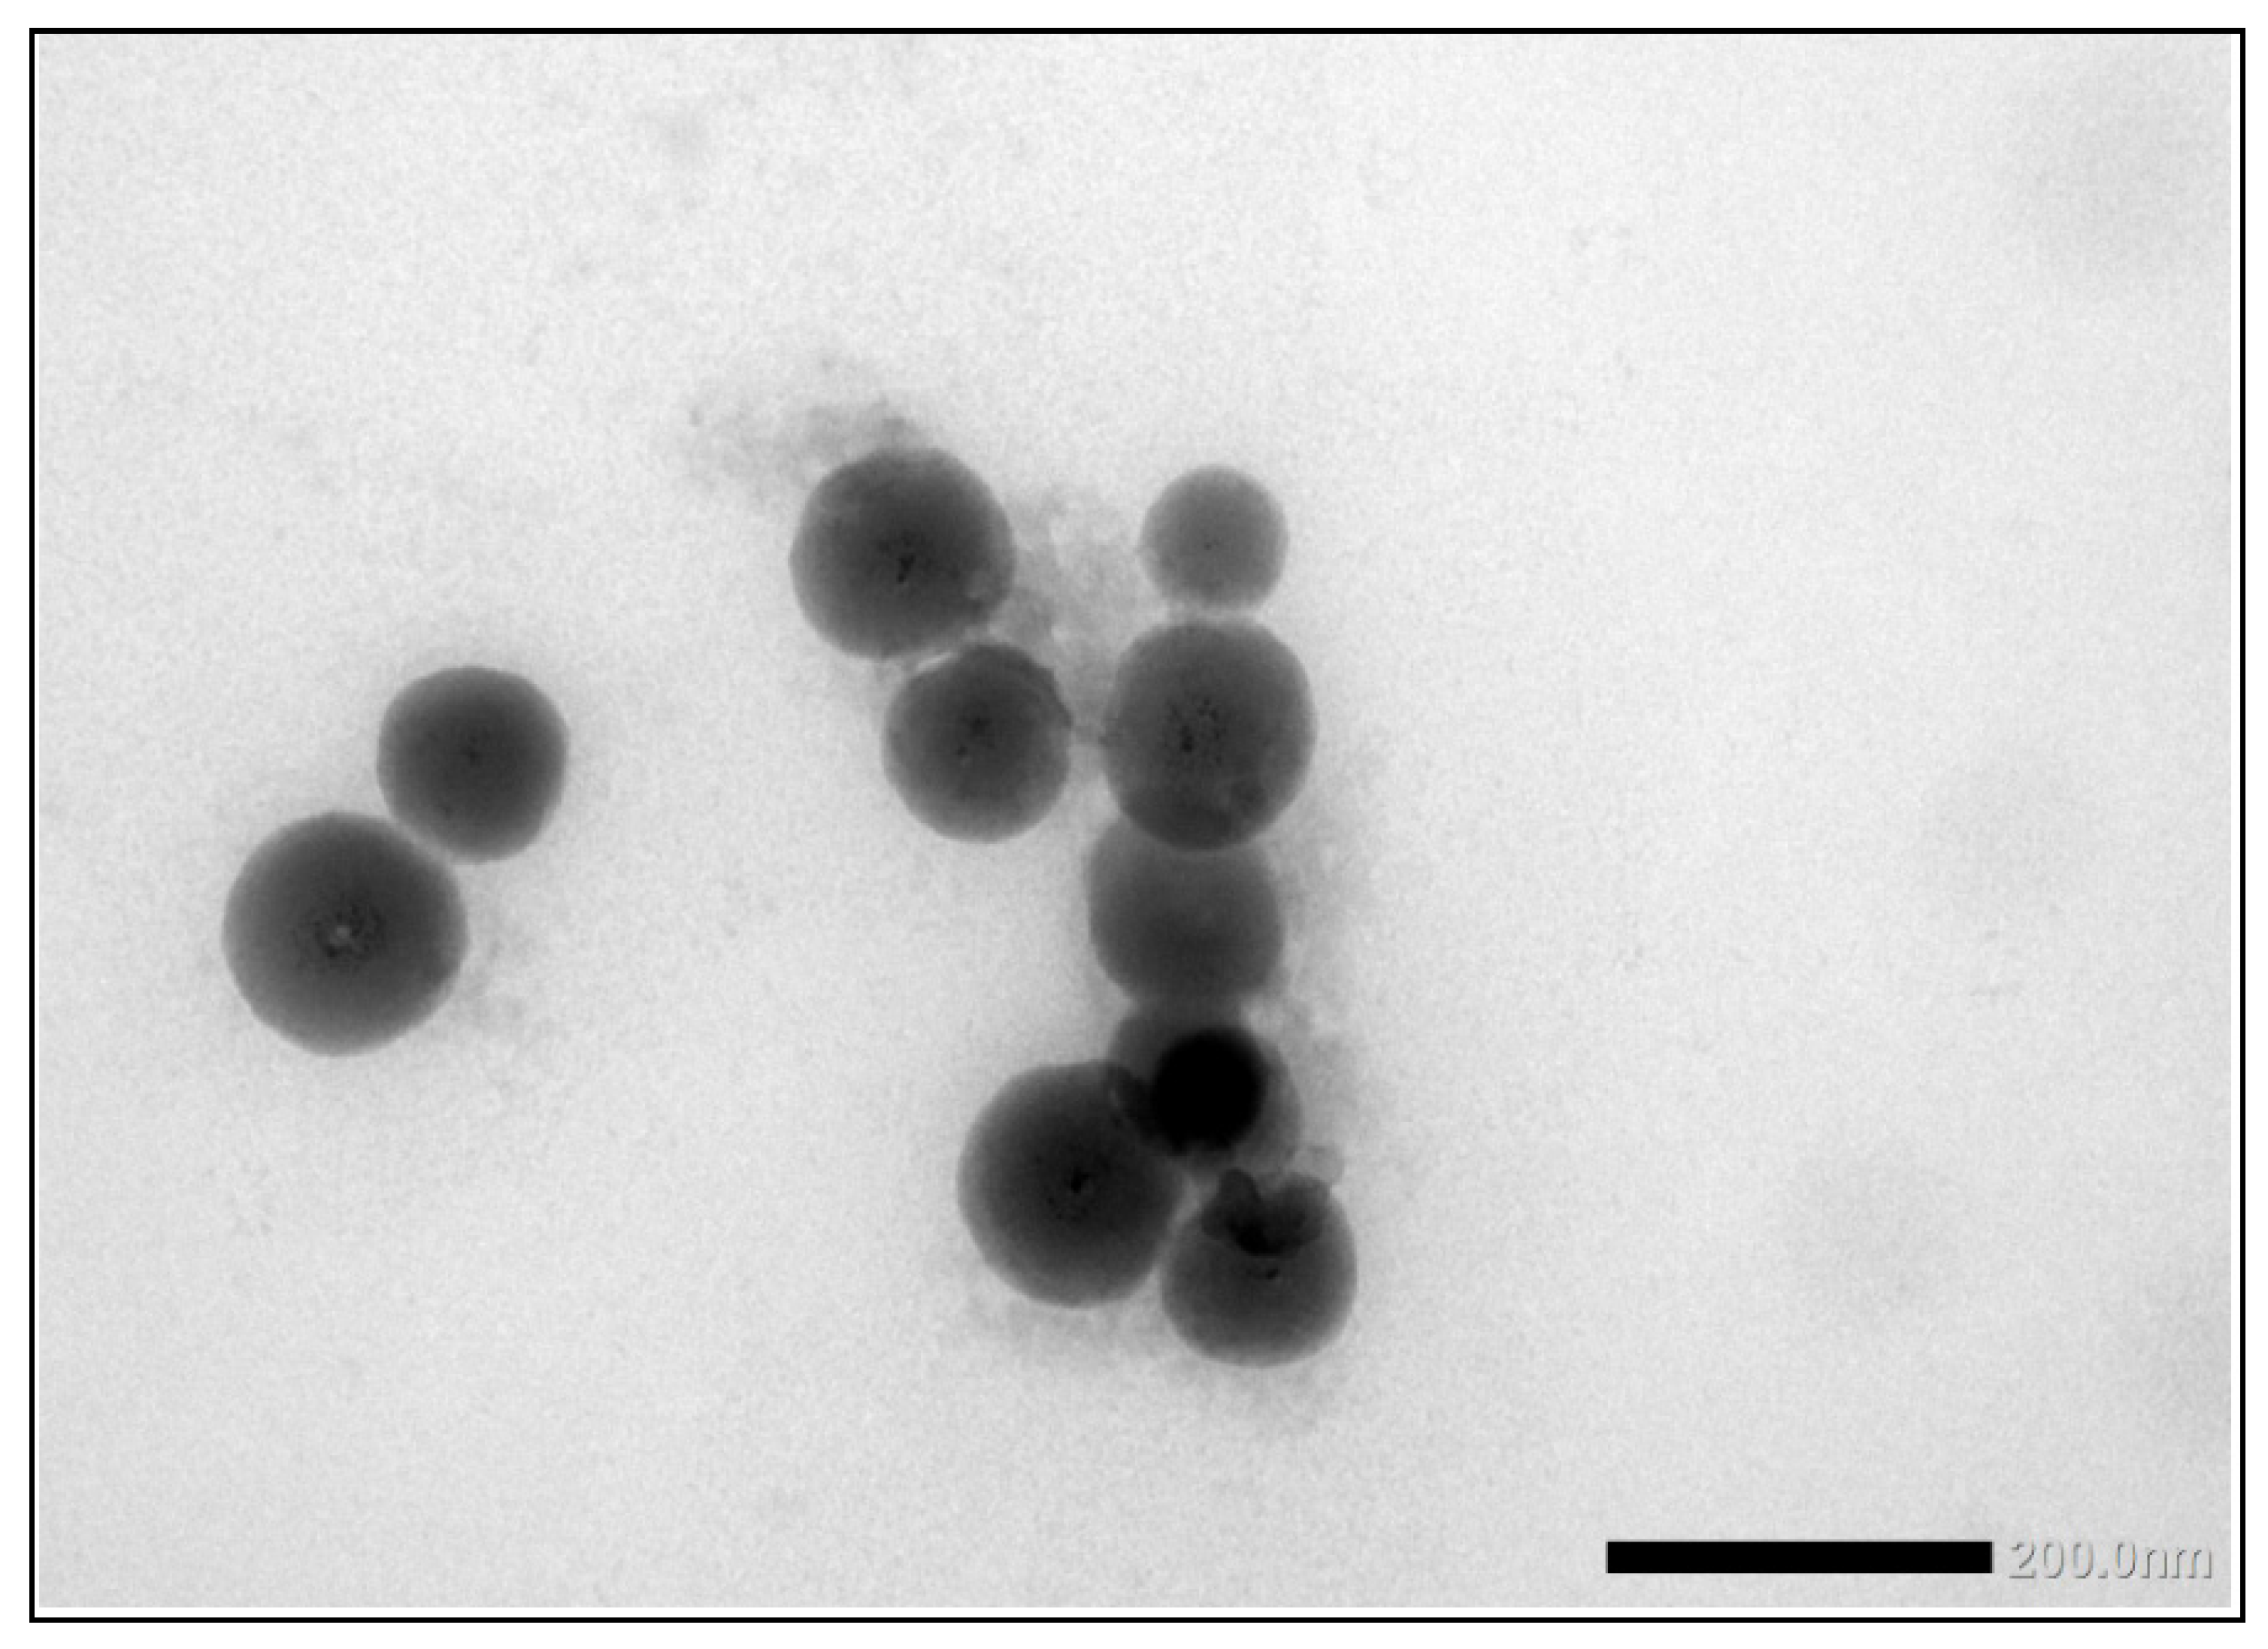
2 particles as shown in the TEM image in
Figure 12.
Since the PTA analysis is not particle composition-specific, the presence of the larger ZnO particles may have influenced the results for mean particle size and D
50, biasing both to larger particle sizes. On the other hand, the larger variation may be due to using mean size results only. The mean particle size is commonly not the most suitable measure for PTA characterisation. As PTA is a particle-by-particle and relatively low number sampling technique, the mean size is very sensitive to sampling changes and often too variable to give robust characterisation results. It is always recommended to refer to the size distribution for sample complexity and polydispersity information. An example of the sunscreen lotion particle size distribution by PTA is shown in the
Supplementary Information. Two of the eight laboratories reported D
50 values that were below 100 nm and would have concluded that the particulate material in the sunscreen lotion is an NM. Since the particle concentration of the ZnO particles in the sunscreen lotion was very low, it may be that in these two cases the aliquot used for the instrumental analysis did not contain these ZnO particles.
Sixteen laboratories reported results for the mean particle size while thirteen reported results for D50 determined with spICP-MS. Unlike PTA, the determination with spICP-MS is composition-specific and spICP-MS specifically determines the size of the TiO2 particles, even in the presence of ZnO particles. According to the D50 value of 59 nm the conclusion is that the TiO2 particles in the sunscreen lotion are an NM and this was reported by eleven of the thirteen laboratories.
Finally, the samples were analysed using TEM/SEM by six of the laboratories. Since most of the laboratories used EDX to confirm the identity of the particles, they were able to specifically determine the mean particle size of the TiO
2 particles. The consensus value is 15.7 nm with a robust standard deviation of 11.3 nm. This is more than 3.5 times higher than the fit-for-purpose value of 20% of the consensus value. The high robust standard deviation is a result of one significantly deviating result of 251 nm for particle size. Probably this laboratory did not size the much smaller TiO2 particles but the much larger ZnO particles, without probing them with EDX. If this result is removed from the dataset, a consensus value of 13.3 nm and a robust standard deviation of 4.2 nm is achieved, which is still higher than the fit-for-purpose value of 20%. This indicates that even with TEM/SEM it is still difficult to size such small particles, which may in part be a result of the fact that the TiO
2 particles in the sample were not spherical but had an elongated shape. This can be seen in
Figure 12 which shows a TEM image of the TiO
2 particles in the sunscreen lotion. In this picture are also visible three much larger ZnO particles, which have a similar aspect ratio to the TiO
2 particles. For D
50, the consensus value is 14.0 nm with a robust standard deviation of 9.8 nm. From the D
50 value it is concluded that the TiO
2 material in the sunscreen sample is a NM and five of the six laboratories that reported D
50 values < 100 nm confirm this.
The use of different measurement techniques leads to different mean particle sizes and D
50 values. In the sunscreen lotion the consensus value for the mean particle sizes ranges from 15.7 nm for TEM/SEM to 67 nm for spICP-MS and 124 nm for PTA. For the D
50 these consensus values range from 14.0 nm for EM to 59 nm for spICP-MS and 120 nm for PTA. This is expected since the particles in the samples consist of constituent (or primary) particles, aggregates (chemically bound constituent particles) and agglomerates (physically bound constituent particles and aggregates). The presence of such aggregates and agglomerates in the sunscreen material is clear from the TEM image in
Figure 12. Using TEM/SEM, the constituent particles can be observed reasonably, even in aggregates and agglomerates, and as a consequence the true small constituent particle sizes in the sunscreen sample are reported by TEM/SEM. In spICP-MS, constituent particles and aggregates cannot be differentiated while agglomerates probably break down to constituent particles and aggregates in the measurement process. As a result, larger particle sizes are found by spICP-MS which resemble the size of aggregates in the material. For PTA this seems to be more pronounced. One reason for this may be that the small TiO
2 particles as observed with TEM/SEM are below the detection limit of the PTA instrument. In addition, PTA determines the hydrodynamic particle diameter which is always larger compared to the mass-based diameter determined by spICP-MS and the geometrical diameter determined by TEM/SEM, interpreted by many EM users as the Minimum Feret diameter [
29]. Note in
Figure 12 that all particles are more or less rod-shaped and such asymmetry makes these particles challenging for tracking, however PTA will still report the sphere equivalent hydrodynamic diameter. It is reasonable to conclude that the presence of the larger rod-shaped ZnO particles in the sample have contributed to the larger average particle diameters determined by PTA.
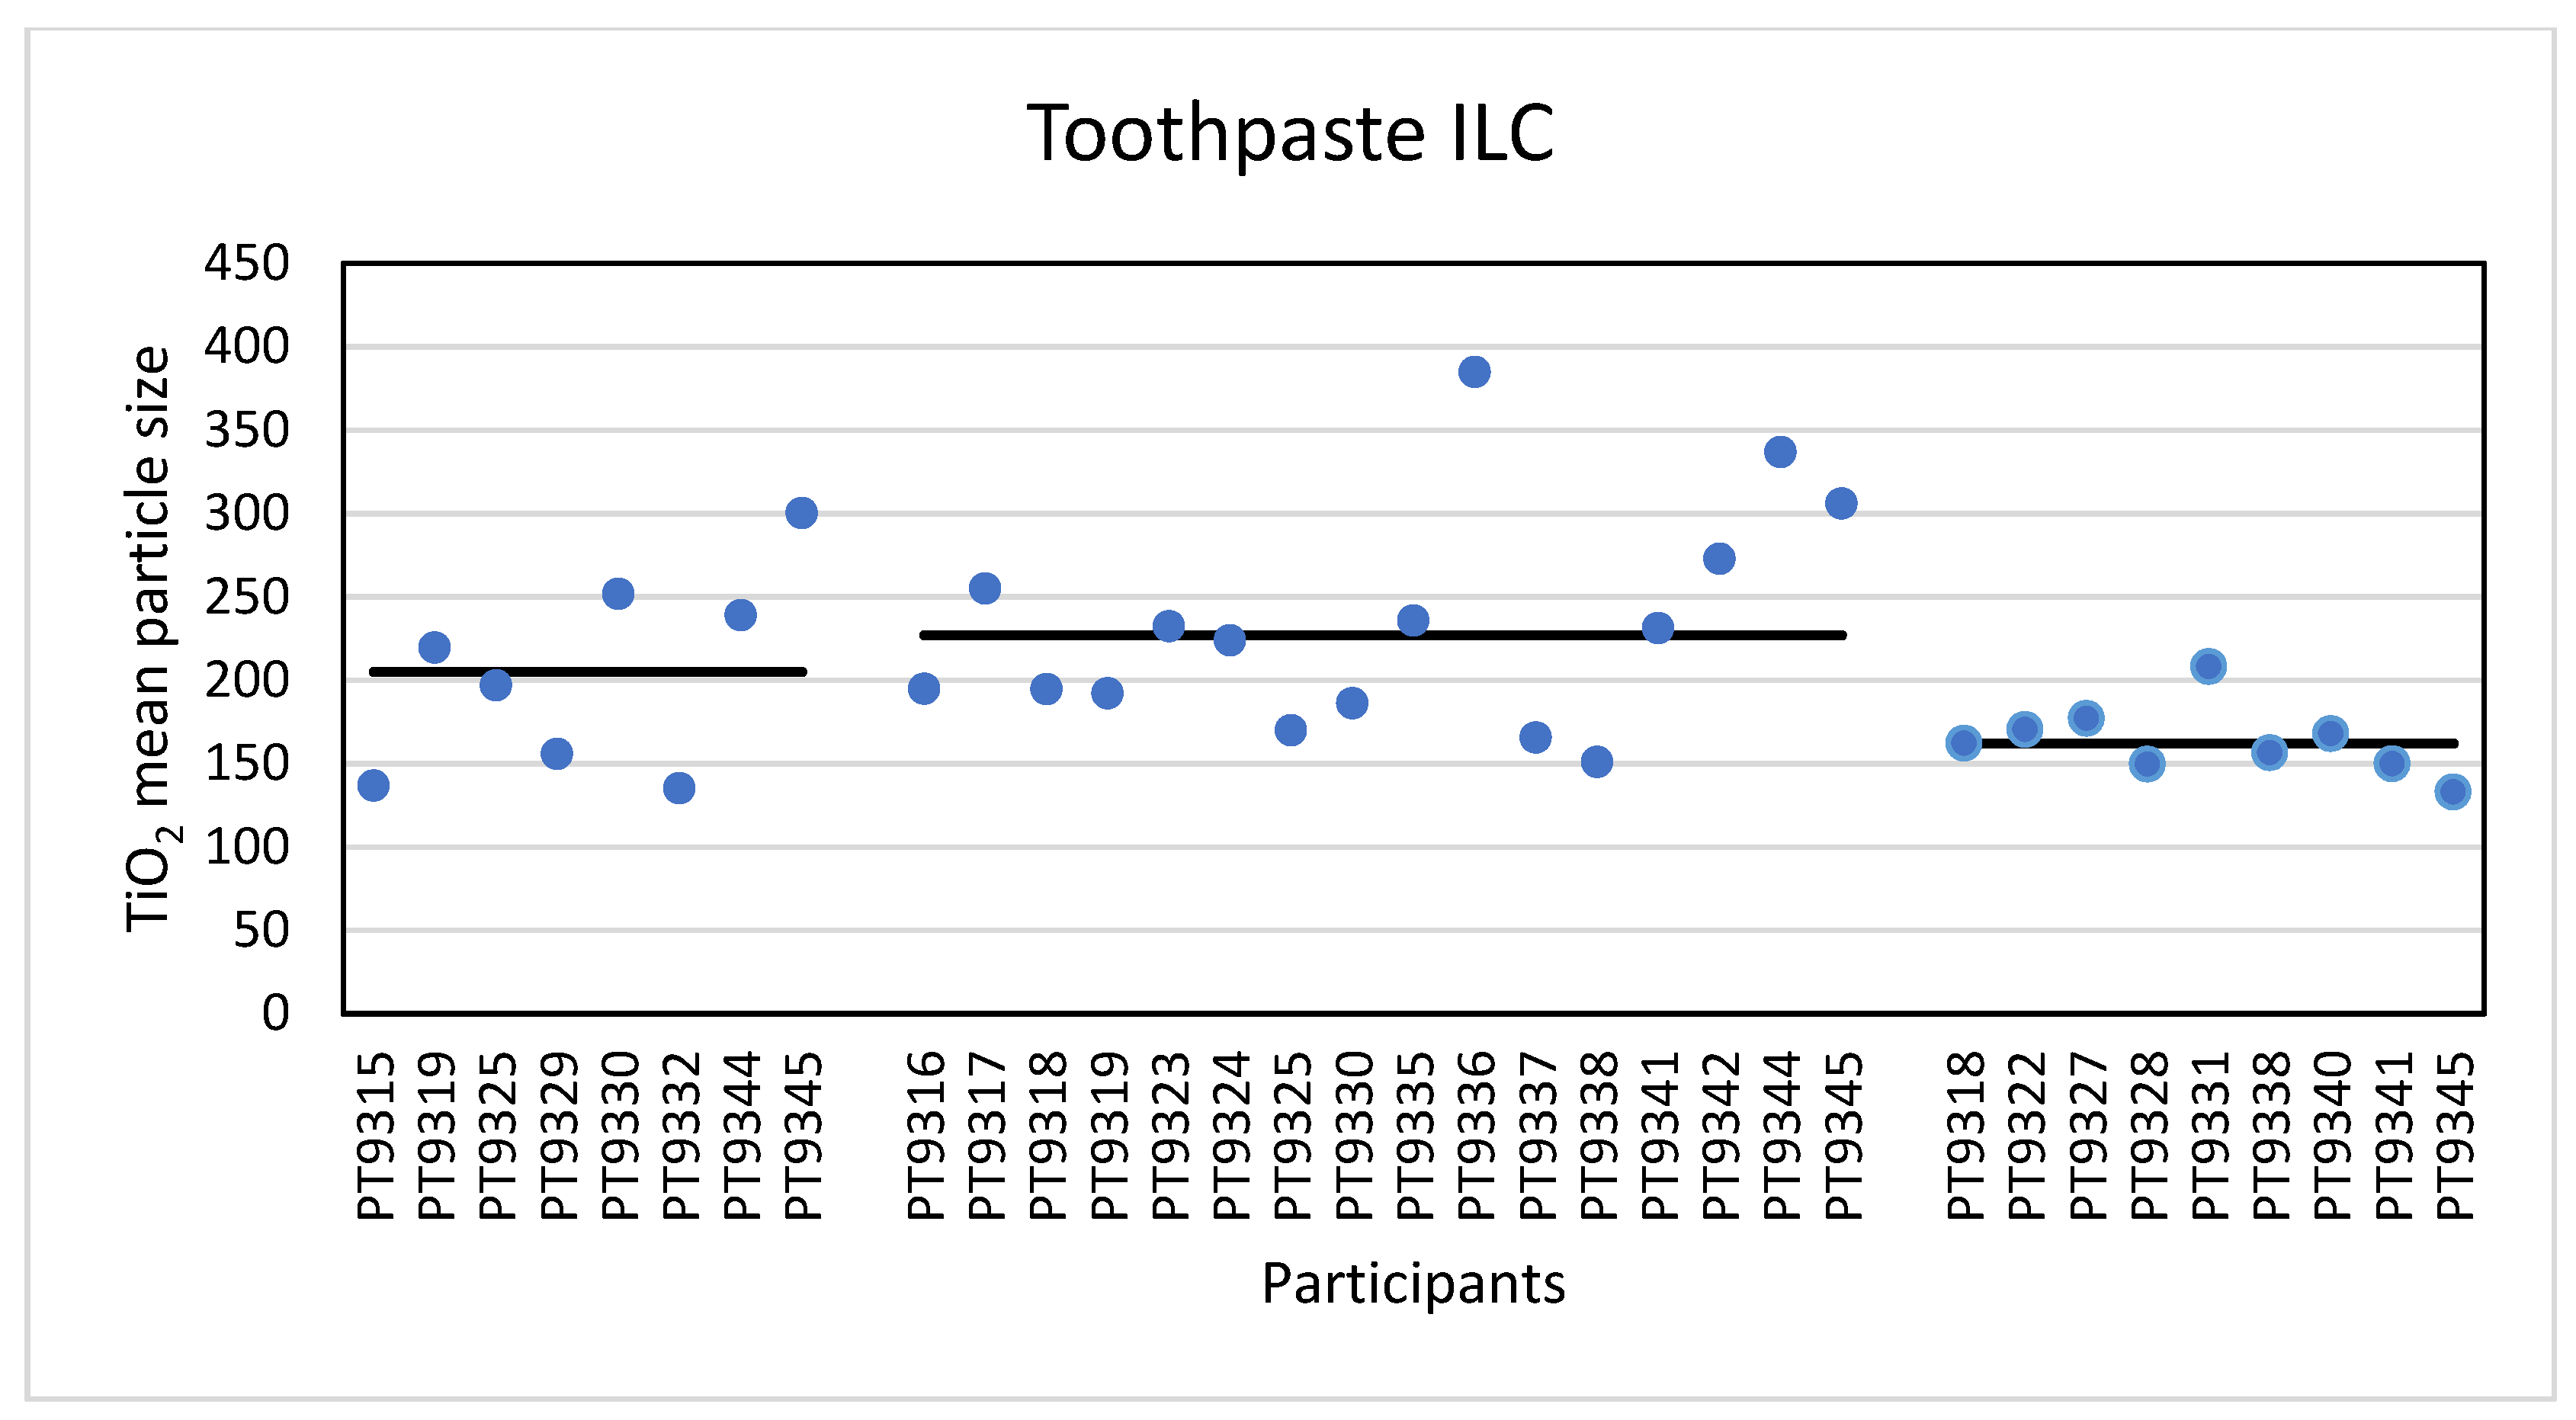
The second consumer product that was analysed in this ILC was a toothpaste product which, according to the declaration on the packaging contained TiO2 particles without mentioning whether this was nano-sized or not. Unlike the sunscreen lotion, the results of the mean particle sizes and D50 values for toothpaste are much closer together. For the mean particle size, the consensus values reported varied from 162 nm for TEM/SEM to 205 nm for PTA and 227 nm for spICP-MS. For the D50 values this was 150 nm for TEM/SEM to 215 nm for PTA and 252 nm for spICP-MS. While the results for PTA and spICP-MS are more or less comparable (and within the fit-for-purpose value of 20%) the results for EM are significantly smaller. This is probably again a result of the fact that only TEM/SEM can reasonably determine the true size of the constituent particles (even in the presence of aggregates and agglomerates). Moreover, as for the sunscreen lotion, EM users might have chosen the Minimum Feret diameter as the descriptor to be reported [
29]. In the PTA and spICP-MS analysis constituent particles and aggregates cannot be differentiated and as a result higher particle sizes are found.
Figure 13 shows a TEM image of the TiO
2 particles as they were found in the toothpaste sample.
4. Materials and Methods
4.1. Study Concept
The aim of this study was to evaluate and benchmark the performance of the various methodologies in determining the size (and concentration where possible) of NMs. For that aim, laboratories around the world were invited to apply PTA, spICP-MS, TEM/SEM, DLS and AF4 methods. In the case of the spICP-MS technique, the precision of the particle number concentration was also evaluated. Between July 2018 and May 2020, six ILCs were organised. In detail, the PTA exercise was performed between April and July 2018, the spICP-MS in May to August 2018, the DLS in December 2018 to February 2019, the AF4 in March to May 2019, the TEM/SEM in June to September 2019, and a final ILC, in which participants were allowed to use PTA, spICP-MS and TEM/SEM, was organised in October 2019/May 2020. In general, participants were allowed to use their own standard (in house) procedures although reference was made to ISO and CEN documents in the instructions on sample handling and analysis that were sent together with the distributed test samples. No hands-on training was organised before the start of the ILCs. An exception is the PTA study for which the participants received state-of-the-art equipment of the same type and configuration, for which an operator training was organised, and a standard operating procedure (SOP) was provided along with all required materials.
4.2. Participants
This study describes the results of six independent ILCs performed by laboratories that are partners in the ACEnano project and extended with laboratories outside the ACEnano project. Invitations to participate in the individual ILCs were sent to the ACEnano partners, the Wageningen Food Safety Research (WFSR) nanotechnology network and the members of the WFSR proficiency testing database (ca. 2400 members). Some of the laboratories participated in more than one ILC. Each of the participants obtained a unique number for the performed ILC and all results were reported through the Laboratory Quality Services website of WFSR. An exception was the PTA study for which results were sent directly to the organiser, Malvern Panalytical. In detail, seven laboratories participated in the ILC analysing gold NP in water using the PTA technique. Six laboratories were ACEnano partners from Europe and one was from Asia. In the ILC analysing gold NP in water by spICP-MS, twenty-six laboratories participated and reported results. Among the participating laboratories, twenty-one were situated within Europe, three in Asia and two in North-America. In the ILC analysing gold NP in water by DLS, seventeen laboratories participated, of which thirteen were situated in Europe, three in Asia and one in North-America. In the ILC analysing gold NP in water by AF4, nineteen laboratories participated, from which seventeen were located in Europe, one in Asia and one in North-America. In the ILC involving the TEM/SEM techniques with gold, titanium dioxide and barium sulphate NP, twenty laboratories participated. Of these, fifteen laboratories were located in Europe, four in Asia and one in North-America. Finally, thirty-two participants subscribed to the ILC on the determination of TiO2 NP in consumer products using PTA, spICP-MS and TEM/SEM. Participants were able to report results for each applied technique. Of the thirty-two laboratories, twenty-six are situated within Europe and six in Asia.
4.3. Test Samples
The test samples used in this study consisted of gold nanoparticles (AuNPs), titanium dioxide particles (TiO
2) and barium sulphate (BaSO
4) NPs. In addition to these, a commercially available sunscreen lotion and toothpaste were used. In the performed proficiency tests, the AuNPs were purchased from two sources NanoComposix (San Diego, CA, USA) and BBI (Crumlin, UK). The TiO
2 and BaSO
4 materials were reference materials produced by JRC (Geel, Belgium) as part of the EU project NanoDefine and were kindly donated. The latter two were only used in the ILC for TEM/SEM. A summary of the properties of the tested materials is shown in
Table 1.
In general, the AuNP materials were aliquoted (PTA ILC) or diluted, subsampled in glass vials (plastic vials for the PTA ILC), coded and shipped to the participants. The homogeneity of the diluted commercial AuNPs was tested according to the International Harmonized Protocol for Proficiency Testing of Analytical Laboratories [
30] and ISO 13528 [
31]. Ten randomly chosen samples were analysed in duplicate to determine the homogeneity of the particle concentration and particle size. It was demonstrated that the materials were sufficiently homogeneous for both tested parameters. The homogeneity of the TiO
2 and BaSO
4 reference materials was not tested since these were produced as reference materials by JRC, and, as such, had already been subjected to such analysis. The homogeneity of the consumer products was also not tested but the material was homogenized prior to subsampling for shipment to the participants. The stability of the aliquoted (PTA ILC) and diluted commercial AuNPs materials was determined by measuring the size of the materials at the beginning and the end of the individual ILCs. The stability of the TiO
2 and BaSO
4 materials was not determined as the samples were measured in a short period after dispersion by the laboratories. The stability of the consumer products was not measured because they were well within the product expiration date.
4.4. Sample and Measurement Protocol
For the PTA ILC the stock solutions of AuNPs were aliquoted into plastic vials and labelled prior to shipping. Along with the samples, the participants received all necessary consumables and reagents including a vial of filtered deionized water for further dilution of the samples. Malvern Panalytical coordinated the PTA ILC by materials distribution and results collection. Sample preparation and analysis steps were detailed in a SOP including dilution and data capture setup. It was advised to dilute the sample in water provided by Malvern Panalytical filtered prior to analysis, to provide the same sample environment and analysis conditions. The participants were requested to provide data and report the mode of the particle size as determined with the PTA instrument.
For the spICP-MS ILC the participants were informed that the material provided was a spherical gold NP with a particle size <100 nm and a mass concentration around 50 mg/L. Together with the samples, the participants received 1 g of citrate tribasic dihydrate (Sigma Aldrich, The Netherlands) to reconstitute the citrate buffer that the NanoComposix AuNPs are suspended in. The participants were asked to store the material in the refrigerator and allow it to come to room temperature 60 min prior to analysis. It was advised to dilute the material in the 1 mM citrate buffer but no dilution factor was indicated. The participants were requested to report the mean particle size as determined by spICP-MS. Participants of the TEM/SEM ILC received a 100 mg/mL stock solution of the NanoComposix AuNPs. JRC kindly donated the TiO2 and BaSO4 test materials and, following the coding of the samples, these were shipped as powdered materials as received from JRC. Participants were requested to report the mean particle sizes as determined with TEM and/or SEM.
For the DLS ILC participants received three separate samples with 40 nm particles (Sample A), 200 nm particles (Sample B) and a 1:1 v/v mixture of the two particles resulting in a bimodal sample (Sample C). The protocol stated that the samples A and B contained single-sized spherical colloidal particles <50 nm and >50 nm, respectively, while the sample C contained a mixture of the two sized spherical gold colloids. The protocol stated that samples should be stored in the refrigerator and be allowed to warm to room temperature 60 min prior to analysis. Samples used for the DLS measurement should be sonicated and diluted 1:10 in deionized water. Participants were requested to report the particle sizes as determined with the DLS instrument. Participants of the AF4 ILC received a 50 mg/mL stock solution of the NanoComposix AuNPs. Additionally, the laboratories received citrate-stabilized AuNPs from BBI of sizes 20, 40, 80 and 100 nm, mass-based concentration 50 mg/mL each, to calibrate the AF4. Furthermore, 2 mL of Nova Chem surfactant 100 (Postnova Analytics GmbH, Landsberg am Lech, Germany) were distributed to the participants. No information was given for sample dilution. The participants were requested to report the mean particle size as determined with the AF4 instrument.
In the last ILC, two consumer products, a sunscreen lotion and a toothpaste were sent to the participants. The participants were informed that both materials contained TiO2 particles of unknown size and were requested to determine the particle size of the TiO2 particles using one or more of the PTA, spICP-MS, or TEM/SEM techniques. A sample preparation procedure was given for both matrices and was as follows: Toothpaste: Weigh out a subsample of 200 mg and mix with 20 mL of ultrapure water. Mix on a magnetic stirrer for 1 hr and subsequently sonicate in an ultrasonic bath for 15 min. Sunscreen lotion: Weight out a subsample of 200 mg and mix with 20 mL of ethanol. Vortex for 1 min and sonicate in an ultrasonic bath for 15 min. These suspensions may be used as such for the analysis using TEM/SEM. For analysis with PTA a further dilution of 500 times in ultrapure water was advised. For spICP-MS a further dilution of 10,000 times (toothpaste) and 100,000 times (sunscreen lotion) in ultrapure water was advised. In house methods should be used for the instrumental analyses using PTA, spICP-MS and TEM/SEM and references to CEN/TS 17273 and ISO/ TS 19590:2017 were included. The participants were requested to report the mean particle size and the D50 value (the median particle size where 50% of the particles is smaller than that size and 50% larger, a D50 value < 100 nm indicates a NM), both expressed in nm.
4.5. Statistical Evaluation
The statistical evaluation of the quantitative results was carried out according to the International Harmonized Protocol for the Proficiency Testing of Analytical Chemistry Participants [
30], elaborated by ISO, IUPAC and AOAC and ISO 13528 [
31] in combination with insights published by the Analytical Methods Committee regarding robust statistics [
32,
33]. For the evaluation of the quantitative results, the consensus value (x), the uncertainty of the consensus value (u), a standard deviation for proficiency assessment (σ
p) and z-scores were calculated. The consensus value was determined using robust statistics [
31,
32,
33]. The advantage of robust statistics is that all values are taken into account: outlying observations are retained, but given less weight. Furthermore, it is not expected to receive normally distributed data in a proficiency test. When using robust statistics, the data do not have to be normally distributed in contrast to conventional outlier elimination methods. The robust mean of the reported results of all participants, calculated from the iterative process that starts at the median of the reported results, using a cut-off value depending on the number of results, was used as the consensus value [
32,
33]. The uncertainty of the consensus value is calculated to determine the influence of this uncertainty on the evaluation of the participants. A high uncertainty of the consensus value will lead to a high uncertainty in the calculated participants’ z-scores. If the uncertainty of the consensus value and thus the uncertainty of the z-scores is high, the evaluation could indicate unsatisfactory method performance without any cause within the laboratory. In other words, wrong conclusions could be drawn regarding the performance of the participants from the calculated z-scores if the uncertainty of the consensus value is not taken into account. The uncertainty of the consensus value (the robust mean) is calculated from the standard deviation of the consensus value and the number of values for the calculation of the consensus value [
31]. If the uncertainty of the consensus value is negligible (u < 0.3σ
p) it is not included in the statistical evaluation, otherwise it is.
5. Conclusions
The results of a number of ILCs for the characterisation of NMs organised in the frame of the H2020 project ACEnano were presented and discussed. ILCs were organised for PTA, spICP-MS, TEM/SEM, DLS and AF4 for particles in simple medium and consumer products. The results of the analyses of pristine well-defined particles such as the 60 nm Au NPs showed that laboratories with different methods were well capable of determining reliably the sizes of the particles. Interestingly PTA, spICP-MS, TEM/SEM and AF4, while using different measuring principles, reported similar particle sizes for the 60 nm Au NP. When pristine but more complex particles were analysed (TEM/SEM) or when mixtures of particles were analysed (DLS) the results showed a larger variation and bias. As expected, the analysis of particles in consumer products resulted in larger variations in particle sizes within techniques and clear differences between techniques. From the results of the sunscreen lotion sample it is clear that only TEM/SEM was able to correctly detect and size the small particles with visual confirmation. spICP-MS and PTA were more sensitive for aggregates, while the mean results of PTA were influenced by the presence of other particles, in this case the larger ZnO particles. In general, spICP-MS and TEM/SEM were able to correctly identify the TiO2 particles in complex formulations such as toothpaste and sunscreen lotion as being representative of the EU regulatory definition of NMs. For the toothpaste samples, the results from the different techniques were closely aligned. While PTA and spICP-MS reported similar results, TEM/SEM reported a somewhat smaller particle size. Nevertheless, all three methods correctly identified the TiO2 particles in this material as non-nanoscale according to the EU regulatory definition of an NM.
In general, from the results of the organised ILCs we can conclude that analytical laboratories are well capable of determining particle sizes of NM, and that there are several techniques suitable to do this, albeit with individual strengths and limitations. Using techniques such as TEM/SEM and spICP-MS also enables determination of whether a particulate material in a consumer product is an NM or not for regulatory purposes. The more complex the sample the higher the need for multi-technology characterization in order to identify, confirm and classify a material as an NM. It should be noted that other methods, such as analytical centrifugation, which were not included in the present series of ILCs, can also offer reliable results for complex NM.
Finally, it should be highlighted that while the size measurement of monodisperse NM of regular, simple shape is straightforward for most methods, the analysis of NM of more complex shape, or particles ‘embedded’ as aggregates or agglomerates in more complex matrices as consumer products is challenging. Similarly, the determination of particle sizes in bimodal distributions of NMs remains challenging. For the latter categories of particles, not only suitable sample preparation procedures but also measurement and analysis procedures, documented into standard operating procedures, which are specific to the particular materials/products must be available. For many real-life particulate products such procedures must still be developed. The literature is still scarce with reliable, standardized procedures. Various joint activities in several research groups and international (pre-)standardisation bodies are in progress. The present paper tries to offer a realistic overview of the present possibilities and challenges in the particle size and particle concentration analysis for (nano)particles with different degrees of complexity when using different analysis methods.


 ,
, 


