
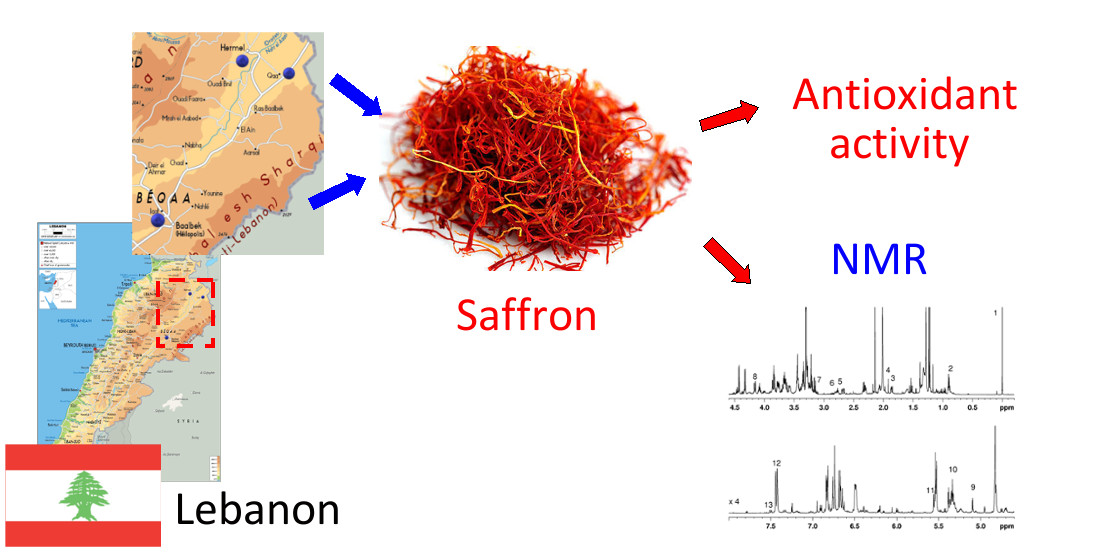
1H-NMR Metabolic Profiling and Antioxidant Activity of Saffron (Crocus sativus) Cultivated in Lebanon


 ,
,  and
and
Abstract
:
1. Introduction
2. Results
2.1. Total Polyphenol Content and Antioxidant Activities
2.2. Effect of Saffron Origin on Cell Viability
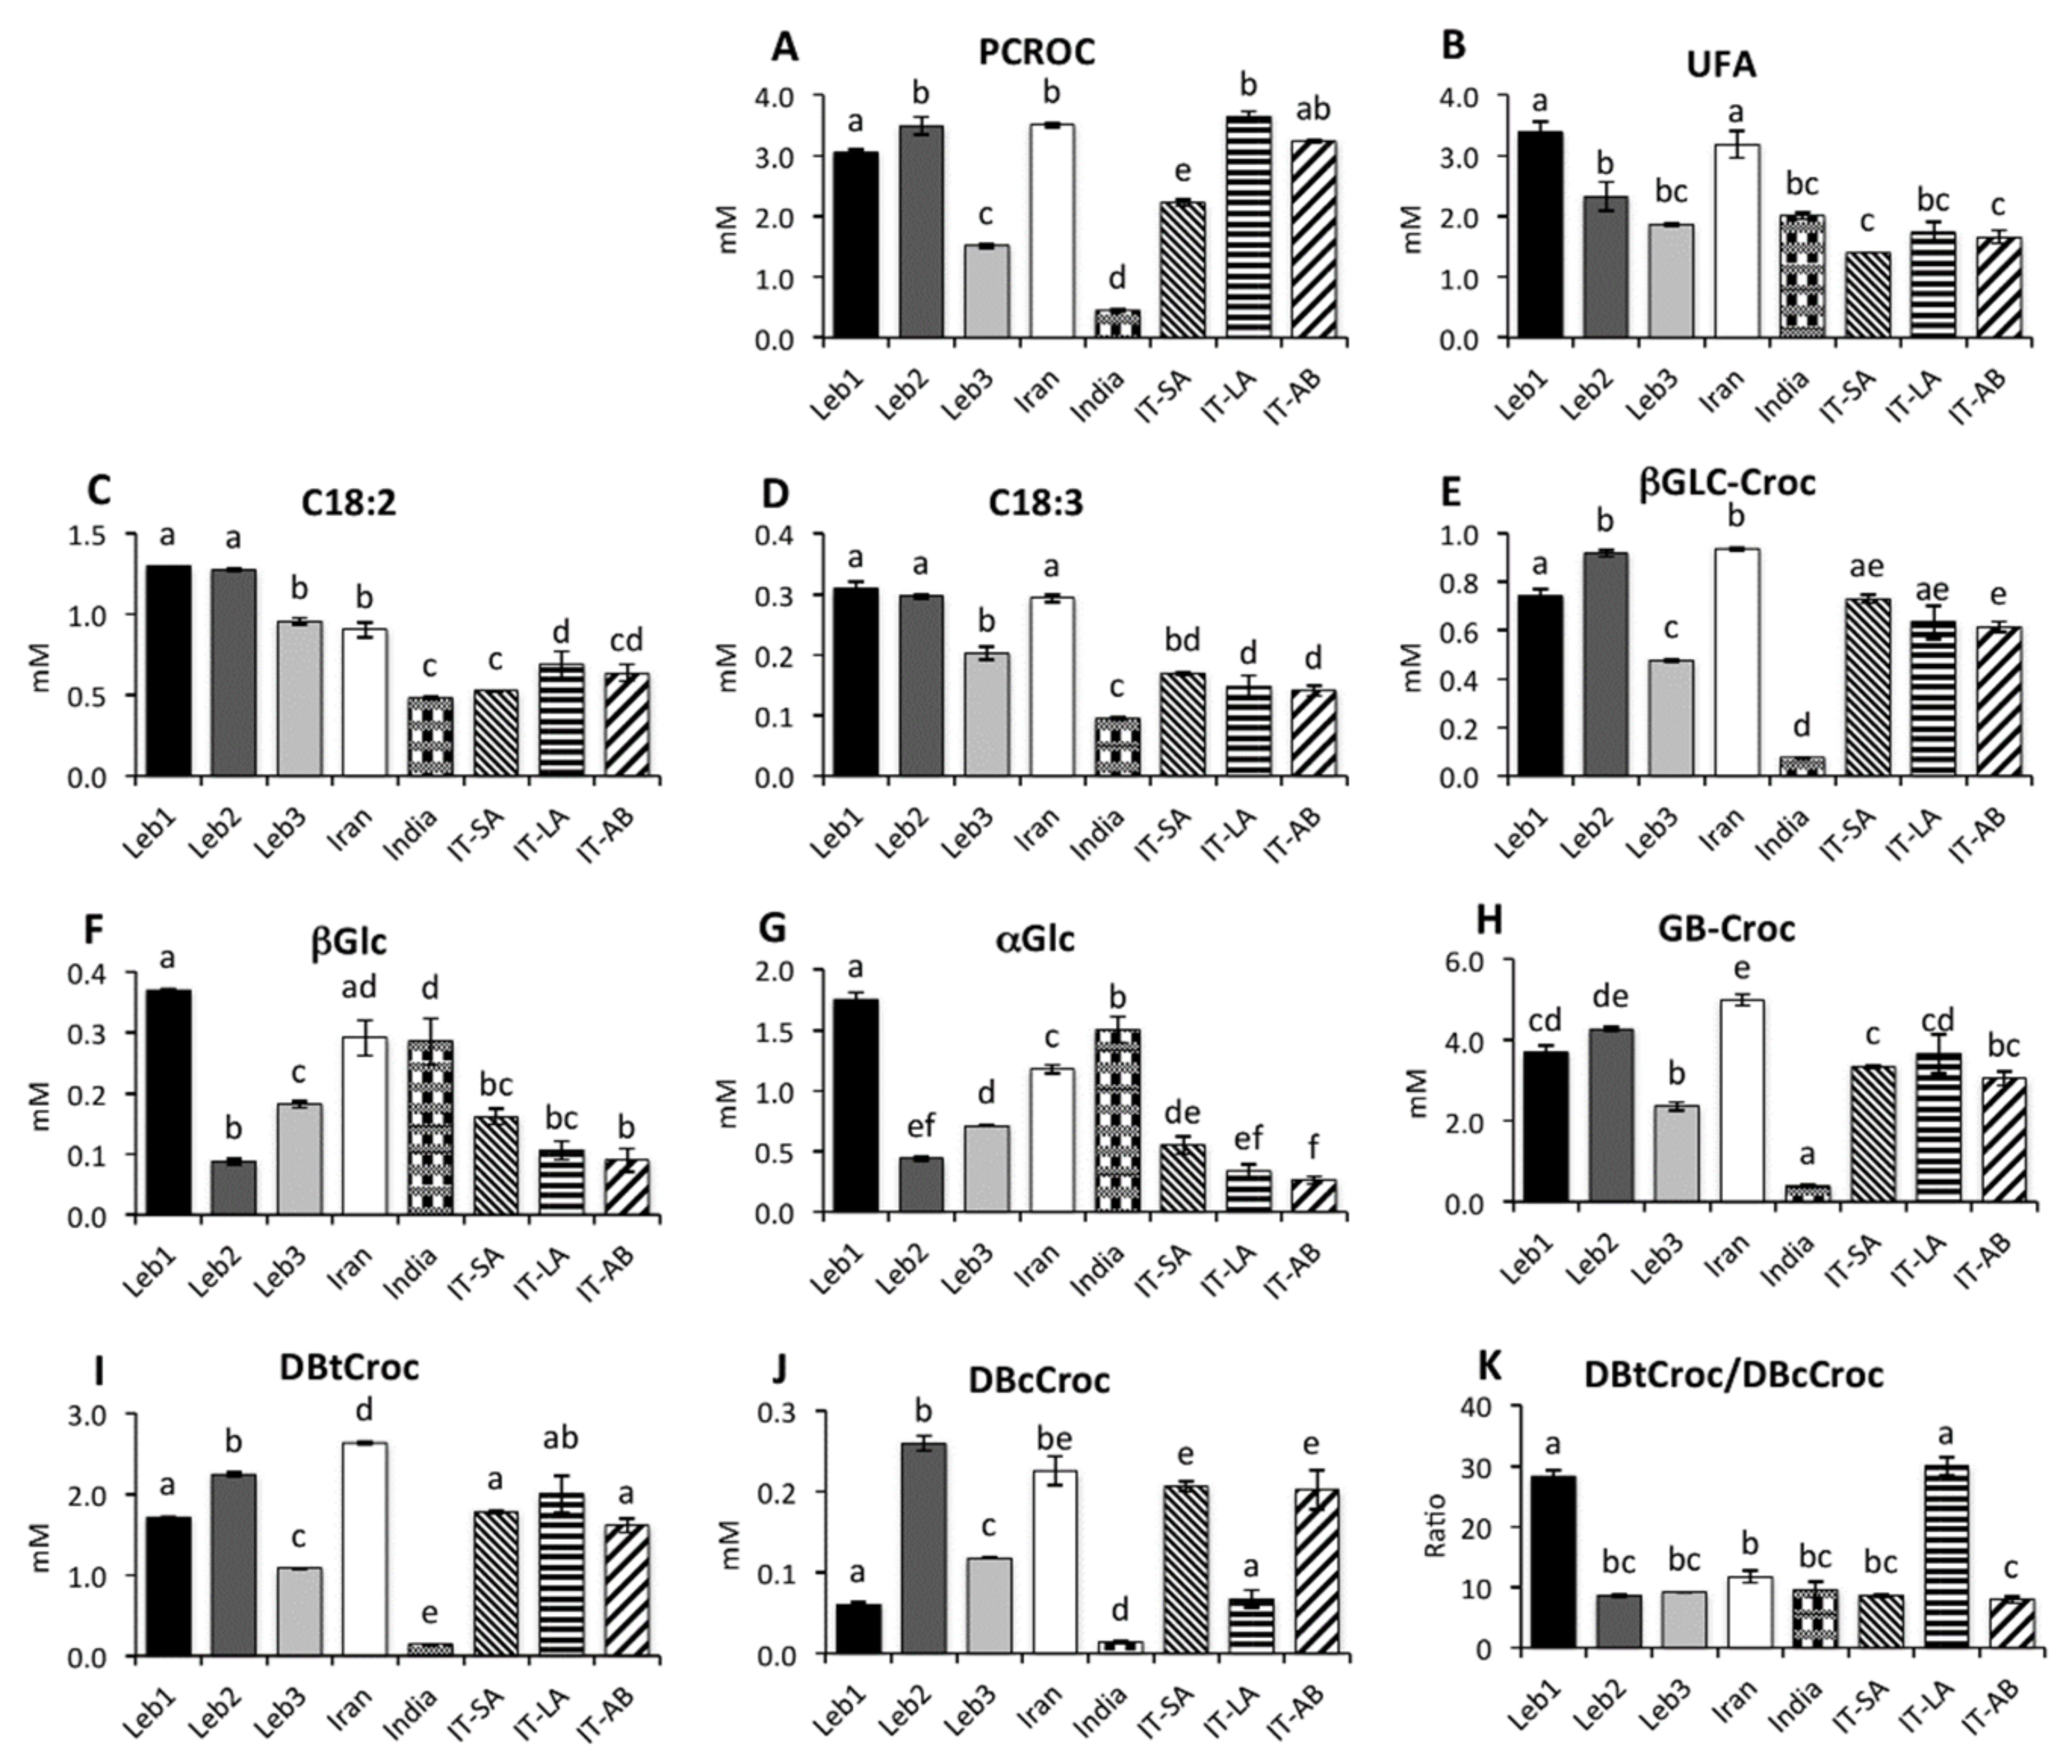
2.3. Saffron Metabolite Profile by High Resolution NMR
2.4. PCA Analysis of Saffron Metabolite Profile
3. Discussion
4. Materials and Methods
4.1. Saffron Samples
4.2. Conventional Extraction
4.3. Microwave-Assisted Extraction (MAE)
4.4. High Resolution NMR Measurements
4.5. Measurement of Metabolites and Statistical Analysis
4.6. Total Phenolic Content
4.7. DPPH (1,1-Diphenyl-2-Picryl-Hydrazyl Radical) Assay
4.8. ABTS+ Assay
4.9. Cell Viability Assay and Statistical Analysis
Author Contributions
Funding
Institutional Review Board Statement
Informed Consent Statement
Data Availability Statement
Acknowledgments
Conflicts of Interest
Sample Availability
References
- Makhlouf, H.; Diab-Assaf, M.; Alghabsha, M.; Tannoury, M.; Chahine, R.; Saab, A.M. In vitro antiproliferative activity of saffron extracts against human acute lymphoblastic T-cell human leukemia. Indian J. Trad. Knowl. 2016, 15, 16–21. [Google Scholar]
- Makhlouf, H.; Saksouk, M.; Habib, J.; Chahine, R. Determination of antioxidant effect of saffron taken from the flower of Crocus sativus grown in Lebanon. Afr. J. Biotechnol. 2011, 10, 8093–8100. [Google Scholar] [CrossRef]
- Hatziagapiou, K.; Kakouri, E.; Lambrou, G.I.; Bethanis, K.; Tarantilis, P.A. Antioxidant properties of Crocus sativus L. and its constituents and relevance to neurodegenerative diseases; Focus on Alzheimer’s and Parkinson’s disease. Curr. Neuropharmacol. 2019, 17, 377–402. [Google Scholar] [CrossRef]
- Peter, K.V. Handbook of Herbs and Spices, 1st ed.; CRC Press: Boca Raton, FL, USA, 2001; pp. 276–286. [Google Scholar]
- Rocchi, R.; Mascini, M.; Faberi, A.; Sergi, M.; Compagnone, D.; Di Martino, V.; Carradori, S.; Pittia, P. Comparison of IRMS, GC-MS and E-Nose data for the discrimination of saffron samples with different origin, process and age. Food Control. 2019, 106, 106736. [Google Scholar] [CrossRef]
- Menghini, L.; Leporini, L.; Vecchiotti, G.; Locatelli, M.; Carradori, S.; Ferrante, C.; Zengin, G.; Recinella, L.; Chiavaroli, A.; Leone, S.; et al. Crocus sativus L. stigmas and byproducts: Qualitative fingerprint, antioxidant potentials and enzyme inhibitory activities. Food Res. Int. 2018, 109, 91–98. [Google Scholar] [CrossRef]
- Chichiriccò, G.; Ferrante, C.; Menghini, L.; Recinella, L.; Leone, S.; Chiavaroli, A.; Brunetti, L.; Di Simone, S.; Ronci, M.; Piccone, P.; et al. Crocus sativus by-products as sources of bioactive extracts: Pharmacological and toxicological focus on anthers. Food Chem Toxicol. 2019, 126, 7–14. [Google Scholar] [CrossRef]
- Mykhailenko, O.; Kovalyov, V.; Goryacha, O.; Ivanauskas, L.; Georgiyants, V. Biologically active compounds and pharmacological activities of species of the genus Crocus: A review. Phytochemistry 2019, 162, 56–89. [Google Scholar] [CrossRef]
- Sobolev, A.P.; Carradori, S.; Capitani, D.; Vista, S.; Trella, A.; Marini, F.; Mannina, L. Saffron samples of different origin: An NMR study of microwave-assisted extracts. Foods 2014, 3, 403–419. [Google Scholar] [CrossRef] [Green Version]
- Zhao, L.; Fan, H.; Zhang, M.; Chitrakar, B.; Bhandari, B.; Wang, B. Edible flowers: Review of flower processing and extraction of bioactive compounds by novel technologies. Food Res. Int. 2019, 126, 108660. [Google Scholar] [CrossRef]
- D’Archivio, A.A.; Donato, F.D.; Foschi, M.; Maggi, M.A.; Ruggieri, F. UHPLC analysis of saffron (Crocus sativus L.): Optimization of separation using chemometrics and detection of minor crocetin esters. Molecules 2018, 23, 1851. [Google Scholar] [CrossRef] [PubMed] [Green Version]
- Zalacain, A.; Ordoudi, S.A.; Diaz-Plaza, E.M.; Carmona, M.; Blázquez, I.; Tsimidou, M.Z.; Alonso, G.L. Near infrared spectroscopy in saffron quality control: Determination of chemical composition and geographical origin. J. Agric. Food Chem. 2005, 53, 9337–9341. [Google Scholar] [CrossRef] [PubMed]
- Nescatelli, R.; Carradori, S.; Marini, F.; Caponigro, V.; Bucci, R.; De Monte, C.; Mollica, A.; Mannina, L.; Ceruso, M.; Supuran, C.T.; et al. Geographical characterization by MAE-HPLC and NIR methodologies and carbonic anhydrase inhibition of saffron components. Food Chem. 2017, 221, 855–863. [Google Scholar] [CrossRef]
- Anastazaki, E.; Kanakis, C.; Pappas, C.; Maggi, L.; Del Campo, C.P.; Carmona, M.; Polissiou, M.G. Differentiation of saffron from four countries by mid-infrared spectroscopy and multivariate analysis. Eur. Food Res. Technol. 2010, 230, 571–577. [Google Scholar] [CrossRef]
- Maggi, L.; Carmona, M.; Zalacain, A.; Kanakis, C.D.; Anastasaki, B.E.; Tarantilis, P.; Polissiou, M.G.; Alonso, G.L. Changes in saffron volatile profile according to its storage time. Food Res. Int. 2010, 43, 1329–1334. [Google Scholar] [CrossRef]
- Yilmaz, A.; Nyberg, N.T.; Molgaard, P.; Asili, J.; Jaroszewski, J.W. 1H NMR metabolic profiling fingerprinting of saffron extracts. Metabolomics 2010, 6, 511–517. [Google Scholar] [CrossRef]
- Bagur, M.J.; Salinas, G.L.A.; Jiménez-Monreal, A.M.; Chaouqi, S.; Llorens, S.; Martínez-Tomé, M.; Alonso, G.L. Saffron: An old medicinal plant and a potential novel functional food. Molecules 2018, 23, 30. [Google Scholar] [CrossRef] [Green Version]
- Shakeri, M.; Hashemi Tayer, A.; Shakeri, H.; Sotoodeh Jahromi, A.; Moradzadeh, M.; Hojjat-Farsangi, M. Toxicity of saffron extracts on cancer and normal cells: A review article. Asian Pac. J. Cancer Prev. 2020, 21, 1867–1875. [Google Scholar] [CrossRef]
- Bukhari, S.I.; Din, I.; Grewal, S.; Dhar, M.K. Antiproliferative effect of saffron and its constituents on different cancerous cell lines. Pharmacogn. Res. 2018, 10, 291–295. [Google Scholar] [CrossRef]
- Punia, R.; Raina, K.; Agarwal, R.; Singh, R.P. Acacetin enhances the therapeutic efficacy of doxorubicin in non-small-cell lung carcinoma cells. PLoS ONE 2017, 12, e0182870. [Google Scholar] [CrossRef] [PubMed]
- Chahine, N.; Makhlouf, H.; Ducab, L.; Martiny, L.; Chahine, R. Cardioprotective effect of saffron extracts against acute doxorubicin toxicity in isolated rabbit hearts submitted to ischemia-reperfusion injury. Zeitschrift für Naturforschung 2014, 69, 459–470. [Google Scholar] [CrossRef]
- Tomasina, F.; Carabio, C.; Celano, L.; Thomson, L. Analysis of two methods to evaluate antioxidants. Biochem. Mol. Biol. Educ. 2012, 40, 266–270. [Google Scholar] [CrossRef]
- D’Archivio, A.A.; Giannitto, A.; Maggi, M.A.; Ruggieri, F. Geographical classification of Italian saffron (Crocus sativus L.) based on chemical constituents determined by high-performance liquid-chromatography and by using linear discriminant analysis. Food Chem. 2016, 212, 110–116. [Google Scholar] [CrossRef]
- Gresta, F.; Lombardo, G.M.; Siracusa, L.; Ruberto, G. Saffron, an alternative crop for sustainable agricultural systems: A review. Agron. Sustain. Dev. 2008, 28, 95–112. [Google Scholar] [CrossRef] [Green Version]
- Cardone, L.; Castronuovo, D.; Perniola, M.; Cicco, N.; Candido, V. Evaluation of corm origin and climatic conditions on saffron (Crocus sativus L.) yield and quality. Sci. Food Agric. 2019, 99, 5858–5869. [Google Scholar] [CrossRef]
- Carmona, M.; Zalacain, A.; Pardo, J.E.; López, E.; Alvarruiz, A.; Alonso, G.L. Influence of different drying and aging conditions on saffron constituents. J. Agric. Food Chem. 2005, 53, 3974–3979. [Google Scholar] [CrossRef] [PubMed]
- Lage, M.; Melai, B.; Cioni, P.L.; Flamini, G.; Gaboun, F.; Bakhy, K.; Zouahri, A.; Pistelli, L. Phytochemical composition of Moroccan saffron accessions by headspace solid-phase-microextraction. Am. J. Essent. Oils Nat. Prod. 2015, 2, 1–7. [Google Scholar]
- Kosar, M.; Demirci, B.; Goger, F.; Kara, I.; Baser, K.H.C. Volatile composition, antioxidant activity and antioxidant components in saffron cultivated in Turkey. Int. J. Food Prop. 2017, 20, S746–S754. [Google Scholar] [CrossRef] [Green Version]
- Samarghandian, S.; Tavakkol Afshari, J.; Davoodi, S. Suppression of pulmonary tumor promotion and induction of apoptosis by Crocus sativus L. extraction. Appl. Biochem. Biotech. 2011, 164, 238–247. [Google Scholar] [CrossRef] [PubMed]
- Rahaiee, S.; Moini., S.; Hashemi, M.; Shojaosadati., S.A. Evaluation of antioxidant activities of bioactive compounds and various extracts obtained from saffron (Crocus sativus L.): A review. J. Food Sci. Technol. 2015, 52, 1881–1888. [Google Scholar] [CrossRef] [Green Version]
- Lopez-Velez, M.; Martinez-Martinez, F.; del Valle-Ribes, C. The study of phenolic compounds as natural antioxidants in wine. Crit. Rev. Food Sci. Nutr. 2003, 43, 233–244. [Google Scholar] [CrossRef]
- D’Archivio, M.; Filesi, C.; di Benedetto, R.; Gargiulo, R.; Giovannini, C.; Masella, R. Polyphenols, dietary sources and bioavailability. Ann. I. Super. Sanita 2007, 43, 348–361. [Google Scholar]
- Lambert, J.D.; Hong, J.; Yang, G.Y.; Liao, J.; Yang, C.S. Inhibition of carcinogenesis by polyphenols: Evidence from laboratory investigations. Am. J. Clin. Nutr. 2005, 81, 284S–291S. [Google Scholar] [CrossRef] [PubMed] [Green Version]
- Sajadimajd, S.; Bahramsoltani, R.; Iranpanah, A.; Kumar Patra, J.; Das, G.; Gouda, S.; Rahimi, R.; Rezaeiamiri, E.; Cao, H.; Giampieri, F.; et al. Advances on natural polyphenols as anticancer agents for skin cancer. Pharmacol. Res. 2019, 151, 104584. [Google Scholar] [CrossRef] [PubMed]


| Sample Code | Geographical Origin | Total Polyphenols | DPPH | ABTS |
|---|---|---|---|---|
| mg of Gallic acid/g Dry Extract | Absorbance (% Inhibition vs. ctrl) | Absorbance (% Inhibition vs. ctrl) | ||
| Leb1 | Lebanon | 7.2 ± 0.7 a | 58.5 ± 4.6 b | 67.5 ± 6.4 b |
| Leb2 | Lebanon | 6.5 ± 0.9 a | 42.3 ± 3.9 a | 46.4 ± 5.4 a |
| Leb3 | Lebanon | 6.2 ± 0.6 a | 47.8 ± 5.8 ab | 41.2 ± 3.9 a |
| Iran | Iran | 7.1 ± 0.7 a | 59.9 ± 5.8 b | 65.5 ± 5.8 b |
| India | India | 5.8 ± 0.7 a | 47.8 ± 3.5 ab | 47.8 ± 3.4 a |
| Origin of Samples | Concentration (μg/mL) | % Cell Viability (72 h) |
|---|---|---|
| Lebanon | 10 | 75 ± 4.2 c |
| 20 | 42 ± 3.9 b | |
| 40 | 25 ± 2.8 a | |
| Iran | 10 | 72 ± 3.7 c |
| 20 | 45 ± 3.0 b | |
| 40 | 22 ± 3.6 a |
| Sample Code | Geographical Origin |
|---|---|
| Leb1 | Lebanon, Qaa |
| Leb2 | Lebanon, Hermel |
| Leb3 | Lebanon, Baalbeck |
| Iran | Iran |
| India | India |
| Ita (AB) | Italy, Abruzzo |
| Ita (LA) | Italy, Lazio |
| Ita (SA) | Italy, Sardinia |
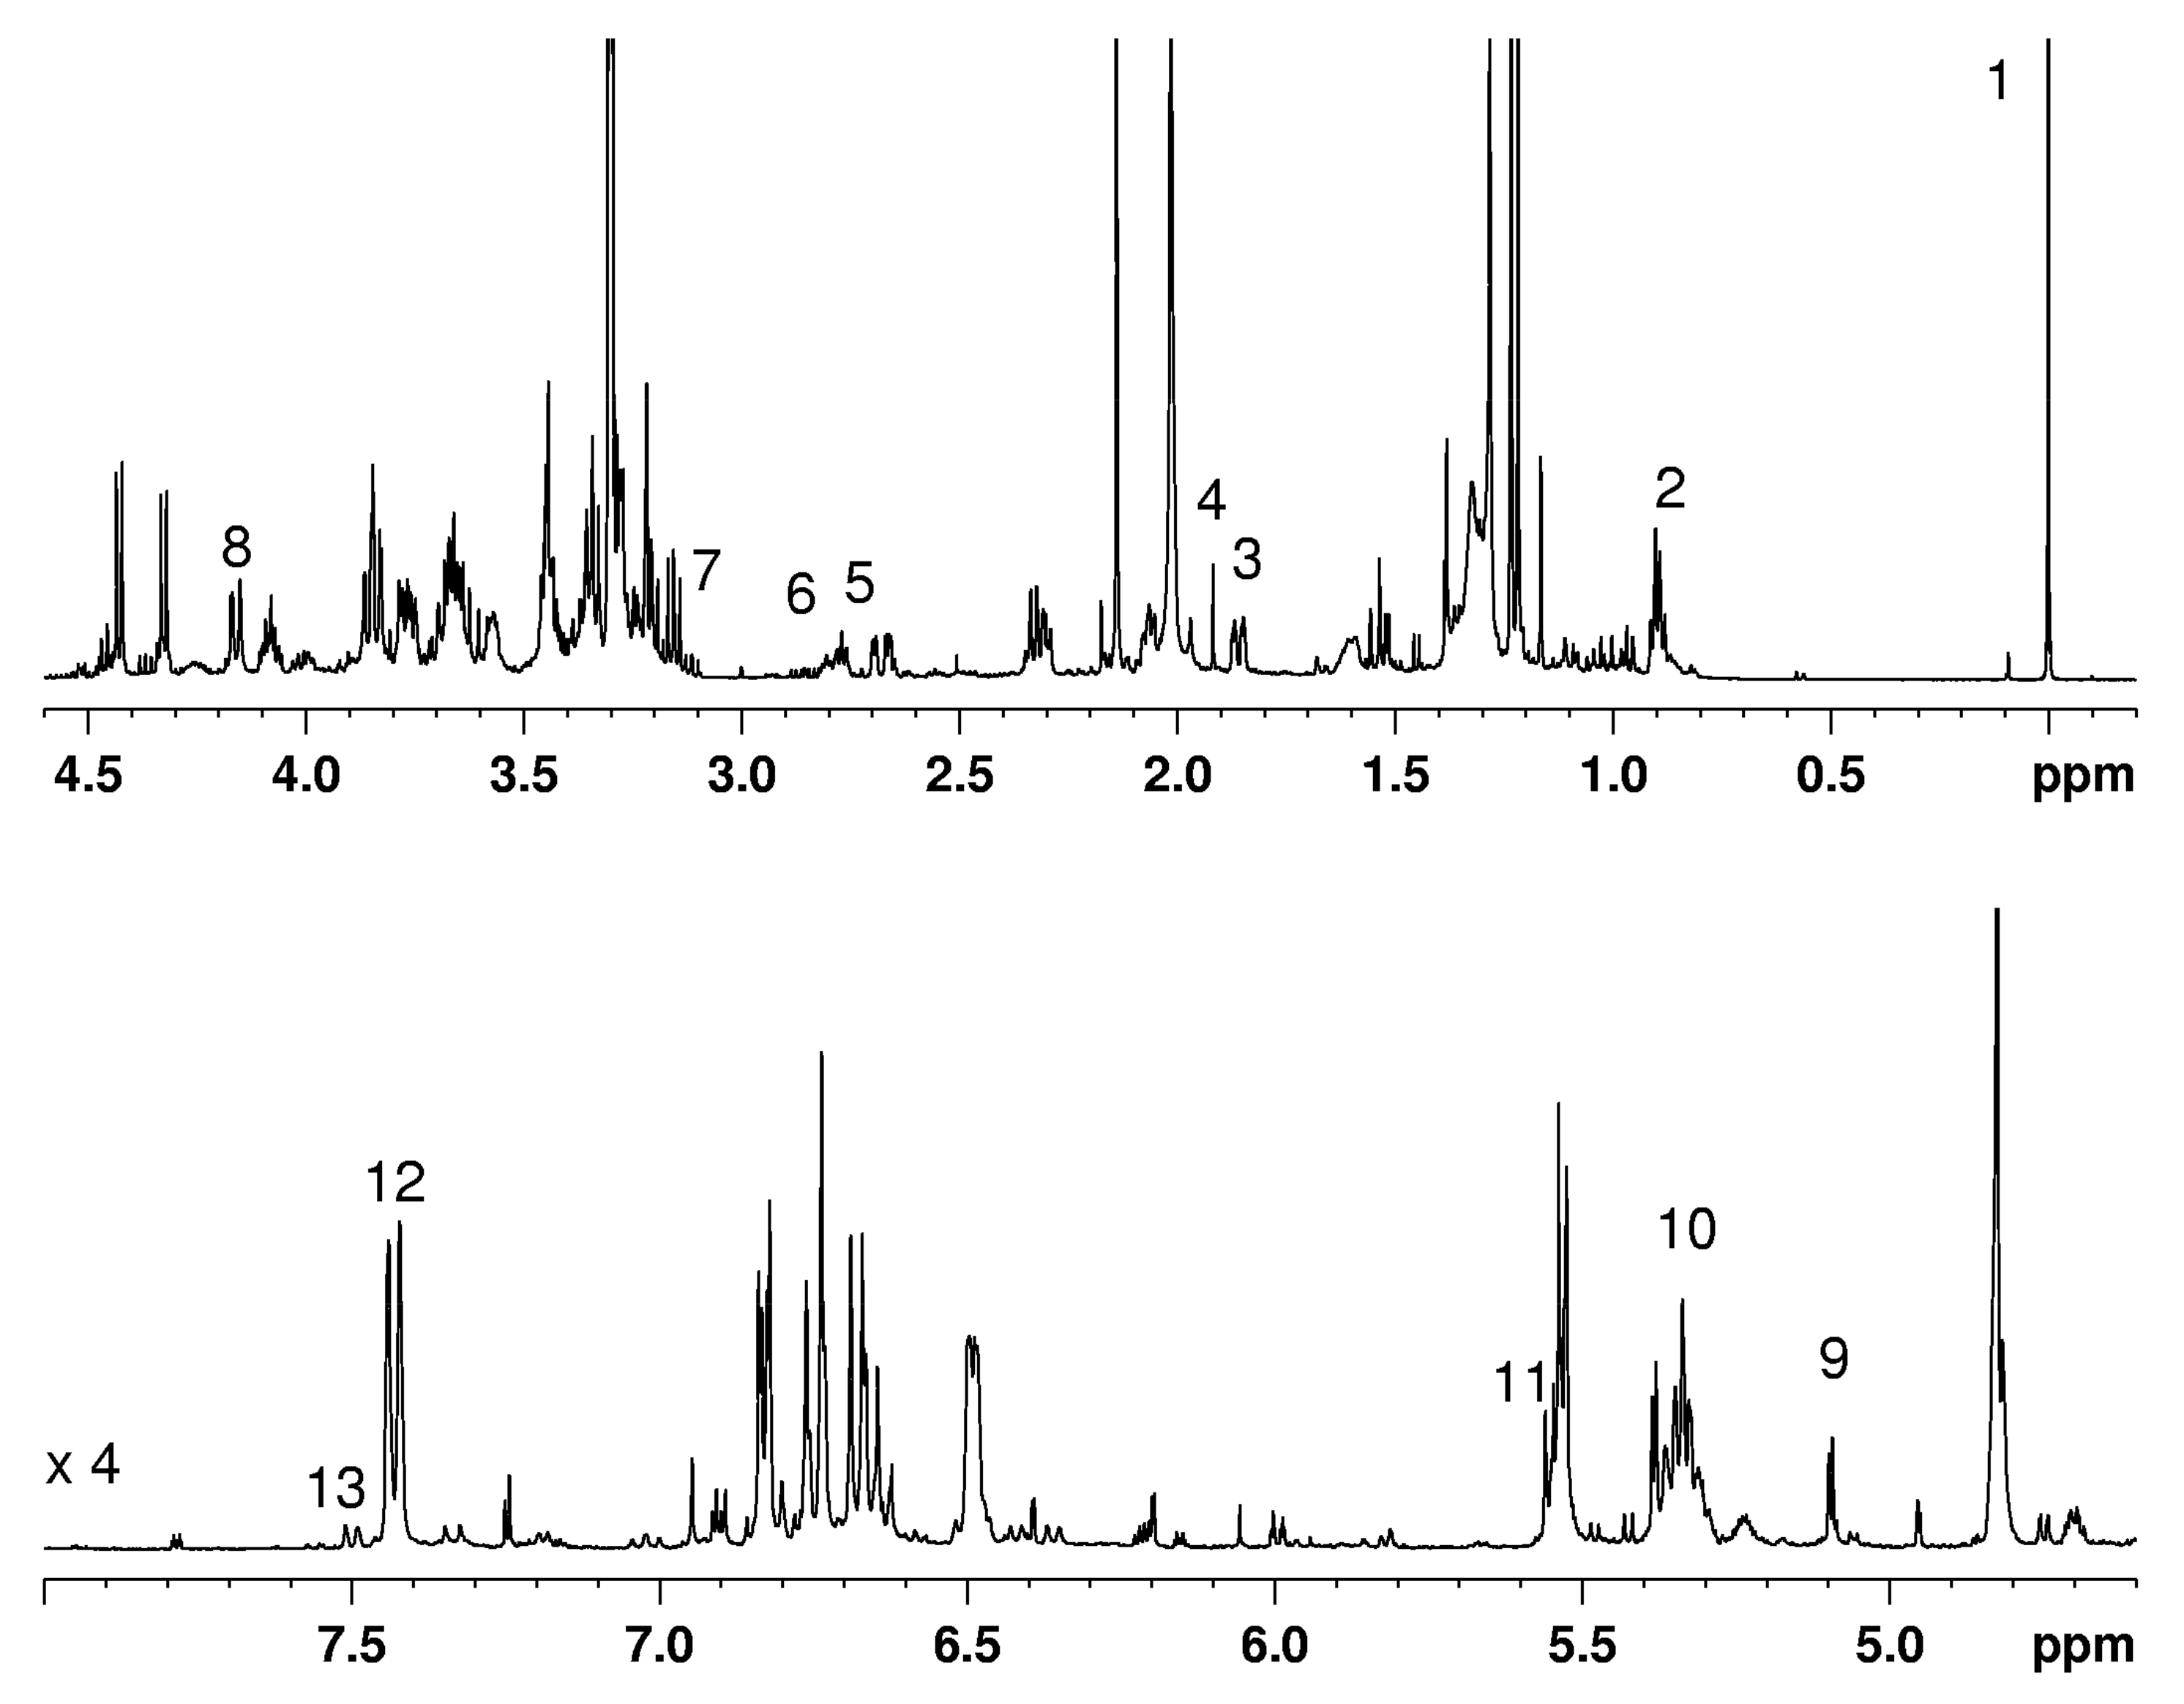
| Metabolite | Annotation | Group | n, Number of Equivalent Protons | 1H Chemical Shift, ppm/Multiplicity a |
|---|---|---|---|---|
| Fatty acids (FA) | 2 | CH3 | 3 | 0.90 /m |
| Picrocrocin (PCROC) | 3 | CH2-5 | 1 | 1.85 / ddd: [12.6; 3.3; 2.2] |
| Acetic acid (AcOH) | 4 | CH3 | 3 | 1.94 /s |
| Linoleic fatty acid (C18:2) | 5 | CH2-11 | 2 | 2.78/ t: [6.8] |
| Linolenic fatty acid (C18:3) | 6 | CH2-11, 14 | 4 | 2.81/ t: [6.8] |
| β-Glucose (βGLC) | 7 | CH-2 | 1 | 3.12 /dd: [9.2; 7.8] |
| α-Glucose (αGLC) | 9 | CH-1 | 1 | 5.10 /d: [3.7] |
| Unsaturated fatty acids (UFA) | 10 | CH=CH | 2 | 5.34 / m |
| β-D-gentiobiosylcrocins (GB-Croc) | 8 | CH2-6 | 1 | 4.17 /dd: [11.5; 2] |
| β-D-glucosylcrocins (βGLC-Croc) | 11 | CH-1 | 1 | 5.56 / d: [7.7] |
| All-trans-crocetin (DBtCroc), aglycone moiety | 12 | CH=CH-10,10′ | 2 | 7.44 / dm: [11.3] |
| 13-cis-crocetin (DBcCroc) | 13 | CH-10 | 1 | 7.51 /d: [11.8] |
Publisher’s Note: MDPI stays neutral with regard to jurisdictional claims in published maps and institutional affiliations. |
© 2021 by the authors. Licensee MDPI, Basel, Switzerland. This article is an open access article distributed under the terms and conditions of the Creative Commons Attribution (CC BY) license (https://creativecommons.org/licenses/by/4.0/).
Share and Cite
Samaha, H.; Chahine, N.; Sobolev, A.P.; Menghini, L.; Makhlouf, H. 1H-NMR Metabolic Profiling and Antioxidant Activity of Saffron (Crocus sativus) Cultivated in Lebanon. Molecules 2021, 26, 4906. https://doi.org/10.3390/molecules26164906
Samaha H, Chahine N, Sobolev AP, Menghini L, Makhlouf H. 1H-NMR Metabolic Profiling and Antioxidant Activity of Saffron (Crocus sativus) Cultivated in Lebanon. Molecules. 2021; 26(16):4906. https://doi.org/10.3390/molecules26164906
Chicago/Turabian StyleSamaha, Hala, Nathalie Chahine, Anatoly Petrovich Sobolev, Luigi Menghini, and Hassane Makhlouf. 2021. "1H-NMR Metabolic Profiling and Antioxidant Activity of Saffron (Crocus sativus) Cultivated in Lebanon" Molecules 26, no. 16: 4906. https://doi.org/10.3390/molecules26164906
APA StyleSamaha, H., Chahine, N., Sobolev, A. P., Menghini, L., & Makhlouf, H. (2021). 1H-NMR Metabolic Profiling and Antioxidant Activity of Saffron (Crocus sativus) Cultivated in Lebanon. Molecules, 26(16), 4906. https://doi.org/10.3390/molecules26164906