Article

Structural Refinement of Carbimazole by NMR Crystallography

by
Andrea Scarperi
1,
Giovanni Barcaro
2,
Aleksandra Pajzderska
3,
Francesca Martini
1,4,
Elisa Carignani
1,5,* and
Marco Geppi
1,4,5,*
1
Department of Chemistry and Industrial Chemistry, University of Pisa, Via G. Moruzzi 13, 56124 Pisa, Italy
2
Institute For Chemical And Physical Processes, Italian National Council for Research, CNR/IPCF, Via G. Moruzzi 1, 56124 Pisa, Italy
3
Department of Radiospectroscopy, Faculty of Physics, Adam Mickiewicz University, Uniwersytetu Poznanskiego 2, 61-614 Poznan, Poland
4
Center for Instrument Sharing, University of Pisa (CISUP), 56126 Pisa, Italy
5
Institute for the Chemistry of OrganoMetallic Compounds, Italian National Council for Research, CNR/ICCOM, Via G. Moruzzi 1, 56124 Pisa, Italy
*
Authors to whom correspondence should be addressed.
Molecules 2021, 26(15), 4577; https://doi.org/10.3390/molecules26154577
Submission received: 30 June 2021 / Revised: 20 July 2021 / Accepted: 23 July 2021 / Published: 29 July 2021
(This article belongs to the Section Molecular Structure)

Abstract

:
The characterization of the three-dimensional structure of solids is of major importance, especially in the pharmaceutical field. In the present work, NMR crystallography methods are applied with the aim to refine the crystal structure of carbimazole, an active pharmaceutical ingredient used for the treatment of hyperthyroidism and Grave’s disease. Starting from previously reported X-ray diffraction data, two refined structures were obtained by geometry optimization methods. Experimental 1H and 13C isotropic chemical shift measured by the suitable 1H and 13C high-resolution solid state NMR techniques were compared with DFT-GIPAW calculated values, allowing the quality of the obtained structure to be experimentally checked. The refined structure was further validated through the analysis of 1H-1H and 1H-13C 2D NMR correlation experiments. The final structure differs from that previously obtained from X-ray diffraction data mostly for the position of hydrogen atoms.

1. Introduction

In the determination of the solid-state structure of crystalline compounds, NMR crystallography [1] has gradually grown in importance and is now considered complementary and supplementary to X-ray diffraction crystallography, the established leading technique in the field. The combination of the two techniques is particularly powerful in providing in-depth analyses of crystalline materials. Indeed, NMR techniques can cope with some limitations of X-ray diffractometry (XRD), such as the requirement of high quality and large single crystals. Of course, powder X-ray diffraction (PXRD) can also be applied in this case, but solving structure from PXRD still remains a challenging operation and the obtained structures are usually of lower quality than those derived from single crystal diffraction data. More importantly, XRD can have difficulty in making distinctions between isoelectronic species and atoms with similar atomic numbers. Finally, hydrogen atoms are poorly localized by XRD, as diffractometric techniques locate the centroid of the electron density, not the nuclear positions. On the other hand, NMR is intrinsically sensitive to the nuclear species and provides chemically selective information. In particular, the positions and interactions of hydrogen atoms can be finely probed by 1H NMR, and also exploiting heteronuclei, such as 13C, 14/15N, 31P and others.
In some research fields, the accurate characterization of the three-dimensional structure of solids is extremely important. This is particularly true in the pharmaceutical field, where the presence of an unknown polymorph could lead to extremely serious consequences [2,3]. Moreover, accurate crystal structures of solid pharmaceutics can be used to calculate important parameters using periodic density functional theory (DFT) calculations [4,5,6]. To this aim, structural studies capable of obtaining additional information to those derived from only diffractographic techniques are often required.
NMR has provided crystallographic information from its earliest days [7]; nowadays, thanks to the enormous developments made in the NMR field, there are many examples in the literature where NMR crystallography was successfully applied in the field of biochemistry [8,9], in the study of inorganic materials [10], crystalline microporous materials [11], supramolecular assemblies [12], and pharmaceutical systems [13,14].
The ability to calculate NMR parameters, thanks to the improved efficiency of DFT codes, and in particular, thanks to the development of the gauge-including projector-augmented waves (GIPAW) method, has allowed rapid development of NMR crystallography, especially for the study of small organic molecules [15]. With respect to methods based on gauge-including atomic orbitals (GIAOs) [16], although extended to account for periodic conditions [17], in recent years, GIPAW has become the most popular method, as a first-principle theoretical framework in the context of NMR crystallography [18,19]. The reason for its success stems from the development of well-developed codes using periodic boundary conditions in conjunction with plane-waves, as basis sets and accurate dedicated pseudopotentials to build Bloch states, and simulate magnetic properties of crystalline (and, more in general, solid-state) systems. In this area, NMR methods have been used in a wide range of applications, for example assisting the structure solution process from PXRD data [20,21,22], establishing molecular conformations [23,24], confirming and rationalizing intermolecular interactions [25,26,27], and in some cases, deriving complete structures in absence of diffraction data [28,29,30].
In this context, an important research field regards the validation of structures derived from diffractographic data. This process often results in the optimization of atom positions in the unit cell of the crystal. The validation of diffractographic structures is based on the comparison between experimentally measured NMR parameters with those calculated with DFT methods. This process was proven effective at resolving ambiguities related to the molecular structure [31], to choose between alternative proposed structures [32,33], and to refine them through optimization of atom positions in the unit cell [34,35,36,37]. Although optimization of hydrogen atoms usually has the biggest effect, changes in heavy atom positions obtained through full optimization of the molecule sometimes results in improved agreement with experimental NMR data.
The present article reports the structural refinement of carbimazole by NMR crystallography. Carbimazole is, currently, one of the most used drugs for the treatment of hyperthyroidism and Grave’s disease. Its antithyroid action is attributed to its metabolization to methimazole in the body, which inhibits the first step of thyroid hormone synthesis in thyroglobulin [38,39,40,41]. Although anti-thyroid drugs (methimazole, carbimazole, propylthiouracil) have been used for over 70 years, despite a lot of research, their mechanisms of action are still not fully understood, especially at the molecular level.
The crystal structure of carbimazole has been independently studied by two research groups [42,43], and is reported in the Cambridge Structural Database (JOVDIH and JOVDIH01). The two structures are very similar and their main parameters are reported in Table 1. Delage et al. [42] derived the crystal structure by single crystal XRD (SCXRD) at an ambient temperature with CuKα irradiation in 1990, while the structural determination performed by D. Das and co-workers [43] with X-ray diffraction was a secondary aspect of a more general study, looking at the biological activity of carbimazole and its analogues. Therefore, the diffractometric procedure and the determined structure were not described and discussed in detail. In addition, to the best of our knowledge, no solid state NMR spectra of carbimazole are present in the literature thus far. All of the mentioned aspects make carbimazole an interesting case of study for structural refinement by NMR crystallography.
Here we present the first solid-state NMR (SSNMR) characterization of carbimazole. In particular, 13C cross polarization (CP)/magic angle spinning (MAS), 1H MAS, 1H combined rotation and multiple pulse spectroscopy (CRAMPS), 1H-1H double quantum-single quantum (DQSQ), and 1H-13C heteronuclear correlation (HETCOR) experiments were performed, and a complete assignment of the NMR peaks was achieved. The structural refinement was performed by using DFT with PAW pseudopotentials by optimizing hydrogen atoms only or all atoms in the cell. 1H and 13C isotropic chemical shifts were calculated for the raw and refined structures. The comparison between experimentally measured and calculated chemical shift values confirmed the better quality of the refined structures. These were further validated through the analysis of 2D NMR correlation 1H-1H DQSQ and 1H-13C HETCOR experiments.

2. Results

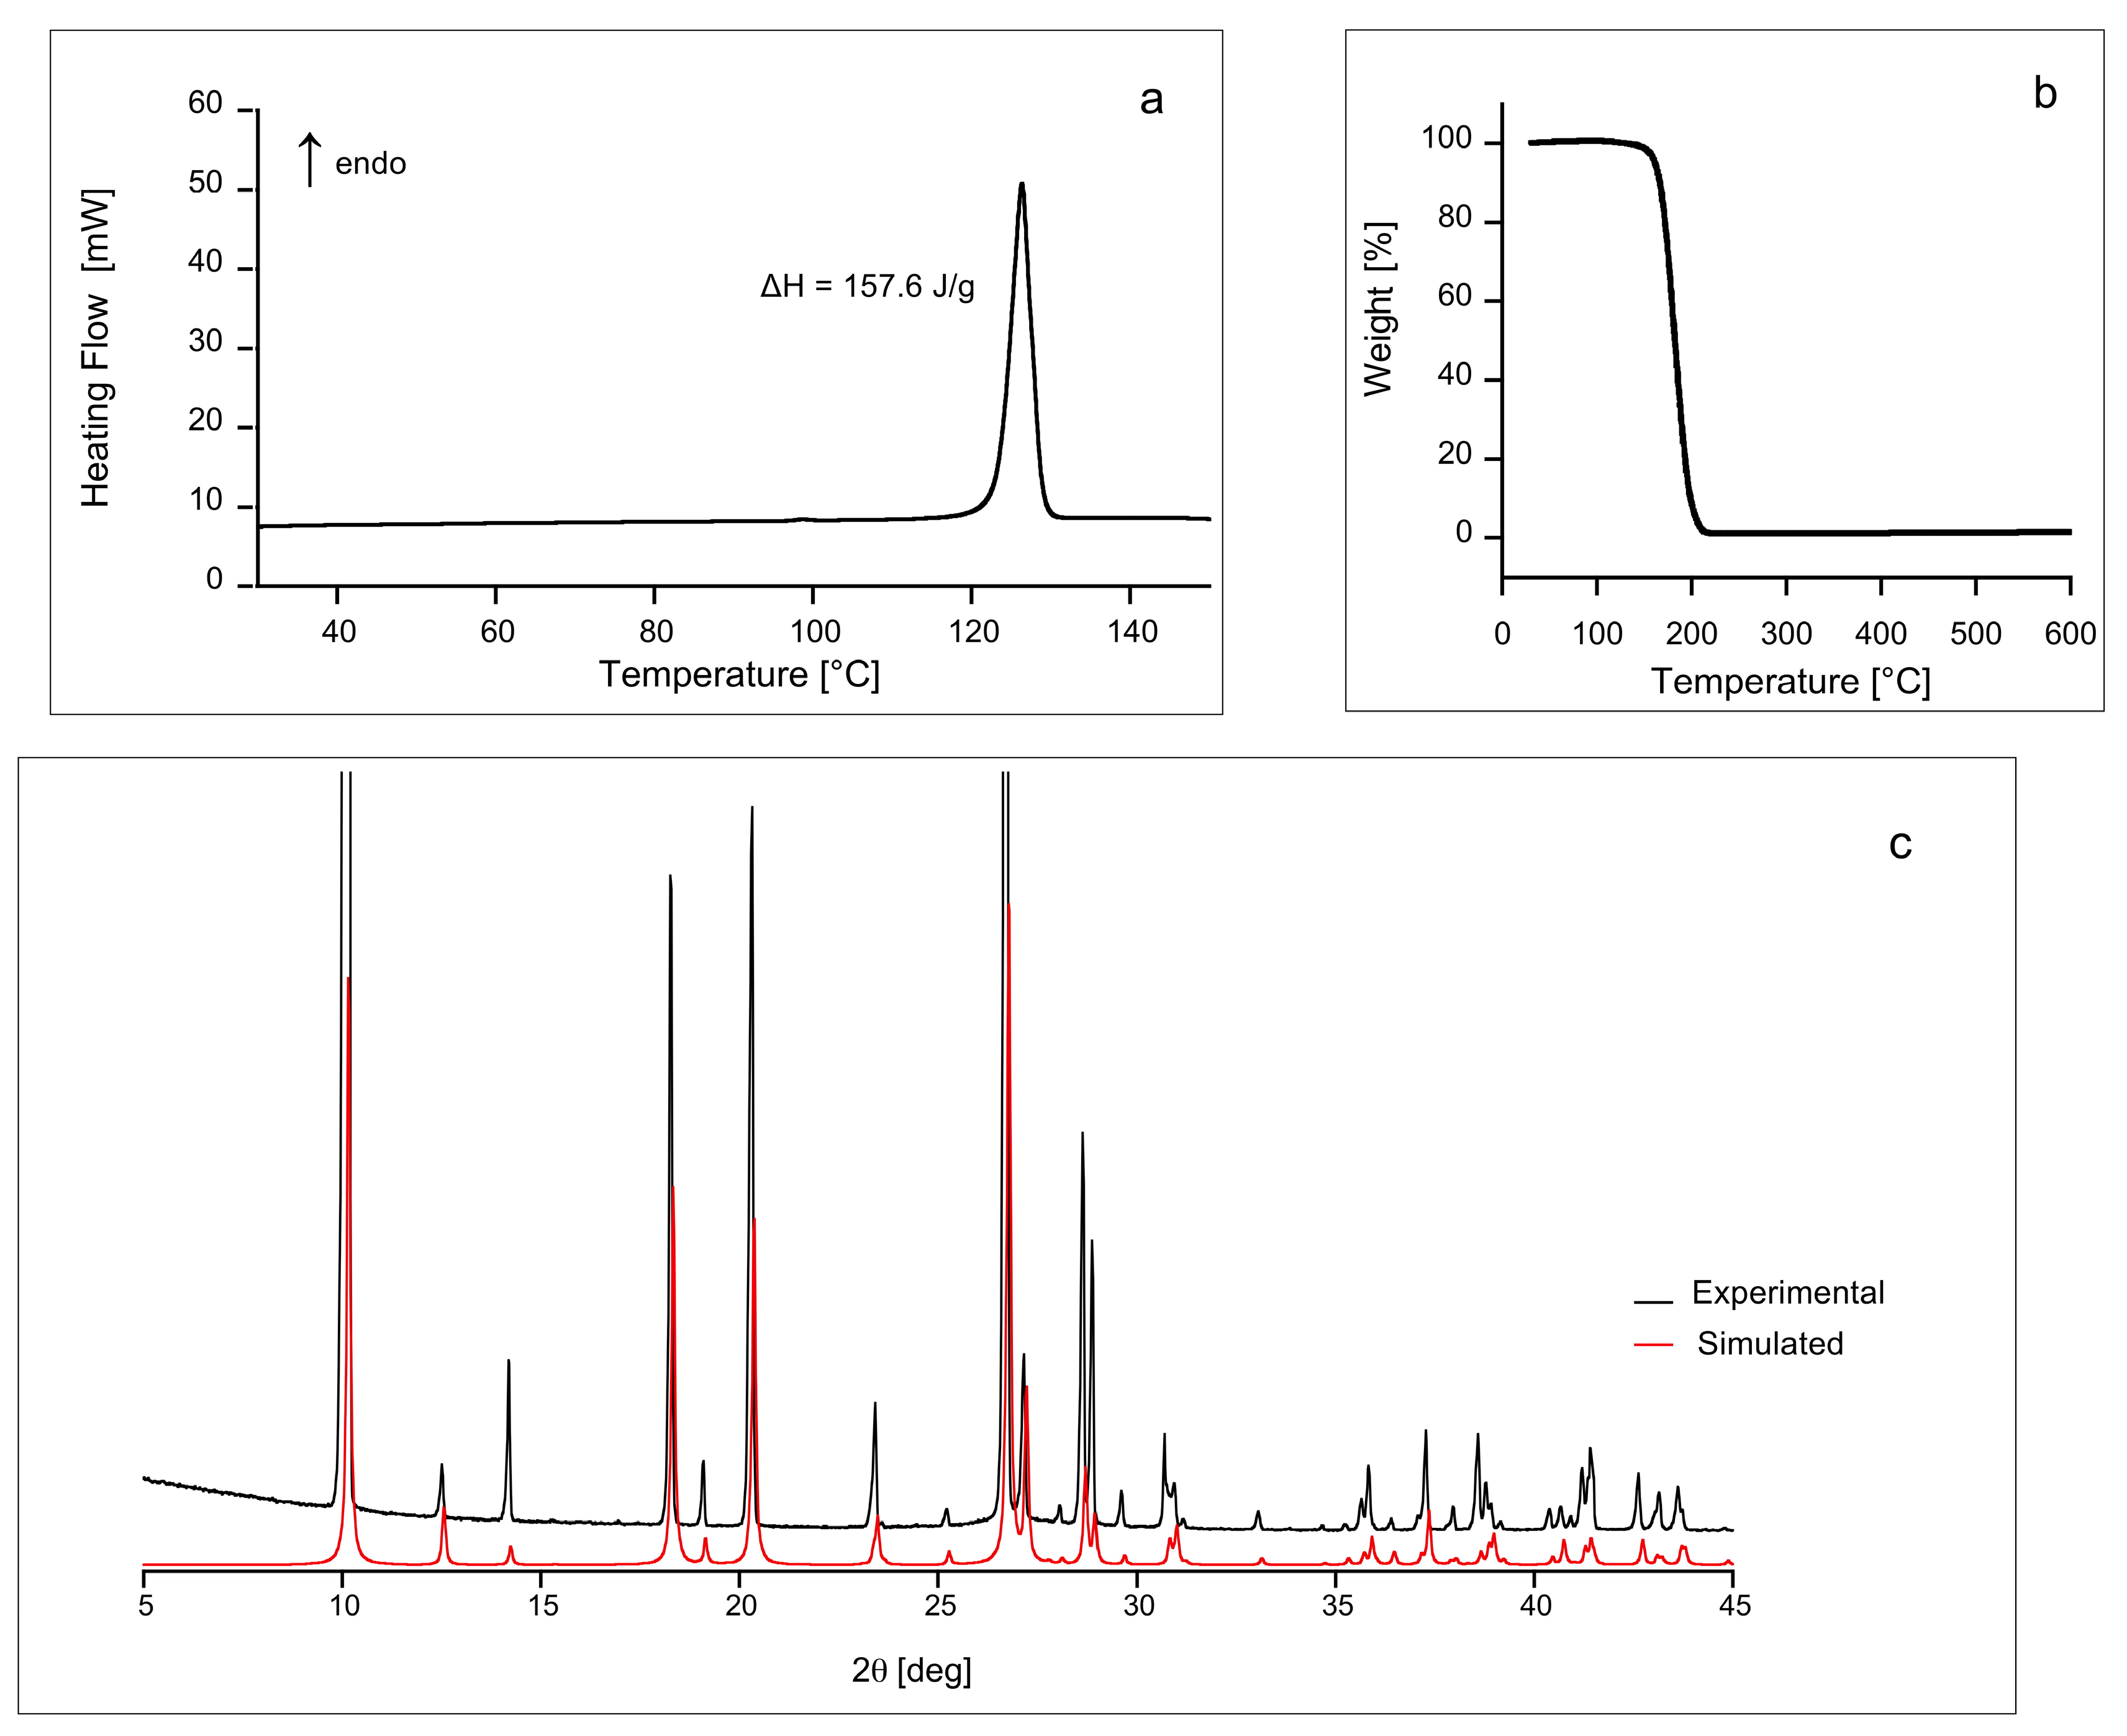
2.1. DSC, TGA and PXRD

First, we performed differential scanning calorimetry (DSC), thermogravimetric analysis (TGA) and PXRD in order to obtain a basic characterization of our carbimazole sample. All of these experiments indicate that the sample under study is a pure, crystalline, and anhydrous form. In particular, the DSC thermogram (Figure 1a) shows the melting peak of carbimazole at 126.4 °C, in agreement with the value reported in DrugBank [44], equal to 123.5 °C. In addition, DSC and TGA (Figure 1b) do not show anomalies or weight loss around 100 °C or below, confirming that the investigated sample is anhydrous. PXRD spectrum also confirms that the solid form investigated is the same polymorph studied by Delage et al. [42] and Das et al. [43].

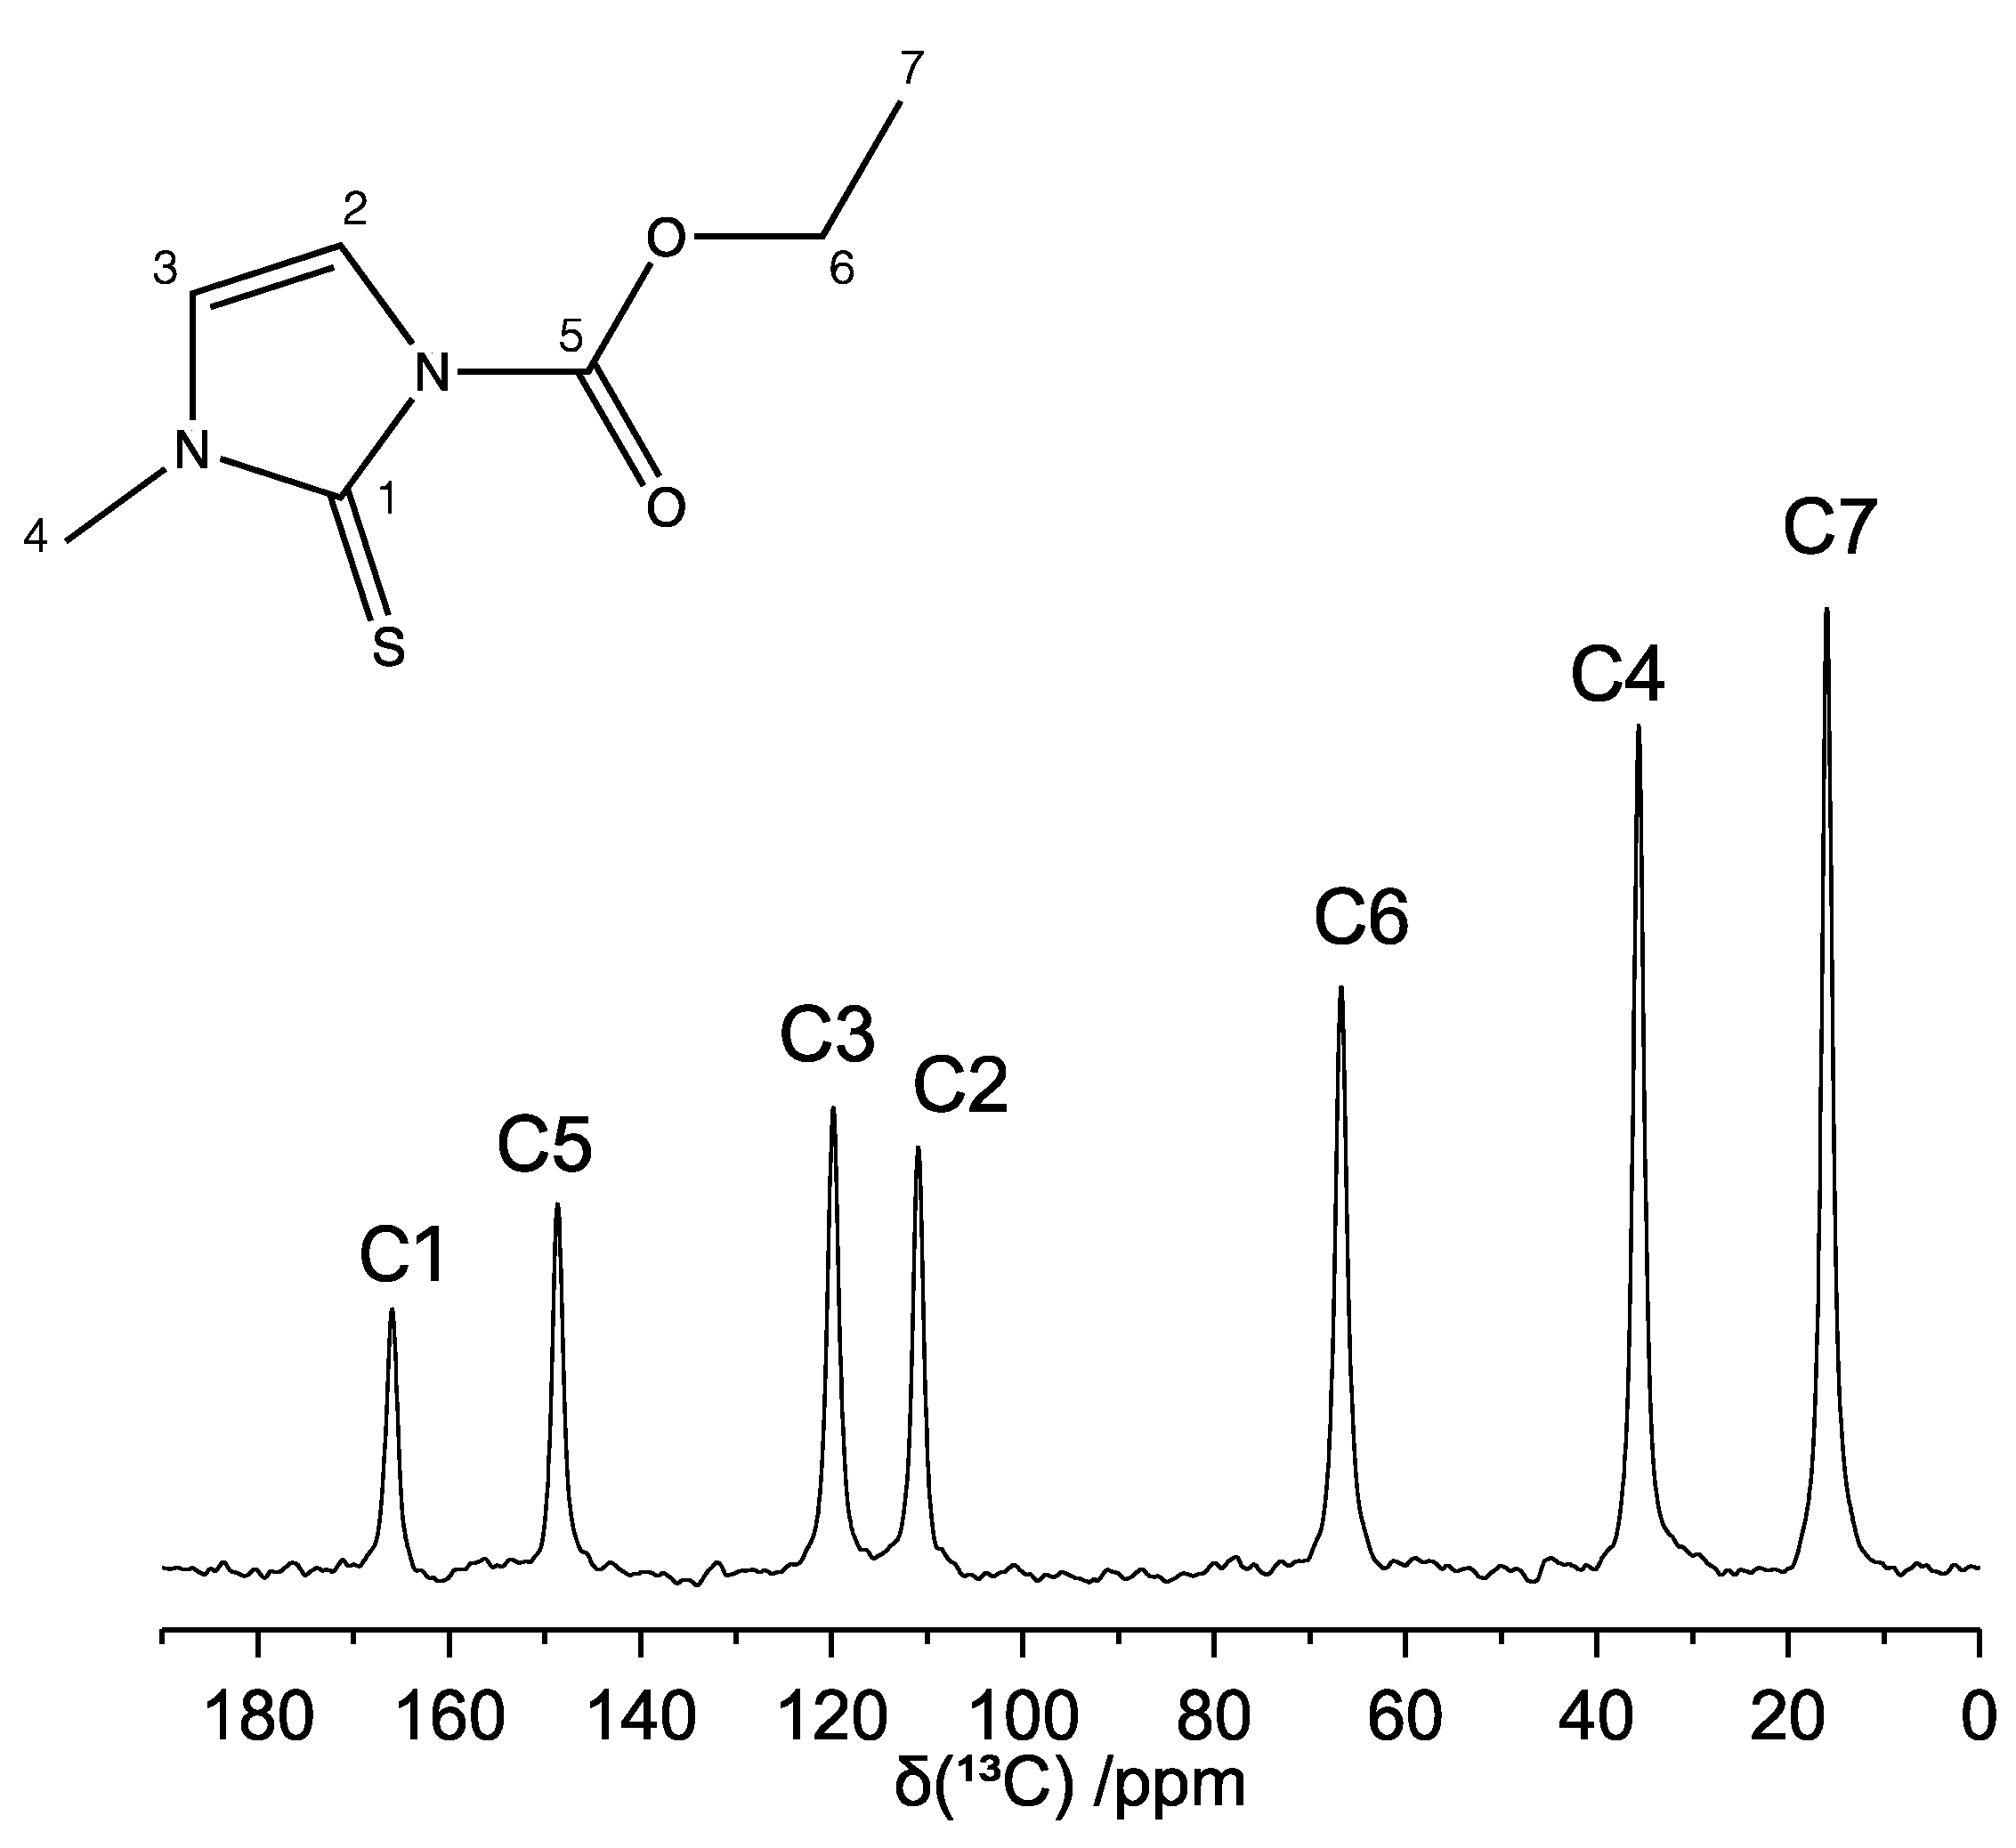
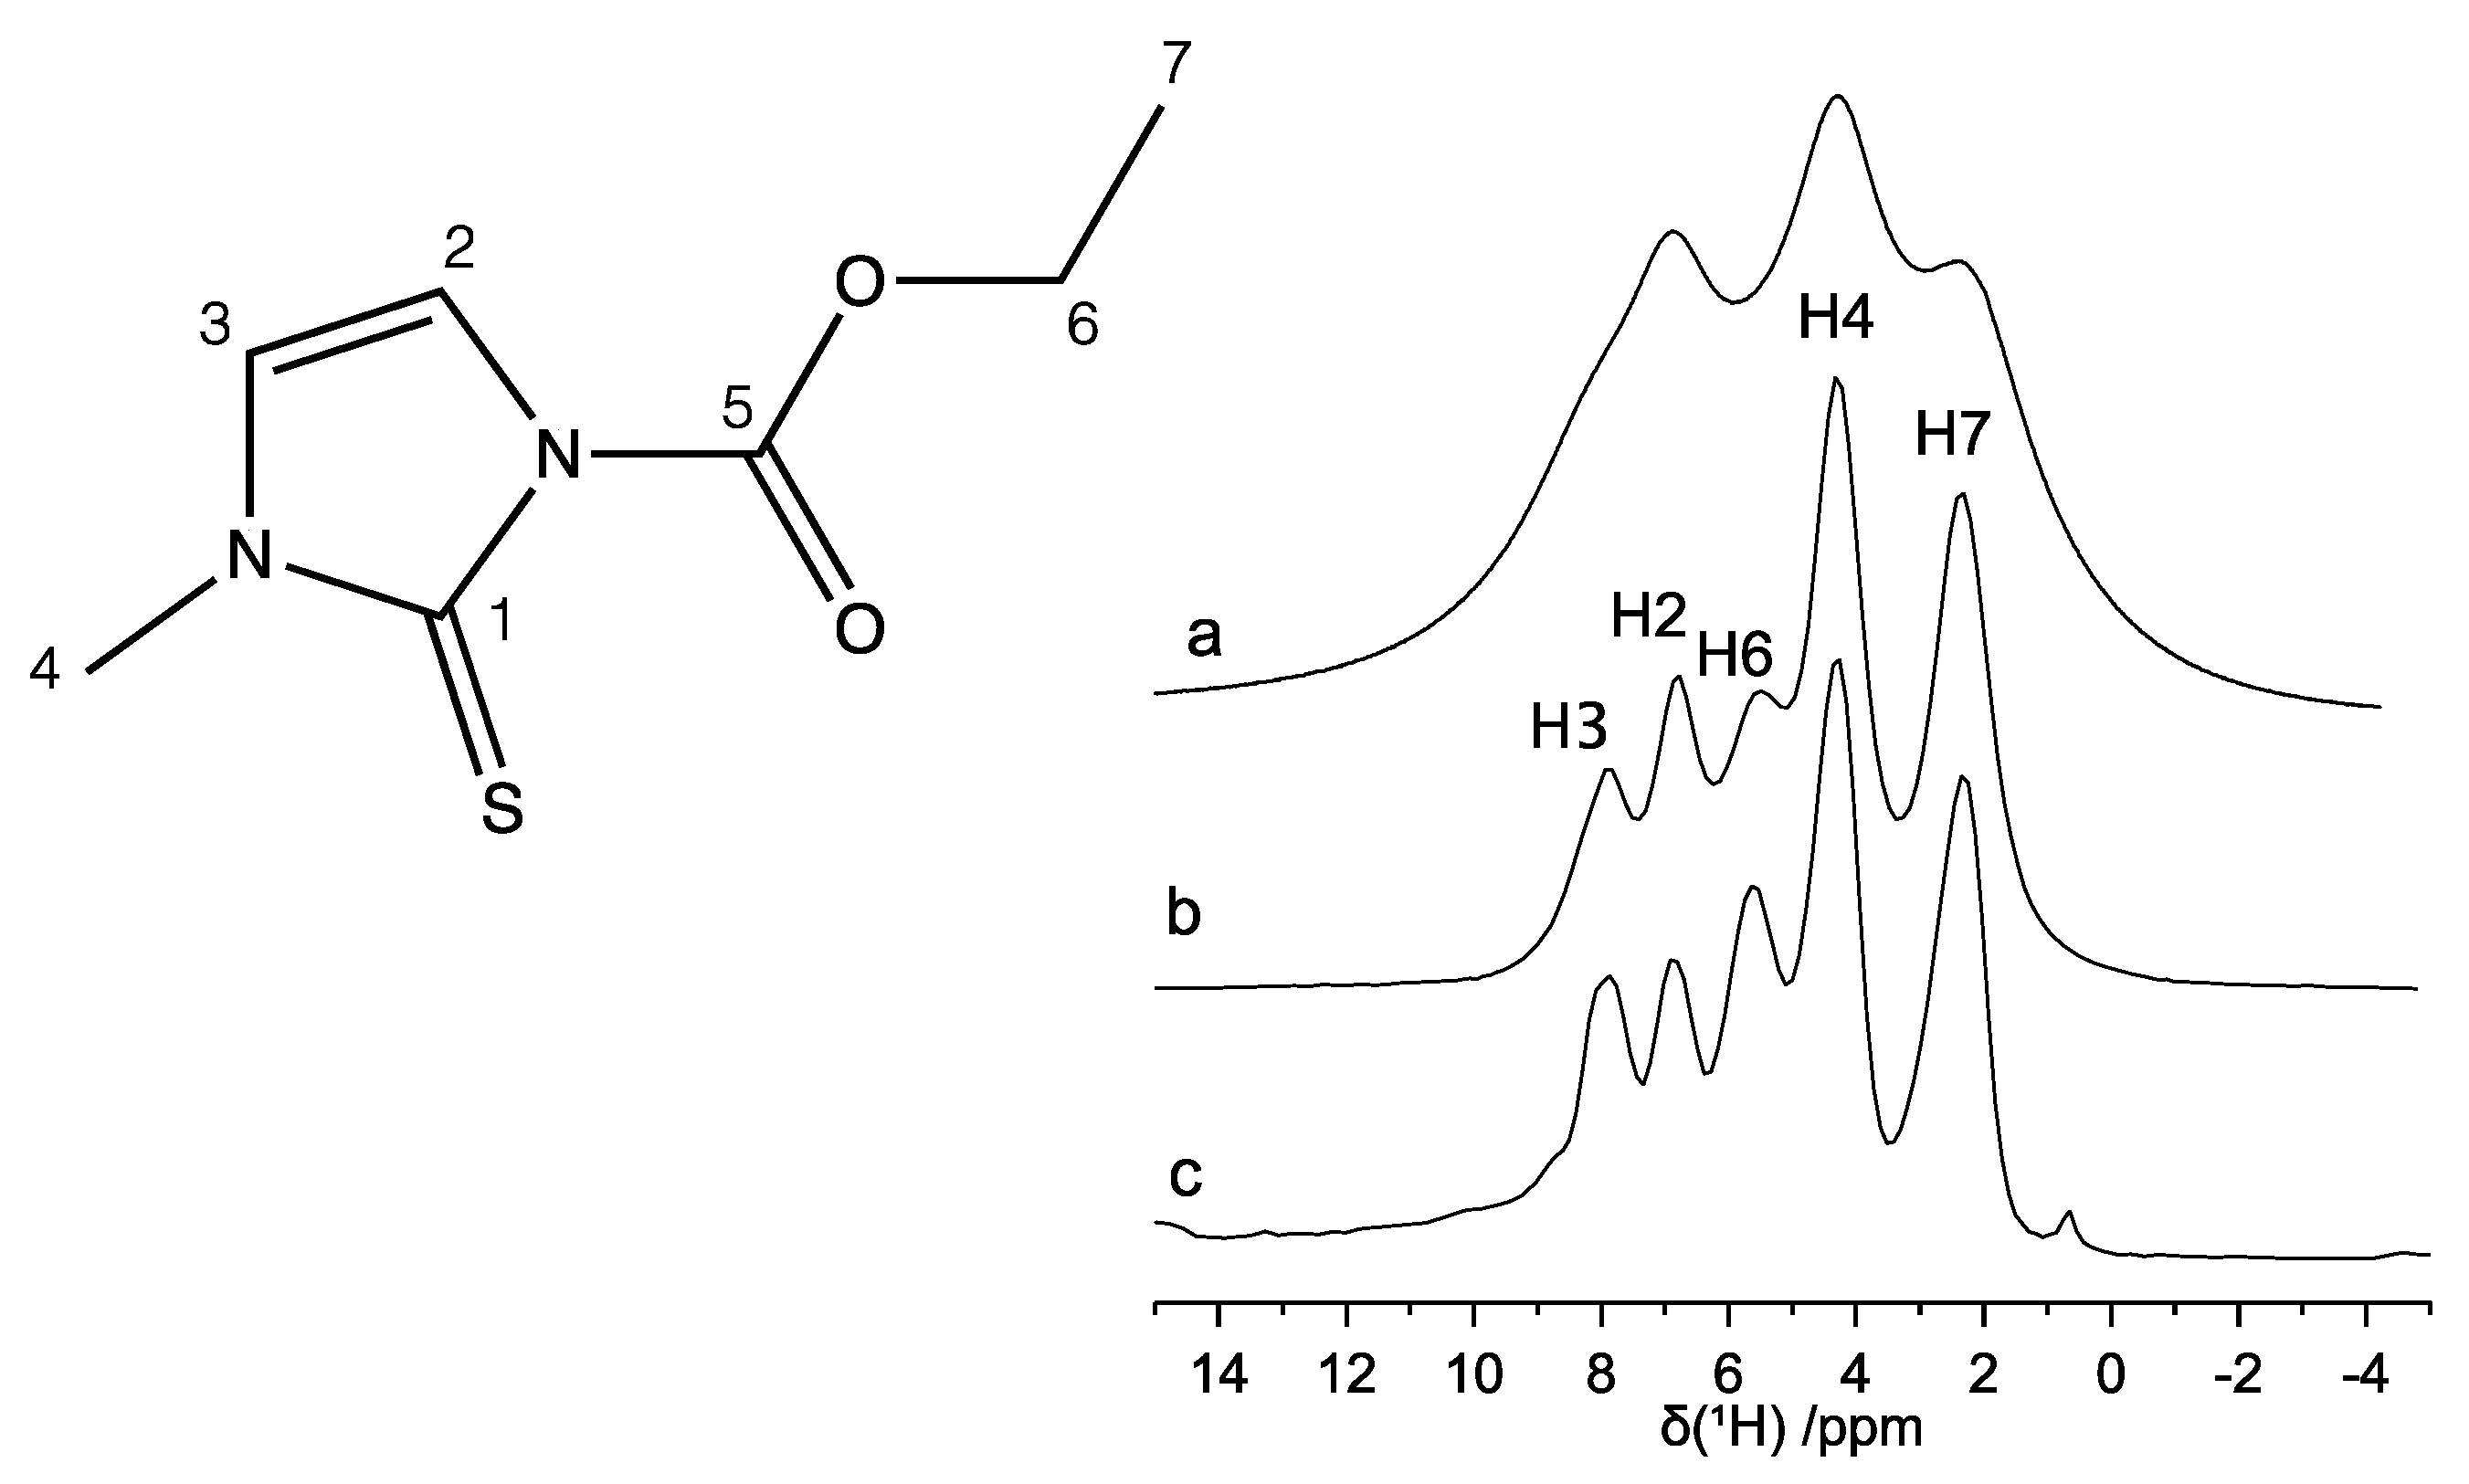
2.2. 1D High-Resolution 13C and 1H SSNMR Spectra

The 13C CP-MAS spectrum of carbimazole recorded at room temperature and at a MAS frequency (νMAS) of 22 kHz is reported in Figure 2, together with the signals assignment, and shows seven narrow and well-resolved peaks. The absence of multiplicity of resonance of the signals confirms the presence of a single independent molecule in the unit cell (Z′ = 1), as previously reported by Delage and co-workers [42]. The assignment of the spectrum was carried out by comparison with the 13C solution-state NMR spectrum of carbimazole [43,45] and was confirmed by the 1H-13C HETCOR experiment (vide infra). It is worth noting that the signal intensities in the 13C CP-MAS spectrum reflect the number of protons directly linked to the carbon nuclei, as expected.
The 1H MAS spectrum recorded at νMAS = 22 kHz (Figure 3a) shows a scarce resolution; nevertheless, at least three heavily superimposed peaks centered at 2.4, 4.3, and 6.9 ppm can be identified. In order to improve the spectral resolution, MAS had to be combined with suitable pulse sequences, such as the phase modulated Lee-Goldburg (PMLG) and decoupling using mind boggling optimization (DUMBO), aimed at better removing the 1H homonuclear dipolar coupling. The spectra so obtained are reported in Figure 3b,c, respectively. Both PMLG-MAS and DUMBO-MAS spectra show greatly improved spectral resolution: five partially overlapped peaks are now clearly distinguishable, corresponding to the five groups of inequivalent protons, as expected on the basis of the molecular structure. As for the 13C spectrum, also in this case, the spectral assignment was performed by comparison with the 1H solution-state NMR spectra [43,46] and with the assistance of the 1H-13C HETCOR experiment. All experimental isotropic 1H and 13C chemical shift values are reported in Table 2 along with the assignment of the peaks.

2.3. Optimization of the Crystallographic Structure

Two crystal structures of carbimazole exist in the literature (JOVDIH [42] and JOVDIH01 [43]). They are in fair agreement on the values of the length of the axes of the orthorhombic unit cell belonging to the Pmmm point group (space groups Pna21 and Pnma for JOVDIH and JOVDIH01, respectively), measuring 7.689 Å, 6.637 Å, and 17.364 Å for JOVDIH and 7.698 Å, 6.650 Å, and 17.388 Å for JOVDIH01. The unit cell contains four molecules (for a total of 88 atoms) generated from a single independent (Z′ = 1) molecule via the symmetry operations of the point group (see Table 1). We focused our analysis on the estimation of the isotropic chemical shifts of both the 13C and 1H nuclei, which are reported in Table 2, by starting from the more recent JOVDIH01 crystal structure. All of the simulations were performed by imposing the experimental values of the length of the crystal axes. Within the cell, we used three levels of local optimization: (i) no optimization at all, by considering the experimental positions derived directly from the X-ray structure; (ii) a local optimization of the H atoms only (X-ray experimental C-H distances are in fact underestimated by about 10% with respect to known typical values); (iii) a complete local optimization of all the atoms within the unit cell. The data collected from the DFT-GIPAW simulation were corrected by using linear regression functions, whose analytic expressions are reported for each case in Table 5. Since the validation of the refined structures is mainly based on the values of RMSD between calculated shielding values and experimental chemical shifts, the approach to perform a separate regression for each set of data allowed systematic deviations to be minimized. As can be immediately evinced from the reported values, simulated isotropic chemical shifts estimated on the bare experimental positions carry a significant RMSD for both 1H and 13C species, due to the aforementioned underestimation of the C-H distances; moreover, the angular coefficient of the regression function results remarkably far from unity for both species, indicating the difficulty of reconciling experimental and simulated values in this case. The situation is improved when considering level (ii) and (iii) of local optimization: RMSDs are reduced to the typical values reported in the literature for the two considered species [47,48], and the analytical regression functions are characterized by angular coefficients near unity. Interestingly, the lowest RMSD value is achieved when only H atoms are optimized, indicating that the optimization of the heavier atoms at the DFT-GGA level slightly worsen the agreement with the experimental values. This can be expected as hybrid XC-functionals are more accurate in predicting chemical shifts for this type of molecule [49], but the chosen periodic approach allowed the use of the gradient-corrected functional only. PXRD patterns were also simulated for the three levels of optimization and they resulted in being very similar to each other (see Figure 1 and Supplementary Materials).

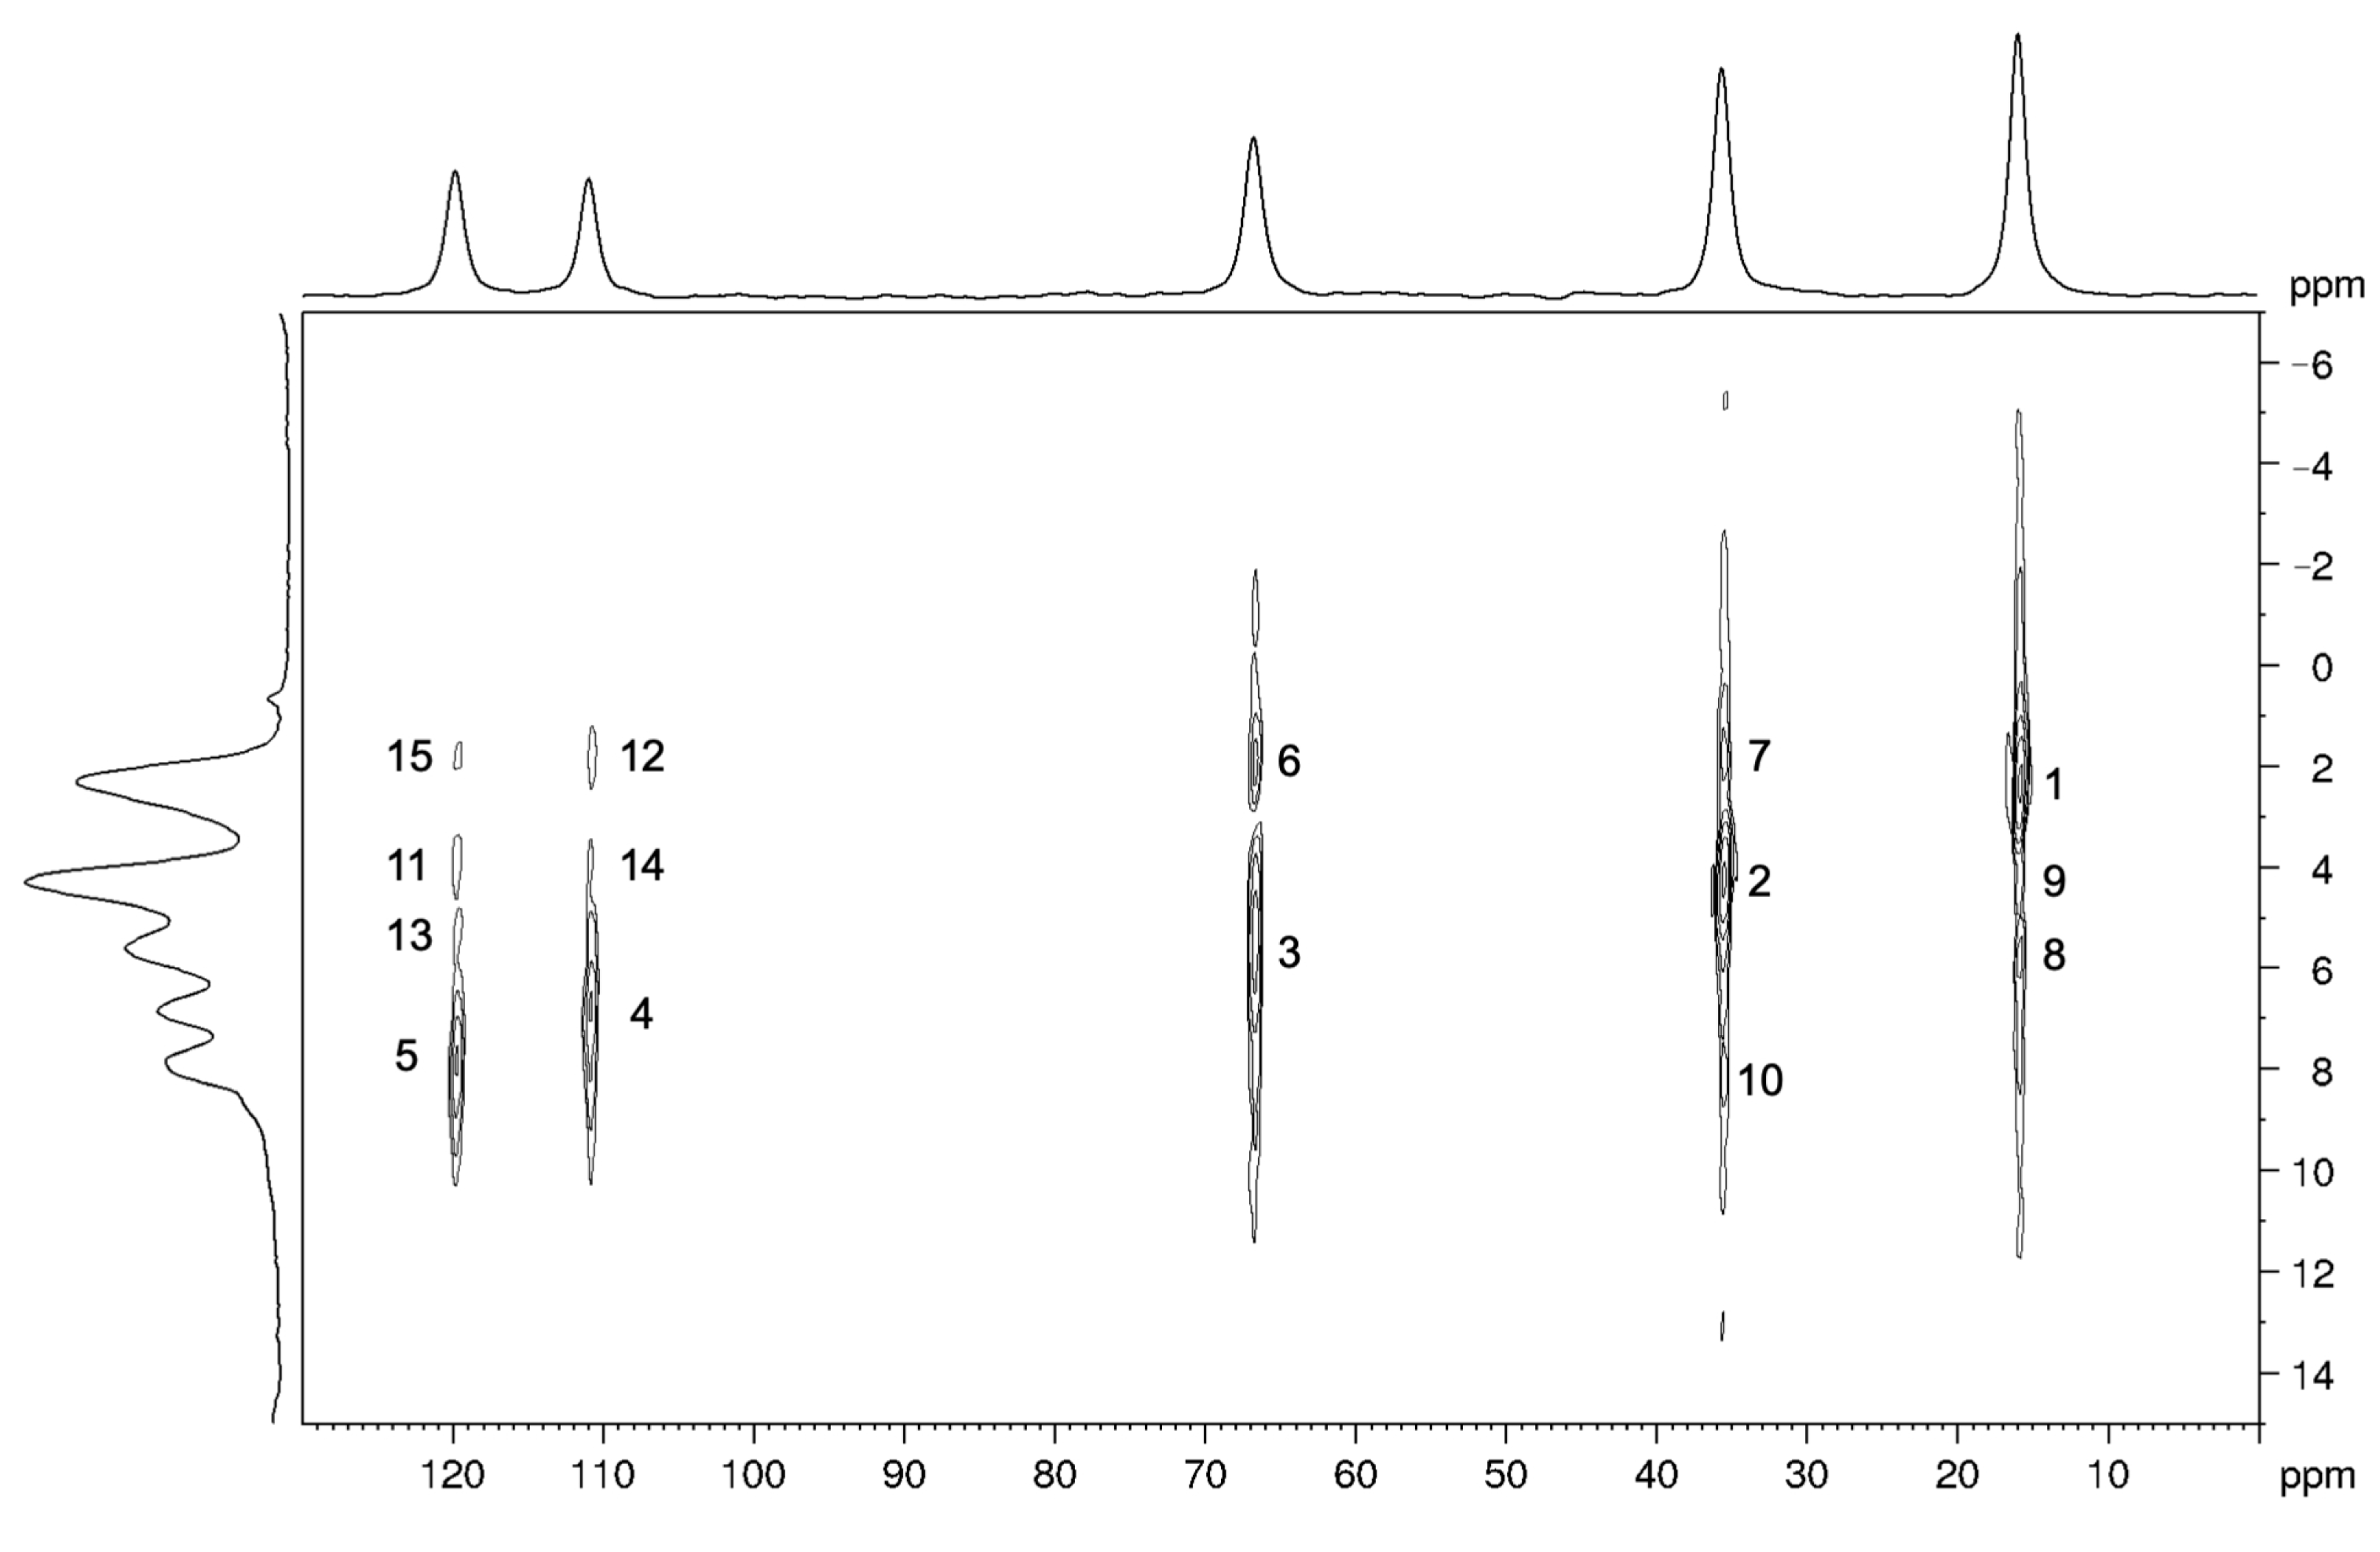
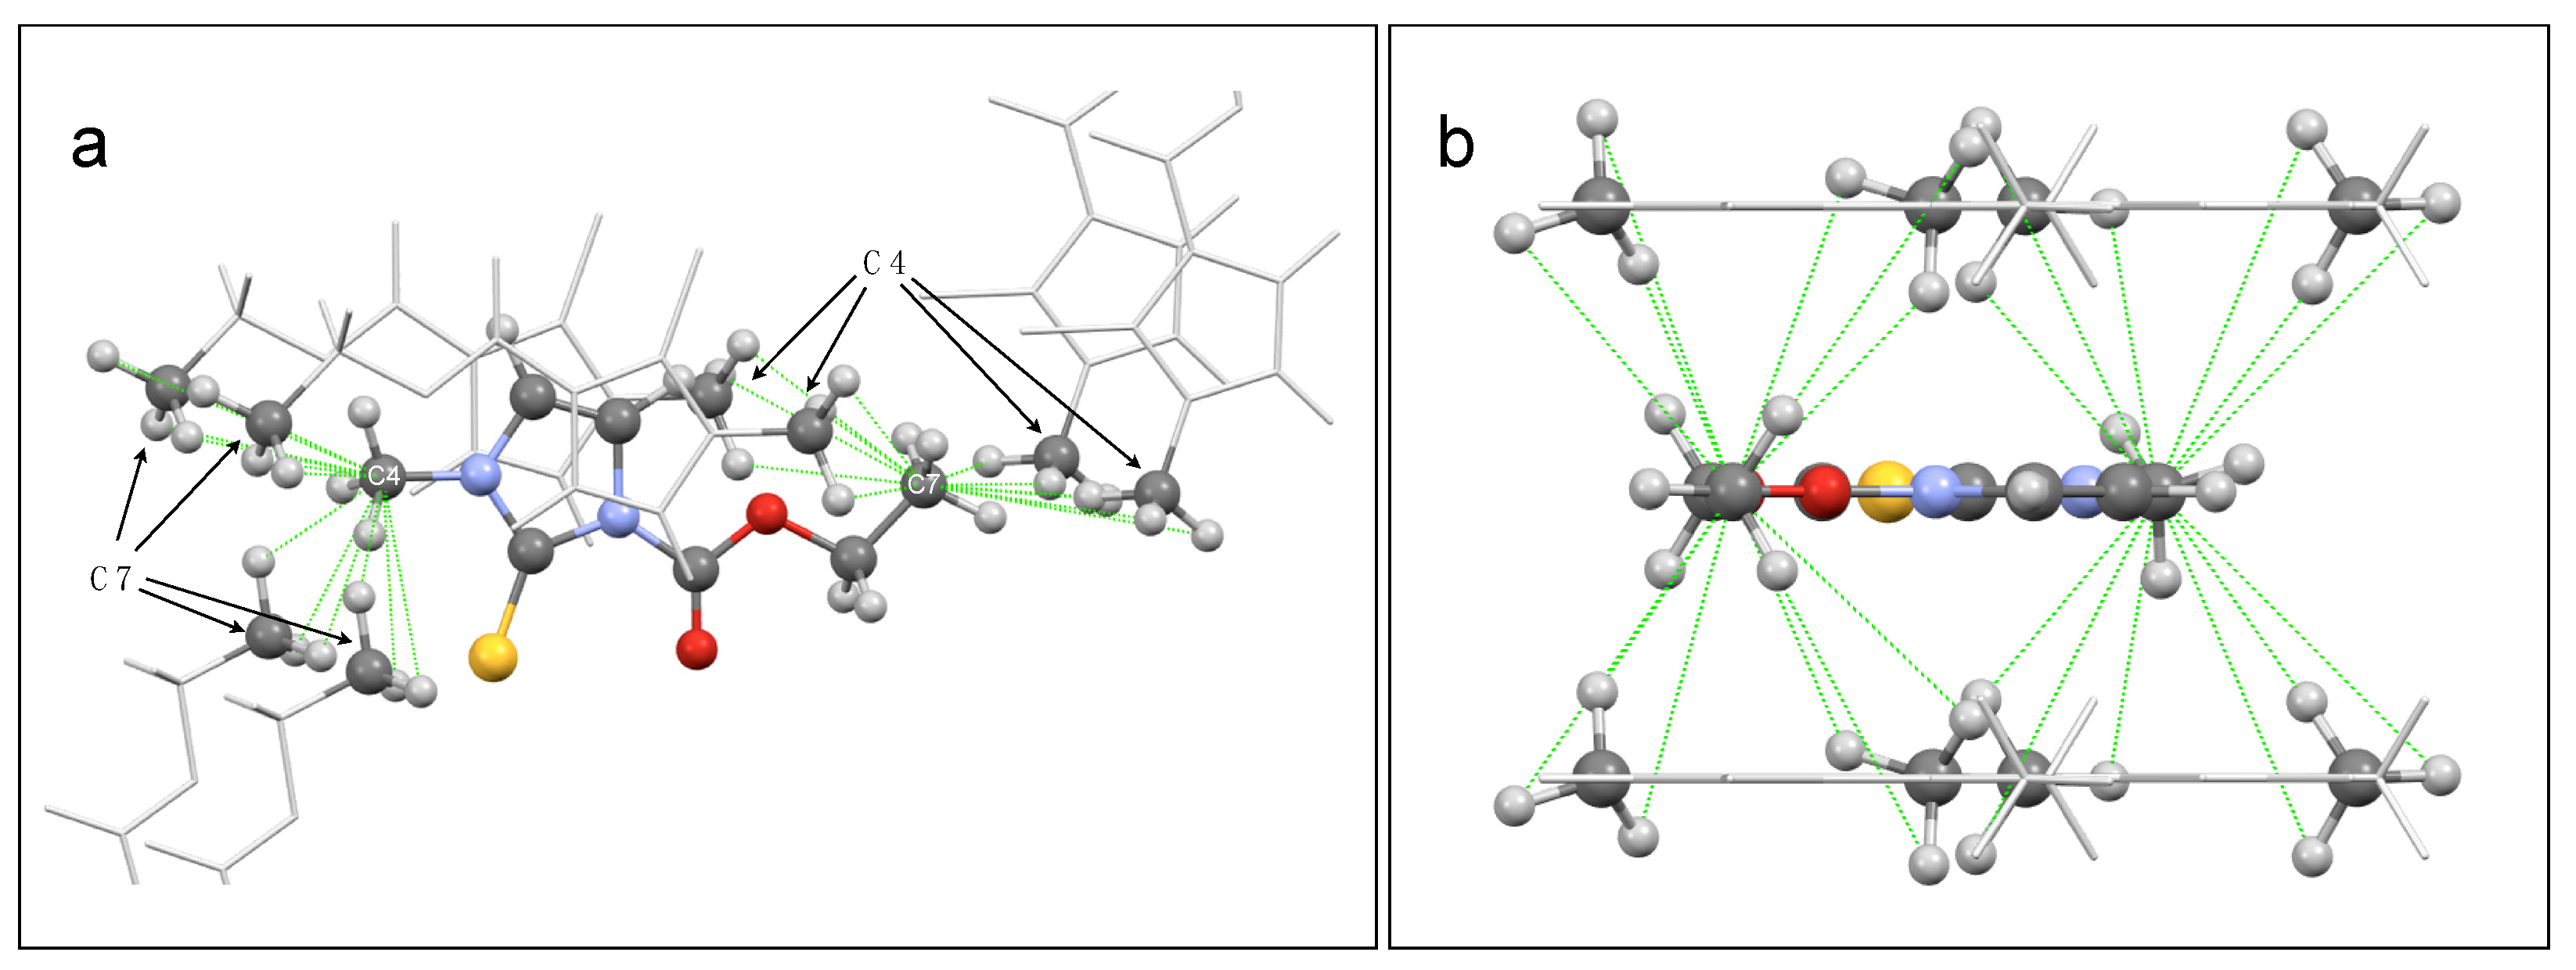
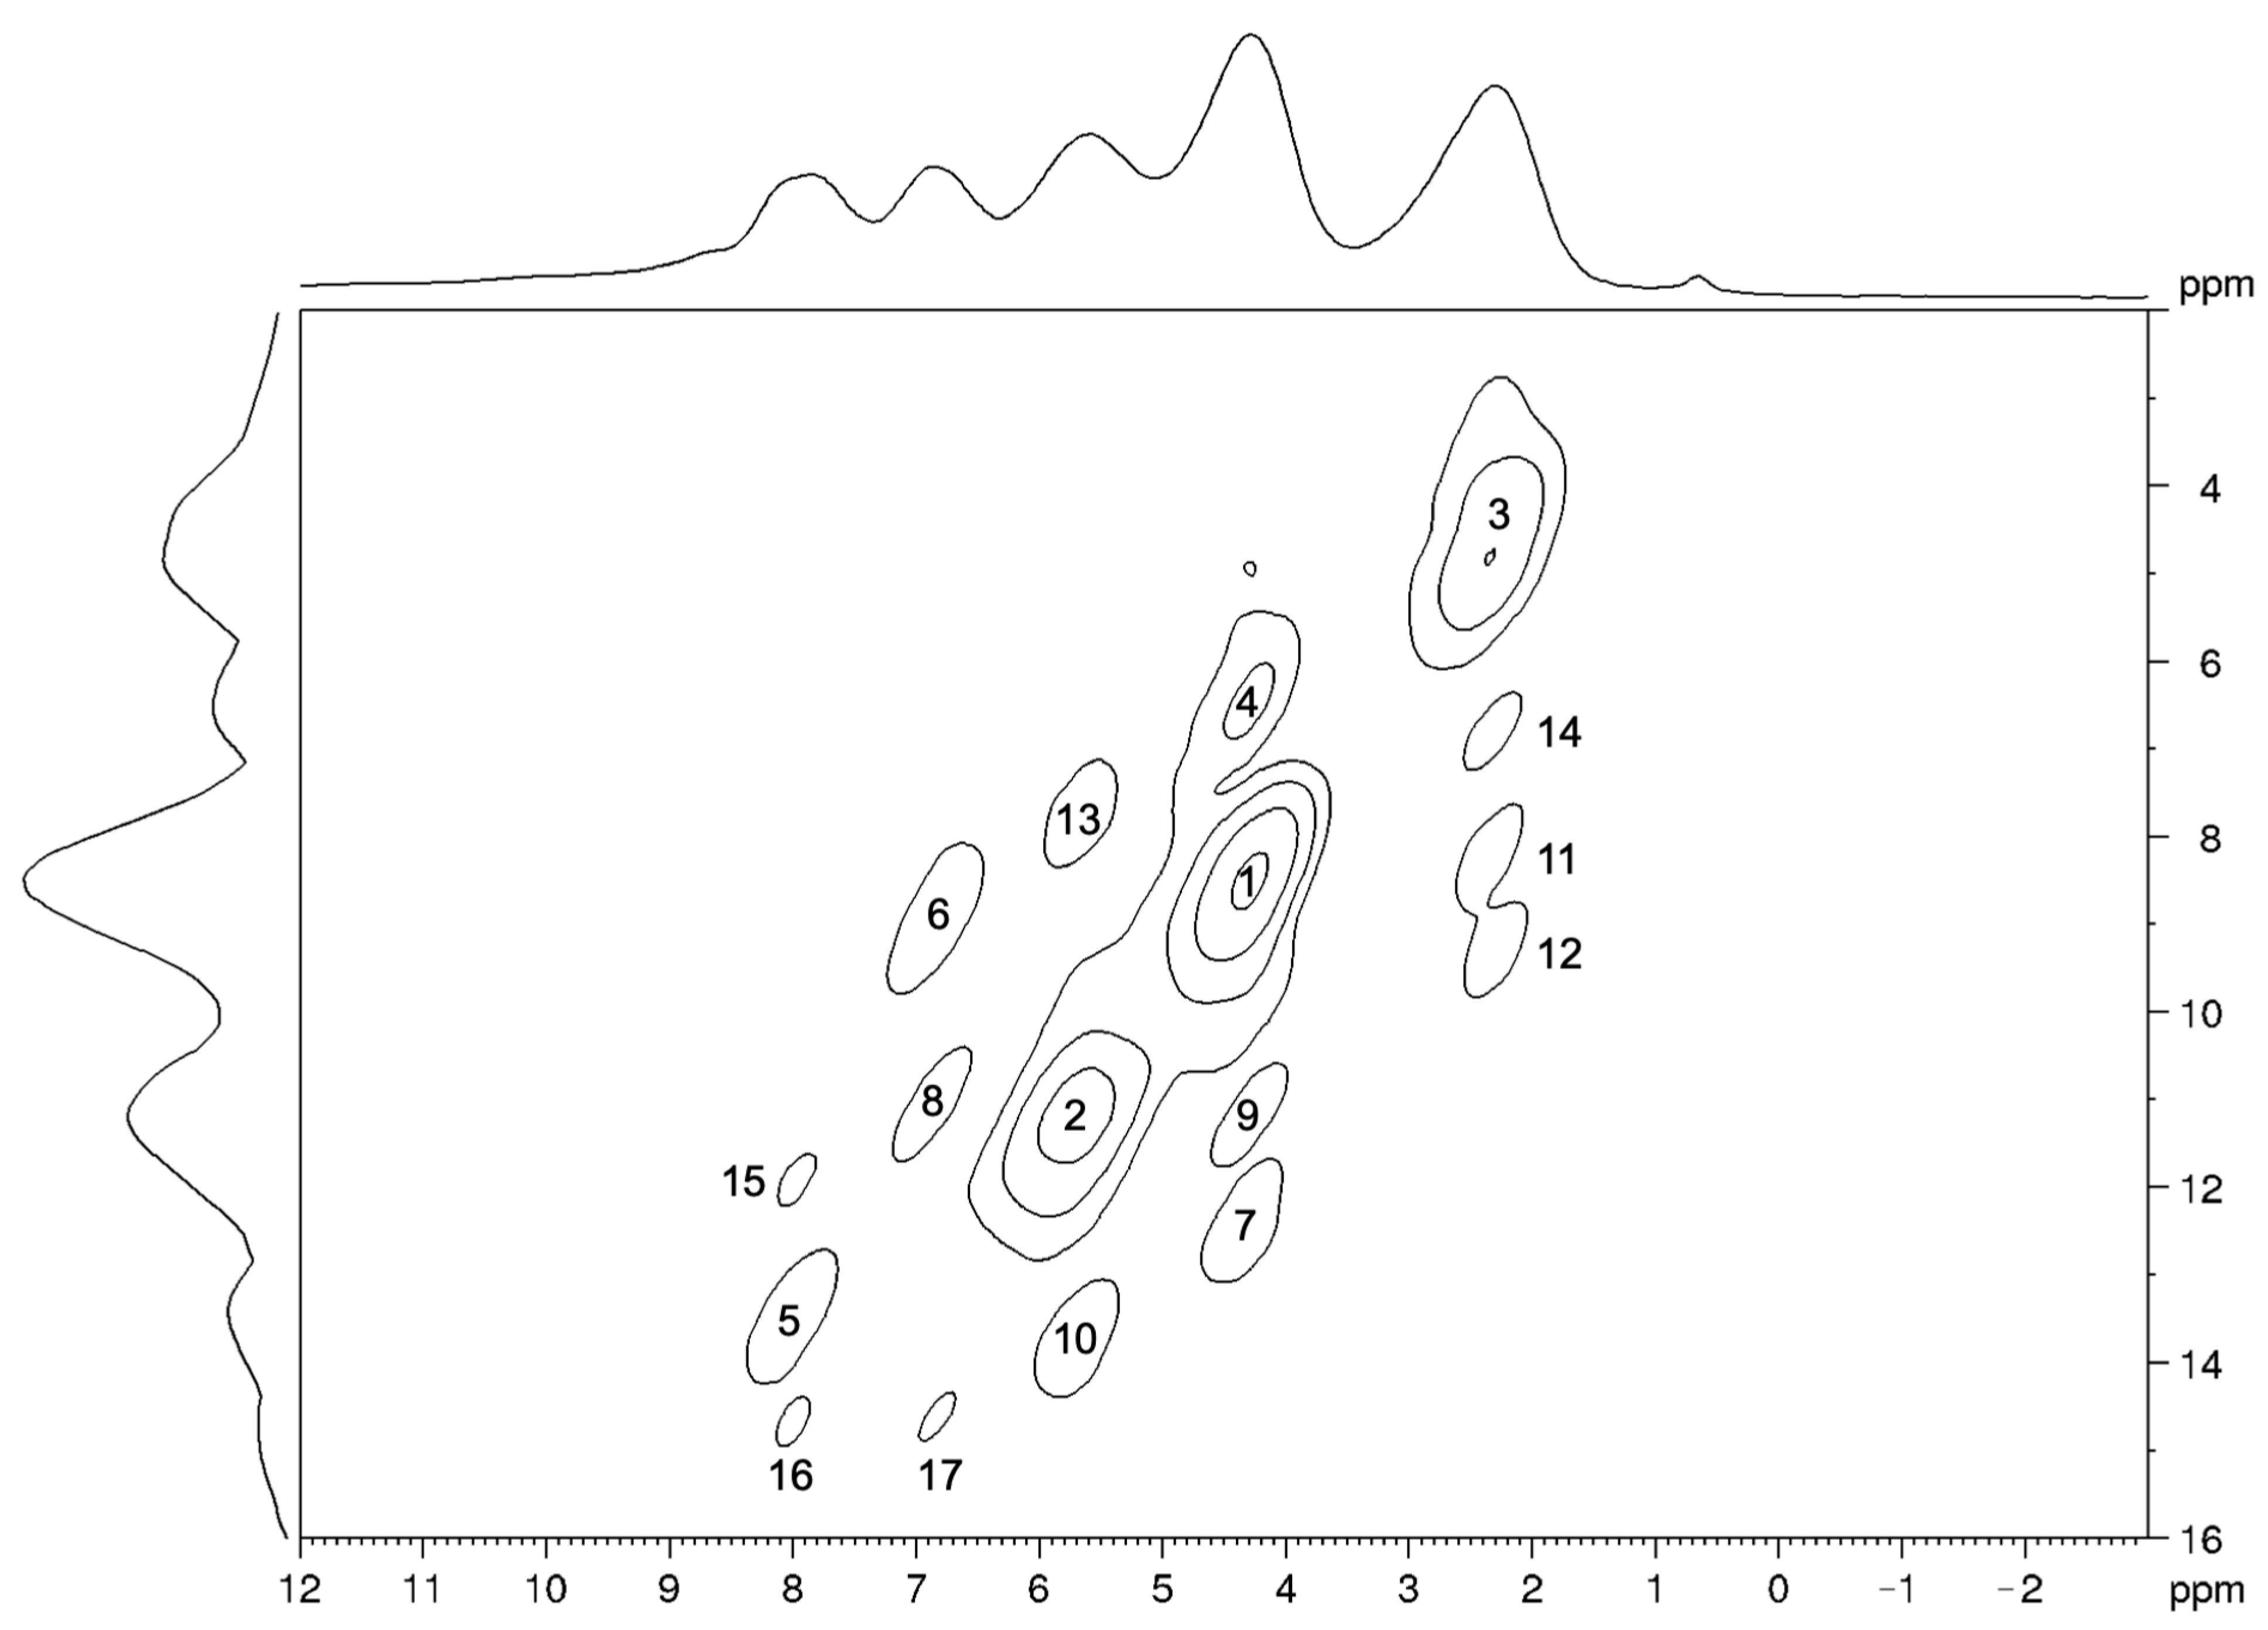
2.4. 2D SSNMR Spectra: Validation of the Optimized Structure

1H-13C HETCOR and 1H-1H DQSQ experiments are often applied to enlarge the amount of information in NMR crystallography studies [50,51,52]. Here, these experiments were performed in order to obtain a validation of the refined structure of carbimazole by a semi-quantitative comparison of the signal intensities in the spectra with the distances of the corresponding coupled nuclei measured from the optimized crystal structure.
The 1H-13C HETCOR spectrum (Figure 4) shows signals whose intensities depend on the strength of the heteronuclear dipolar interactions, and, in turn, primarily depend on the distance of the coupled nuclei (Table 3). Indeed, the most intense peaks correspond to the directly bonded pairs of 1H-13C nuclei (peaks 1, 2, 3, 4, and 5). Among these peaks, the intensity is roughly proportional to the number of hydrogen atoms directly bonded to the carbon nucleus: maximum for the signals of the methyl groups and minimum for those of the olefinic groups. Among the other peaks, the signals with larger intensities are those corresponding to the intramolecular interactions C6-H7 and C7-H6 (peaks 6 and 8, respectively) and to the intermolecular interactions C4-H7* and C7-H4* (peaks 7 and 9, respectively). The C4-H7*/C7-H4* pairs show larger signal intensities than other pairs of nuclei characterized by shorter internuclear distances, since, in the crystal structure, there are 12 H4 atoms at distances shorter than 5 Å from each C7 (and vice versa there are 12 H7 atoms at distances shorter than 5 Å from each C4, as shown in Figure 5). The remaining signals in the spectrum also show intensities compatible with the C-H distances obtained from the optimized crystal structure.
In the 1H-1H DQSQ spectrum (Figure 6), the signals corresponding to the interactions between 1H nuclei belonging to the same chemical group (peaks 1, 2, and 3) are characterized by the largest intensities, since the distances between these pairs of nuclei are smaller than any other. The difference in intensity between peaks 1 and 3, both arising from a methyl group, clearly suggests interpreting the intensity of the signals only in a semi-quantitative manner. Contrary to the HETCOR experiment, in fact, in the DQSQ spectrum, a correspondence between the trends of the minimum distances of H pairs and of the intensities of the corresponding signals in the spectrum cannot be established (Table 4). In any case, only the signals arising from 1H pairs showing a distance smaller than 2.9 Å in the optimized structure can be clearly detected in the DQSQ spectrum. Even in this case, the strongest intermolecular dipolar interactions are those between the protons belonging to the methyl groups 4 and 7 (Figure 5).
Although we could not interpret the signal intensities of the 2D spectra in a strictly quantitative way, these experiments were useful, on the one hand, to support the signal assignment of the 1H and 13C 1D high-resolution spectra, and on the other hand, to validate the crystal structure optimized by DFT. The observed deviations from the theoretical relationship between signal intensity and the inverse of the third power of the internuclear distance can have different sources. First, due to the difficulty of resolving all peak superpositions in the 2D spectra, the intensities were taken as heights of the unresolved 2D peaks. Second, the distances are calculated from an ideal “frozen” structure, so the real presence, at the experimental room temperature, of both rotational and vibrational molecular motions, certainly introduces discrepancies between actual and calculated internuclear distances. Although such discrepancies could be, in principle, strongly reduced by combining ab initio Molecular Dynamics within DFT GIPAW calculations, this is computationally very demanding and, in any case, beyond the scope of this work [53]. Third, possible artifacts can arise from the experiments, due, for instance, to RF inhomogeneity.

3. Materials and Methods

Sample. The carbimazole sample was purchased at TCI (Tokyo, Japan) (CAS RN 22232-54-8).
Differential Scanning Calorimetry (DSC). DSC was performed by heating at 10 K/min under dry nitrogen atmosphere using a Perkin Elmer (Waltham, MA, USA) DSC8500 calorimeter.
Thermo Gravimetric Analysis (TGA). TGA measurements were performed with a thermogravimetric analyzer TGA4000 (Perkin Elmer) in a temperature range 20 °C to 600 °C, with a rate of 10 °C/min under dry nitrogen atmosphere (flow rate 20 mL/min).
Powder X-ray diffraction (PXRD). The PXRD spectrum was collected on a powdered sample using a Bruker (Rheinstetten, Germany) D8 Advance diffractometer with CuKα radiation (λ = 1.54 Å) and a LynxEye detector, operating in Bragg–Brentano geometry. Scans were recorded at room temperature (300 K) in angles ranging from 6 to 60 (°2Theta), with a step size of 0.03, and continuous scan mode.
NMR Methods. Solid State NMR spectra were recorded on a Bruker Avance Neo spectrometer working at Larmor frequencies of 500.13 and 125.77 MHz for 1H and 13C nuclei, respectively, equipped with triple-resonance CP-MAS probehead accommodating rotors, with an external diameter of 2.5 mm. The 90 degree pulse duration was 2.08 and 5 μs for 1H and 13C nuclei, respectively. The 1H-13C CP-MAS spectrum was recorded at a MAS frequency of 22 kHz, using a contact time of 2 ms and accumulating 1000 scans. The 1H MAS spectrum was recorded at a MAS frequency of 22 kHz accumulating 4 scans. The 1H PMLG-MAS spectrum [54] was recorded at a MAS frequency of 15 kHz accumulating 32 scans. The 1H DUMBO-MAS spectrum [55] was recorded at a MAS frequency of 12 kHz accumulating 32 scans. The 1H-13C HETCOR spectrum with FSLG decoupling in the indirect dimension [56] was recorded at a MAS frequency of 15 kHz, using a contact time of 0.5 ms, accumulating 128 rows and 64 scans. The 1H-1H DQ-SQ spectrum [57] was recorded at a MAS frequency of 12 kHz, using the eDUMBO-122 scheme [58] for decoupling during acquisition, accumulating 256 rows and 16 scans. In all relevant experiments, a SPINAL-64 decoupling scheme [59] was applied on 1H nuclei while acquiring the 13C signal. In all cases, the measurements were carried out at room temperature (about 296 K) and a recycle delay of 10 s was used.
Computational simulations. All DFT calculations were performed by using the Quantum Espresso (QE) suite of programs [60], employing plane-augmented-wave (PAW) pseudopotentials [61], the PBE-D2 XC-functional [62,63], and plane-waves as basis sets to build Bloch states, with proper periodic boundary conditions inside the unit cell, determined by the experimental data of the JOVDIH01 structure (crystal axes measuring 7.698 Å, 6.650 Å, and 17.388 Å, within an orthorhombic cell belonging to the Pnma space group) [43]. Cut-offs on the wave function and electronic density were set to 60/600 Ry (1 Ry = 313.8 Kcal/mol) and the first Brillouin cell in the reciprocal space was sampled according to a (4 × 4 × 2) mesh of k points. Calculations were performed spin-restricted by applying a Gaussian smearing of the one-particle energy levels of 0.002 Ry. NMR chemical shifts (CS) were simulated by using the GIPAW approach [19] implemented in QE. For comparison with the experimental NMR data, the absolute isotropic shielding values (σ, ppm) obtained by DFT were transformed into isotropic chemical shifts (δ, ppm) through a linear least-squares fitting, which, for the calculations reported in Table 2, gave the results reported in Table 5.

4. Conclusions

In this work, the crystalline structure of carbimazole was deeply investigated by a combined solid state NMR-DFT approach, also exploiting previously reported XRD data. The carbimazole sample was subjected to a preliminary screening (by DSC, TGA, and PXRD), which confirmed the equivalence between its crystalline form and the form previously described in the literature and characterized by XRD [42,43]. Afterwards, isotropic 1H and 13C chemical shifts were experimentally determined by high-resolution solid state NMR techniques, offering the best accuracy, e.g., using DUMBO-MAS to obtain a well resolved 1H spectrum. The experimental isotropic chemical shifts were quantitatively compared with those calculated by DFT-GIPAW methods for different structures (those reported in the literature as barely derived from XRD data, and those obtained after DFT optimization of the positions of H atoms only, or of the whole molecule). The agreement achieved for the optimized structure was excellent, the RMSD values obtained, reflecting the state of the art in NMR crystallography (about 1% of the whole spectral range explored by each nucleus, i.e., 0.2 and 2 ppm for 1H and 13C, respectively [48]). The refined structure differs from the XRD structure almost exclusively for the position of H atoms, which could be determined very accurately. Importantly, the refined structure was further deeply validated through the analysis of two 2D-correlation experiments (1H-13C HETCOR and 1H-1H DQSQ), whose signals intensities were all found to be in excellent (although semi-quantitative) agreement with the strengths of the dipolar couplings predicted from the inter-nuclear distances of the optimized structures. Here, the relevant role of inter-molecular dipolar interactions for specific chemical groups (e.g., methyl groups 4 and 7) was clearly observed and highlighted. Deviations from a fully quantitative agreement between 2D signal intensities and calculated dipolar coupling strengths must be at least partially ascribed to vibrational and inter-conformational motions, which can be effectively investigated by solid-state NMR through the measurement of interaction anisotropies and relaxation times [64,65,66,67]. This will be the subject of a future paper.
This study clearly confirms the importance and reliability of NMR crystallography, especially in the pharmaceutical field. To the best of our knowledge, this is the first time that solid-state NMR experiments were performed on carbimazole.

Supplementary Materials

The following are available online, Figure S1: Simulated XRPD spectra of carbimazole, Table S1: RMSD of the atom positions of the optimized structure with respect to the SCXR structure.

Author Contributions

Conceptualization, E.C., G.B., A.S., and M.G.; methodology, A.S., E.C., G.B., and M.G..; software, A.S., E.C., and G.B.; validation, E.C., A.P., and F.M.; resources, M.G. and F.M.; data curation, A.S., A.P., E.C., and G.B.; writing—original draft preparation, A.S., E.C., G.B., and M.G.; writing—review and editing, A.S., A.P., and F.M.; visualization, A.S., A.P., and G.B.; supervision, E.C., F.M., and M.G.; project administration, M.G.; funding acquisition, M.G. and F.M. All authors have read and agreed to the published version of the manuscript.

Funding

This research was partially funded by the University of Pisa, grant PRA_2020_21.

Institutional Review Board Statement

Not applicable.

Informed Consent Statement

Not applicable.

Data Availability Statement

The data presented in this study are available on request from the corresponding author.

Acknowledgments

CISUP (Centre for Instrument Sharing-University of Pisa) is acknowledged for the use of the Bruker Avance Neo 500 Solid State NMR Spectrometer.

Conflicts of Interest

The authors declare no conflict of interest.

Sample Availability

Samples of the compounds are not available from the authors.

References

  1. Harris, R.K.; Wasylishen, R.E.; Duer, M.J. NMR Crystallography, 1st ed.; John Wiley and Sons, Ltd.: Chichester, UK, 2009. [Google Scholar]
  2. Bauer, J.; Spanton, S.; Henry, R.; Quick, J.; Dziki, W.; Porter, W.; Morris, J. Ritonavir: An Extraordinary Example of Conformational Polymorphism. Pharm. Res. 2001, 18, 859–866. [Google Scholar] [CrossRef]
  3. Rietveld, I.B.; Céolin, R. Rotigotine: Unexpected Polymorphism with Predictable Overall Monotropic Behavior. J. Pharm. Sci. 2015, 104, 4117–4122. [Google Scholar] [CrossRef]
  4. Diwaker; Kumar, C.S.C.; Kumar, A.; Chandraju, S.; Quah, C.K.; Fun, H.K. Synthesis, spectroscopic characterization, electronic and optical studies of (2Z)-5,6-dimethyl-2-[(4-nitrophenyl)methylidene]-2,3-dihydro-1-benzofuran-3-one. J. Comput. Sci. 2015, 10, 237–246. [Google Scholar] [CrossRef]
  5. Zanatta, G.; Da Silva, M.B.; Da Silva, J.J.A.; Dos Santos, R.C.R.; Sales, F.A.M.; Gottfried, C.; Caetano, E.W.S.; Freire, V.N. First Generation Antipsychotic Haloperidol: Optical Absorption Measurement and Structural, Electronic, and Optical Properties of its Anhydrous Monoclinic Crystal by First-Principle Approaches. New, J. Chem. 2018, 42, 13629–13640. [Google Scholar] [CrossRef]
  6. Guo, Y.; Liu, Q.; Zhao, X. Periodic density functional theory study of the high-pressure behavior of crystalline 7,2′-anhydro-β-d-arabinosylorotidine. J. Phys. Org. Chem. 2016, 30, e3590. [Google Scholar] [CrossRef]
  7. Pake, G.E. Nuclear Resonance Absorption in Hydrated Crystals: Fine Structure of the Proton Line. J. Chem. Phys. 1948, 16, 327–336. [Google Scholar] [CrossRef]
  8. Dračínský, M.; Hodgkinson, P. Solid-state NMR studies of nucleic acid components. RSC Adv. 2015, 5, 12300–12310. [Google Scholar] [CrossRef] [Green Version]
  9. Jeziorna, A.; Kazmierski, S.; Paluch, P.; Skorupska, E.; Potrzebowski, M.J. Recent Progress in the Solid-State NMR Studies of Short Peptides: Techniques, Structure and Dynamics. Annu. Rep. NMR Spectrosc. 2014, 83, 67–143. [Google Scholar]
  10. Martineau, C. NMR crystallography: Applications to inorganic materials. Solid State Nucl. Magn. Reson. 2014, 63, 1–12. [Google Scholar] [CrossRef]
  11. Ashbrook, S.E.; Dawson, D.M.; Seymour, V.R. Recent developments in solid-state NMR spectroscopy of crystalline microporous materials. Phys. Chem. Chem. Phys. 2014, 16, 8223–8242. [Google Scholar] [CrossRef] [Green Version]
  12. Chierotti, M.R.; Gobetto, R. Solid-state NMR studies of weak interactions in supramolecular systems. Chem. Commun. 2008, 1621–1634. [Google Scholar] [CrossRef]
  13. Vogt, F.G. Evolution of solid-state NMR in pharmaceutical analysis. Future Med. Chem. 2010, 2, 915–921. [Google Scholar] [CrossRef] [PubMed]
  14. Geppi, M.; Mollica, G.; Borsacchi, S.; Veracini, C.A. Solid-State NMR Studies of Pharmaceutical Systems. Appl. Spectrosc. Rev. 2008, 43, 202–302. [Google Scholar] [CrossRef]
  15. Hodgkinson, P. NMR crystallography of molecular organics. Prog. Nucl. Magn. Reson. Spectrosc. 2020, 118–119, 10–53. [Google Scholar] [CrossRef]
  16. Wolinski, K.; Hinton, J.F.; Pulay, P. Efficient Implementation of the Gauge-Independent Atomic Orbital Method for NMR Chemical Shift Calculations. J. Am. Chem. Soc. 1990, 112, 8251–8260. [Google Scholar] [CrossRef]
  17. Skachkov, D.; Krykunov, M.; Kadantsev, E.; Ziegler, T. The Calculation of NMR Chemical Shifts in Periodic Systems Based on Gauge Including Atomic Orbitals and Density Functional Theory. J. Chem. Theory Comput. 2010, 6, 1650–1659. [Google Scholar] [CrossRef] [PubMed]
  18. Mauri, F.; Pfrommer, B.G.; Louie, S.G. Ab Initio Theory of NMR Chemical Shifts in Solids and Liquids. Phys. Rev. Lett. 1996, 77, 5300–5303. [Google Scholar] [CrossRef] [Green Version]
  19. Pickard, C.J.; Mauri, F. All-electron magnetic response with pseudopotentials: NMR chemical shifts. Phys. Rev. B-Condens. Matter Mater. Phys. 2001, 63, 2451011–2451013. [Google Scholar] [CrossRef] [Green Version]
  20. Schmidt, M.; Wittmann, J.J.; Kress, R.; Schneider, D.; Steuernagel, S.; Schmidt, H.W.; Senker, J. Crystal Structure of a Highly Efficient Clarifying Agent for Isotactic Polypropylene. Cryst. Growth Des. 2012, 12, 2543–2551. [Google Scholar] [CrossRef]
  21. Bekö, S.L.; Urmann, D.; Lakatos, A.; Glaubitz, C.; Schmidt, M.U. Nimustine hydro-chloride: The first crystal structure determination of a 2-chloroethyl-N-nitrosourea hydrochloride derivative by X-ray powder diffraction and solid-state NMR. Acta Crystallogr. Sect. C Cryst. Struct. Commun. 2012, 68, 144–148. [Google Scholar] [CrossRef]
  22. Seyfarth, L.; Sehnert, J.; El-Gamel, N.E.A.; Milius, W.; Kroke, E.; Breu, J.; Senker, J. Structure elucidation of cyameluric acid by combining solid-state NMR spectroscopy, molecular modeling and direct-space methods. J. Mol. Struct. 2008, 889, 217–228. [Google Scholar] [CrossRef]
  23. Zabiński, J.; Maciejewska, D.; Kaźmierczak, P. Structural analysis of bis-amidines and bis-nitriles in solid-state by combining NMR spectroscopy and molecular modeling. J. Mol. Struct. 2009, 923, 132–140. [Google Scholar] [CrossRef]
  24. Heider, E.M.; Harper, J.K.; Grant, D.M. Structural characterization of an anhydrous polymorph of paclitaxel by solid-state NMR. Phys. Chem. Chem. Phys. 2007, 9, 6083–6097. [Google Scholar] [CrossRef]
  25. Vogt, F.G.; Clawson, J.S.; Strohmeier, M.; Edwards, A.J.; Pham, T.N.; Watson, S.A. Solid-State NMR Analysis of Organic Cocrystals and Complexes. Cryst. Growth Des. 2009, 9, 921–937. [Google Scholar] [CrossRef]
  26. Patel, J.R.; Carlton, R.A.; Needham, T.E.; Chichester, C.O.; Vogt, F.G. Preparation, structural analysis, and properties of tenoxicam cocrystals. Int. J. Pharm. 2012, 436, 685–706. [Google Scholar] [CrossRef]
  27. Venâncio, T.; Oliveira, L.M.; Ellena, J.; Boechat, N.; Brown, S.P. Probing intermolecular interactions in a diethylcarbamazine citrate salt by fast MAS 1H solid-state NMR spectroscopy and GIPAW calculations. Solid State Nucl. Magn. Reson. 2017, 87, 73–79. [Google Scholar] [CrossRef] [Green Version]
  28. Salager, E.; Day, G.M.; Stein, R.S.; Pickard, C.J.; Elena, B.; Emsley, L. Powder Crystallography by Combined Crystal Structure Prediction and High-Resolution 1H Solid-State NMR Spectroscopy. J. Am. Chem. Soc. 2010, 132, 2564–2566. [Google Scholar] [CrossRef] [PubMed]
  29. Brus, J.; Czernek, J.; Kobera, L.; Urbanova, M.; Abbrent, S.; Husak, M. Predicting the Crystal Structure of Decitabine by Powder NMR Crystallography: Influence of Long-Range Molecular Packing Symmetry on NMR Parameters. Cryst. Growth Des. 2016, 16, 7102–7111. [Google Scholar] [CrossRef]
  30. Salager, E.; Stein, R.S.; Pickard, C.J.; Elena, B.; Emsley, L. Powder NMR crystallography of thymol. Phys. Chem. Chem. Phys. 2009, 11, 2610–2621. [Google Scholar] [CrossRef]
  31. Pawlak, T.; Potrzebowski, M.J. Fine Refinement of Solid-State Molecular Structures of Leu- and Met-Enkephalins by NMR Crystallography. J. Phys. Chem. B 2014, 118, 3298–3309. [Google Scholar] [CrossRef]
  32. Widdifield, C.M.; Robson, H.; Hodgkinson, P. Furosemide’s one little hydrogen atom: NMR crystallography structure verification of powdered molecular organics. Chem. Commun. 2016, 52, 6685–6688. [Google Scholar] [CrossRef] [Green Version]
  33. Widdifield, C.M.; Farrell, J.D.; Cole, J.C.; Howard, J.A.K.; Hodgkinson, P. Resolving alternative organic crystal structures using density functional theory and NMR chemical shifts. Chem. Sci. 2020, 11, 2987–2992. [Google Scholar] [CrossRef] [Green Version]
  34. Harris, R.K.; Hodgkinson, P.; Zorin, V.; Dumez, J.N.; Elena-Herrmann, B.; Emsley, L.; Salager, E.; Stein, R.S. Computation and NMR crystallography of terbutaline sulfate. Magn. Reson. Chem. 2010, 48, S103–S112. [Google Scholar] [CrossRef] [PubMed]
  35. Harper, J.K.; Iuliucci, R.; Gruber, M.; Kalakewich, K. Refining crystal structures with experimental 13C NMR shift tensors and lattice-including electronic structure methods. CrystEngComm 2013, 15, 8693–8704. [Google Scholar] [CrossRef]
  36. Pindelska, E.; Szeleszczuk, L.; Pisklak, D.M.; Majka, Z.; Kolodziejski, W. Crystal Structures of Tiotropium Bromide and Its Monohydrate in View of Combined Solid-state Nuclear Magnetic Resonance and Gauge-Including Projector-Augmented Wave Studies. J. Pharm. Sci. 2015, 104, 2285–2292. [Google Scholar] [CrossRef]
  37. Czernek, J.; Pawlak, T.; Potrzebowski, M.J.; Brus, J. The comparison of approaches to the solid-state NMR-based structural refinement of vitamin B1 hydrochloride and of its monohydrate. Chem. Phys. Lett. 2013, 555, 135–140. [Google Scholar] [CrossRef]
  38. Bennett, P.N.; Brown, M.J.; Sharma, P. Clinical Pharmacology, 11th ed.; Churchill Livingstone: London, UK, 2012; ISBN 9780702040849. [Google Scholar]
  39. Martini, L. Encyclopedia of Endocrine Diseases, 1st ed.; Academic Press: Cambridge, MA, USA, 2004. [Google Scholar]
  40. Burch, H.B.; Cooper, D.S. Anniversary review: Antithyroid drug therapy: 70 years later. Eur. J. Endocrinol. 2018, 179, R261–R274. [Google Scholar] [CrossRef] [Green Version]
  41. Cooper, D.S. Antithyroid Drugs. N. Engl. J. Med. 2005, 352, 905–917. [Google Scholar] [CrossRef] [PubMed]
  42. Delage, C.; Faure, F.; Leger, J.M.; Raby, C.; Goursolle, M. Conformational study of 3-methyl 2-thio imidazoline ethyl 1-carboxylate. C. R. Acad. Sci. Paris 1990, 311, 781–784. [Google Scholar]
  43. Das, D.; Roy, G.; Mugesh, G. Antithyroid Drug Carbimazole and Its Analogues: Synthesis and Inhibition of Peroxidase-Catalyzed Iodination of L-Tyrosine. J. Med. Chem. 2008, 51, 7313–7317. [Google Scholar] [CrossRef] [PubMed]
  44. Wishart, D.S.; Feunang, Y.D.; Guo, A.C.; Lo, E.J.; Marcu, A.; Grant, J.R.; Sajed, T.; Johnson, D.; Li, C.; Sayeeda, Z.; et al. DrugBank 5.0: A major update to the DrugBank database for 2018. Nucleic Acids Res. 2018, 46, D1074–D1082. [Google Scholar] [CrossRef] [PubMed]
  45. Al-Badr, A.A. Carbon-13 Nuclear Magnetic Resonance Spectroscopy of Some Biologically Active Imidazoles. Spectrosc. Lett. 1983, 16, 613–619. [Google Scholar] [CrossRef]
  46. Sharma, M.; Koty, A.; Al-Rajab, A.J. A simple and effective method for determination of the antithyroid drug carbimazole using ruthenium trichloride. Turk. J. Chem. 2017, 41, 995–1012. [Google Scholar] [CrossRef]
  47. Bonhomme, C.; Gervais, C.; Babonneau, F.; Coelho, C.; Pourpoint, F.; Azaïs, T.; Ashbrook, S.E.; Griffin, J.M.; Yates, J.R.; Mauri, F.; et al. First-Principles Calculation of NMR Parameters Using the Gauge Including Projector Augmented Wave Method: A Chemists Point of View. Chem. Rev. 2012, 112, 5733–5779. [Google Scholar] [CrossRef]
  48. Corlett, E.K.; Blade, H.; Hughes, L.P.; Sidebottom, P.J.; Walker, D.; Walton, R.I.; Brown, S.P. Investigating discrepancies between experimental solid-state NMR and GIPAW calculation: N=C–N 13C and OH⋯O 1H chemical shifts in pyridinium fumarates and their cocrystals. Solid State Nucl. Magn. Reson. 2020, 108, 101662. [Google Scholar] [CrossRef]
  49. Iron, M.A. Evaluation of the Factors Impacting the Accuracy of 13C NMR Chemical Shift Predictions using Density Functional Theory-The Advantage of Long-Range Corrected Functionals. J. Chem. Theory Comput. 2017, 13, 5798–5819. [Google Scholar] [CrossRef]
  50. Brown, S.P. Applications of high-resolution 1H solid-state NMR. Solid State Nucl. Magn. Reson. 2012, 41, 1–27. [Google Scholar] [CrossRef] [PubMed]
  51. Carignani, E.; Borsacchi, S.; Bradley, J.P.; Brown, S.P.; Geppi, M. Strong Intermolecular Ring Current Influence on 1H Chemical Shifts in Two Crystalline Forms of Naproxen: A Combined Solid-State NMR and DFT Study. J. Phys. Chem. C 2013, 117, 17731–17740. [Google Scholar] [CrossRef]
  52. Paluch, P.; Pawlak, T.; Oszajca, M.; Lasocha, W.; Potrzebowski, M.J. Fine refinement of solid state structure of racemic form of phospho-tyrosine employing NMR Crystallography approach. Solid State Nucl. Magn. Reson. 2015, 65, 2–11. [Google Scholar] [CrossRef] [PubMed]
  53. Dračinský, M.; Bouř, P.; Hodgkinson, P. Temperature Dependence of NMR Parameters Calculated from Path Integral Molecular Dynamics Simulations. J. Chem. Theory Comput. 2016, 12, 968–973. [Google Scholar] [CrossRef] [Green Version]
  54. Vinogradov, E.; Madhu, P.K.; Vega, S. High-resolution proton solid-state NMR spectroscopy by phase-modulated Lee-Goldburg experiment. Chem. Phys. Lett. 1999, 314, 443–450. [Google Scholar] [CrossRef]
  55. Elena, B.; de Paëpe, G.; Emsley, L. Direct spectral optimisation of proton-proton homonuclear dipolar decoupling in solid-state NMR. Chem. Phys. Lett. 2004, 398, 532–538. [Google Scholar] [CrossRef]
  56. Van Rossum, B.J.; Forster, H.; De Groot, H.J.M. High-Field and High-Speed CP-MAS 13C NMR Heteronuclear Dipolar-Correlation Spectroscopy of Solids with Frequency-Switched Lee–Goldburg Homonuclear Decoupling. J. Magn. Reson. 1997, 124, 516–519. [Google Scholar] [CrossRef]
  57. Brown, S.P.; Lesage, A.; Elena, B.; Emsley, L. Probing Proton-Proton Proximities in the Solid State: High-Resolution Two-Dimensional 1H-1H Double-Quantum CRAMPS NMR Spectroscopy. J. Am. Chem. Soc. 2004, 126, 13230–13231. [Google Scholar] [CrossRef]
  58. Salager, E.; Dumez, J.N.; Stein, R.S.; Steuernagel, S.; Lesage, A.; Elena-Herrmann, B.; Emsley, L. Homonuclear dipolar decoupling with very large scaling factors for high-resolution ultrafast magic angle spinning 1H solid-state NMR spectroscopy. Chem. Phys. Lett. 2010, 498, 214–220. [Google Scholar] [CrossRef]
  59. Fung, B.M.; Khitrin, A.K.; Ermolaev, K. An Improved Broadband Decoupling Sequence for Liquid Crystals and Solids. J. Magn. Reson. 2000, 142, 97–101. [Google Scholar] [CrossRef] [PubMed]
  60. Giannozzi, P.; Baroni, S.; Bonini, N.; Calandra, M.; Car, R.; Cavazzoni, C.; Ceresoli, D.; Chiarotti, G.L.; Cococcioni, M.; Dabo, I.; et al. QUANTUM ESPRESSO: A modular and open-source software project for quantum simulations of materials. J. Phys. Condens. Matter 2009, 21, 395502. [Google Scholar] [CrossRef]
  61. Blöchl, P.E. Projector augmented-wave method. Phys. Rev. B 1994, 50, 17953–17979. [Google Scholar] [CrossRef] [Green Version]
  62. Perdew, J.P.; Burke, K.; Ernzerhof, M. Generalized Gradient Approximation Made Simple. Phys. Rev. Lett. 1996, 77, 3865–3868. [Google Scholar] [CrossRef] [Green Version]
  63. Grimme, S. Semiempirical GGA-Type Density Functional Constructed with a Long-Range Dispersion Correction. J. Comput. Chem. 2006, 27, 1787–1799. [Google Scholar] [CrossRef] [PubMed]
  64. Carignani, E.; Borsacchi, S.; Geppi, M. Detailed Characterization of the Dynamics of Ibuprofen in the Solid State by a Multi-Technique NMR Approach. ChemPhysChem 2011, 12, 974–981. [Google Scholar] [CrossRef] [PubMed]
  65. Carignani, E.; Borsacchi, S.; Geppi, M. Dynamics by Solid-State NMR: Detailed Study of Ibuprofen Na Salt and Comparison with Ibuprofen. J. Phys. Chem. A 2011, 115, 8783–8790. [Google Scholar] [CrossRef] [PubMed]
  66. Carignani, E.; Borsacchi, S.; Marini, A.; Mennucci, B.; Geppi, M. 13C Chemical Shielding Tensors: A Combined Solid-State NMR and DFT Study of the Role of Small-Amplitude Motions. J. Phys. Chem. C 2011, 115, 25023–25029. [Google Scholar] [CrossRef]
  67. Carignani, E.; Borsacchi, S.; Concistrè, M.; Johannessen, O.G.; Geppi, M. Direct observation of the effects of small-amplitude motions on 13C nuclear shielding tensors by means of low-temperature 2D MAS NMR spectroscopy. Chem. Phys. Lett. 2018, 706, 107–112. [Google Scholar] [CrossRef]
Figure 1. DSC thermogram (a), TGA (b), and experimental and simulated PXRD spectra (c) of carbimazole.
Molecules 26 04577 g001
Figure 2. 13C CP-MAS NMR spectrum of carbimazole (νMAS = 22 kHz). The assignment of the peaks is reported on the spectrum and refers to the labeling of the atoms as indicated in the chemical structure.
Molecules 26 04577 g002
Figure 3. 1H NMR spectra of carbimazole: (a) MAS (νMAS = 22 kHz), (b) PMLG-MAS (νMAS = 15 kHz), and (c) DUMBO-MAS (νMAS = 12 kHz). The assignment of the peaks is reported on the spectra and refers to the labeling of the atoms indicated in the chemical structure.
Molecules 26 04577 g003
Figure 4. 1H-13C MAS NMR HETCOR spectrum of carbimazole recorded at a spinning frequency of 15 kHz. The signals are numbered in order of decreasing intensity.
Molecules 26 04577 g004
Figure 5. Two different views (a,b) of the 3D refined structure of carbimazole: a central molecule is highlighted (balls and sticks), together with the methyl groups of surrounding molecules, and C7-H4 and C4-H7 intermolecular distances are indicated (green dotted lines).
Molecules 26 04577 g005
Figure 6. 1H-1H MAS NMR DQSQ spectrum of carbimazole (νMAS = 12 kHz). The signals are numbered in order of decreasing intensity. The base contour level corresponds to 16% of the maximum spectral intensity; the multiplying factor for level increment is 1.8.
Molecules 26 04577 g006
Table 1. Comparison of the two crystal structures of carbimazole JOVDIH [42] and JOVDIH01 [43] reported in the literature.
JOVDIHJOVDIH01
Space GroupP n a 21P n m a
Unit Cella = 7.689(2)Å
b = 17.364(4)Å
c = 6.637(1)Å
α = 90°
β = 90°
γ = 90°
a = 7.698(3)Å
b = 6.650(3)Å
c = 17.388(7)Å
α = 90°
β = 90°
γ = 90°
Z
Z′
4
1
4
1
R factor0.06-
RadiationCuKα
λ ¯ = 1.541   78 Å
-
TemperatureRoom Temperature-
Table 2. Experimental and calculated isotropic chemical shifts (δ) of 1H and 13C nuclei and the corresponding assignment. Three different calculated values are reported, obtained from: (i) X-ray structure [42,43], (ii) structure obtained optimizing the positions of H atoms only, and (iii) structure obtained optimizing the positions of all atoms. Differences between calculated and experimental δ values are reported in parentheses soon after the calculated values. Root mean square deviations (RMSD) between experimental and calculated values are reported for the three levels of calculations.
AssignmentExperimental
Chemical Shift
δ (ppm)
δ at the DFT Level
X-ray Structure (ppm)
JOVDIH01
δ at the DFT Level
X-ray Structure (ppm)
JOVDIH
δ at the DFT Level Only H Optimized (ppm)
JOVDIH01
δ at the DFT Level Only H Optimized (ppm)
JOVDIH
δ at the DFT Level
All Atoms Optimized (ppm) JOVDIH01
δ at the DFT Level
All Atoms Optimized (ppm) JOVDIH
H72.312.28 (−0.03)1.96 (−0.35)2.36 (+0.05)2.33 (+0.02)2.46 (+0.15)2.44 (+0.13)
H44.284.20 (−0.08)4.68 (+0.40)4.30 (+0.02)4.26 (−0.02)4.16 (−0.12)4.19 (−0.09)
H65.595.77 (+0.18)5.85 (+0.26)5.45 (−0.14)5.56 (−0.03)5.44 (−0.15)5.42 (−0.17)
H26.857.17 (+0.32)6.78 (−0.07)6.84 (−0.01)6.87 (+0.02)6.80 (−0.05)6.79 (−0.06)
H37.857.58 (−0.27)7.61 (−0.24)7.92 (+0.07)7.86 (+0.01)8.02 (+0.17)8.03 (+0.18)
RMSD-0.190.290.070.020.130.13
C716.010.9 (−5.1)11.2 (−4.8)13.6 (−2.4)13.2 (−2.8)14.1 (−1.9)14.1 (−1.9)
C435.636.5 (+0.9)37.3 (+1.7)35.7 (+0.1)35.8 (+0.2)34.9 (−0.7)35.1 (−0.5)
C666.868.6 (+1.8)70.6 (+3.8)68.8 (+2.0)71.1 (+4.3)69.2 (+2.4)68.9 (+2.1)
C2111.0116.5 (+5.5)110.7 (−0.3)111.6 (+0.6)108.4 (−2.6)110.7 (−0.3)110.8 (−0.2)
C3119.8123.7 (+3.9)123.0 (+3.2)121.9 (+2.1)122.1 (+2.3)122.1 (+2.3)122.2 (+2.4)
C5148.7147.8 (−0.9)148.3 (−0.4)149.1 (+0.4)148.6 (−0.1)151.1 (+2.4)151.1 (+2.4)
C1166.0159.8 (−6.2)162.7 (−3.3)163.0 (−3.0)164.5 (−1.5)161.7 (−4.3)161.6 (−4.4)
RMSD-4.03.01.82.42.42.4
Table 3. Signals in the 1H-13C HETCOR spectrum, numbered in order of decreasing intensity. For each signal, the nuclei involved in the interaction, the normalized intensity, and the minimum distance between the nuclei calculated from the optimized crystal structure are reported. Asterisks in the coupled nuclei column denote intermolecular interactions.
Peak No.Coupled NucleiIntensityDistance (Å)
1C7-H71.001.1
2C4-H40.991.1
3C6-H60.411.1
4C2-H20.301.1
5C3-H30.291.1
6C6-H70.202.1
7C4-H7 *0.193.4
8C7-H60.192.2
9C7-H4 *0.123.2
10C4-H30.122.8
11C3-H40.082.6
12C2-H7 *0.073.6
13C3-H6 *0.073.3
14C2-H4 *0.063.4
15C3-H7 *0.054.6
* Intermolecular interactions.
Table 4. Signals of the 1H-1H DQSQ spectrum, numbered and reported in order of decreasing intensity. For each signal, the pair of protons involved in the interaction, the normalized intensity, and the minimum distance between the nuclei calculated from the optimized crystal structure are reported.
Peak No.Coupled NucleiIntensityDistance (Å)
1H4-H41.001.8
2H6-H60.631.8
3H7-H70.501.8
4H4-H7 *0.332.5
5H3-H6 *0.282.5
6H2-H7 *0.272.5
7H4-H30.232.4
8H2-H4 *0.222.8
9H4-H2 *0.212.8
10H6-H3 *0.202.5
11H7-H60.202.5
12H7-H2 *0.202.5
13H6-H70.192.5
14H7-H4 *0.192.5
15H3-H40.172.4
16H3-H20.172.8
17H2-H30.172.8
* Intermolecular interactions.
Table 5. Relationships between 13C and 1H absolute isotropic shielding values (σ, ppm) calculated by DFT and corresponding isotropic chemical shifts (δ, ppm), as obtained through a linear least-squares fitting to the experimental δ values.
13CR2 1HR2
X-ray structure JOVDIH01δ = −1.2011 σ + 202.540.994δ = −1.3808 σ + 37.0250.990
X-ray structure JOVDIHδ = −1.0713 σ + 180.070.997δ = −1.0600 σ + 32.1280.979
only H optimized JOVDIH01δ = −0.9883 σ + 172.460.999δ = −0.9975 σ + 31.2890.999
only H optimized JOVDIHδ = −1.0020 σ + 170.70.998δ = −1.0114 σ + 31.2991.000
all atoms optimized JOVDIH01δ = −1.0259 σ + 172.130.998δ = −1.0596 σ + 31.3020.995
all atoms optimized JOVDIHδ = −1.0253 σ + 172.220.998δ = −1.0628 σ + 31.4810.995
Publisher’s Note: MDPI stays neutral with regard to jurisdictional claims in published maps and institutional affiliations.

