Abstract
The active ingredients allicin and curcumin have a wide range of actions against fungi, bacteria, and helminths. Therefore, the study was aimed to evaluate the efficacy of allicin (AL) and curcumin (CU) as antischistosomal drugs and their biochemical effects in normal and Schistosoma mansoni-infected mice. Praziquantel (PZQ) was administrated for two successive days while AL or CU was given for two weeks from the week 7th postinfection (PI). The possible effect of different regimens on Schistosoma worms was evaluated by measuring the percentage of the recovered worms, tissue egg load, and oogram pattern. Serum alanine transaminase activity and levels of triglycerides, cholesterol, and uric acid were measured. Liver tissue malondialdehyde and reduced glutathione levels besides, the activities of glutathione-S-transferase, superoxide dismutase and catalase were assessed for the oxidative/antioxidant condition. DNA electrophoresis of liver tissue was used to indicate the degree of fragmentation. There was a significant reduction in the recovered worms and egg load, with a marked change of oogram pattern in all treated groups with PZQ, AL, and CU in comparison with infected-untreated mice. PZQ, AL, and CU prevented most of the hematological and biochemical disorders, as well as significantly improved the antioxidant capacity and enhanced DNA fragmentation in the liver tissue of schistosomiasis mice compared to the infected-untreated group. These promising results suggest that AL and CU are efficient as antischistosomal drugs, and it would be beneficial to test their combination to understand the mechanism of action and the proper period of treatment leading to the best result.
1. Introduction
Multiple Schistosoma species are parasitic to humans; S. mansoni and Schistosoma haematobium are mainly endemic to both Africa and the Middle East, which represents around 85% of the reported world cases [1]. Schistosomiasis pathogenicity can cause acute and chronic clinical syndromes [2].
Schistosomiasis caused changes in different hematological parameters [3,4]. In addition to anemia, a marked increase in monocytes, lymphocytes, and neutrophils and mild eosinophilia were recorded in Schistosomiasis [5]. Moreover, S. mansoni caused an elevation in the serum lipid profile and liver functions [6,7].
The eggs are first deposited by adult female S. mansoni in the infected host’s vasculature; then, it begins to induce a granulomatous inflammatory reaction [8]. Thus, it consequently results in pathological disorders in these tissues. S. mansoni caused an elevation in the levels of lipid peroxide, which reflects the increase in oxidative stress [9]. In contrast with lipid peroxide levels, authors reported that infected animals with S. mansoni showed a marked diminishment in different antioxidant parameters (such as catalase, reduced glutathione, and superoxide dismutase) [10,11].
Madbouly et al. [12] identified schistosomes to be genotoxic (i.e., having the capability to disrupt the genetic constitution of their hosts). The high damage observed in the schistosome-infected liver DNA is hypothesized to be caused by free radicals produced during the inflammatory response triggered by schistosomal eggs [12].
Authors recorded that the efficacy of praziquantel (PZQ) (the drug of choice) had been reduced as antischistosomal [13,14]. Scientists are still searching for antiparasitic drugs from natural origin for the development of new medications [15,16].
Allicin (AL) (the main active ingredient of Allium sativum) is considered to be the most critical alkaloid that is generally presumed to be responsible for their useful characteristics [17]. Most of the studies dealt with garlic itself or its aqueous or oil extracts as a medication of Schistosomiasis mansoni [18,19], and they were efficient in the elimination of worms and enhancement of blood indices and biochemical parameters. Serially, AL significantly caused a reduction in the worm burden, serum concentrations of liver fibrosis markers, and proinflammatory cytokines [20].
Curcumin (CU), the active ingredient of Curcuma longa is a naturally basic phenolic compound produced as a yellow pigment from turmeric, which is generally used as a spice and food colorant [21]. Recently, it was reported that C. longa extract had an antischistosomal effect, which was proven by histological, physiological and molecular studies [22].
Consequently, the present work was intended to evaluate the antischistosomal activity of the active ingredients of two essential traditional plants in infected mice and compare the findings with PZQ efficacy. Parasitological, biochemical and molecular parameters were used to qualify the efficiency of Al and CU, as well as grasp the link between these different parameters.
2. Results
Table 1 shows the averages and reduction rates of S. mansoni male and female couples and total worms recovered from all infected groups. Only a couple of worms isolated from the AL-treated group had no significant difference as compared with those of infected-untreated mice. Reduction rates of total worms recovered from PZQ, AL, and CU, were 86.0%, 73.4%, and 86.0%, respectively.

Table 1.
Worm load and reduction rate of S. mansoni infected mice after different treatment regimens (8 weeks pi).
A significant reduction was recorded in the number of eggs/g liver of all three groups (3319 ± 320.4, 3813.3 ± 494.4, 1937.6 ± 543.4 for PZQ, AL, and CU-treated mice, respectively), as compared with an infected-untreated group (6513.4 ± 1127.6) (Table 2). A significant reduction was recorded in the number of eggs/g intestine of PZQ and CU treated-groups only when compared with infected untreated mice (Table 2).
Table 2.
Egg load per gram of liver and intestine of S. mansoni infected mice and reduction rate after different treatment regimens (8 weeks pi).
The three treatment regimens significantly changed the oogram patterns when compared with the infected-untreated group in both the liver and intestine (Table 3). Regarding the oogram pattern in the liver, the highest percentage of dead eggs was recorded for CU-treated mice (43%; p < 0.002), as compared to infected-untreated animals (1.60%). In the case of the intestine, the highest percentage of dead eggs was recorded for the PZQ-treated group (41.67%; p < 0.001) in comparison with infected-untreated mice (0.8%).
Table 3.
Oogram pattern showing the percentage of S. mansoni ova at different stages of maturity in the liver and the intestine of infected mice after different treatment regimens (8 weeks pi).
Table 4 shows the changes in the averages of erythrocytes and blood indices of mice. In uninfected animals, there were not any significant changes in the average of the number of RBCs in mice treated with PZQ, AL, or CU as compared to their control groups, while there was a significant diminishment in the HGB average in the group treated with PZQ or AL in comparison with saline-treated mice.
Table 4.
Changes in erythrocytes and blood indices of mice after 2 weeks of the treatment.
The study revealed that S. mansoni caused a significant reduction in the averages of RBCs number and HGB (4.4 ± 0.2 and 8.2 ± 0.4), respectively, in infected untreated mice when compared with the control saline group. The animals treated with PZQ, AL, or CU showed a significant increase in the HGB average when compared to the infected-untreated group. Other blood indices average HCT, MCV, MCH, MCHC, RDW-SD, and RDW-SD were in turn influenced by RBCs and HGB (Table 4).
Table 5 shows changes in the averages of leucocytes of different groups. In uninfected groups, WBCs averages in mice treated with PZQ were significantly reduced to 3.40 ± 0.23 and were 5.67 ± 0.15 for the AL-group in comparison with saline treated-mice (4.30 ± 0.12). However, there was not any significant change in the WBCs of the CU group as compared with the PB-group. Concerning the infected groups, there was a considerable increase in the averages of WBCs by 5.76-fold when compared with the saline group. The average of the WBCs in the groups treated with PZQ, AL, or CU diminished by 32.8%, 58.26%, and 53.25%, respectively. The averages of LYM, MID, and GRAN in all groups are shown in Table 5.
Table 5.
Changes in leucocytes of mice after 2 weeks of the treatment.
The changes in the averages of platelets and their indices of mice were presented in Table 6. In uninfected groups, the only significant difference was recorded for P-LCR in the CU-treated group as compared with PB mice. In the infected untreated group, significant differences were recorded for MPV and PCT when compared with the saline group. There was a significant increase in MPV and PCT averages in all treated groups as compared with infected untreated animals. PZQ-treated mice showed a remarkable change in PDW. In AL and CU animals, the averages of P-LCR were significantly increased by 2.8- and 1.1-fold, respectively, in comparison with the infected-untreated group.
Table 6.
Changes in platelets and their indices of mice after two weeks of the treatment.
The averages of serum TC and TG levels, as well as the ALT activity of different groups, were shown in Figure 1A,B, respectively. In uninfected mice, the AL-treated group showed a significant reduction in the average of TC level as compared with saline-treated mice. TC level and ALT activity averages in mice treated with CU were significantly decreased by 15.1% and 17.8% when compared with the PB-group, respectively. In infected untreated mice, there was a significant increase in the averages TC and TG levels (as well as ALT activity) as compared with the regular saline group. All infected treated groups showed significant diminishment in the average levels of TC, TG, and the activity of ALT when compared with infected untreated ones.
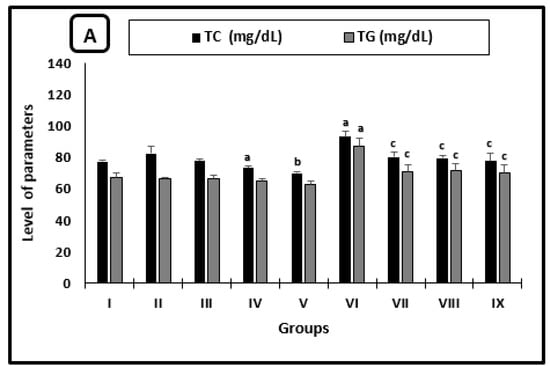
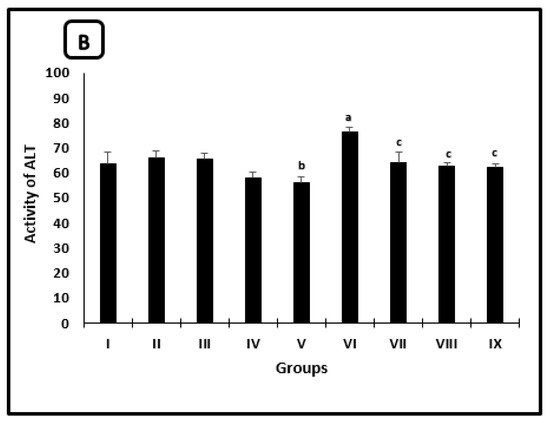
Figure 1.
Serum parameters changes in the mice after 2 weeks of treatment. (A) Cholesterol and triglycerides levels, (B) ALT activity. a significant difference from the saline group, b significant difference from the phosphate buffer group, c significant difference from the infected-untreated group. Groups I, II, III, IV, and VI presented saline, PB, PZQ, AL and CU uninfected treated-mice, groups VI, VII, VIII and IX presented infected-untreated, PZQ, AL and CU treated mice.
AL caused significant diminish in UA levels in uninfected and infected mice by 22.9% and 27.3% (Figure 2) when compared with saline and infected untreated mice, respectively. However, there was a different significant change in PZQ uninfected and infected treated mice by 1.3- and 2.4-fold, respectively.
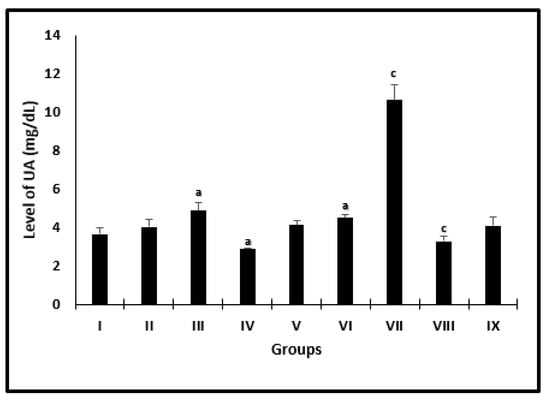
Figure 2.
Serum uric acid level changes in mice after 2 weeks of treatment. a significant difference from the saline group, b significant difference from the phosphate buffer group, c significant difference from the infected untreated group. Groups I, II, III, IV, and VI presented saline, PB, PZQ, AL and CU uninfected treated-mice, and groups VI, VII, VIII, and IX presented infected-untreated, PZQ, AL, and CU treated-mice.
The changes in the averages of MDA levels of mice in different groups were presented in Figure 3. Uninfected groups treated with AL or CU had a significant diminishment in the levels of MDA when compared with their controls. Infected groups treated with PZQ or AL or CU showed a marked decrease in the averages to be 104.0 ± 2.6, 99.7 ± 6.7 and 95.2 ± 6.2, respectively, as compared with infected untreated mice (147.1 ± 6.3).
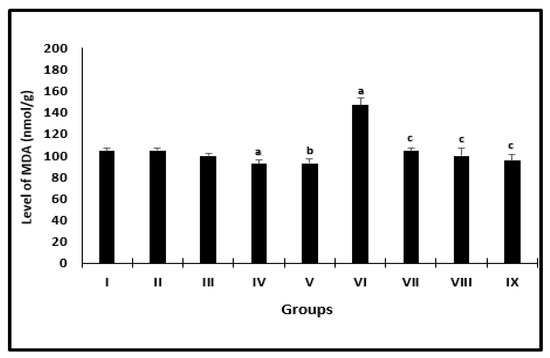
Figure 3.
Liver MDA level of mice after 2 weeks of treatment. a significant difference from the saline group, b significant difference from the phosphate buffer group, c significant difference from the infected-untreated group. Groups I, II, III, IV, and VI presented saline, PB, PZQ, AL, and CU uninfected treated mice, groups VI, VII, VIII, and IX presented infected-untreated, PZQ, AL, and CU presented treated mice.
Figure 4 shows the changes in the averages of the antioxidant parameters of mice. In uninfected animals, there was a significant increase in GST activity for the AL-group when compared with saline-treated mice and for mice treated with CU as compared with the PB-group (Figure 4A). Regarding the infected treated groups with PZQ, AL, or CU, there was a significant increase in the averages of all measured antioxidant parameters (GSH, GST, SOD, and CAT) when compared with those of infected-untreated mice (Figure 4A,B). The averages of GSH, GST, SOD, and CAT recorded the highest significant increase in CU-treated animals when compared with infected untreated groups.
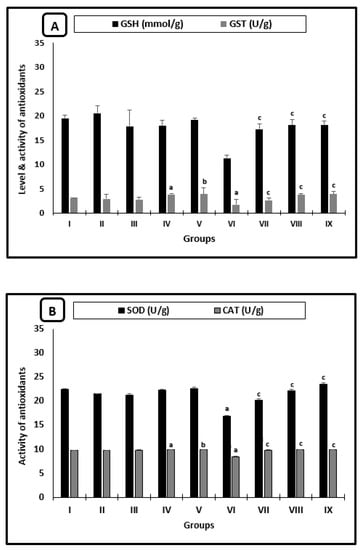
Figure 4.
Liver antioxidant changes of mice after 2 weeks of treatment. (A) GSH levels and GST activity. (B) SOD and CAT activities. a significant difference from the saline group, b significant difference from the phosphate buffer group, c significant difference from the infected-untreated group. Groups I, II, III, IV, and VI presented saline, PB, PZQ, AL, and CU uninfected treated mice, groups VI, VII, VIII, and IX presented infected-untreated mice, and PZQ, AL, and CU presented treated mice.
Results obtained through the gel electrophoresis of liver tissues are shown in Figure 5. No specific fragmentation was observed in the liver tissues of the saline control group (Lane 1). On the contrary, there was a marked laddering fragmentation in the infected-untreated groups (Lane 2). There was a restoration of DNA pattern isolated from liver tissues on infected groups treated with the three different materials (PZQ, AL, and CU), as shown in Lanes 3, 4 and 5, respectively.
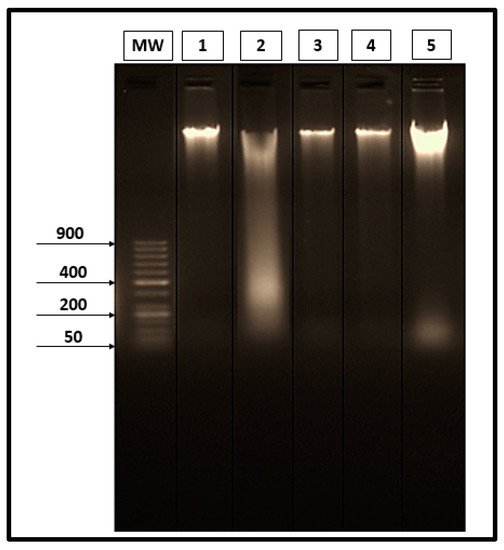
Figure 5.
Electrophoretic separated genomic DNA from liver tissues. (Lane MW) 50 bp DNA ladder marker. (Lane 1) DNA extracted from the liver of the saline group. (Lane 2) DNA extracted from the liver of the infected-untreated group. (Lane 3) DNA extracted from the liver of the infected group treated with PZQ. (Lane 4) DNA extracted from the liver of the infected group treated with AL. (Lane 5) DNA extracted from the liver of the infected group treated with CU.
3. Discussion
The present work is one of the few studies dealing with the efficacy of the active ingredients AL and CU compared with PZQ in the treatment of schistosomiasis using different aspects (parasitological, biochemical, and DNA fragmentation).
The reduction rates of the worms were convergent in the PZQ and CU groups (86.02% and 86%, respectively). On the contrary, with the present result, C. longa extract alone showed a low reduction rate of the worms that didn’t exceed 35% [22]. This observation may improve the outbalance efficacy of the active ingredient of C. longa more than that of the plant itself.
The highest reduction rate of egg load in liver tissues was recorded for CU-treated mice (70.25%), while PZQ-treated animals showed the highest reduction rate of egg load/intestine to be 91.94%. The sequence of dead egg percentage from the highest to the lowest amongst PZQ, AL, or CU groups in the liver and intestine was similar to the sequence of egg load reduction rates. The lowest reduction rates of AL than PZQ or CU are in agreement with Metwally et al. [20], who recorded that AL caused the lowest reduction rate between PZQ and garlic in either worm burden or egg load.
There was a significant reduction in RBC’s count, HGB, HCT, MCV, and MCHC in infected-untreated mice as compared with the health saline group that is in parallel with recent research [4]. The reduction in RBC’s count, HGB, and HCT parameters reflected severe anemia that may be due to blood loss and improved rate of hemolysis as well as the shortened life span of RBCs. Blood may be lost either from the bleeding induced by the disposal of the egg through the intestinal wall or due to consumption by adult schistosomes [23]. AL had a more significant effect on RBCs and HCT of the infected mice than PZQ and CU, which may be due to a reduction of worms and egg load. Consistently with this result, it was reported previously that S. mansoni infected groups treated with garlic oil or aqueous garlic extracts (or a mixture of both) showed a significant improvement in HGB and HCT in comparison with infected-untreated animals [19]. Also, CU-infected treated mice showed an increase in the values of RBCs and HCT after two weeks of treatment [24,25].
PZQ, Al and CU caused a significant reduction in all leukocyte parameters of the infected groups as compared with infected untreated animals. This decrease in leukocytosis in Al infected-treated mice agreed with aqueous garlic extract, which caused a reduction in WBC’s average [18]. However, the efficacy of CU could be due to its ability to stabilize the cell membrane and restore variable hematological indices [26].
Most of the previous studies focused on the relationship between antischistosomal drugs and the PLT count. Alkazzaz et al. [27] reported that PLT counts generally decreased in S. mansoni infected mice and the degree of thrombocytopenia increased in response to the time of infection. In the present result, there was not any significant difference in PLT among different groups, either infected or not.
The irritation of hepatocytes produced by the emitted toxins or metabolic products of the growing young worm, adult worms, and eggs can result in liver damage [28], which is associated with the increase of some enzyme activities in serum as ALT [29]. This illustrates the significant rise of ALT activity by 1.2-folds in infected-untreated mice in comparison with the control group. PZQ, AL, and CU caused a reduction in ALT activities in infected groups. This was in collaboration with the efficacy of the drugs to eliminate worms and eggs, which in turn caused the enzymatic enhancement of the hepatocytes.
The highest reduction levels of TC and TG among the infected treated-groups, in comparison with infected untreated ones, was recorded for the CU drug to be 16.9% and 19.5%, respectively. One hypothesis is that CU prevents the rise in serum cholesterol in animal studies by inhibiting dietary cholesterol absorption [30].
The present work showed that S. mansoni infection caused a significant elevation in the hepatic MDA levels, which is the representative of oxidative stress and marked depletion in the antioxidants; GSH, GST, SOD, and CAT. Infected groups treated with PZQ, AL, or CU showed improvement in these parameters in comparison with infected-untreated mice. Garlic and its derivatives (as well as CU) were investigated previously as antischistosomal drugs, and they were also found to act as proper antioxidants [10,19,24,31].
The antioxidant mechanism of AL in the scavenging of free radicals was shown to be able to scavenge O2· and OH· [32]. However, CU was recorded as a potent antioxidant in vitro and in vivo due to its ability to slow down the production of pro-oxidants such as ROS and GSSG [33,34].
In addition, the molecular applications were used in the evaluation of the therapies’ efficacy against S. mansoni infection [35]. DNA fragmentation and the diminishment of antioxidants are correlated with severe hepatotoxicity and histological changes [36]. In the present work, the laddering DNA is considered to be a reflection of fragmentation, and this is integrated with the pathological disorders recorded for oxidative stress and antioxidants in infected-untreated mice as mentioned above.
S. mansoni infection caused genetic alterations in the DNA of mice liver as previously reported by Riad et al. [37]. The PZQ, AL, and CU caused marked enhancement in the DNA pattern of infected liver tissues. AL was found to improve such deformations to a great extent. This was illustrated by the enhancement of DNA fragmentation in the liver of infected treated-mice with the active ingredient of garlic. The data of PZQ disagrees with Eid et al. [38], who found that infected animals treated with PZQ showed no significant change in DNA fragmentation pattern in comparison with the infected-untreated group. However, the combination of PZQ and CU showed a marked enhancement of damaged DNA in infected animals [22].
4. Material and Methods
4.1. Chemicals
Allicin (AL) (C6H10OS2 & ≥ 80% HPLC) was obtained from Science Med. (Egypt) and dissolved in distilled water. Curcumin (CU) (C21H20O6 & ≥ 65% HPLC) was brought from Sigma Aldrich, mixed with 0.5 M NaOH, and then suspended in a phosphate buffer (PB) to obtain the desired concentration according to vial instructions. PZQ was obtained from the Egyptian International Pharmaceutical Industries Co (E.I.P.I.CO.). All of the commercial kits for biochemical parameters were bought from the Spin-react Company (Spain), while oxidative stress and antioxidant kits were purchased from the Bio-diagnostic Company (Egypt).
4.2. Experimental Animals and Design
The fewest number of mice were chosen for this research to have valid results statistically. Ninety CD1 male, white albino mice with an average body weight of 18 ± 2.6 g were purchased from Theodore Bilharz Research Institute (TBRI, Imbaba, Giza, Egypt). They were kept in plastic cages (ten mice/cage) and held in the animal house of the Zoology Department, Faculty of Science, Port-Said University. They were placed under standard conditions maintained at a room temperature (20–25 °C), exposed to a 12 hr light/dark cycle and had free access to pellet food with tap water ad libitum. Mice were divided in a random manner into nine groups (10 animals/group) according to the experimental design shown in Table 7. Four groups were injected subcutaneously with 60 ±10 Schistosoma mansoni cercariae (Egyptian strain) per animal. Two groups of PZQ animals were treated orally (PO) from the 7th week for two successive days, while the other groups were injected intraperitoneally (IP) with different regimens from the 7th week of infection for two weeks (three times per week).
Table 7.
Experimental design.
The dose of treatment in PZQ treated-groups (noninfected and infected) was selected according to Chaiworaporn et al. [39]. Moreover, in the preliminary study on the effect of different doses of AL (10, 20, and 40 mL/kg body weights of mice) and CU (10, 20, and 40 mg/kg body weights of mice), we found the highest dose was the most effective in the elimination of helminthes and, thus, was used in this experimental animal design for further tests.
Animals in all groups (healthy and infected) described as fasted were deprived of food for 12 h but allowed free access to tap water after 14 days from the beginning of treatment and before collecting the blood and organ samples. By the end of the experimental period, the dissection and taking of the blood were performed under anesthesia to avoid any stress and pain that this process could inflict on the mice.
4.3. Collection of Blood and Organs
Blood samples of the fasted mice were collected immediately from the medial retro-orbital venous plexus using capillary tubes (Micro Hematocrit Capillaries, Mucaps) under ether anesthesia [40]. Then, the blood was centrifuged at 3000 rpm for 15 min and collected serum samples were marked and stored at −20 °C until they were used for different biochemical tests. Some blood samples were collected in a clean EDTA tube for the determination of complete blood count (CBC) [41].
From each group, parts of the liver and intestine were removed from some mice under ether anesthesia for parasitological assays. However, other parts of the liver tissues in the same group were either perfused with cold buffer containing 1.15% of KCl and 0.5 mM of EDTA, blotted dry on filter paper and stored at −80 °C for further biochemical analyses in tissues or stored directly at −80 °C for molecular analysis.
4.4. Worm Recovery
Each liver was put at once into a plastic folder and compressed between glass plates until the parenchyma was evenly dispersed into a delicate transparent layer and examined under a stereomicroscope to count the worms and classify them into male (♂), female (♀), and copulated [42].
The small and large intestines were removed and located in a Petri dish to examine the mesenteric veins under a stereoscopic microscope [43]. All S. mansoni worms were removed, counted, and classified. The reduction in the recovered worms from treated mice compared with untreated ones was expressed in a percentage formula as follows: P = (C − V)/C × 100 [44], where P indicates the percentage of the reduction, C indicates the number of worms isolated from the infected groups, and V indicates the number of parasites recovered from treated groups.
4.5. Ova Count
0.5 g from isolated livers and intestines were put individually in a falcon tube containing 5% KOH solution and placed in the incubator at 37 °C for 24 h for the complete digestion of tissues [45]. The total egg count was expressed as the mean number of eggs/mg of liver and intestine [46]. The percentage of reduction was calculated according to the equation: P = (C − V)/C × 100 [47].
4.6. Oogram
Three fragments of the liver and small intestine were cut longitudinally, rinsed in saline, softly dried on filter paper, and then compressed between two glass slides to obtain the thin preparation. Slides were examined under 10× microscope power and the stage of each egg was recorded in each fragment [48]. One hundred eggs were counted in each piece and classified according to their developmental stage [49].
4.7. Biochemical Serum Parameters
The level of total cholesterol (TC) and triglycerides (TG) were estimated according to the methods of Naito [50] and Buccolo and David [51], respectively. The activity of alanine transaminase (ALT) was assessed according to Murray [52]. The serum uric acid (UA) level was determined according to Schultz [53].
4.8. Determination of Oxidative Stress/Antioxidant Parameters in Liver Tissue
Levels of lipid peroxide in the liver tissues were estimated according to Ohkawa et al. [54]. The level of reduced glutathione (GSH) was estimated according to Beutler et al. [55]. Glutathione-s-transferase (GST) activity was determined using the method of Habig et al. [56]. Superoxide dismutase (SOD) and Catalase (CAT) were evaluated according to Nishikim et al. [57] and Aebi [58], respectively.
4.9. Detection of DNA Fragmentation by Agarose Gel Analysis
Before the DNA extraction process, liver tissues from infected mice were perfused to remove any attached worms, to be sure that the fragmentation result was a reflection of the liver condition only. The liver tissues of the infected and control saline groups were subject to DNA extraction after 24 hrs according to Sambrook and Russel [59]. The concentration of DNA was analyzed via electrophoresis on 2% agarose gel containing 1% GelRed (1:500) (Biotium, Hayward, EUA).
4.10. Statistical Analysis
Data were given as mean ± standard error (Mean ±SE). All data were analyzed using the Statistic Program Sigma Stat (SPSS), version 20. The effects of different regimens was analyzed via one-way ANOVA (Analysis of variance). A value of p < 0.05 was interpreted as statistically significant [60].
5. Conclusions
There is an obvious correlated relationship between Schistosoma mansoni infection and some pathological disorders (such as hematological, oxidative stress, and antioxidant changes), which can extend to DNA malformations. This promising result showed the proper efficacy of AL and CU as antischistosomal drugs which were close to PZQ in the elimination of adult worms and eggs and, at the same time, the improvement of MDA and antioxidants caused an enhancement of the DNA fragmentation pattern. In addition, there is a need to test the combination of these three drugs as antischistosomiasis, a greater understanding the mechanism of action of AL and CU, and the more preop period of treatment leading to the best result.
Author Contributions
Conceptualization, A.H.A.A., H.A.R., M.F.M.S., N.S.E.-S., F.A. and E.F.; methodology, A.H.A.A., H.A.R., M.F.M.S., software, A.H.A.A., H.A.R., M.F.M.S., N.S.E.-S.; validation, A.H.A.A., M.F.M.S., M.F.M.S., N.S.E.-S., F.A. and E.F.; formal analysis, M.F.M.S., M.F.M.S., N.S.E.-S.; investigation, A.H.A.A., M.F.M.S.; resources, A.H.A.A., M.F.M.S., M.F.M.S., N.S.E.-S., F.A.; data curation, A.H.A.A., H.A.R.; writing—original draft preparation, A.H.A.A., H.A.R., M.F.M.S., N.S.E.-S., F.A. and E.F.; writing—review and editing, H.A.R., M.F.M.S., N.S.E.-S.; supervision, A.H.A.A., H.A.R., M.F.M.S., N.S.E.-S.; project administration, A.H.A.A., H.A.R., M.F.M.S., N.S.E.-S., F.A. and E.F.; funding acquisition, F.A. and E.F. All authors have read and agreed to the published version of the manuscript.
Funding
Taif University Researchers Supporting Project number (TURSP-2020/222), Taif University, Taif, Saudi Arabia.
Informed Consent Statement
No humans were involved in this study. The reports of experiments on animals were followed in accordance with the standards outlined in the 8th edition of the guide for the care and use of laboratory animals. All animal procedures and experimental protocols were approved by the Research Ethics Committee of Port said University, Egypt.
Data Availability Statement
The data presented in this study are available on request from the corresponding author.
Acknowledgments
The authors would like to thank the Deanship of Scientific Research at Taif University for funding this work through Taif University Researchers Supporting Project number (TURSP-2020/222), Taif University, Taif, Saudi Arabia.
Conflicts of Interest
The authors declare that they have no conflict of interest.
Ethical Standards
Ethical considerations of the study were confirmed by the Biology Department and the Ethical Committee at the Faculty of Science, Port Said University.
Sample Availability
Samples of the compounds Allium sativum and Curcuma longa are available from the authors.
References
- Aula, O.; McManus, D.; Jones, M.; Gordon, C. Schistosomiasis with a Focus on Africa. Trop. Med. Infect. Dis. 2021, 6, 109. [Google Scholar] [CrossRef]
- Coltart, C.; Whitty, C.J. Schistosomiasis in non-endemic countries. Clin. Med. 2015, 15, 67–69. [Google Scholar] [CrossRef]
- Tamarozzi, F.; Fittipaldo, V.A.; Orth, H.M.; Richter, J.; Buonfrate, D.; Riccardi, N.; Gobbi, F.G. Diagnosis and clinical management of hepatosplenic schistosomiasis: A scoping review of the literature. PLoS Negl. Trop. Dis. 2021, 15, e0009191. [Google Scholar] [CrossRef]
- Sorgho, H.; Da, O.; Rouamba, T.; Savadogo, B.; Tinto, H.; Ouedraogo, J.-B. Schistosoma mansoni infection and hematological profile in an endemic foci in Western Burkina Faso. J. Parasitol. Res. 2017, 4, 264–270. [Google Scholar]
- Dejon-Agobé, J.C.; Adegnika, A.A.; Grobusch, M.P. Haematological changes in Schistosoma haematobium infections in school children in Gabon. Infection 2021, 49, 645–651. [Google Scholar] [CrossRef]
- Amaral, K.; Silva, T.P.; Malta, K.K.; Carmo, L.A.S.; Dias, F.F.; Almeida, M.; Andrade, G.; Martins, J.D.S.; Pinho, R.R.; Costa-Neto, S.F.; et al. Natural Schistosoma mansoni Infection in the Wild Reservoir Nectomys squamipes Leads to Excessive Lipid Droplet Accumulation in Hepatocytes in the Absence of Liver Functional Impairment. PLoS ONE 2016, 11, e0166979. [Google Scholar] [CrossRef]
- Aziz, M.; Aziz, A.R.A. Evaluation of the bioassay of Commiphora molmol extract (Mirazid) against praziquantel in experimentally infected mice with Schistosoma mansoni. J. Vet. Med. Res. 2017, 24, 94–102. [Google Scholar] [CrossRef]
- Schwartz, C.; Fallon, P.G. Schistosoma “Eggs-Iting” the Host: Granuloma Formation and Egg Excretion. Front. Immunol. 2018, 9, 2492. [Google Scholar] [CrossRef]
- El-Khadragy, M.F.; Al-Olayan, E.M.; Elmallah, M.I.Y.; Alharbi, A.M.; Yehia, H.M.; Moneim, A.E.A. Probiotics and yogurt modulate oxidative stress and fibrosis in livers of Schistosoma mansoni-infected mice. BMC Complement. Altern. Med. 2019, 19, 1–13. [Google Scholar] [CrossRef] [PubMed]
- Mantawy, M.M.; Aly, H.; Zayed, N.; Fahmy, Z.H. Antioxidant and schistosomicidal effect of Allium sativum and Allium cepa against Schistosoma mansoni different stages. Eur. Rev. Med. Pharm. Sci. 2012, 16, 69–80. [Google Scholar]
- Jatsa, H.B.; Feussom, N.G.; Nkondo, E.T.; Kenfack, M.C.; Simo, N.D.; Fassi, J.B.K.; Femoe, U.M.; Moaboulou, C.; Tsague, C.D.; Dongo, E.; et al. Efficacy of Ozoroa pulcherrima Schweinf methanolic extract against Schistosoma mansoni-induced liver injury in mice. J. Tradit. Complement. Med. 2019, 9, 304–311. [Google Scholar] [CrossRef] [PubMed]
- Madbouly, K.; Senagore, A.J.; Mukerjee, A.; Hussien, A.M.; Shehata, M.A.; Navine, P.; Delaney, C.P.; Fazio, V.W. Colorectal cancer in a population with endemic Schistosoma mansoni: Is this an at-risk population? Int. J. Colorectal Dis. 2006, 22, 175–181. [Google Scholar] [CrossRef] [PubMed]
- Wang, W.; Dai, J.-R.; Li, H.-J.; Shen, X.-H.; Liang, Y.-S. Is there reduced susceptibility to praziquantel in Schistosoma japonicum? Evidence from China. Parasitology 2010, 137, 1905–1912. [Google Scholar] [CrossRef]
- Crellen, T.; Walker, M.; Lamberton, P.; Kabatereine, N.B.; Tukahebwa, E.M.; Cotton, J.; Webster, J.P. Reduced Efficacy of Praziquantel Against Schistosoma mansoni Is associated with multiple rounds of mass drug administration. Clin. Infect. Dis. 2016, 63, 1151–1159. [Google Scholar] [CrossRef]
- Simões, L.F.; Allegretti, S.; Magalhães, L.A.; Zanotti-Magalhães, E.M.; Kawano, T.; Linhares, A.X. EFEITO DO Extrato De Piper Tuberculatum Sobre Adultos De Schistosoma Mansoni: Testes in vitro E In Vivo. Rev. Patol. Trop. J. Trop. Pathol. 2015, 44, 56–66. [Google Scholar] [CrossRef]
- Rabab, S.; Samia, R.; Mohammad, Y.; Boshra, H.; Fatma, M.; Awatif, E.; Asmaa, E.-K.; Gehan, R.; Shereen, K.; Ahlam, M.; et al. A novel green approach for the treatment of immature Schistosoma mansoni infection in mice with; Arabic gum (Acacia senegal); an antischistosomal agent. Afr. J. Pharm. Pharm. 2018, 12, 436–445. [Google Scholar] [CrossRef]
- Singh, D.K.; Singh, V.K. Pharmacological Effects of Allium Sativum L. (Garlic). Annu. Rev. Biomed. Sci. 2008, 10, 6–26. [Google Scholar] [CrossRef]
- El Shenawy, N.S.; Soliman, M.F.M.; Reyad, S.I. The effect of antioxidant properties of aqueous garlic extract and Nigella sativa as anti-schistosomiasis agents in mice. Rev. Do Inst. De Med. Trop. De São Paulo 2008, 50, 29–36. [Google Scholar] [CrossRef] [PubMed]
- Sadrefozalayi, S.; Aslanipour, B.; Alan, M.; Calan, M. determination and comparison of in vitro radical scavenging activity of both garlic oil and aqueous garlic extracts and their In Vivo antioxidant effect on Schistosomiasis Disease in Mice. Turk. J. Agric. Food Sci. Technol. 2018, 6, 820–827. [Google Scholar] [CrossRef]
- Metwally, D.M.; Al-Olayan, E.M.; Alanazi, M.; Alzahrany, S.B.; Semlali, A. Antischistosomal and anti-inflammatory activity of garlic and allicin compared with that of praziquantel In Vivo. BMC Complement. Altern. Med. 2018, 18, 1–11. [Google Scholar] [CrossRef]
- Buescher, R.; Yang, L. Turmeric. In Natural Food Colorants; Lauro, G.J., Francis, F.J., Eds.; Marcel Dekker: New York, NY, USA, 2000; pp. 205–226. [Google Scholar]
- Aboueldahab, M.; El-Hussieny, E. Antiparasitic and physiological evaluation of Curcuma longa extract and/or PZQ on Schistosoma mansoni infected mice. Int. J. Adv. Res. 2016, 4, 1020–1039. [Google Scholar] [CrossRef]
- Sturrock, R.; Kariuki, H.; Thiongo, F.; Gachare, J.; Omondi, B.; Ouma, J.; Mbugua, G.; Butterworth, A. Schistosomiasis mansoni in Kenya: Relationship between infection and anaemia in schoolchildren at the community level. Trans. R. Soc. Trop. Med. Hyg. 1996, 90, 48–54. [Google Scholar] [CrossRef]
- Mahmoud, E.A.; ELbessoumy, A.A. Hematological and biochemical effects of curcumin in Schistosoma mansoni infected mice. Assiut Vet. Med. J. 2014, 60, 184–194. [Google Scholar]
- Mahmoud, E.A.; ELbessoumy, A.A. Effect of curcumin on hematological, biochemical and antioxidants parameters in Schistosoma mansoni infected mice. Int. J. Sci. 2013, 2, 1–14. [Google Scholar]
- Sharma, V.; Sharma, C.; Sharma, S. Influence of Curcuma longa and curcumin on blood profile in mice subjected to aflatoxin B. Int. J. Pharm. Sci. Res. 2011, 2, 1740–1745. [Google Scholar] [CrossRef]
- Alkazzaz, M.A.; Adel Aziz, A.R.; Elmahalawy, E.K.; Hassan, A.A. Hematological profile in Schistosoma mansoni infected mice treated with Commiphora molmol extract compared with praziquantel. PSM Biol. Res. 2018, 3, 77–84. [Google Scholar]
- Ali, H.F. Evaluation of Antioxidants Effect of Citrus reticulata in Schistosoma mansoni Infected Mice. Trends Med. Res. 2007, 2, 37–43. [Google Scholar] [CrossRef]
- El Scheich, T.; Hofer, L.; Kaatano, G.; Foya, J.; Odhiambo, D.; Igogote, J.; Lwambo, N.; Ekamp, H.; Karst, K.; Häussinger, D.; et al. Hepatosplenic morbidity due to Schistosoma mansoni in schoolchildren on Ukerewe Island, Tanzania. Parasitol. Res. 2012, 110, 2515–2520. [Google Scholar] [CrossRef]
- Arafa, H.M.M. Curcumin attenuates diet-induced hypercholesterolemia in rats. Med. Sci. Monit. 2005, 11, BR228–BR234. [Google Scholar]
- Allam, G. Immunomodulatory effects of curcumin treatment on murine schistosomiasis mansoni. Immunobiology 2009, 214, 712–727. [Google Scholar] [CrossRef]
- Tiwari, M.K.; Jena, N.R.; Mishra, P.C. Mechanisms of scavenging superoxide, hydroxyl, nitrogen dioxide and methoxy radicals by allicin: Catalytic role of superoxide dismutase in scavenging superoxide radical. J. Chem. Sci. 2018, 130, 105. [Google Scholar] [CrossRef]
- Sandur, S.K.; Ichikawa, H.; Pandey, M.K.; Kunnumakkara, A.B.; Sung, B.; Sethi, G.; Aggarwal, B.B. Role of pro-oxidants and antioxidants in the anti-inflammatory and apoptotic effects of curcumin (diferuloylmethane). Free Radic. Biol. Med. 2007, 43, 568–580. [Google Scholar] [CrossRef]
- Sompamit, K.; Kukongviriyapan, U.; Nakmareong, S.; Pannangpetch, P.; Kukongviriyapan, V. Curcumin improves vascular function and alleviates oxidative stress in non-lethal lipopolysaccharide-induced endotoxaemia in mice. Eur. J. Pharm. 2009, 616, 192–199. [Google Scholar] [CrossRef] [PubMed]
- De Oliveira, R.N.; Ferreira, P.; Calado, M.; Belo, S.; Afonso, A.; Garcia, V.L.; Oliveira, A.S.S.; Jeraldo, V.D.L.S.; dos Santos, K.R.; Allegretti, S.M. Sesquiterpenes effects on DNA of Schistosoma mansoni after in vivo treatment. Gene Rep. 2018, 11, 205–212. [Google Scholar] [CrossRef]
- Abdel-Wahhab, M.A.; Ahmed, H.M.; Abdel-Aziem, S.H.; El-Nekeety, A.A.; Abd El-Kader, H.A.; Abdel-Aziz, M.S.; Hamazawy, M.A.; Sharaf, H.A.; Naguib, H.M.; El-Denshary, E.S. Modulation of hepatotoxicity, DNA fragmentation and gene expression of Solanum nigrum leaves extract in rats treated with silver nanoparticles. J. Appl. Pharm. Sci. 2017. [Google Scholar] [CrossRef]
- Riad, N.H.; Taha, H.; Mahmoud, Y. Effects of garlic on Schistosoma mansoni harbored in albino mice: Molecular characterization of the host and parasite. Gene 2013, 518, 287–291. [Google Scholar] [CrossRef]
- Eid, J.I.; Mohammed, A.R.; Hussien, N.A.; El-Shennawy, A.M.; Noshy, M.M.; Abbas, M. In vivo antioxidant and antigenotoxic evaluation of an enaminone derivative BDHQ combined with praziquantel in uninfected and Schistosoma mansoni infected mice. J. Appl. Pharm. Sci. 2014. [Google Scholar] [CrossRef]
- Chaiworaporn, R.; Maneerat, Y.; Rojekittikhun, W.; Ramasootal, P.; Janecharut, T.; Matsuda, H.; Kitikoon, V. Therapeutic effect of subcurative dose Praziquantel on Schistosoma mansoni infected mice and resistance to challenge infection after treatment Southeast. Asian. J. Trop. Med. Public Health 2005, 36, 846–852. [Google Scholar]
- Boussarie, D. Hématologie des Rongeurset Lagomorphes de Compagnie. Bull. Acad. Vet. France 1999, 72, 209–216. [Google Scholar] [CrossRef]
- Feldman, B.F.; Zinkl, J.G.; Jain, N.C. Schalm’s Veterinary Hematology, 5th ed.; Williams and Wilkins: Boston, MA, USA, 2000. [Google Scholar]
- Wang, Y.; Holmes, E.; Nicholson, J.; Cloarec, O.; Chollet, J.; Tanner, M.; Singer, B.H.; Utzinger, J. Metabonomic investigations in mice infected with Schistosoma mansoni: An approach for biomarker identification. Proc. Natl. Acad. Sci. USA 2004, 101, 12676–12681. [Google Scholar] [CrossRef]
- Kloetzel, K. Egg and pigment production in Schistosoma mansoni Infections of the white mouse. Am. J. Trop. Med. Hyg. 1967, 16, 293–299. [Google Scholar] [CrossRef]
- Tendler, M.; Pinto, R.; Lima, A.; Gebara, G.; Katz, N. Schistosoma mansoni: Vaccination with adult worm antigens. Int. J. Parasitol. 1986, 16, 347–352. [Google Scholar] [CrossRef]
- Cheever, A.W. A quantitative post-mortem study of Schistosomiasis Mansoni in Man. Am. J. Trop. Med. Hyg. 1968, 17, 38–64. [Google Scholar] [CrossRef]
- Helmy, M.M.; Mahmoud, S.S.; Fahmy, Z.H. Schistosoma mansoni: Effect of dietary zinc supplement on egg granuloma in Swiss mice treated with praziqantel. Exp. Parasitol. 2009, 122, 310–317. [Google Scholar] [CrossRef] [PubMed]
- A Wilson, R.; Coulson, P.S.; Dixon, B. Migration of the schistosomula of Schistosoma mansoni in mice vaccinated with radiation-attenuated cercariae, and normal mice: An attempt to identify the timing and site of parasite death. Parasitology 1986, 92, 101–116. [Google Scholar] [CrossRef] [PubMed]
- Pellegrino, J.; Faria, J. The oogram method for the screening of drugs in Schistosomiasis Mansoni. Am. J. Trop. Med. Hyg. 1965, 14, 363–369. [Google Scholar] [CrossRef]
- Pellegrino, J.; Oliveira, C.A.; Faria, J.; Cunha, A.S. New Approach to the Screening of Drugs in Experimental Schistosomiasis Mansoni in Mice. Am. J. Trop. Med. Hyg. 1962, 11, 201–215. [Google Scholar] [CrossRef]
- Naito, H.K. Cholesterol. In Clinical Chemistry: Theory, Analysis, and Correlation; Kaplan, L.A., Pesce, A.J., Eds.; CV Mosby Co: St. Louis, MO, USA, 1984; pp. 1194–1206. [Google Scholar]
- Buccolo, G.; David, H. Quantitative determination of serum triglycerides by use of enzymes. Clin. Chem. 1973, 19, 476–482. [Google Scholar] [CrossRef]
- Murray, R. Alanine aminotransferase. In Clinical Chemistry: Theory, Analysis, and Correlation; Kaplan, L.A., Pesce, A.J., Eds.; CV Mosby Co: St Louis, MO, USA, 1984; pp. 1088–1090. [Google Scholar]
- Schultz, A. Uric acid. In Clinical Chemistry: Theory, Analysis, and Correlation; Kaplan, L.A., Pesce, A.J., Eds.; CV Mosby Co: St. Louis, MO, USA, 1984; pp. 1261–1266. [Google Scholar]
- Ohkawa, H.; Ohishi, N.; Yagi, K. Assay for lipid peroxides in animal tissues by thiobarbituric acid reaction. Anal. Biochem. 1979, 95, 351–358. [Google Scholar] [CrossRef]
- Beutler, E.; Duron, O.; Kelly, B.M. Improved method for the determination of blood glutathione. J. Lab. Clin. Med. 1963, 61, 882–888. [Google Scholar]
- Habig, W.H.; Pabst, M.J.; Jakoby, W.B. Glutathione S-transferases. The first enzymatic step in mercapturic acid formation. J. Biol. Chem. 1974, 249, 7130–7139. [Google Scholar] [CrossRef]
- Nishikimi, M.; Rao, N.A.; Yagi, K. The occurrence of superoxide anion in the reaction of reduced phenazine methosulfate and molecular oxygen. Biochem. Biophys. Res. Commun. 1972, 46, 849–854. [Google Scholar] [CrossRef]
- Aebi, H. [13] Catalase in vitro. Methods Enzymol. 1984, 105, 121–126. [Google Scholar] [CrossRef]
- Sambrook, J.; Russel, D.W. Molecular Cloning: A Laboratory Manual, 3rd ed.; Cold Spring, Harbour Laboratory Press: New York, NY, USA, 2001. [Google Scholar]
- Hussein, A.; Rashed, S.; El hayawan, I.; El-sayed, R.; Ali, H. Evaluation of the Anti-schistosomal Effects of Turmeric (Curcuma longa) Versus Praziquantel in Schistosoma mansoni Infected Mice. Iran. J. Parasitol. 2017, 12, 587–596. [Google Scholar] [PubMed]
Publisher’s Note: MDPI stays neutral with regard to jurisdictional claims in published maps and institutional affiliations. |
© 2021 by the authors. Licensee MDPI, Basel, Switzerland. This article is an open access article distributed under the terms and conditions of the Creative Commons Attribution (CC BY) license (https://creativecommons.org/licenses/by/4.0/).