
Urinary Metabolomics Study of Patients with Bicuspid Aortic Valve Disease

 , ,
, ,  and
and 
Abstract
: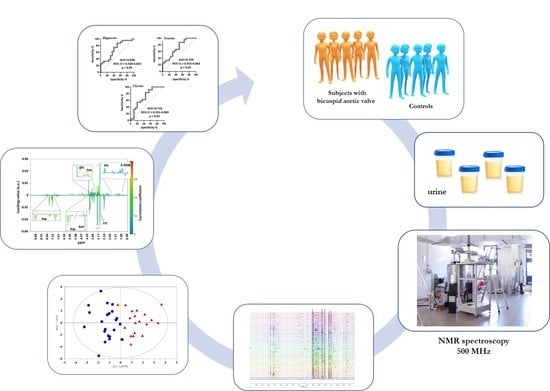
1. Introduction
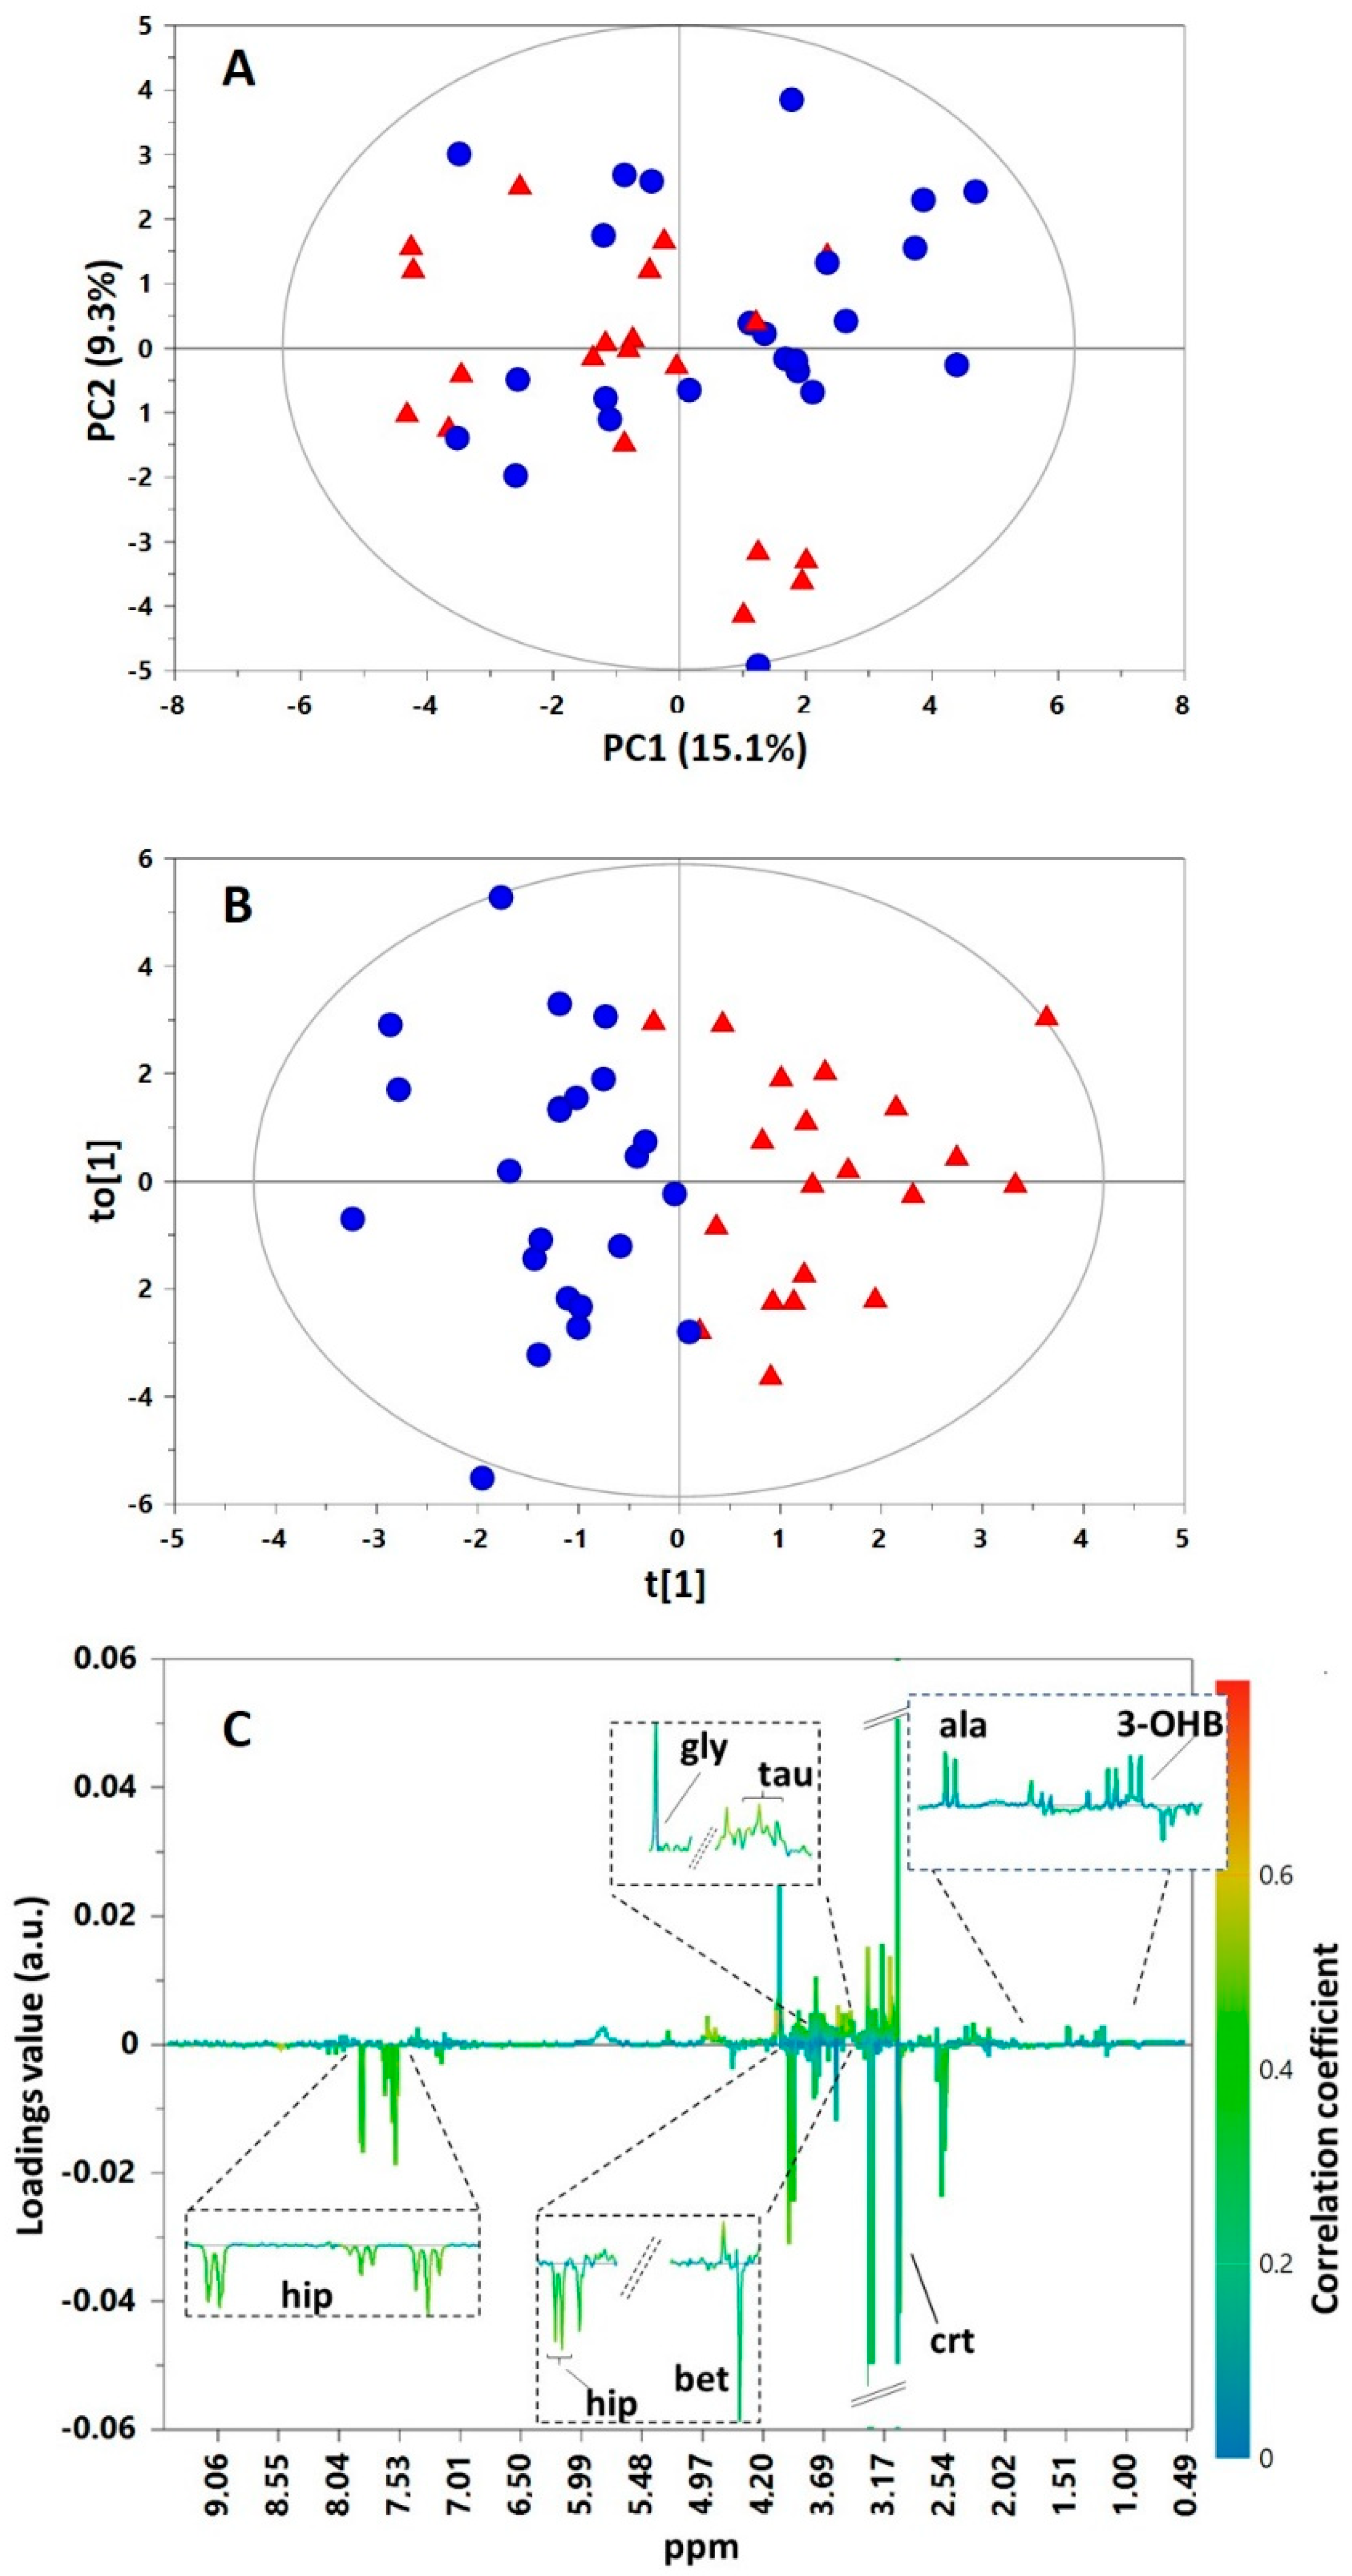
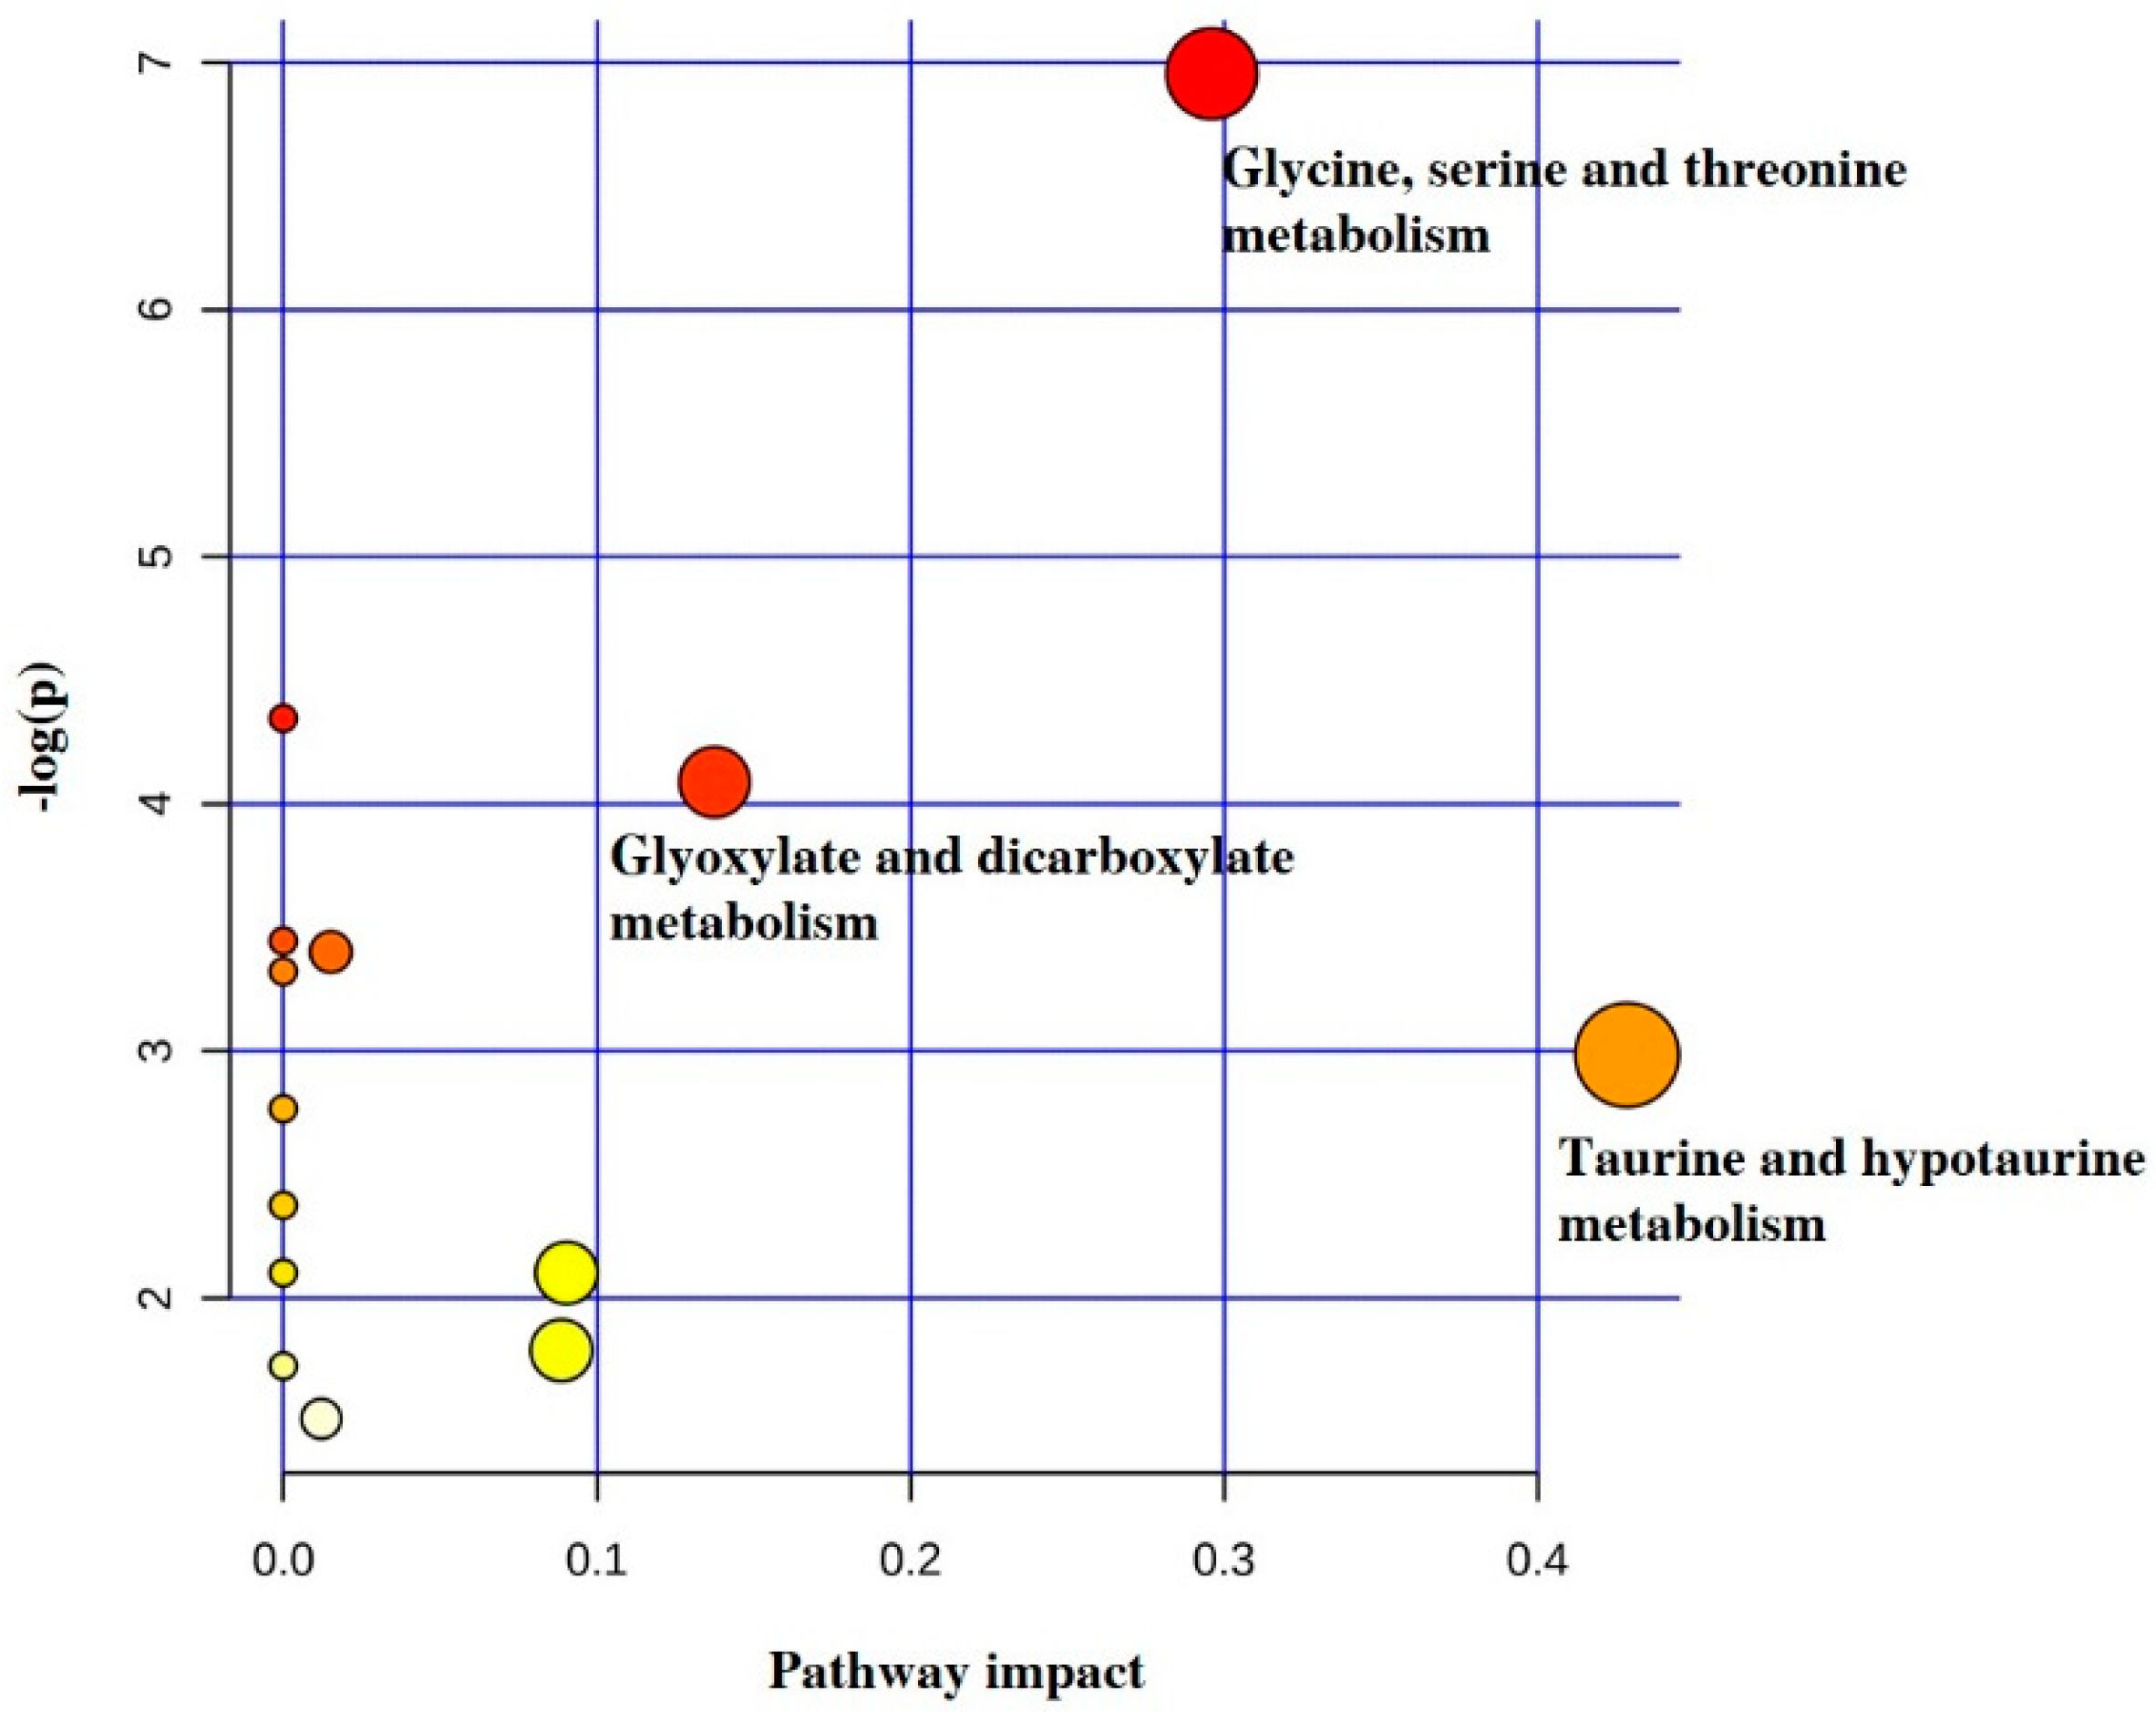
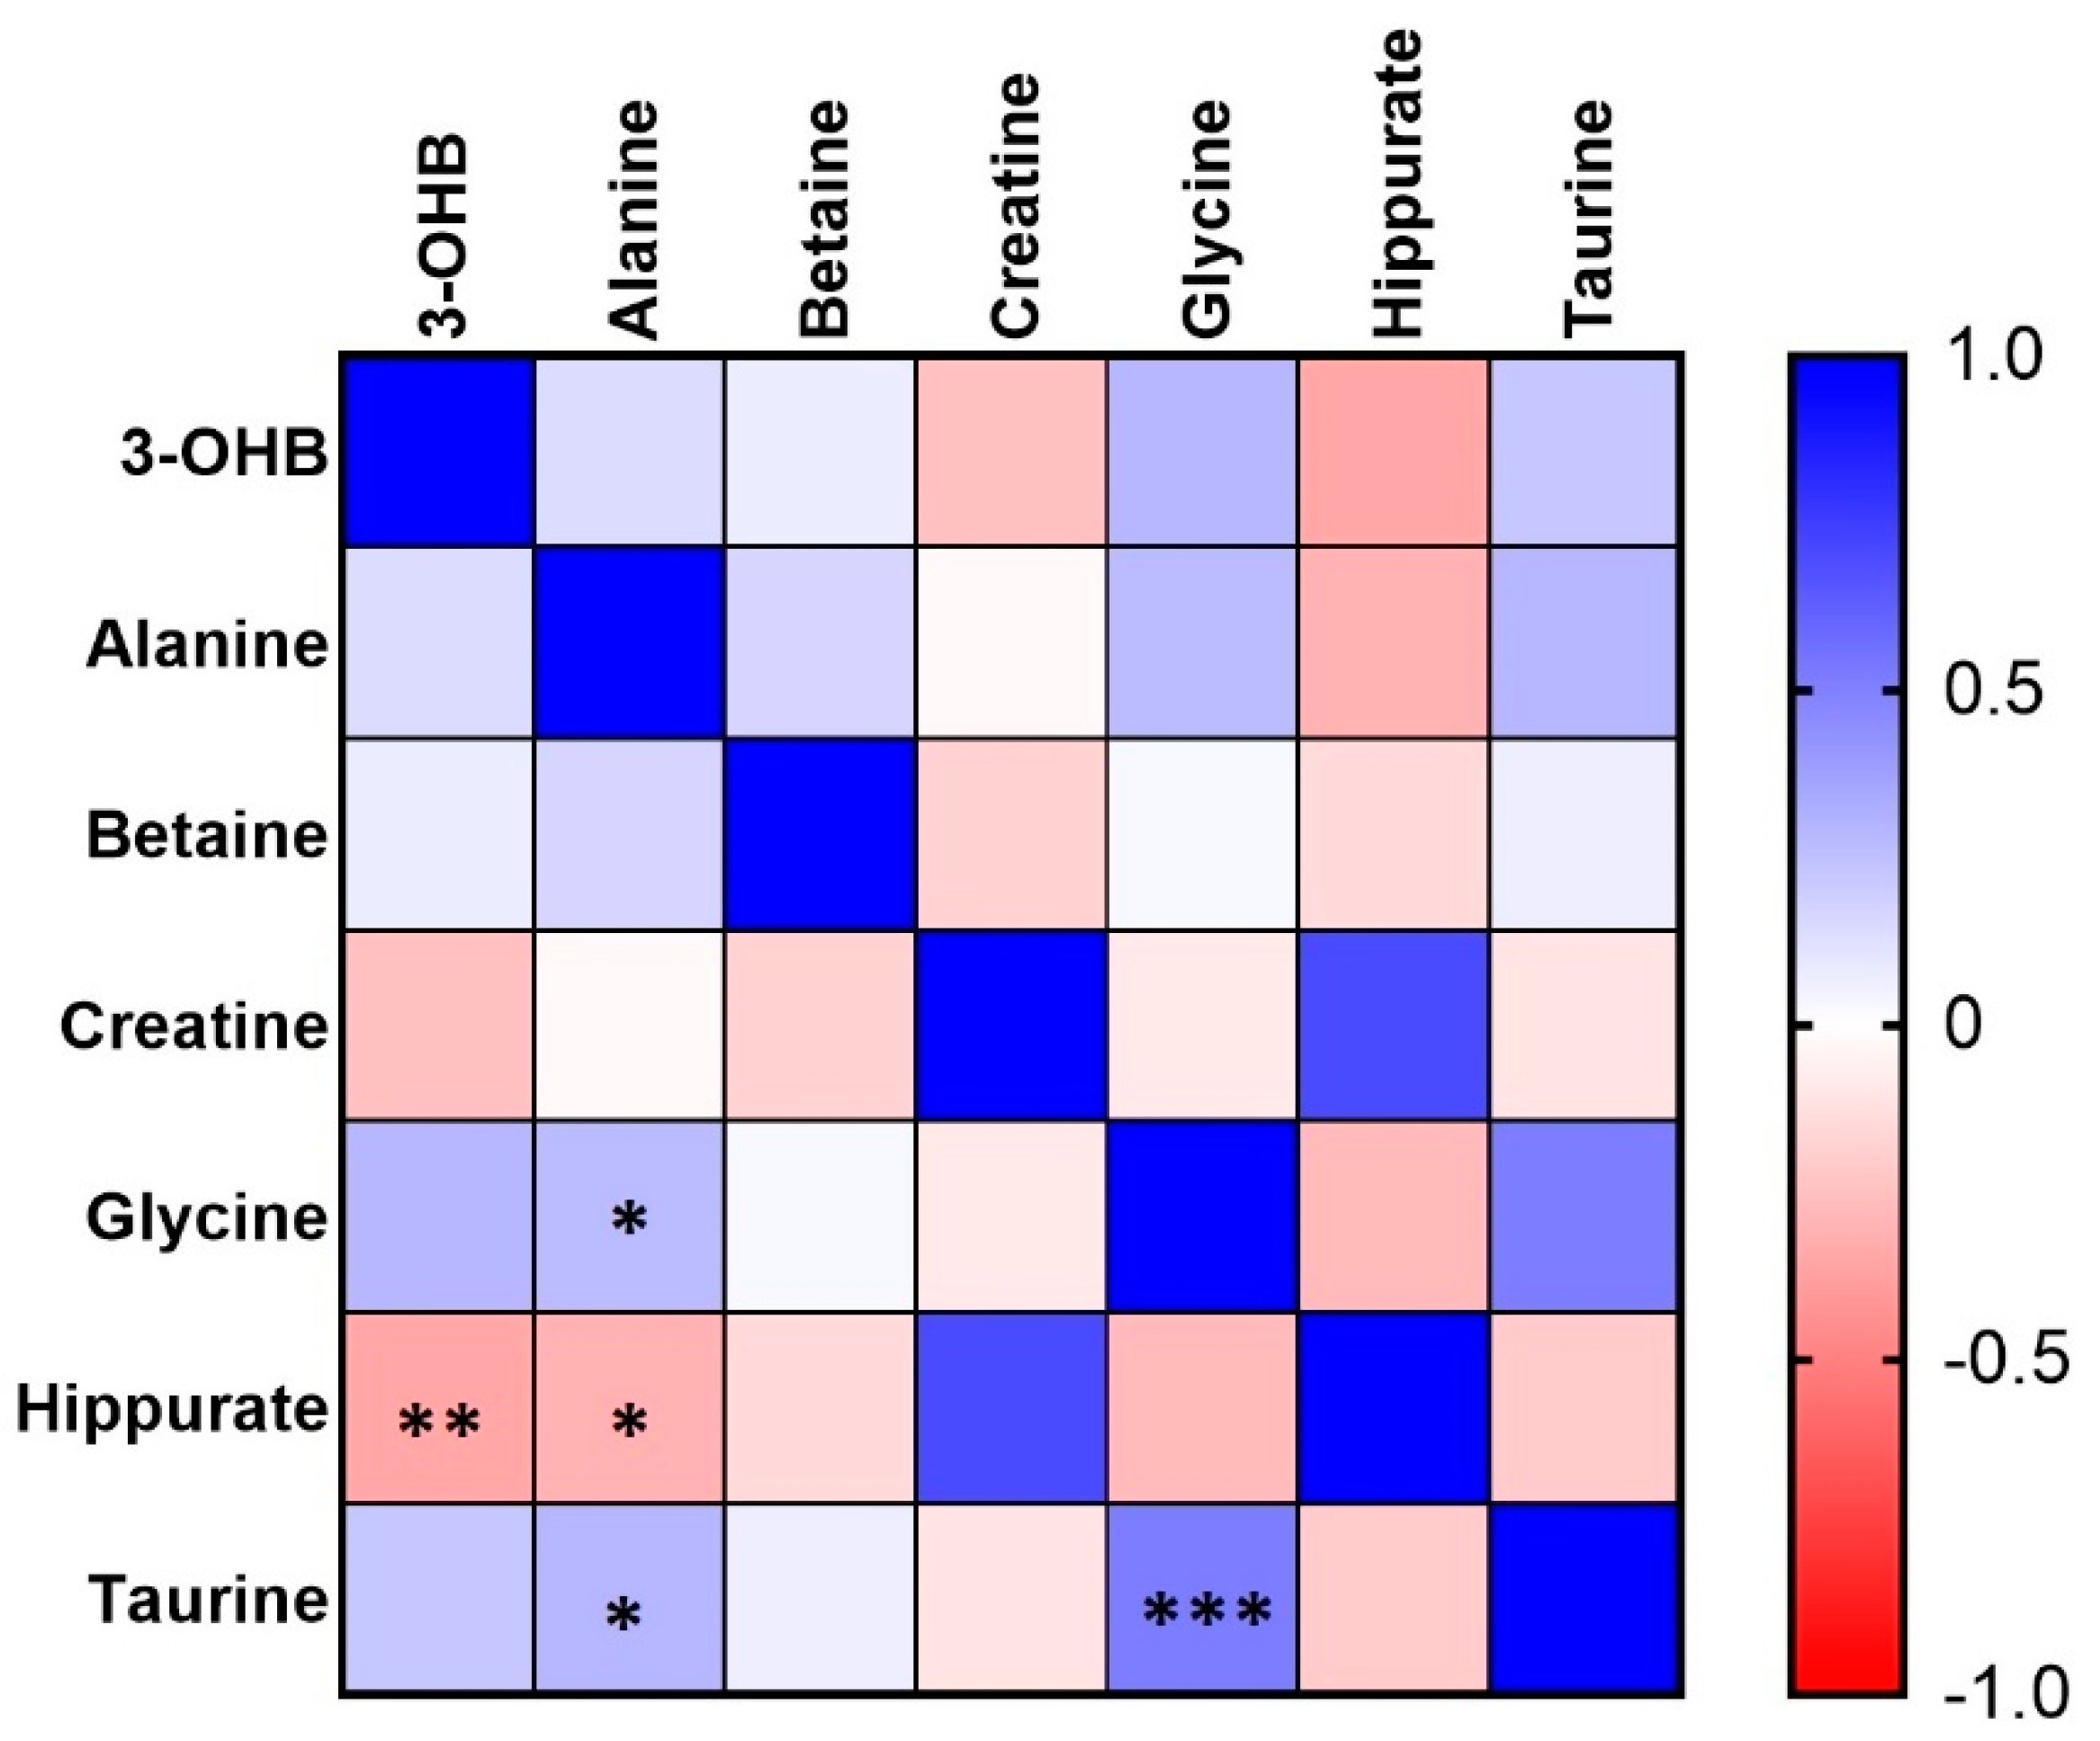
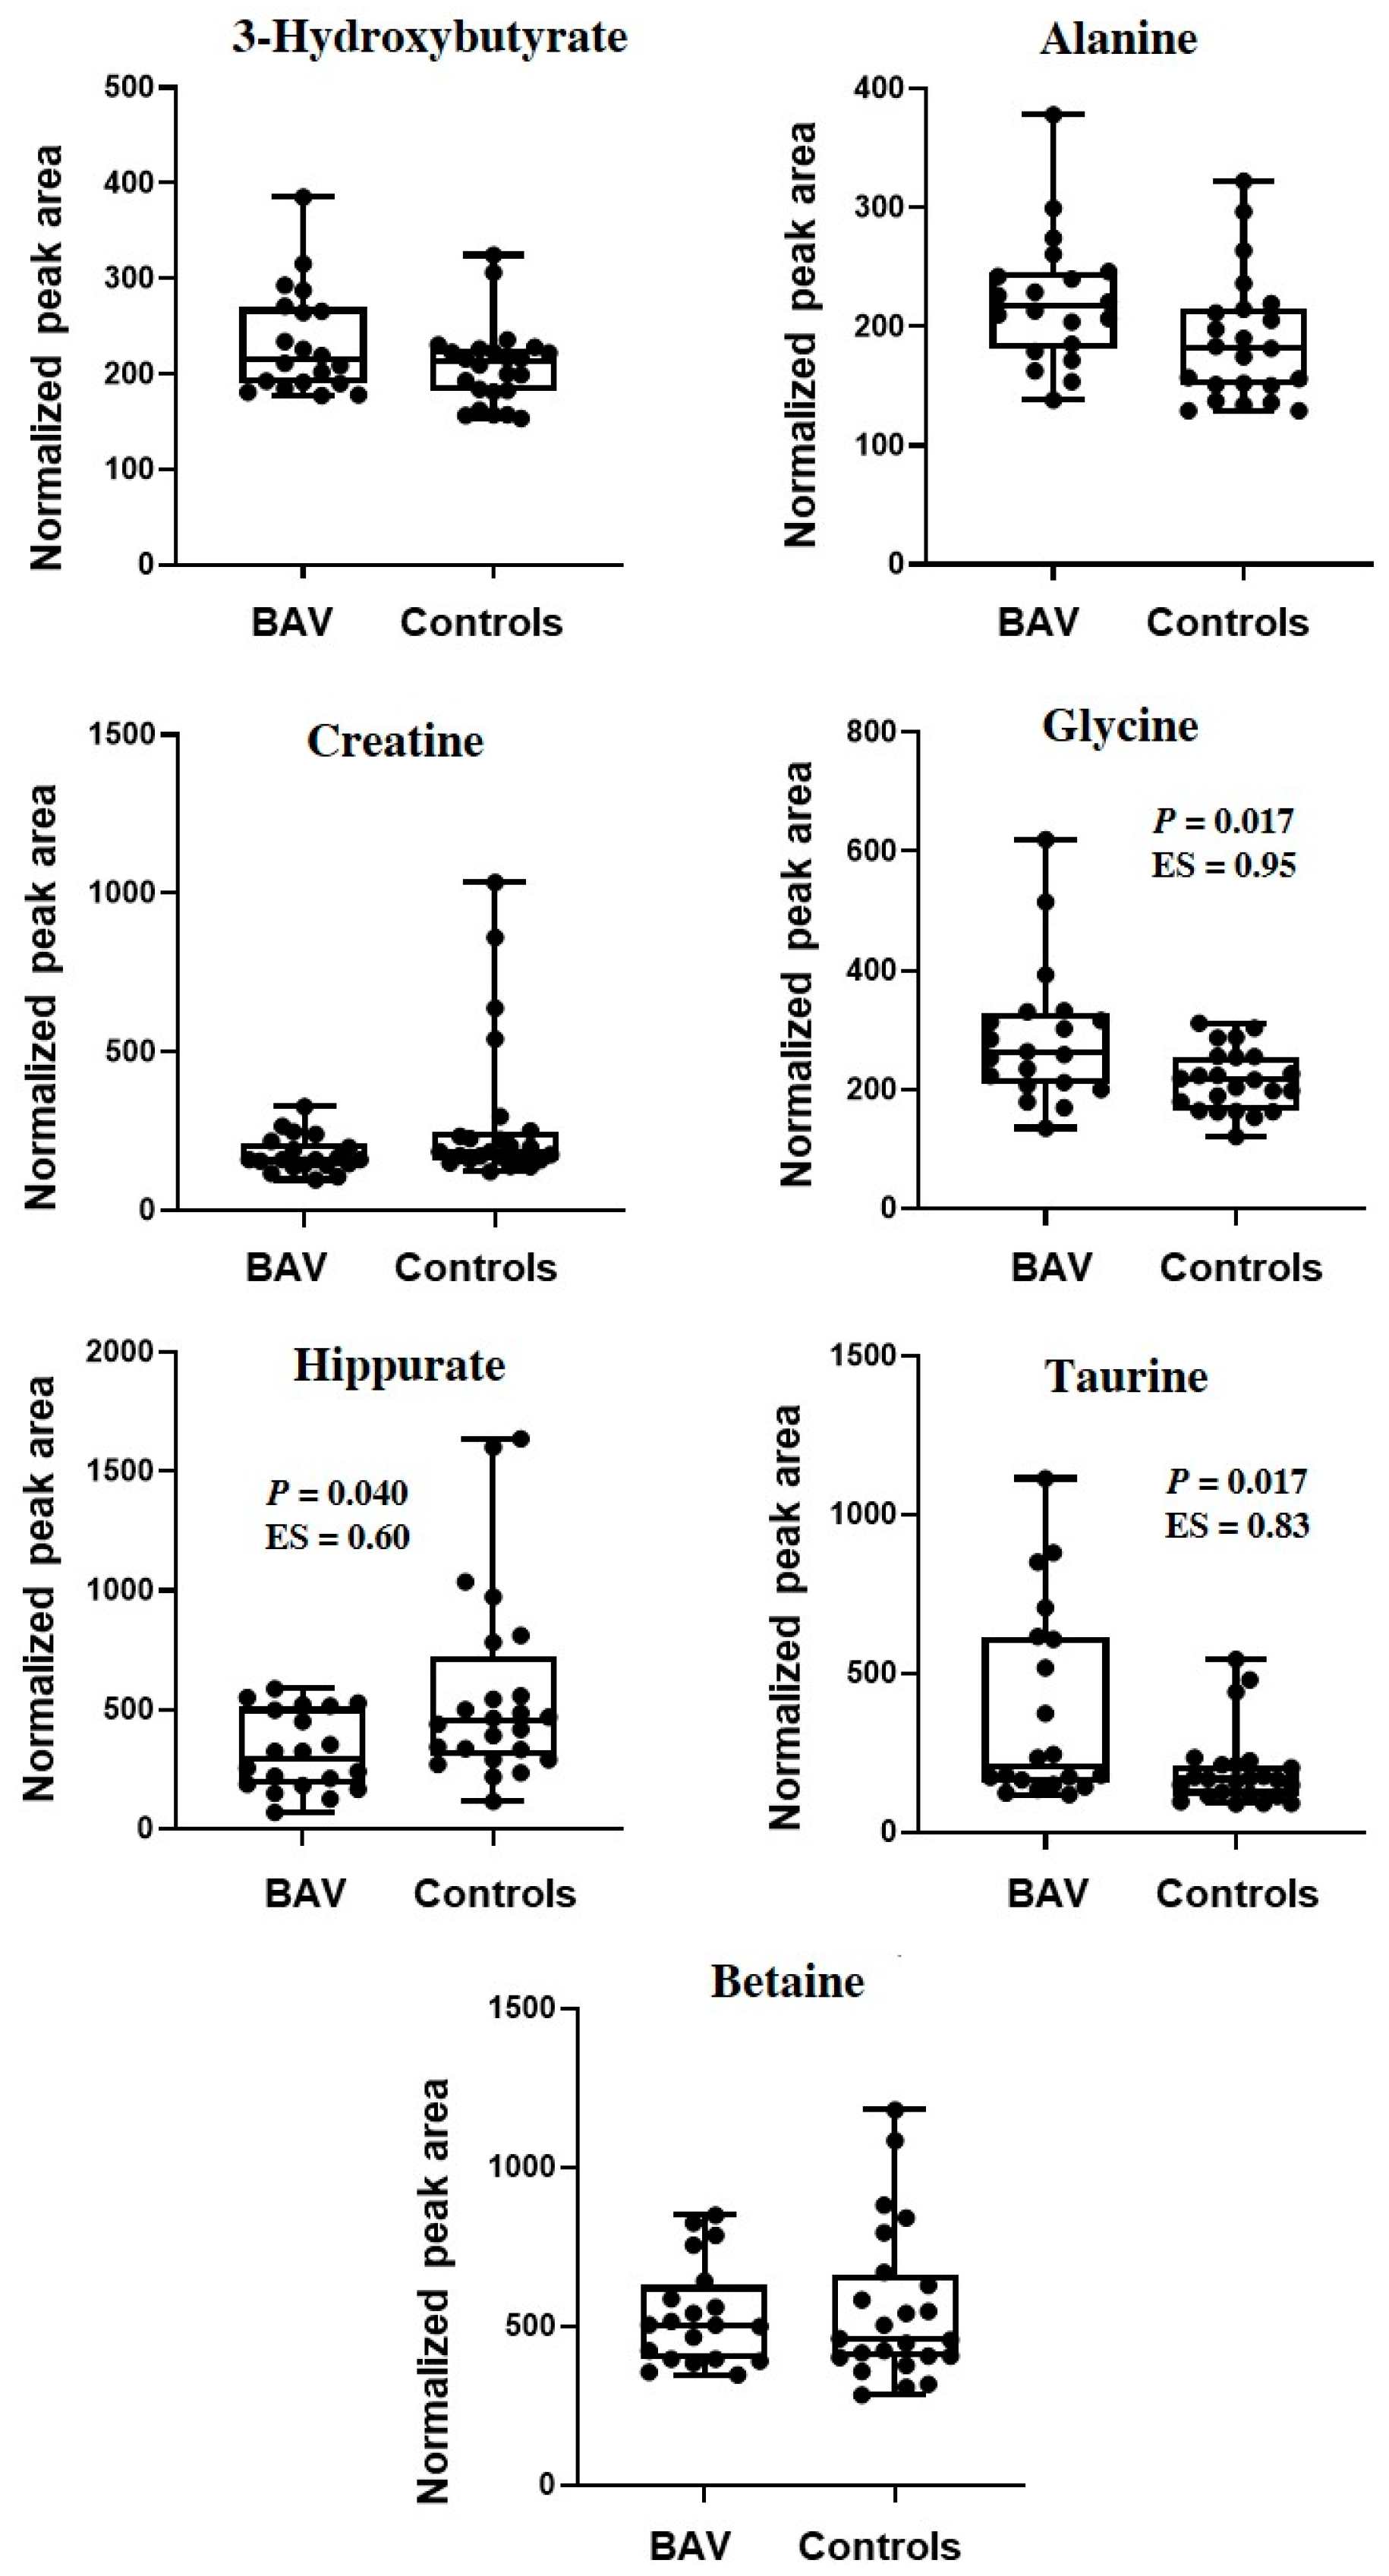
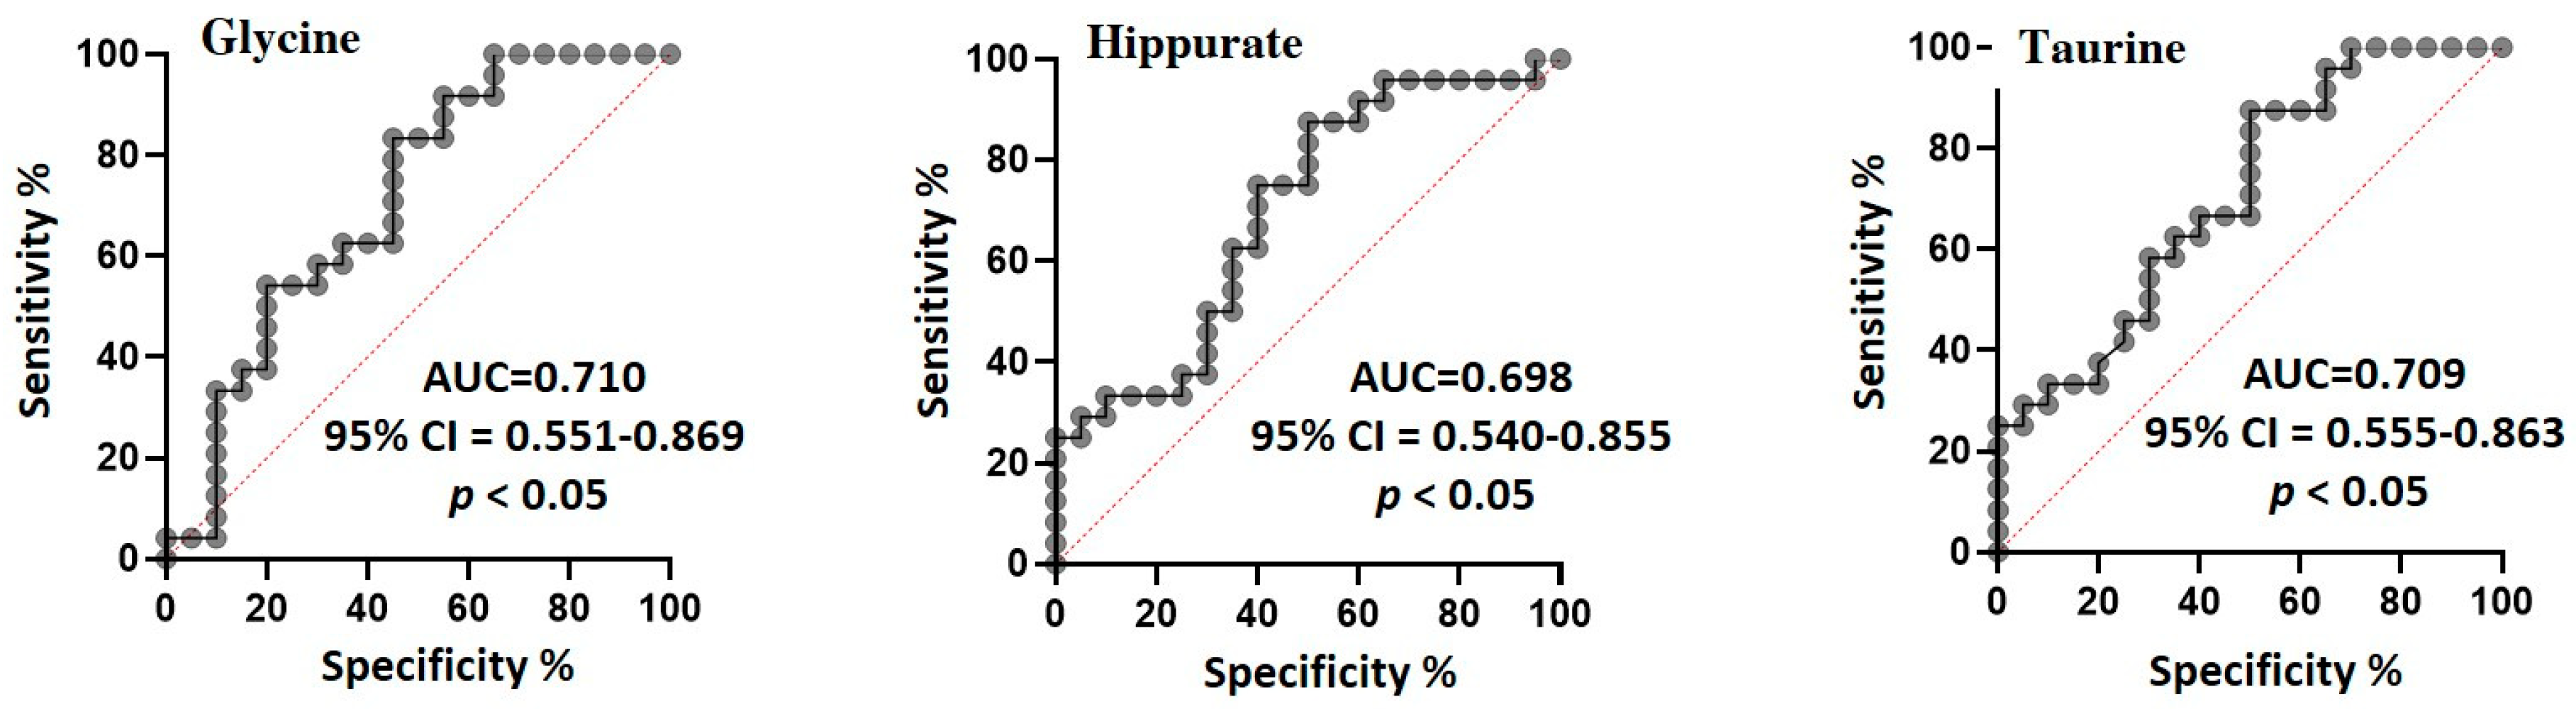
2. Results
3. Discussion
4. Strengths and Limitations of the Study
5. Materials and Methods
5.1. Study Population and Sample Collection
5.2. Chemicals
5.3. Sample Preparation
5.4. 1H NMR Spectroscopy
5.5. Statistical Analysis
6. Conclusions
Author Contributions
Funding
Institutional Review Board Statement
Informed Consent Statement
Data Availability Statement
Conflicts of Interest
Sample Availability
References
- Ward, C. Clinical significance of the bicuspid aortic valve. Heart 2000, 83, 81–85. [Google Scholar] [CrossRef] [Green Version]
- Braverman, A.C.; Guven, H.; Beardslee, M.A.; Makan, M.; Kates, A.M.; Moon, M.R. The bicuspid aortic valve. Curr. Probl. Cardiol. 2005, 30, 470–522. [Google Scholar] [CrossRef] [PubMed]
- Hoffman, J.I.E.; Kaplan, S.; Liberthson, R.R. Prevalence of congenital heart disease. Am. Heart J. 2004, 147, 425–439. [Google Scholar] [CrossRef] [PubMed]
- Tutar, E.; Ekici, F.; Atalay, S.; Nacar, N. The prevalence of bicuspid aortic valve in newborns by echocardiograpic screening. Am. Heart J. 2005, 150, 513–515. [Google Scholar] [CrossRef] [PubMed]
- Garg, V.; Muth, A.N.; Ransom, J.F.; Schluterman, M.K.; Barnes, R.; King, I.N.; Grossfeld, P.D.; Srivastava, D. Mutations in NOTCH1 cause aortic valve disease. Nature 2005, 437, 270–274. [Google Scholar] [CrossRef] [PubMed]
- Shi, L.M.; Tao, J.W.; Qiu, X.B.; Wang, J.; Yuan, F.; Xu, L.; Liu, H.; Li, R.G.; Xu, Y.J.; Wang, Q.; et al. GATA5 loss-of-function mutations associated with congenital bicuspid aortic valve. Int. J. Mol. Med. 2014, 33, 1219–1226. [Google Scholar] [CrossRef] [Green Version]
- Foffa, I.; Ait Ali, L.; Panesi, P.; Mariani, M.; Festa, P.; Botto, N.; Vecoli, C.; Andreassi, M.G. Sequencing of NOTCH1, GATA5, TGFBR1 and TGFBR2 genes in familial cases of bicuspid aortic valve. BMC Med. Genet. 2013, 14, 1–8. [Google Scholar] [CrossRef] [Green Version]
- Prakash, S.K.; Bossé, Y.; Muehlschlegel, J.D.; Michelena, H.I.; Limongelli, G.; Della Corte, A.; Pluchinotta, F.R.; Russo, M.G.; Evangelista, A.; Benson, D.W.; et al. A roadmap to investigate the genetic basis of bicuspid aortic valve and its complications: Insights from the international BAVCon (bicuspid aortic valve consortium). J. Am. Coll. Cardiol. 2014, 64, 832–839. [Google Scholar] [CrossRef] [Green Version]
- Michelena, H.I.; Khanna, A.D.; Mahoney, D.; Margaryan, E.; Topilsky, Y.; Suri, R.M.; Eidem, B.; Edwards, W.D.; Sundt, T.M.; Enriquez-Sarano, M. Incidence of aortic complications in patients with bicuspid aortic valves. JAMA 2011, 306, 1104–1112. [Google Scholar] [CrossRef] [Green Version]
- Nicholson, J.K.; Lindon, J.C.; Holmes, E. ‘Metabonomics’: Understanding the metabolic responses of living systems to pathophysiological stimuli via multivariate statistical analysis of biological NMR spectroscopic data. Xenobiotica 1999, 29, 1181–1189. [Google Scholar] [CrossRef]
- Li, B.; He, X.; Jia, W.; Li, H. Novel Applications of Metabolomics in Personalized Medicine: A Mini-Review. Molecules 2017, 22, 1173. [Google Scholar] [CrossRef]
- Ussher, J.R.; Elmariah, S.; Gerszten, R.E.; Dyck, J.R. The Emerging Role of Metabolomics in the Diagnosis and Prognosis of Cardiovascular Disease. J. Am. Coll. Cardiol. 2016, 68, 2850–2870. [Google Scholar]
- Li, T.; Zhang, Z.; Kolwicz, S.C.; Abell, L.; Roe, N.D.; Kim, M.; Zhou, B.; Cao, Y.; Ritterhoff, J.; Gu, H.; et al. Defective branched-chain amino acid catabolism disrupts glucose metabolism and sensitizes the heart to ischemia-reperfusion injury. Cell Metab. 2017, 25, 374–385. [Google Scholar] [CrossRef] [PubMed] [Green Version]
- Shah, S.H.; Sun, J.L.; Stevens, R.D.; Bain, J.R.; Muehlbauer, M.J.; Pieper, K.S.; Haynes, C.; Hauser, E.R.; Kraus, W.E.; Granger, C.B.; et al. Baseline metabolomic profiles predict cardiovascular events in patients at risk for coronary artery disease. Am. Heart J. 2012, 163, 844–850.e1. [Google Scholar] [CrossRef] [PubMed]
- Dunn, W.B.; Broadhurst, D.I.; Deepak, S.M.; Buch, M.H.; McDowell, G.; Spasic, I.; Ellis, D.I.; Brooks, N.; Kell, D.B.; Neyses, L. Serum metabolomics reveals many novel metabolic markers of heart failure, including pseudouridine and 2-oxoglutarate. Metabolomics 2007, 3, 413–426. [Google Scholar] [CrossRef]
- Wang, W.; Maimaiti, A.; Zhao, Y.; Zhang, L.; Tao, H.; Nian, H.; Xia, L.; Kong, B.; Wang, C.; Liu, M.; et al. Analysis of Serum Metabolites to Diagnose Bicuspid Aortic Valve. Sci. Rep. 2016, 6, 37023. [Google Scholar] [CrossRef] [PubMed] [Green Version]
- Doppler, C.; Arnhard, K.; Dumfarth, J.; Heinz, K.; Messner, B.; Stern, C.; Koal, T.; Klavins, K.; Danzl, K.; Pitterl, F.; et al. Metabolomic profiling of ascending thoracic aortic aneurysms and dissections–Implications for pathophysiology and biomarker discovery. PLoS ONE 2017, 12, e0176727. [Google Scholar] [CrossRef] [PubMed]
- Martínez-Micaelo, N.; Ligero, C.; Antequera-González, B.; Junza, A.; Yanes, O.; Alegret, J.M. Plasma Metabolomic Profiling Associates Bicuspid Aortic Valve Disease and Ascending Aortic Dilation with a Decrease in Antioxidant Capacity. J. Clin. Med. 2020, 9, 2215. [Google Scholar] [CrossRef]
- Marrachelli, V.G.; Rentero, P.; Mansego, M.L.; Morales, J.M.; Galan, I.; Pardo-Tendero, M.; Martinez, F.; Martin-Escudero, J.C.; Briongos, L.; Chaves, F.J. Genomic and metabolomic profile associated to clustering of cardio-metabolic risk factors. PLoS ONE. 2016, 11, e0160656. [Google Scholar] [CrossRef]
- Lang, R.M.; Badano, L.P.; Mor-Avi, V.; Afilalo, J.; Armstrong, A.; Ernande, L.; Flachskampf, F.A.; Foster, E.; Goldstein, S.A.; Kuznetsova, T.; et al. Recommendations for cardiac chamber quantification by echocardiography in adults: An update from the American Society of Echocardiography and the European Association of Cardiovascular Imaging Eur. Heart J. Cardiovasc. Imaging 2015, 16, 233–271. [Google Scholar]
- Mamas, M.; Dunn, W.B.; Neyes, L.; Goodacre, R. The role of metabolites and metabolomics in clinically applicable biomarkers of disease. Arch. Toxicol. 2011, 85, 5–17. [Google Scholar] [CrossRef] [PubMed]
- Jacob, M.; Lopata, A.L.; Dasouki, M.; Rahman, A.M.A. Metabolomics toward personalized medicine. Mass. Spec. Rev. 2019, 38, 221–238. [Google Scholar] [CrossRef]
- Lewis, G.D.; Asnani, A.; Gerszten, R.E. Application of Metabolomics to Cardiovascular Biomarker and Pathway Discovery. J. Am. Coll. Cardiol. 2008, 52, 117–123. [Google Scholar] [CrossRef] [Green Version]
- Barderas, M.G.; Laborde, C.M.; Posada, M.; de La Cuesta, F.; Zubiri, I.; Vivanco, F.; Alvarez-Llamas, G. Metabolomic Profiling for Identification of Novel Potential Biomarkers in Cardiovascular Diseases. J. Biomed. Biotechnol. 2011, 2011, 790132. [Google Scholar] [CrossRef] [Green Version]
- Ruiz-Canela, M.; Hruby, A.; Clish, C.-B.; Liang, L.; Martínez-González, M.A.; Hu, F.B. Comprehensive metabolomic profiling and incident cardiovascular disease: A systematic review. J. Am. Heart Assoc. 2017, 6, e005705. [Google Scholar] [CrossRef] [Green Version]
- Kim, E.; HoonsikNam, H.; Kim, J.J.; Park, S.; Kim, Y.K. Urine-NMR metabolomics for screening of advanced colorectal adenoma and early stage colorectal cancer. Sci. Rep. 2019, 9, 4786. [Google Scholar] [CrossRef] [PubMed]
- Yang, B.; Zhang, C.; Cheng, S.; Li, G.; Griebel, J.; Neuhaus, J. Novel Metabolic Signatures of Prostate Cancer Revealed by 1H-NMR Metabolomics of Urine. Diagnostics 2021, 11, 149. [Google Scholar] [CrossRef] [PubMed]
- Zhao, H.; Liu, Y.; Li, Z.; Song, Y.; Cai, X.; Liu, Y.; Zhang, T.; Yang, L.; Li, L.; Gao, S.; et al. Identification of essential hypertension biomarkers in human urine by non-targeted metabolomics based on UPLC-Q-TOF/MS. Clin. Chim. Acta 2018, 486, 192–198. [Google Scholar] [CrossRef] [PubMed]
- Lees, H.J.; Swann, J.R.; Wilson, I.D.; Nicholson, J.K.; Holmes, E. Hippurate: The Natural History of a Mammalian–Microbial Cometabolite. J. Proteome Res. 2013, 12, 1527–1546. [Google Scholar] [CrossRef]
- Kitai, T.; Tang, W.H. Gut microbiota in cardiovascular disease and heart failure. Clin. Sci. 2018, 132, 85–91. [Google Scholar] [CrossRef] [PubMed]
- Refsum, H.; Ueland, P.M.; Nygård, O.; Vollset, S.E. Homocysteine and Cardiovascular Disease. Annu. Rev. Med. 1998, 49, 31–62. [Google Scholar] [CrossRef]
- Wang, Z.; Wilson Tang, W.H. Prognostic value of choline and betaine depends on intestinal microbiota-generated metabolite trimethylamine-N-oxide. Eur. Heart J. 2014, 35, 904–910. [Google Scholar] [CrossRef]
- Wang, Z.; Klipfell, E.; Bennett, B.J.; Koeth, R.; Levison, B.S.; Dugar, B.; Feldstein, A.E.; Britt, E.B.; Fu, X.; Chung, Y.M.; et al. Gut flora metabolism of phosphatidylcholine promotes cardiovascular disease. Nature 2011, 472, 57–63. [Google Scholar] [CrossRef] [PubMed] [Green Version]
- Li, X.S.; Wang, Z.; Cajka, T.; Buffa, J.A.; Nemet, I.; Hurd, A.G.; Gu, X.; Skye, S.M.; Roberts, A.B.; Wu, Y.; et al. Untargeted metabolomics identifies trimethyllysine, a TMAO-producing nutrient precursor, as a predictor of incident cardiovascular disease risk. JCI Insight 2018, 3, e99096. [Google Scholar] [CrossRef] [PubMed] [Green Version]
- Schaffer, S.W.; Shimada-Takaura, K.; Jong, C.J.; Ito, T.; Takahashi, K. Impaired energy metabolism of the taurine-deficient heart. Amino Acids 2016, 48, 549–558. [Google Scholar] [CrossRef] [PubMed]
- Ripps, H.; Shen, W. Review: Taurine: A ‘very essential’ amino acid. Mol. Vis. 2012, 18, 2673–2686. [Google Scholar] [PubMed]
- Wójcik, O.; Koenig, K.; Zeleniuch-Jacquotte, A.; Costa, M.; Chen, Y. The potential protective effects of taurine on coronary heart disease. Atherosclerosis 2010, 208, 19–25. [Google Scholar] [CrossRef] [Green Version]
- Lommi, J.; Koskinen, P.; Näveri, H.; Härkönen, M.; Kupari, M. Heart failure ketosis. J. Intern. Med. 1997, 242, 231–238. [Google Scholar] [CrossRef]
- Du, Z.; Shen, A.; Huang, Y.; Su, L.; Lai, W.; Wang, P.; Xie, Z.; Xie, Z.; Zeng, Q.; Ren, H.; et al. 1H-NMR-based metabolic analysis of human serum reveals novel markers of myocardial energy expenditure in heart failure patients. PLoS ONE 2014, 9, e88102. [Google Scholar] [CrossRef]
- Zordoky, B.N.; Sung, M.M.; Ezekowitz, J.; Mandal, R.; Han, B.; Bjorndahl, T.C.; Bouatra, S.; Anderson, T.; Oudit, G.Y.; Wishart, D.D.; et al. Metabolomic fingerprint of heart failure with preserved ejection fraction. PLoS ONE 2015, 10, e0124844. [Google Scholar] [CrossRef]
- Zima, A.V.; Blatter, L.A. Redox regulation of cardiac calcium channels and transporters. Cardiovasc. Res. 2006, 71, 310–321. [Google Scholar] [CrossRef]
- Jiang, L.; Wang, J.; Li, R.; Fang, Z.; Zhu, X.H.; Yi, X.; Lan, H.; Wei, X.; Jiang, D.S. Disturbed energy and amino acid metabolism with their diagnostic potential in mitral valve disease revealed by untargeted plasma metabolic profiling. Metabolomics 2019, 15, 1–12. [Google Scholar] [CrossRef] [PubMed]
- Wang, W.; Wu, Z.; Dai, Z.L.; Yang, Y.; Wang, J.J.; Wu, G. Glycine metabolism in animals and humans: Implications for nutrition and health. Amino Acids 2013, 45, 463–477. [Google Scholar] [CrossRef] [PubMed]
- Ding, Y.; Svingen, G.; Pedersen, E.R.; Gregory, J.F.; Ueland, P.M.; Tell, G.S.; Nygard, O.K. Plasma glycine and risk of acute myocardial infarction in patients with suspected stable angina pectoris. J. Am. Heart Assoc. 2016, 5, e002621. [Google Scholar] [CrossRef] [PubMed] [Green Version]
- Van den Eynden, J.; Ali, S.S.; Horwood, N.; Carmans, S.; Brone, B.; Hellings, N. Glycine and glycine receptor signalling in non-neuronal cells. Front. Mol. Neurosci. 2009, 2, 9. [Google Scholar] [CrossRef] [PubMed] [Green Version]
- Ruiz-Ramírez, A.; Ortiz-Balderas, E.; Cardozo-Saldaña, G.; Diaz-Diaz, E.; El-Hafidi, M. Glycine restores glutathione and protects against oxidative stress in vascular tissue from sucrose-fed rats. Clin. Sci. 2014, 126, 19–29. [Google Scholar] [CrossRef]
- Xiong, T.Y.; Liu, C.; Liao, Y.B.; Zheng, W.; Li, Y.J.; Li, X.; Ou, Y.; Wang, Z.J.; Wang, X.; Li, C.M.; et al. Differences in metabolic profiles between bicuspid and tricuspid aortic stenosis in the setting of transcatheter aortic valve replacement. BMC Cardiovasc. Disord. 2020, 20, 229. [Google Scholar] [CrossRef]
- Dieterle, F.; Ross, A.; Schlotterbeck, G.; Senn, H. Probabilistic Quotient Normalization as Robust Method to Account for Dilution of Complex Biological Mixtures. Application in 1H NMR Metabonomics. Anal. Chem. 2006, 78, 4281–4290. [Google Scholar] [CrossRef]
- Hotelling, H. Analysis of a complex of statistical variables into principal components. J. Educ. Psychol. 1933, 24, 417–441. [Google Scholar] [CrossRef]
- Cloarec, O.; Dumas, M.E.; Trygg, J.; Craig, A.; Barton, R.H.; Lindon, J.C.; Nicholson, J.K.; Holmes, E. Evaluation of the orthogonal projection on latent structure model limitations caused by chemical shift variability and improved visualization of biomarker changes in 1H NMR spectroscopic metabonomic studies. Anal. Chem. 2005, 77, 517–526. [Google Scholar] [CrossRef]
- Eriksson, L.; Trygg, J.; Wold, S. CV-ANOVA for significance testing of PLS and OPLS models. J. Chemom. J. Chemom. Soc. 2008, 22, 594–600. [Google Scholar] [CrossRef]
- Metz, C.E. Basic principles of ROC analysis. Semin. Nucl. Med. 1978, 8, 283–298. [Google Scholar]
- Tynkkynen, T.; Wang, Q.; Ekholm, J.; Anufrieva, O.; Ohukainen, P.; Vepsäläinen, J.; Männikkö, M.; Keinänen-Kiukaanniemi, S.; Holmes, M.V.; Goodwin, M.; et al. Proof of concept for quantitative urine NMR metabolomics pipeline for large-scale epidemiology and genetics. Int. J. Epidemiol. 2019, 48, 978–993. [Google Scholar] [CrossRef] [PubMed] [Green Version]
- Bouatra, S.; Aziat, F.; Mandal, R.; Guo, A.C.; Wilson, M.R.; Knox, C.; Bjorndahl, T.C.; Krishnamurthy, R.; Saleem, F.; Liu, P.; et al. The human urine metabolome. PLoS ONE 2013, 8, e73076. [Google Scholar] [CrossRef] [Green Version]
- Xia, J.; Wishart, D.S. MetPA: A web-based metabolomics tool for pathway analysis and visualization. Bioinformatics 2010, 26, 2342–2344. [Google Scholar] [CrossRef] [PubMed] [Green Version]
- Berben, L.; Sereika, S.M.; Engberg, S. Effect size estimation: Methods and examples. Int. J. Nurs. Stud. 2012, 49, 1039–1047. [Google Scholar] [CrossRef]


| BAV | Controls | p-Value | |
|---|---|---|---|
| Number | 20 | 24 | - |
| Age, yrs | 40.1 (18–74) | 42.7 (23–69) | 0.600 |
| Males, n (%) | 17 (85) | 14 (58) | 0.055 |
| Weight, kg | 75.15 ± 7.47 | 71.8 ± 8.1 | 0.169 |
| Height, cm | 175 (152–189) | 177 (158–186) | 0.389 |
| BMI, kg/m2 | 24.60 ± 2.48 | 23.36. ± 1.88 | 0.687 |
| BSADB, m2 | 1.90 ± 0.12 | 1.79 ± 0.14 | 0.014 |
| HR, bpm | 69.95 ± 11.76 | 72.28 ± 11.85 | 0.514 |
| Smoking, n (%) | 5 (25) | 6 (25) | 1.00 |
| BAV (n = 20) | Controls (n = 24) | p-Value | |
|---|---|---|---|
| Aortic root | |||
| Annulus (mm) | 23.6 (20–26) | 21.83 (19–25) | 0.023 |
| Sinuses of Valsalva (mm) | 28.5 (28–34) | 26.12 (25–28) | 0.015 |
| Sinotubular junction (mm) | 27.54 ± 3.87 | 25.29 ± 2.31 | 0.024 |
| Ascending Aorta (mm) | 28.65 ± 4.3 | 26.20 ± 2.63 | 0.021 |
| Left ventricular | |||
| ESV index (mL/m2) | 21.85 ± 6.19 | 17.90 ± 3.88 | 0.014 |
| EDV index (mL/m2) | 61.95 ± 9.98 | 54.29 ± 10.12 | 0.015 |
| SV index (mL/m2) | 39.49 ± 7.67 | 32.83 ± 9.63 | 0.043 |
| EF (%) | 61.71 ± 8.44 | 64.04 ± 4.73 | 0.406 |
| BAV morphology | |||
| Type 1, n (%) | 12 (60) | - | - |
| Type 2, n (%) | 8 (40) | - | - |
Publisher’s Note: MDPI stays neutral with regard to jurisdictional claims in published maps and institutional affiliations. |
© 2021 by the authors. Licensee MDPI, Basel, Switzerland. This article is an open access article distributed under the terms and conditions of the Creative Commons Attribution (CC BY) license (https://creativecommons.org/licenses/by/4.0/).
Share and Cite
Chessa, M.; Panebianco, M.; Corbu, S.; Lussu, M.; Dessì, A.; Pintus, R.; Cesare Marincola, F.; Fanos, V. Urinary Metabolomics Study of Patients with Bicuspid Aortic Valve Disease. Molecules 2021, 26, 4220. https://doi.org/10.3390/molecules26144220
Chessa M, Panebianco M, Corbu S, Lussu M, Dessì A, Pintus R, Cesare Marincola F, Fanos V. Urinary Metabolomics Study of Patients with Bicuspid Aortic Valve Disease. Molecules. 2021; 26(14):4220. https://doi.org/10.3390/molecules26144220
Chicago/Turabian StyleChessa, Massimo, Mario Panebianco, Sara Corbu, Milena Lussu, Angelica Dessì, Roberta Pintus, Flaminia Cesare Marincola, and Vassilios Fanos. 2021. "Urinary Metabolomics Study of Patients with Bicuspid Aortic Valve Disease" Molecules 26, no. 14: 4220. https://doi.org/10.3390/molecules26144220
APA StyleChessa, M., Panebianco, M., Corbu, S., Lussu, M., Dessì, A., Pintus, R., Cesare Marincola, F., & Fanos, V. (2021). Urinary Metabolomics Study of Patients with Bicuspid Aortic Valve Disease. Molecules, 26(14), 4220. https://doi.org/10.3390/molecules26144220