
In Silico Approach Using Free Software to Optimize the Antiproliferative Activity and Predict the Potential Mechanism of Action of Pyrrolizine-Based Schiff Bases

 ,
,  , , and
Abstract
:1. Introduction
2. Results and Discussion
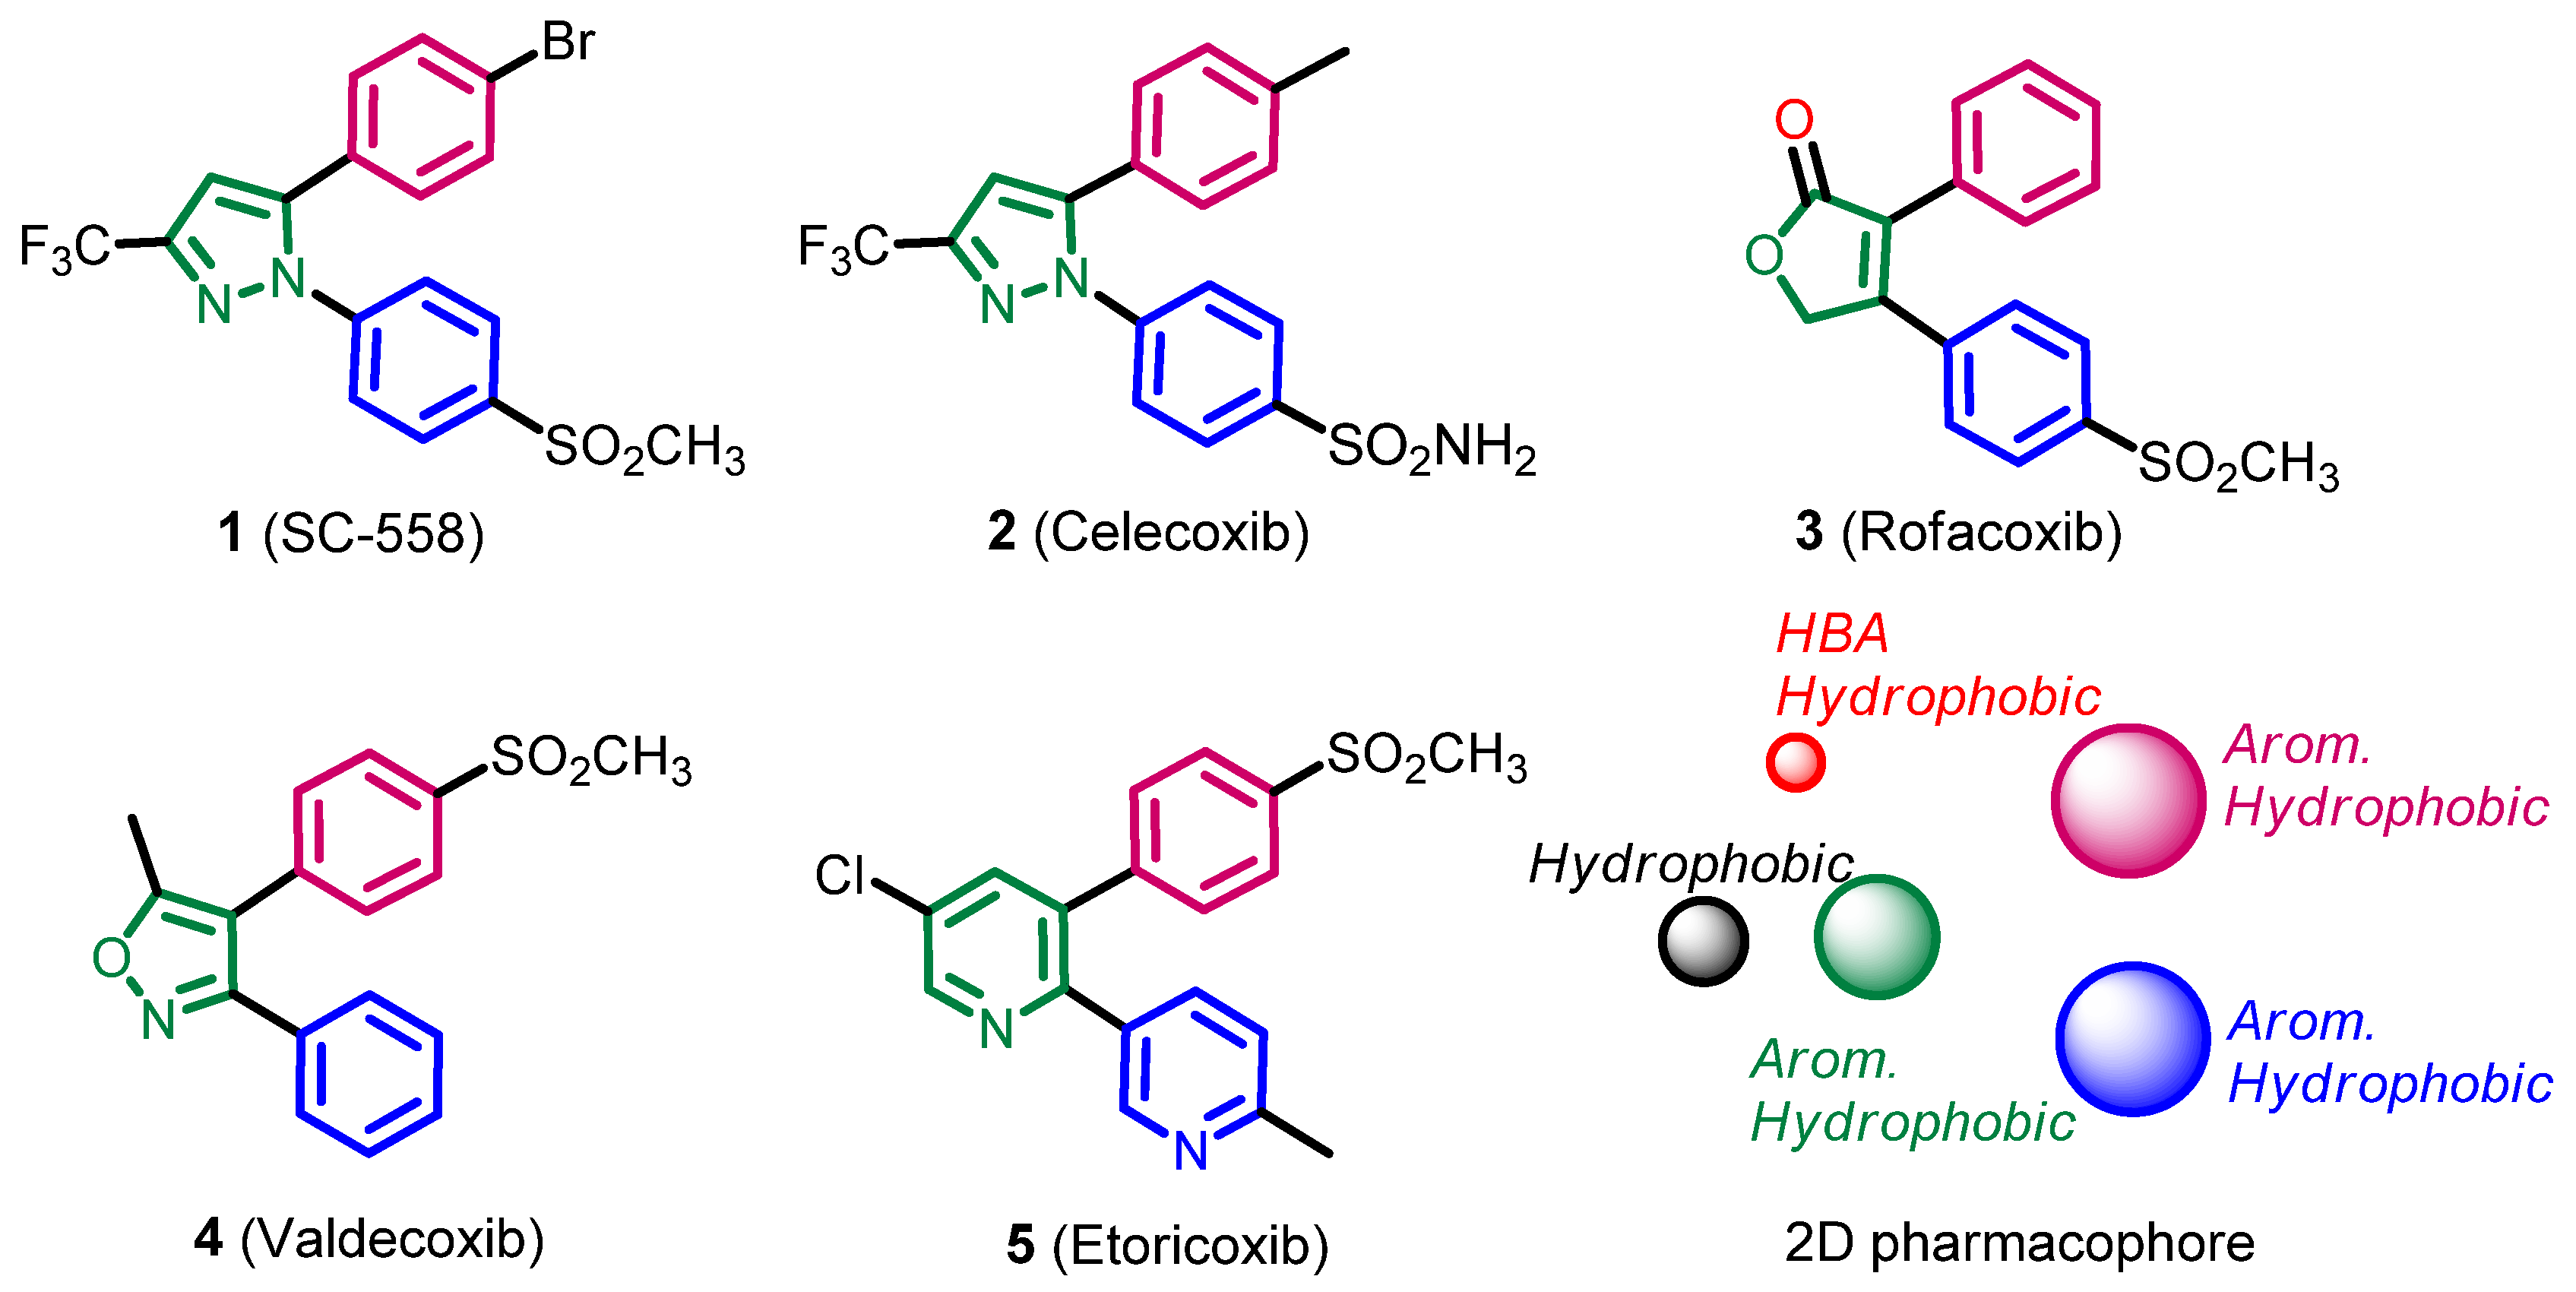
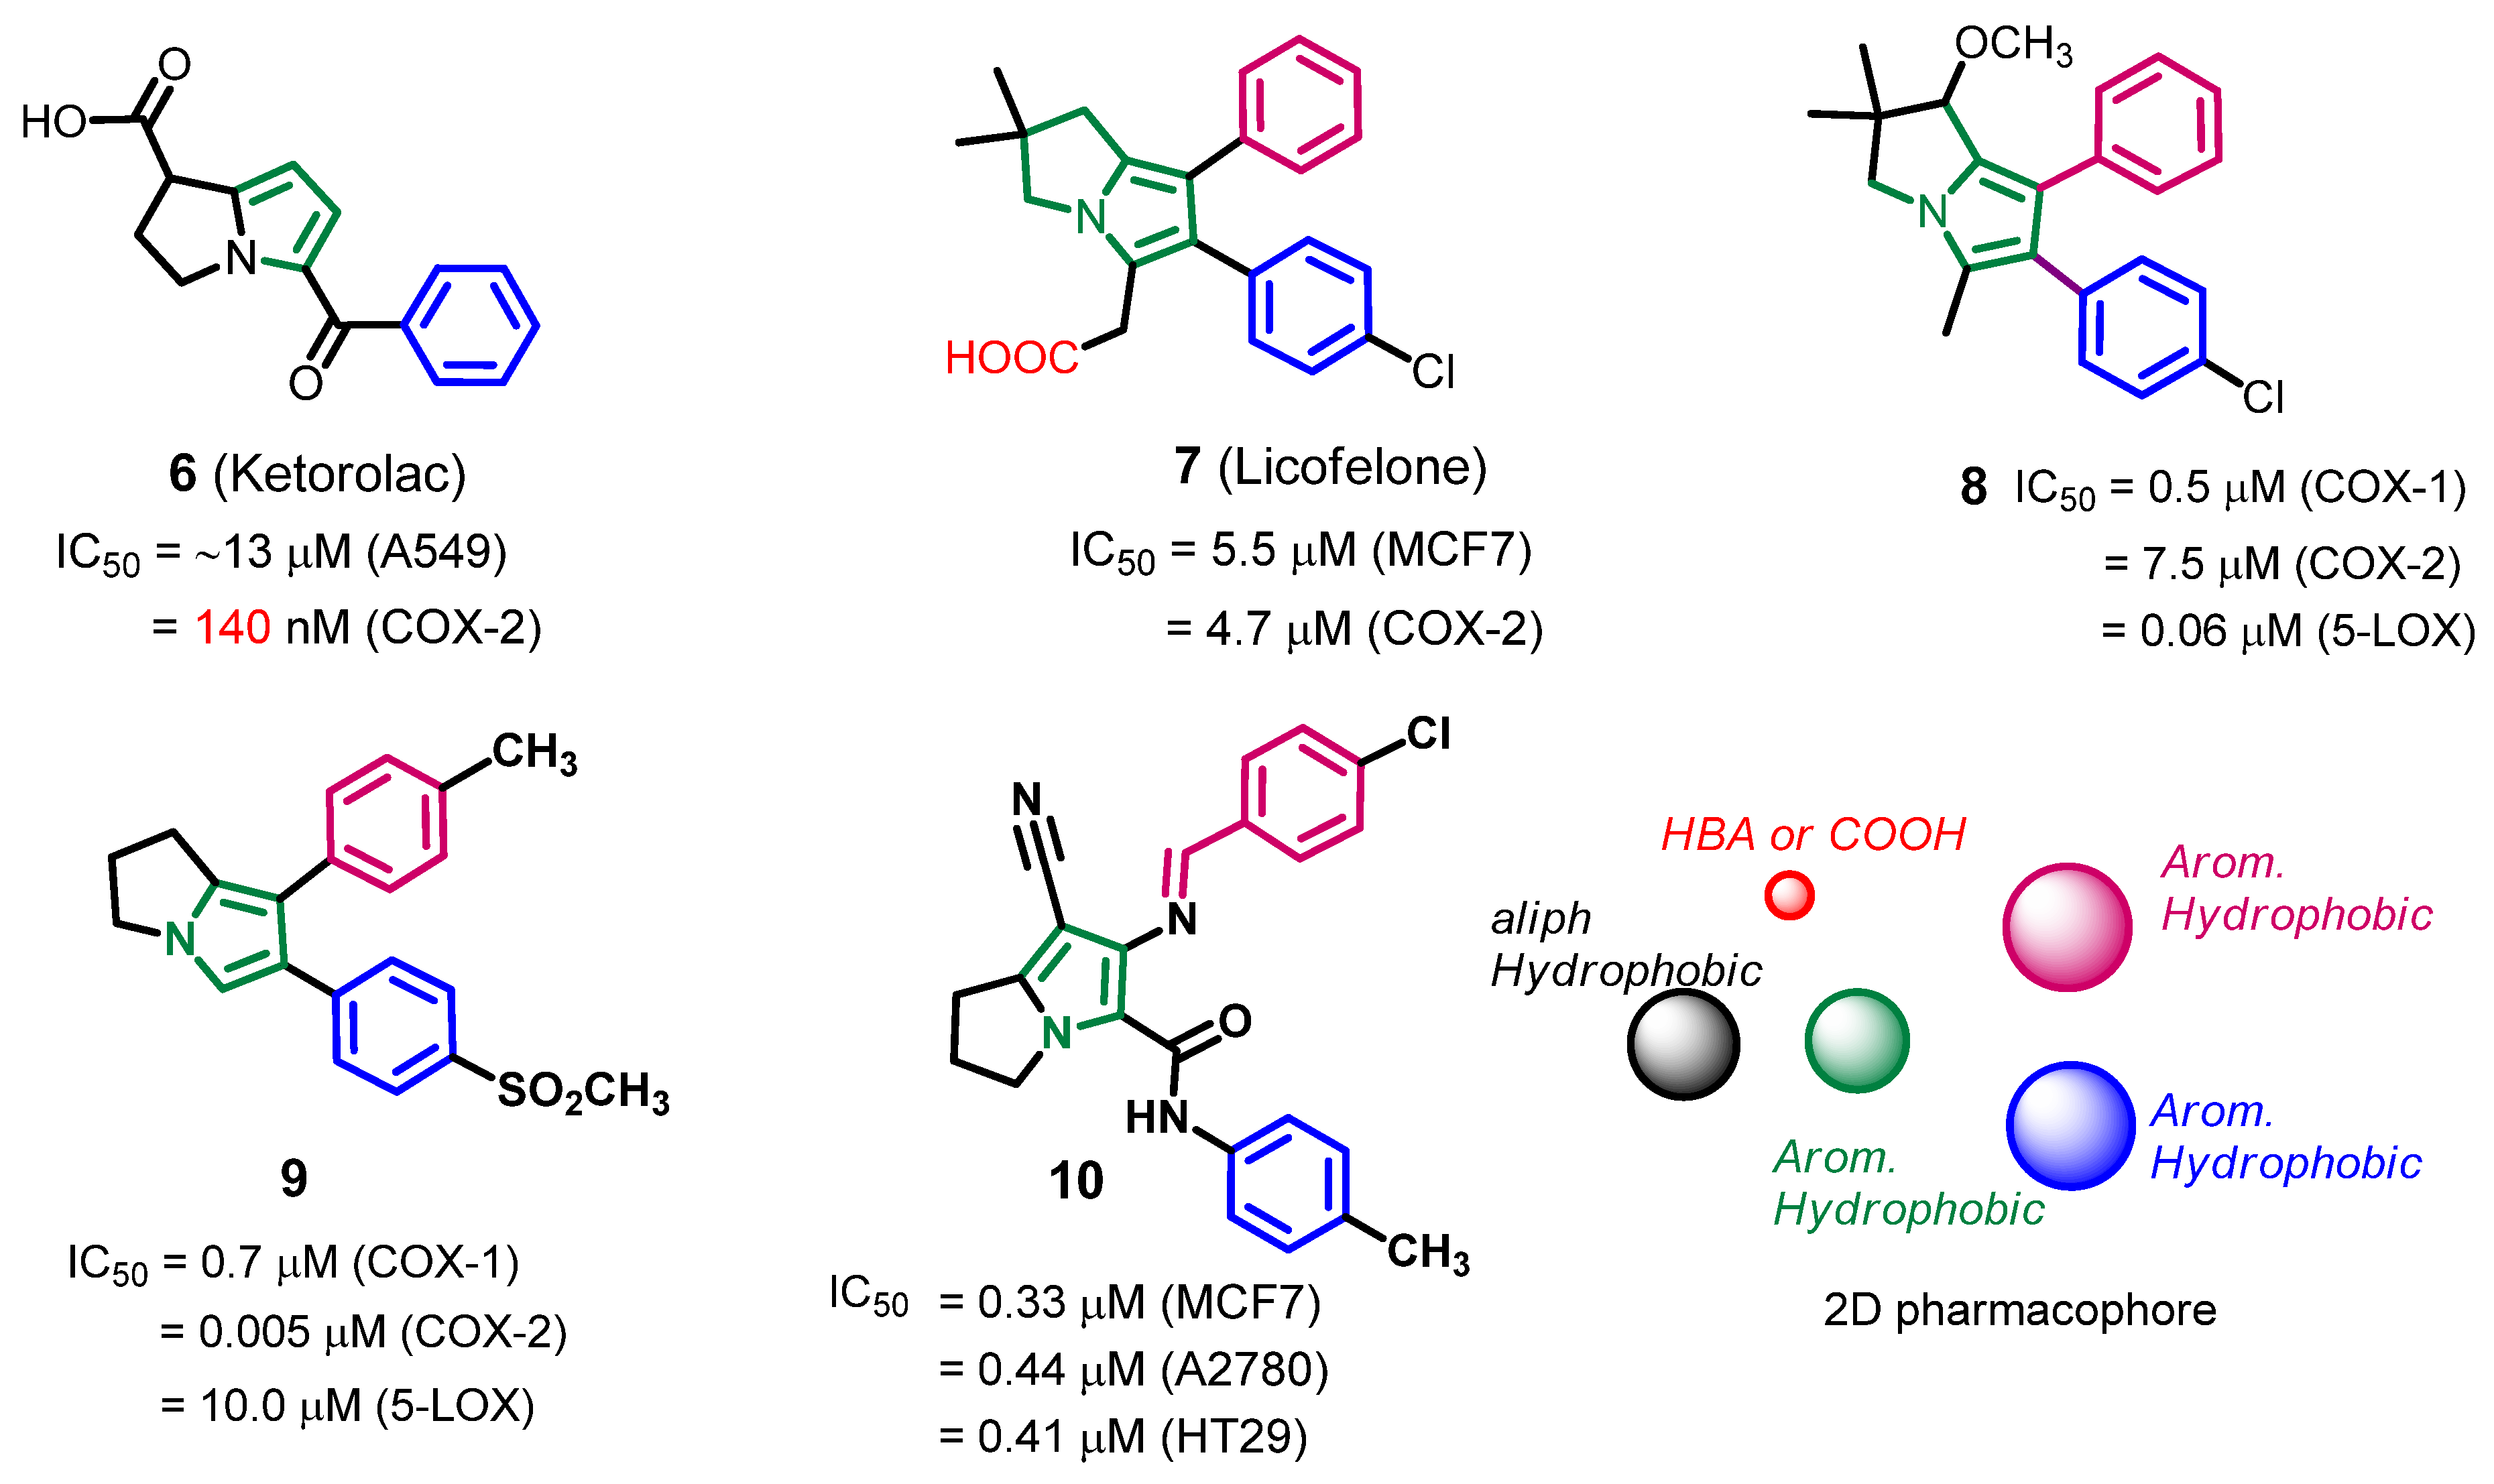
2.1. Pharmacophore Search
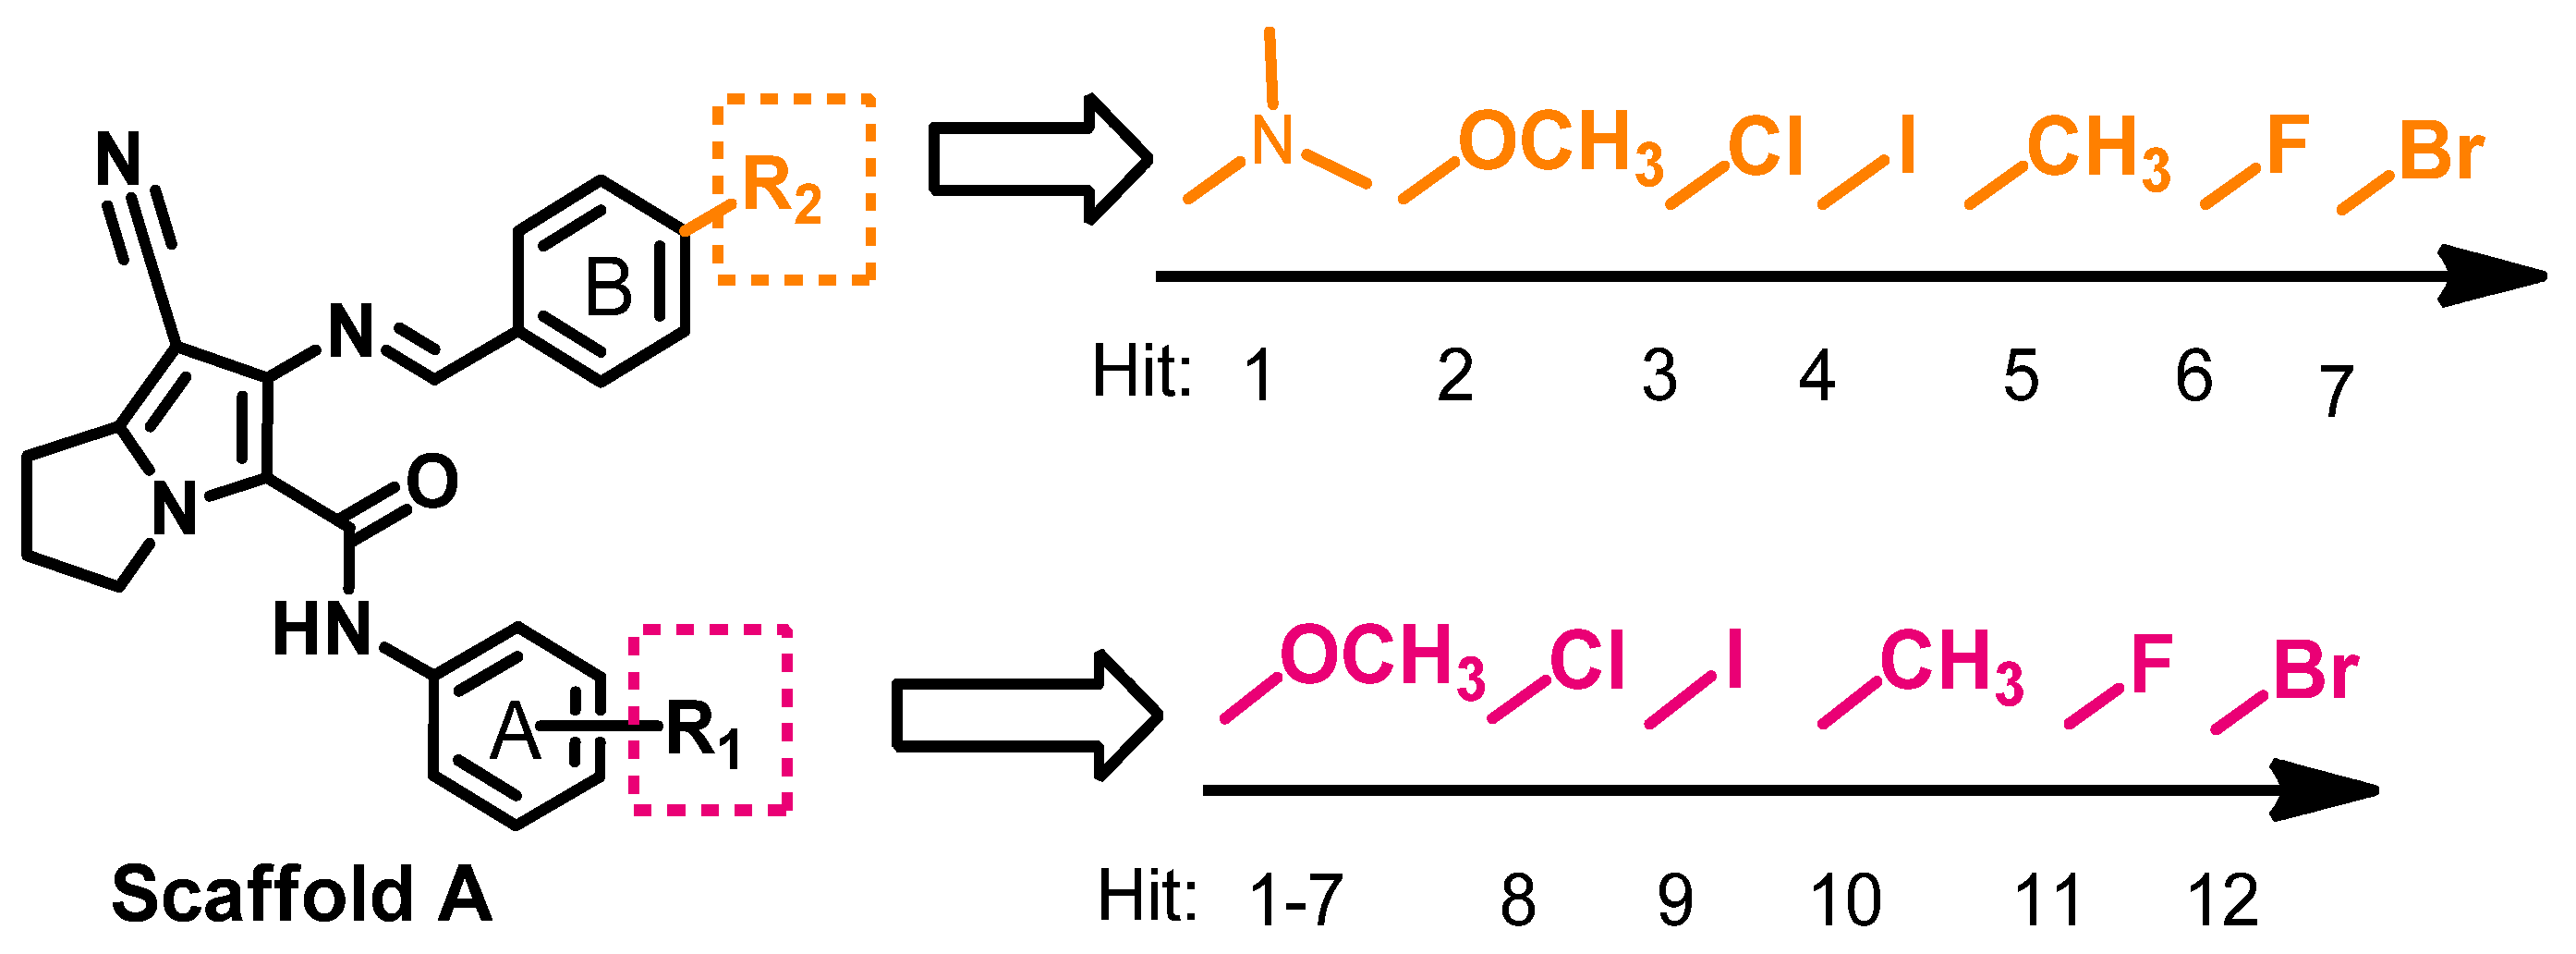
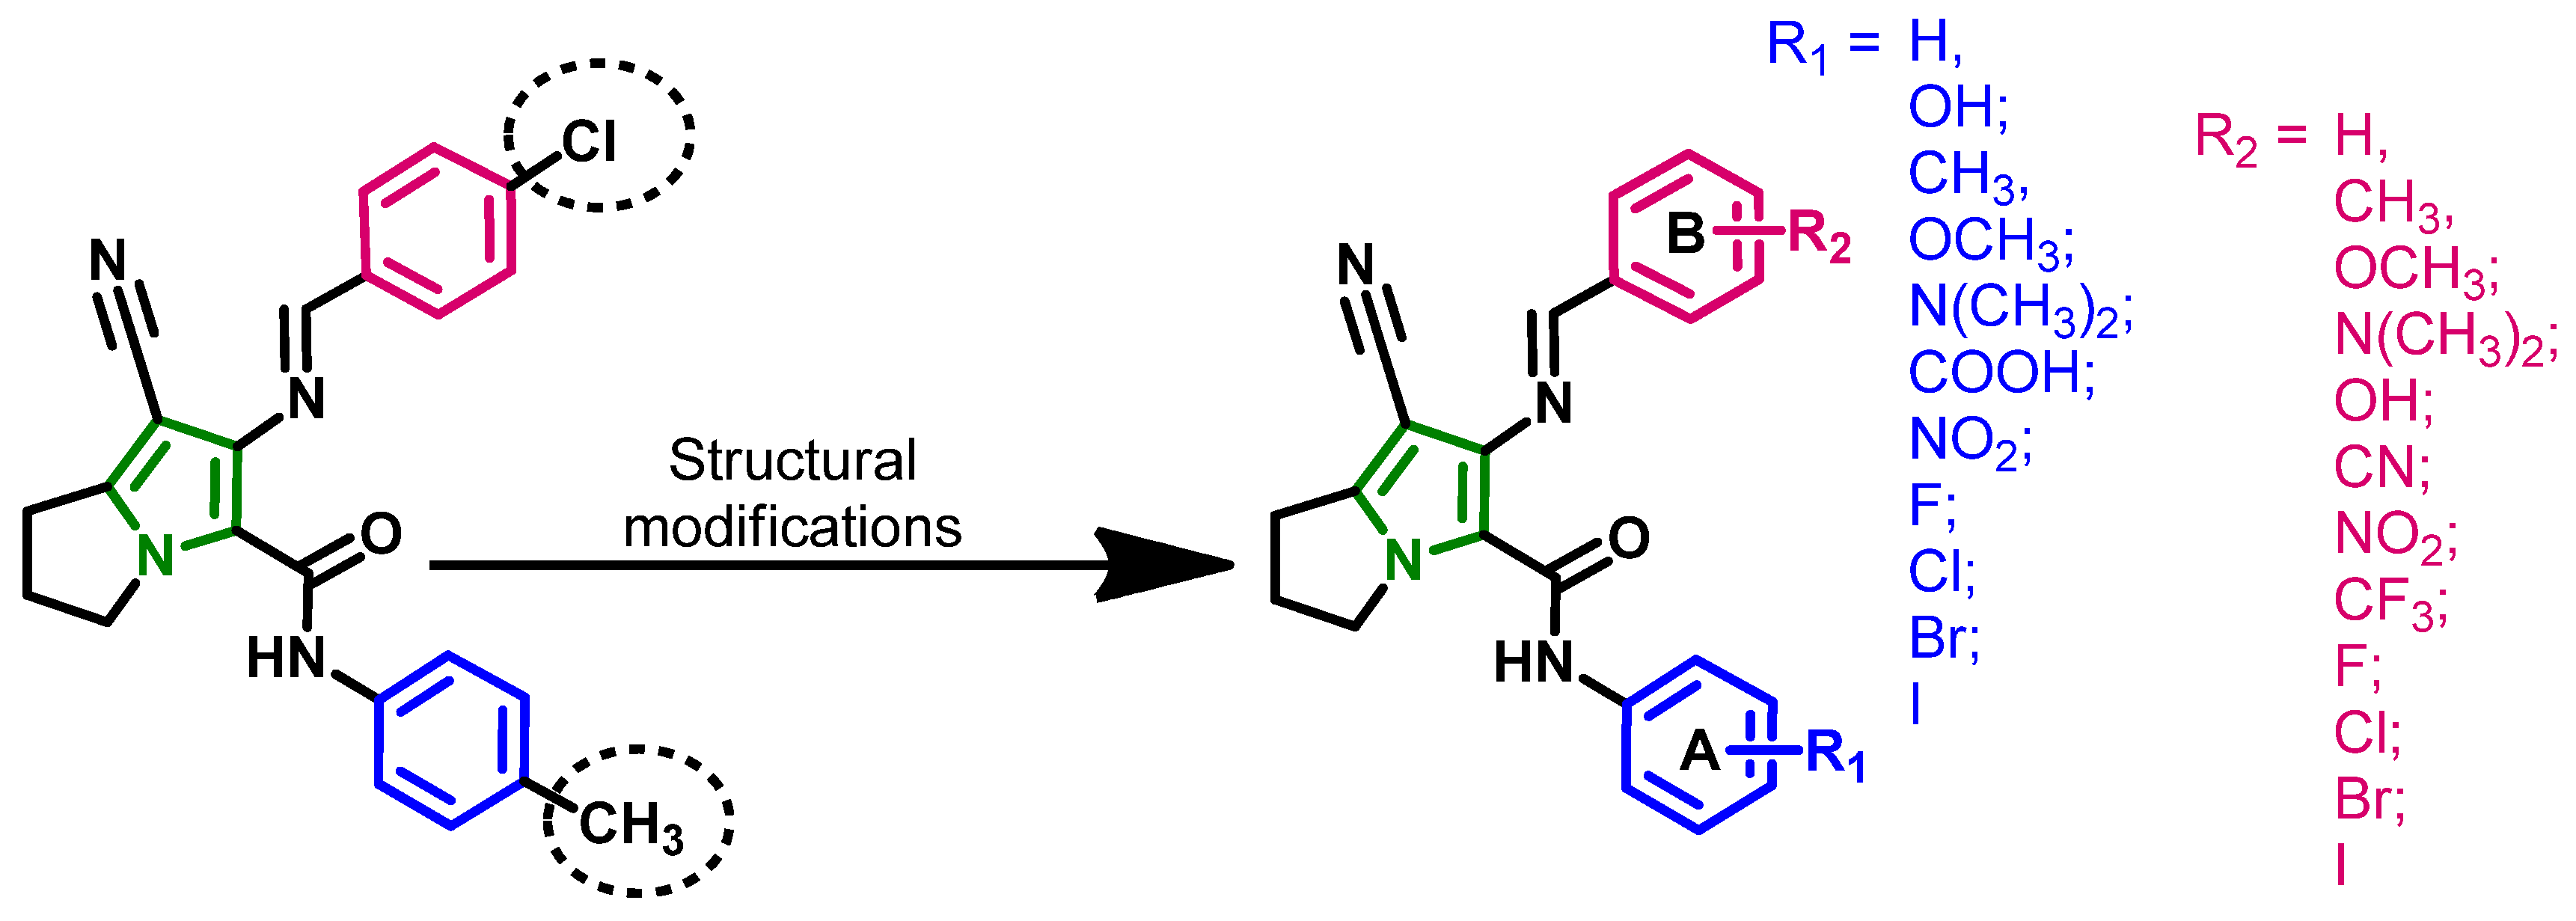
2.1.1. Design of the Compound Library
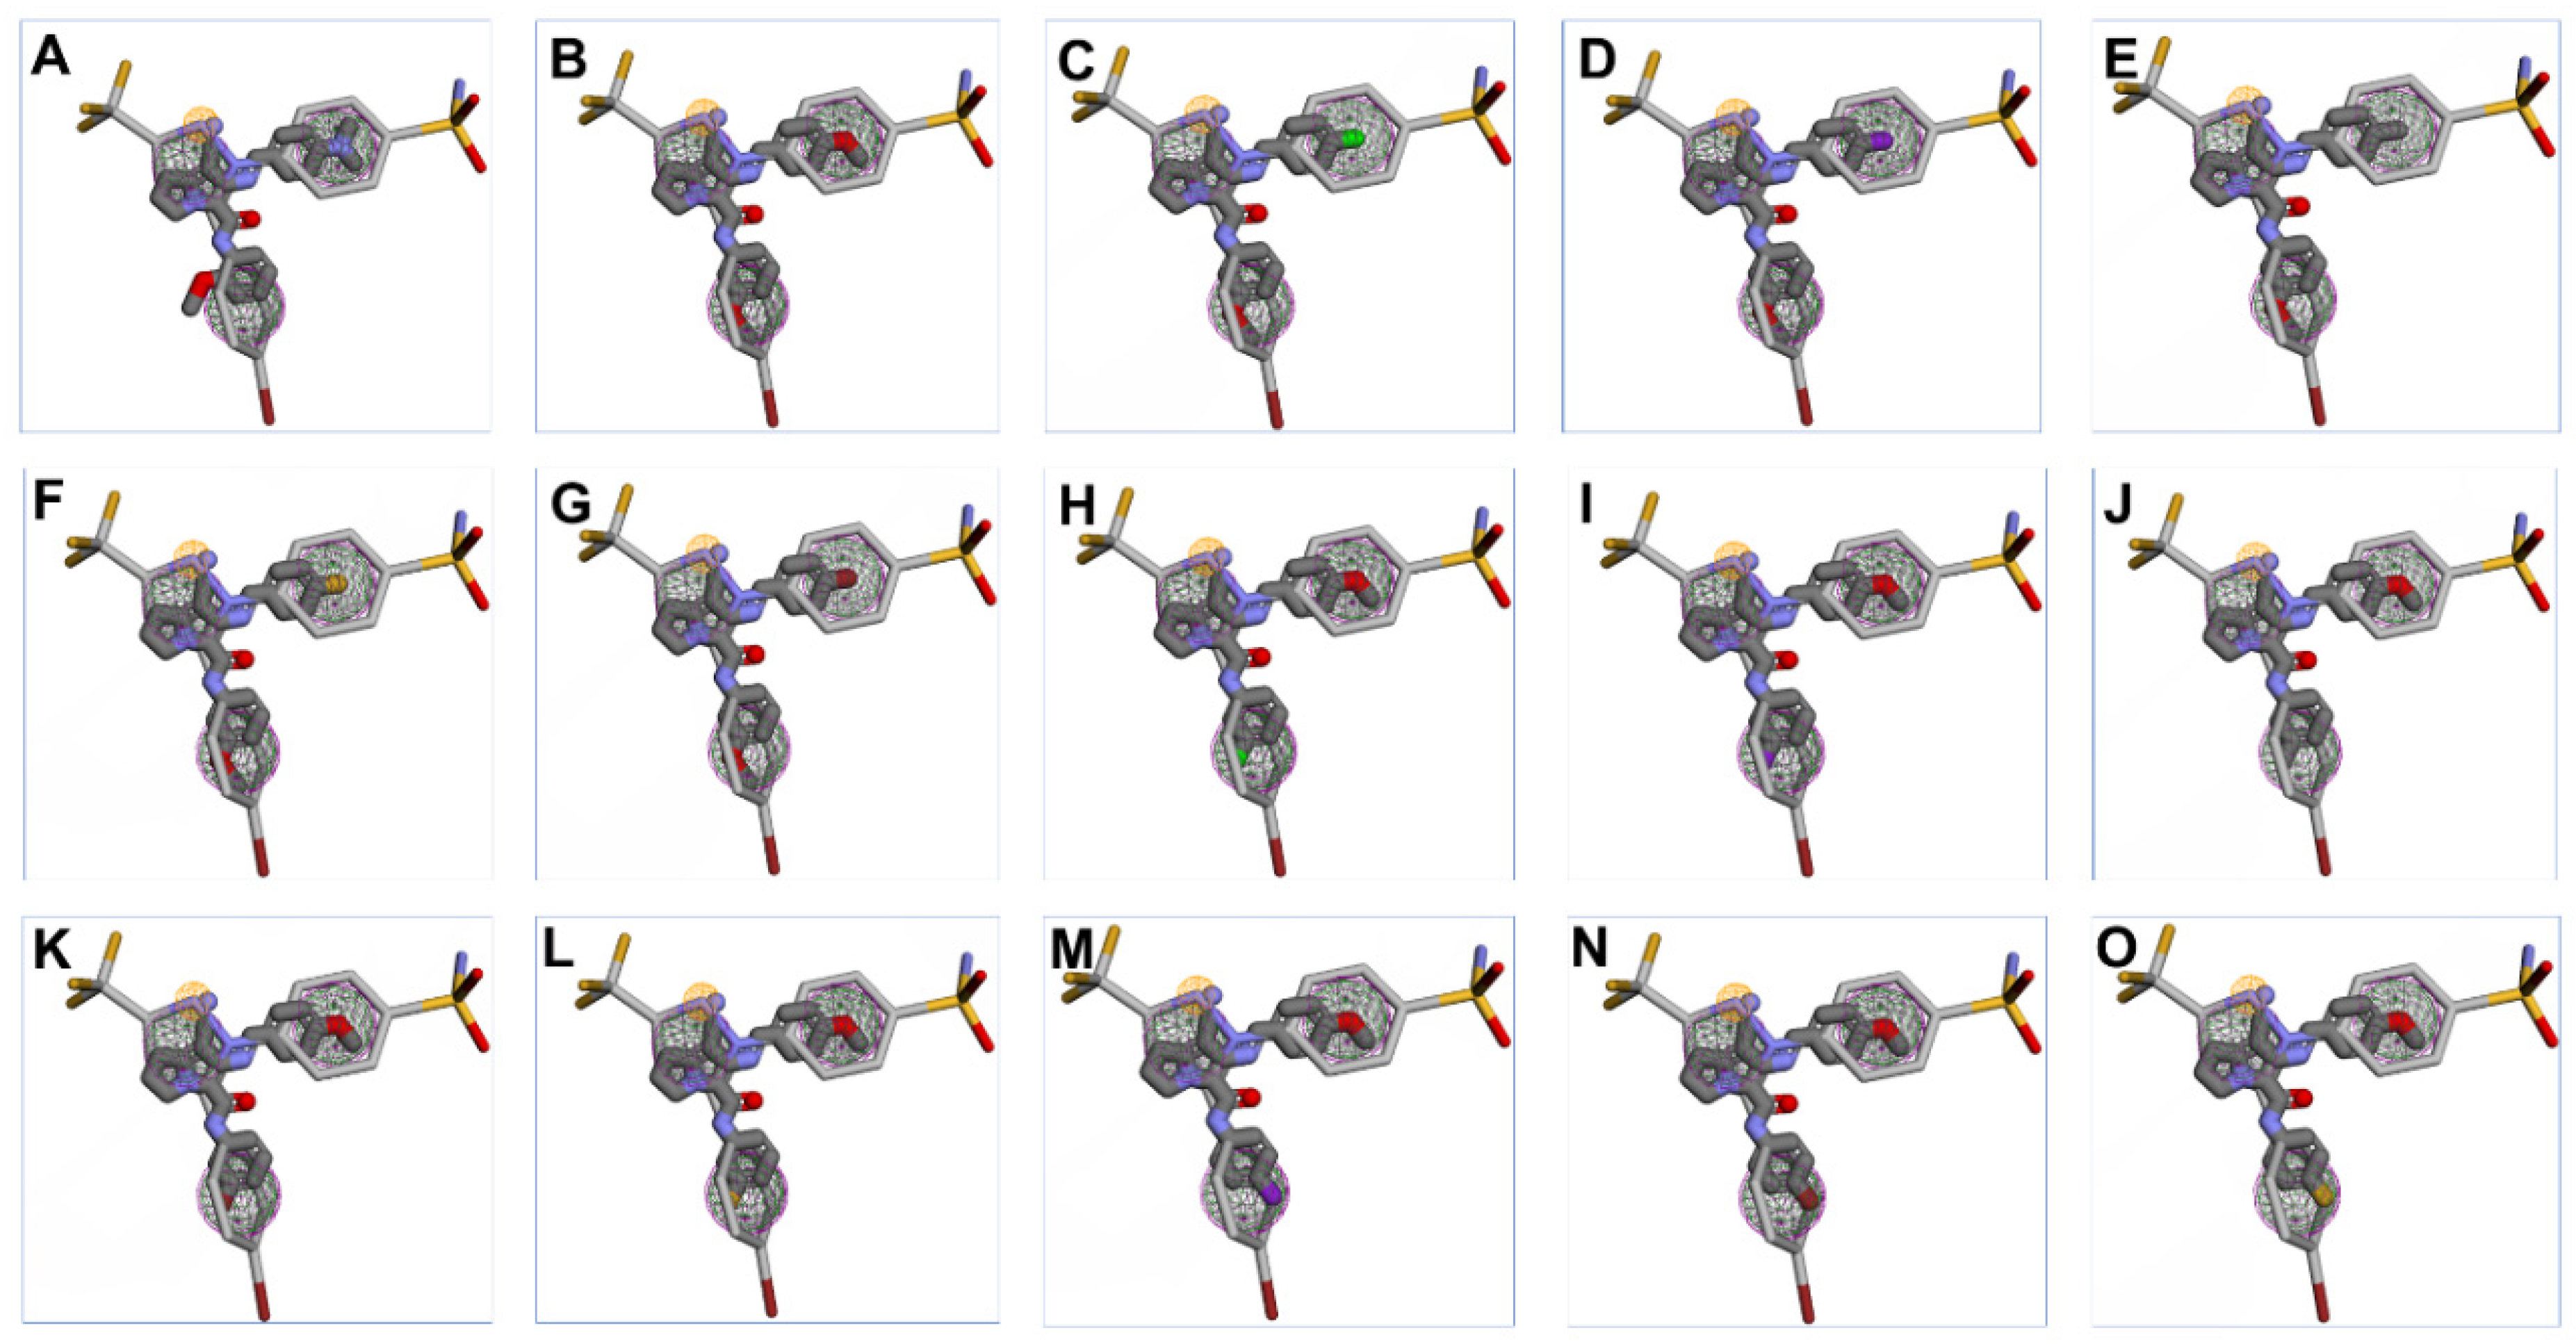
2.1.2. Pharmacophore Search
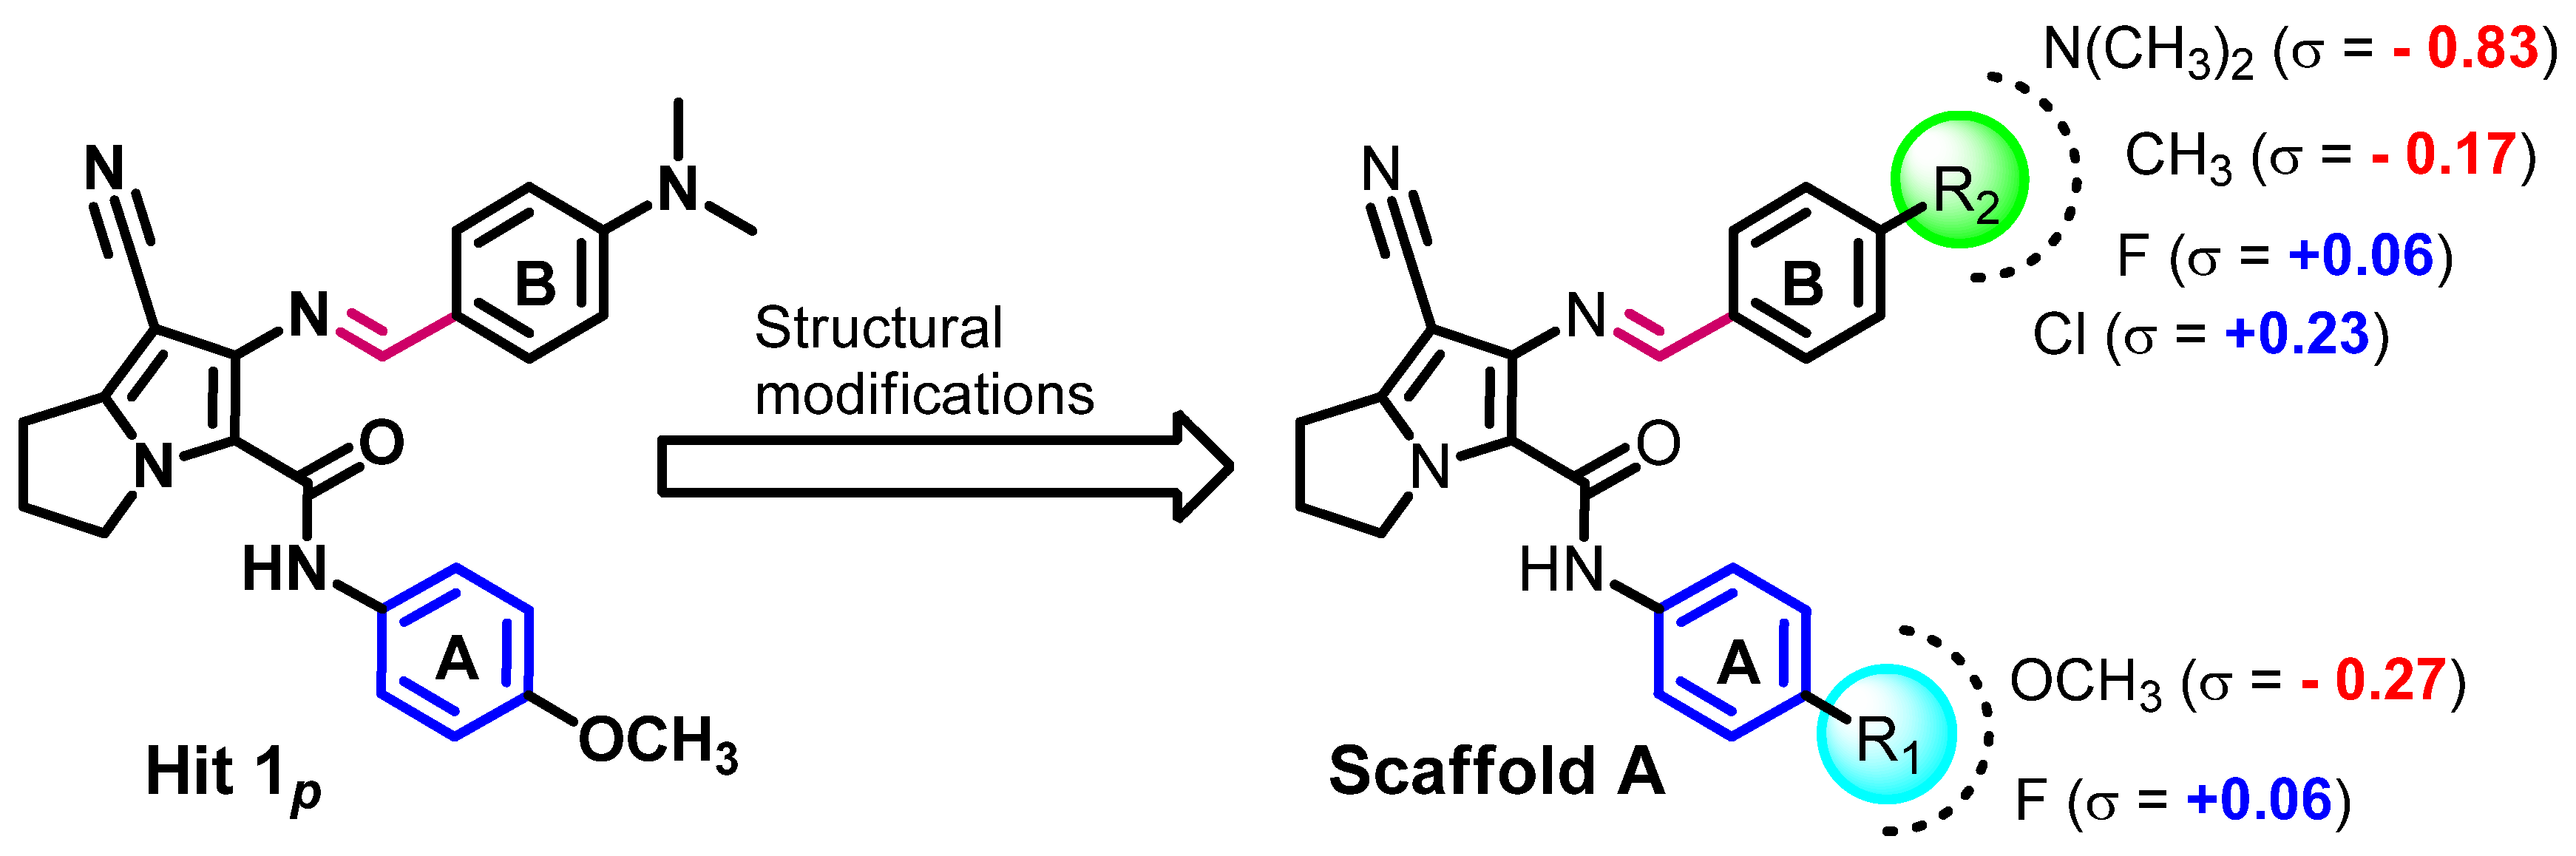
2.1.3. Compounds Selected for the Synthesis
2.2. Synthesis of the New Derivatives
2.3. Biological Evaluation of the New Compounds
2.3.1. Antiproliferative Activity
Antiproliferative Activity Assay
Evaluation of Antiproliferative Selectivity
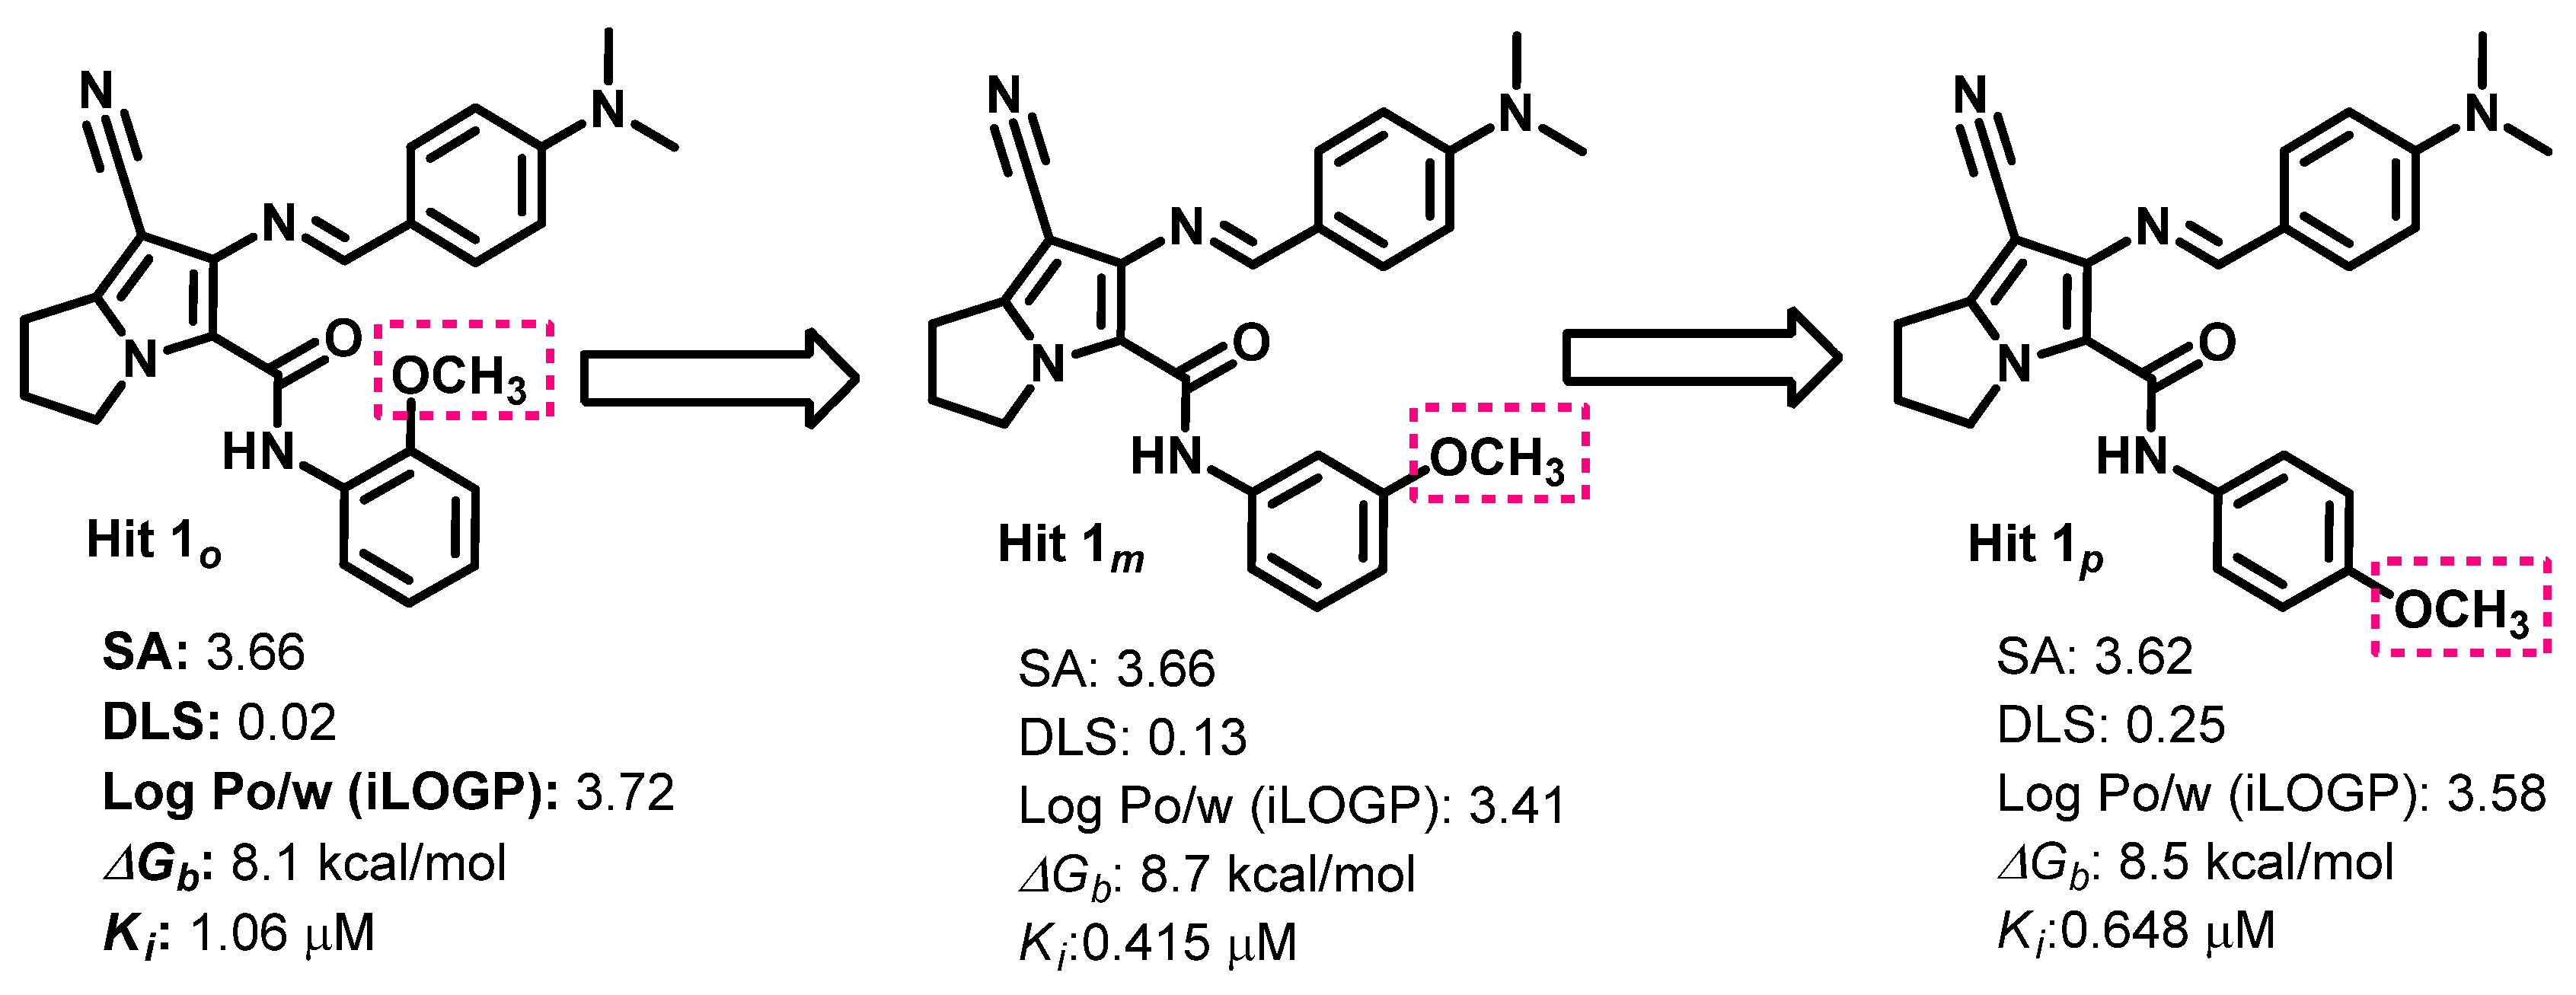
Structure–Activity Relationship (SAR)
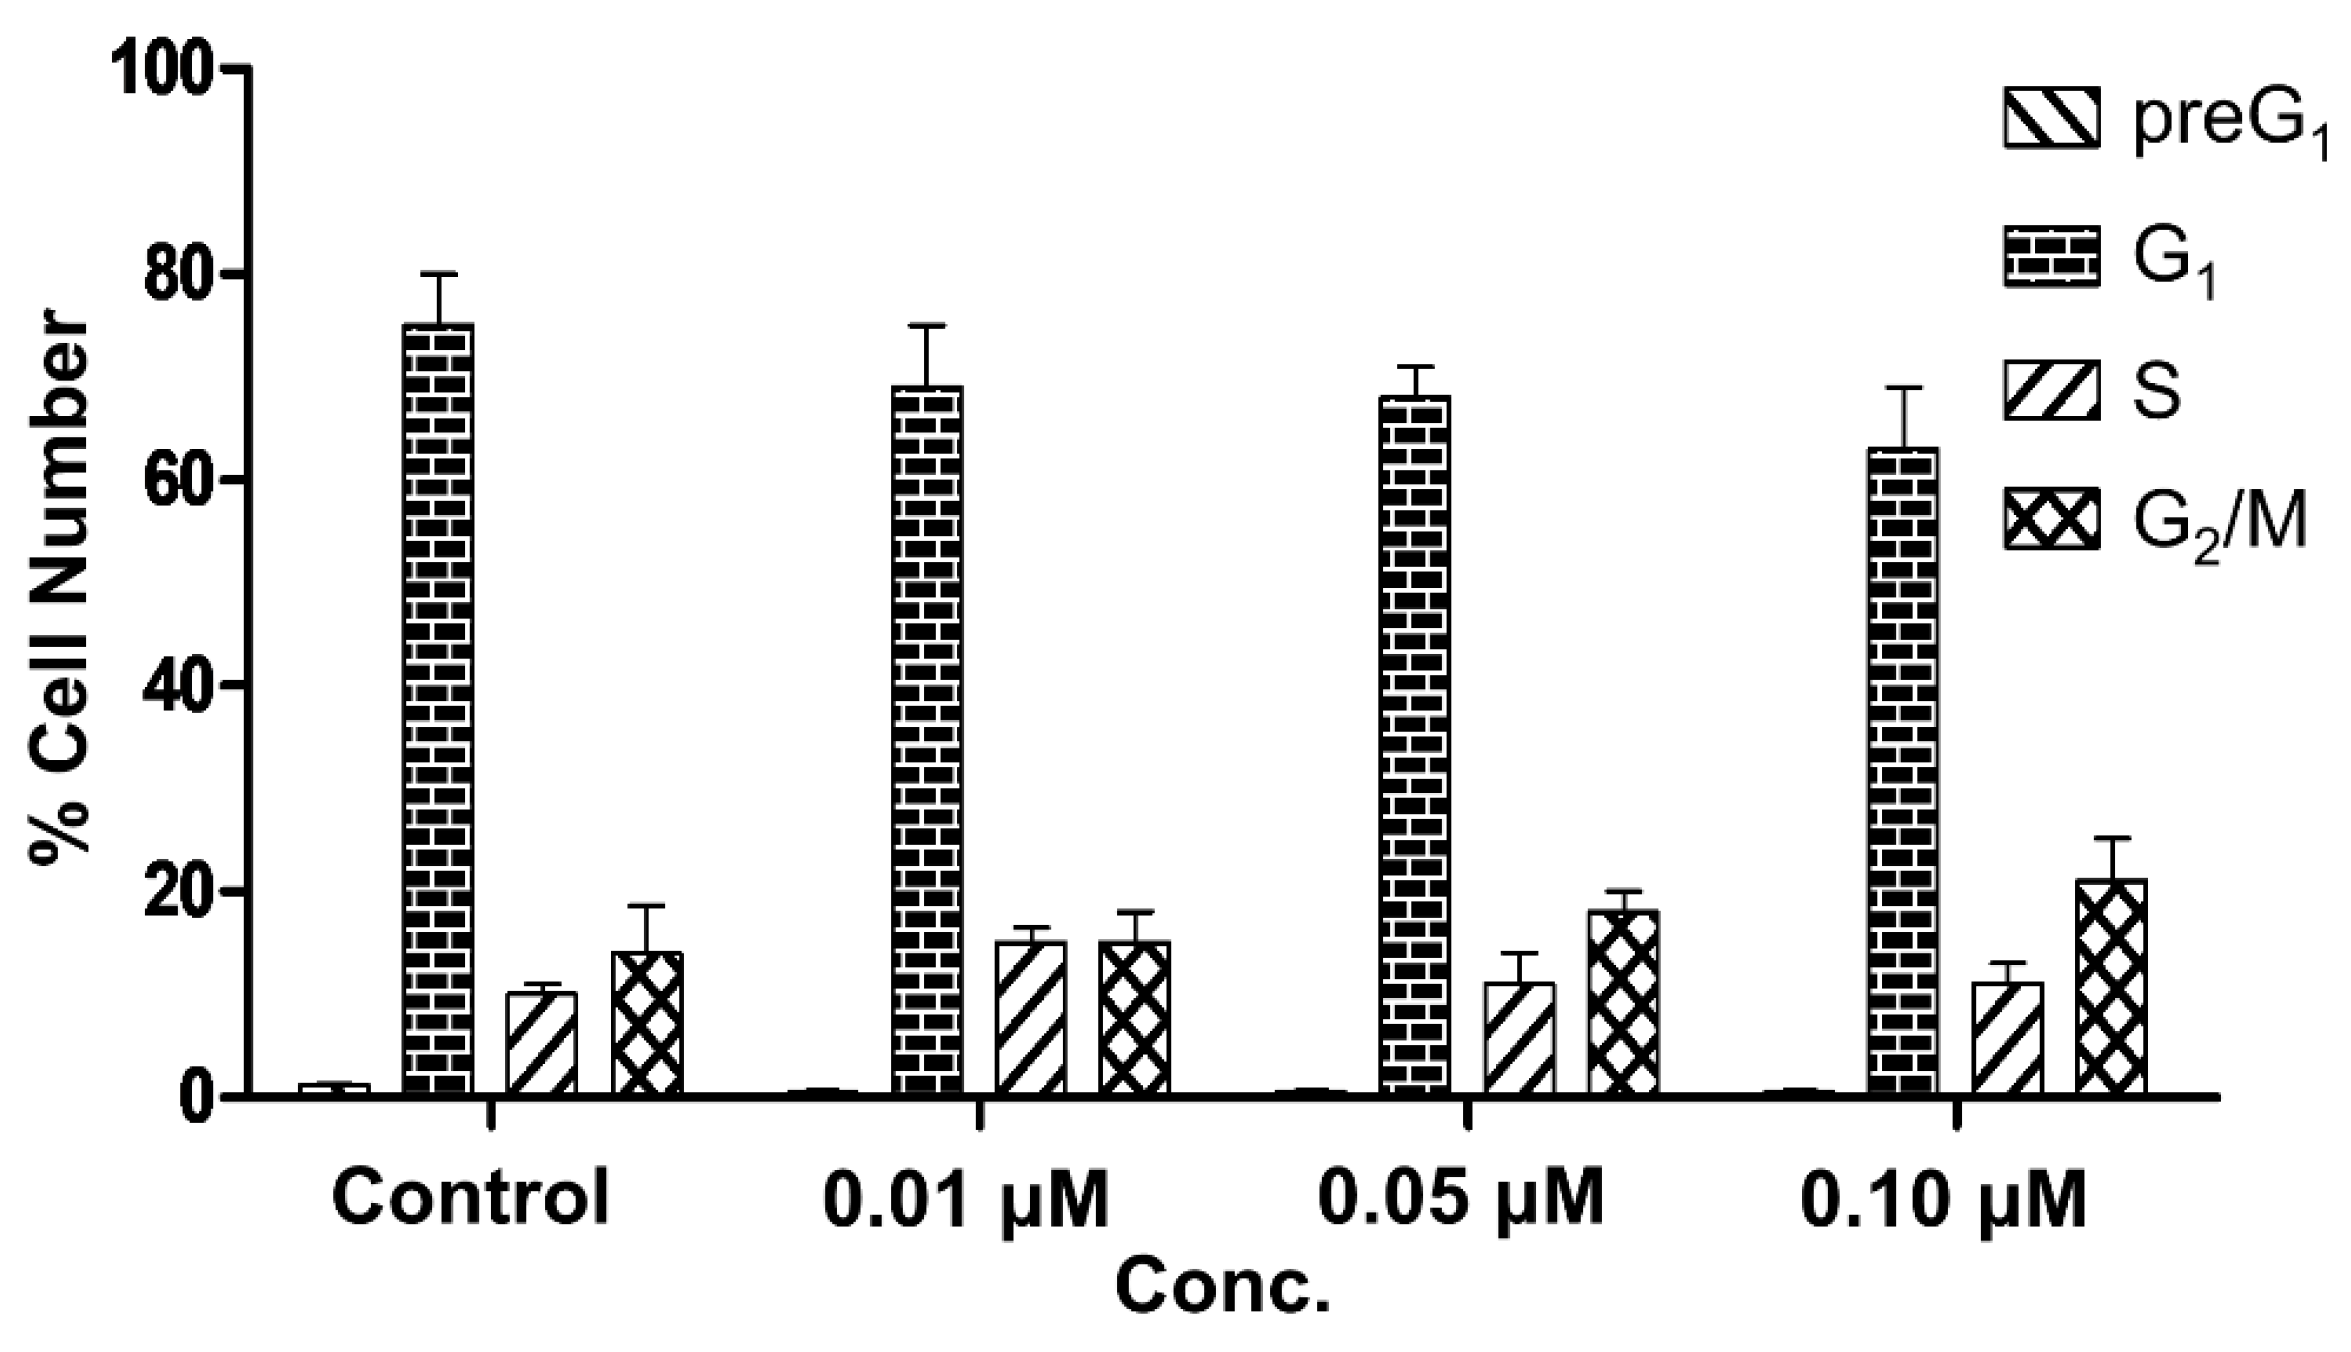
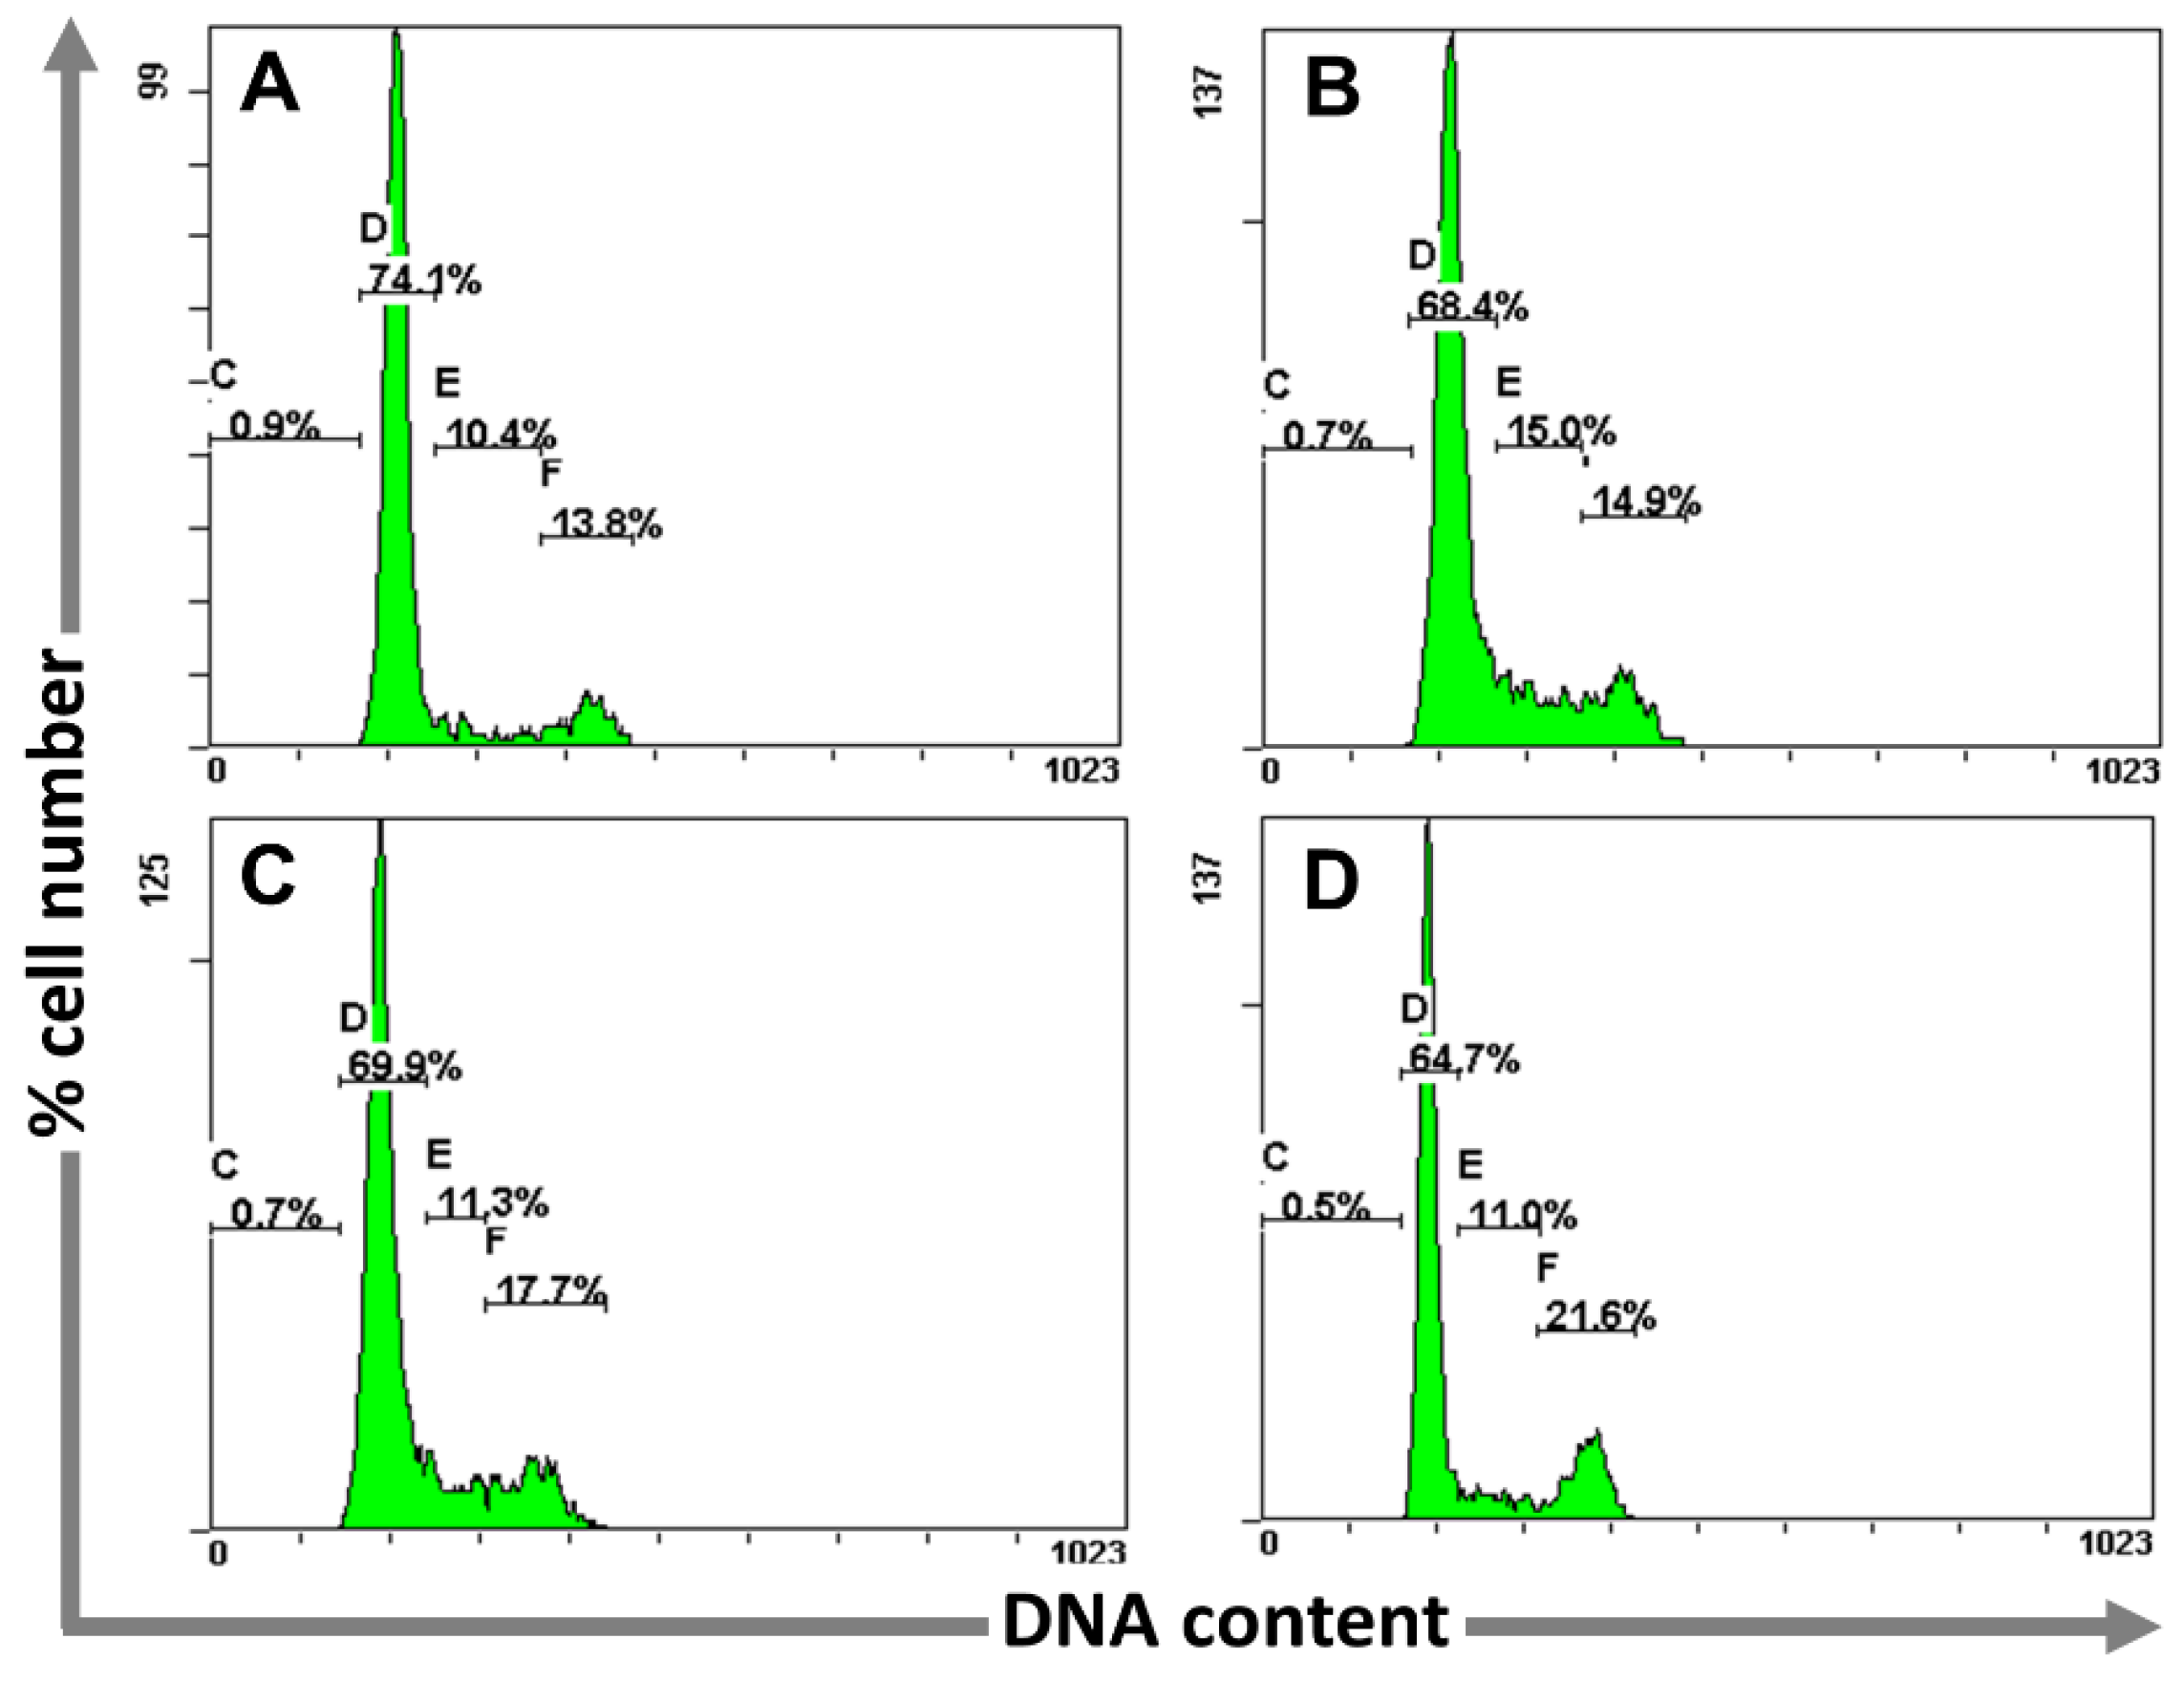
2.3.2. Determination of Cell Cycle Perturbations
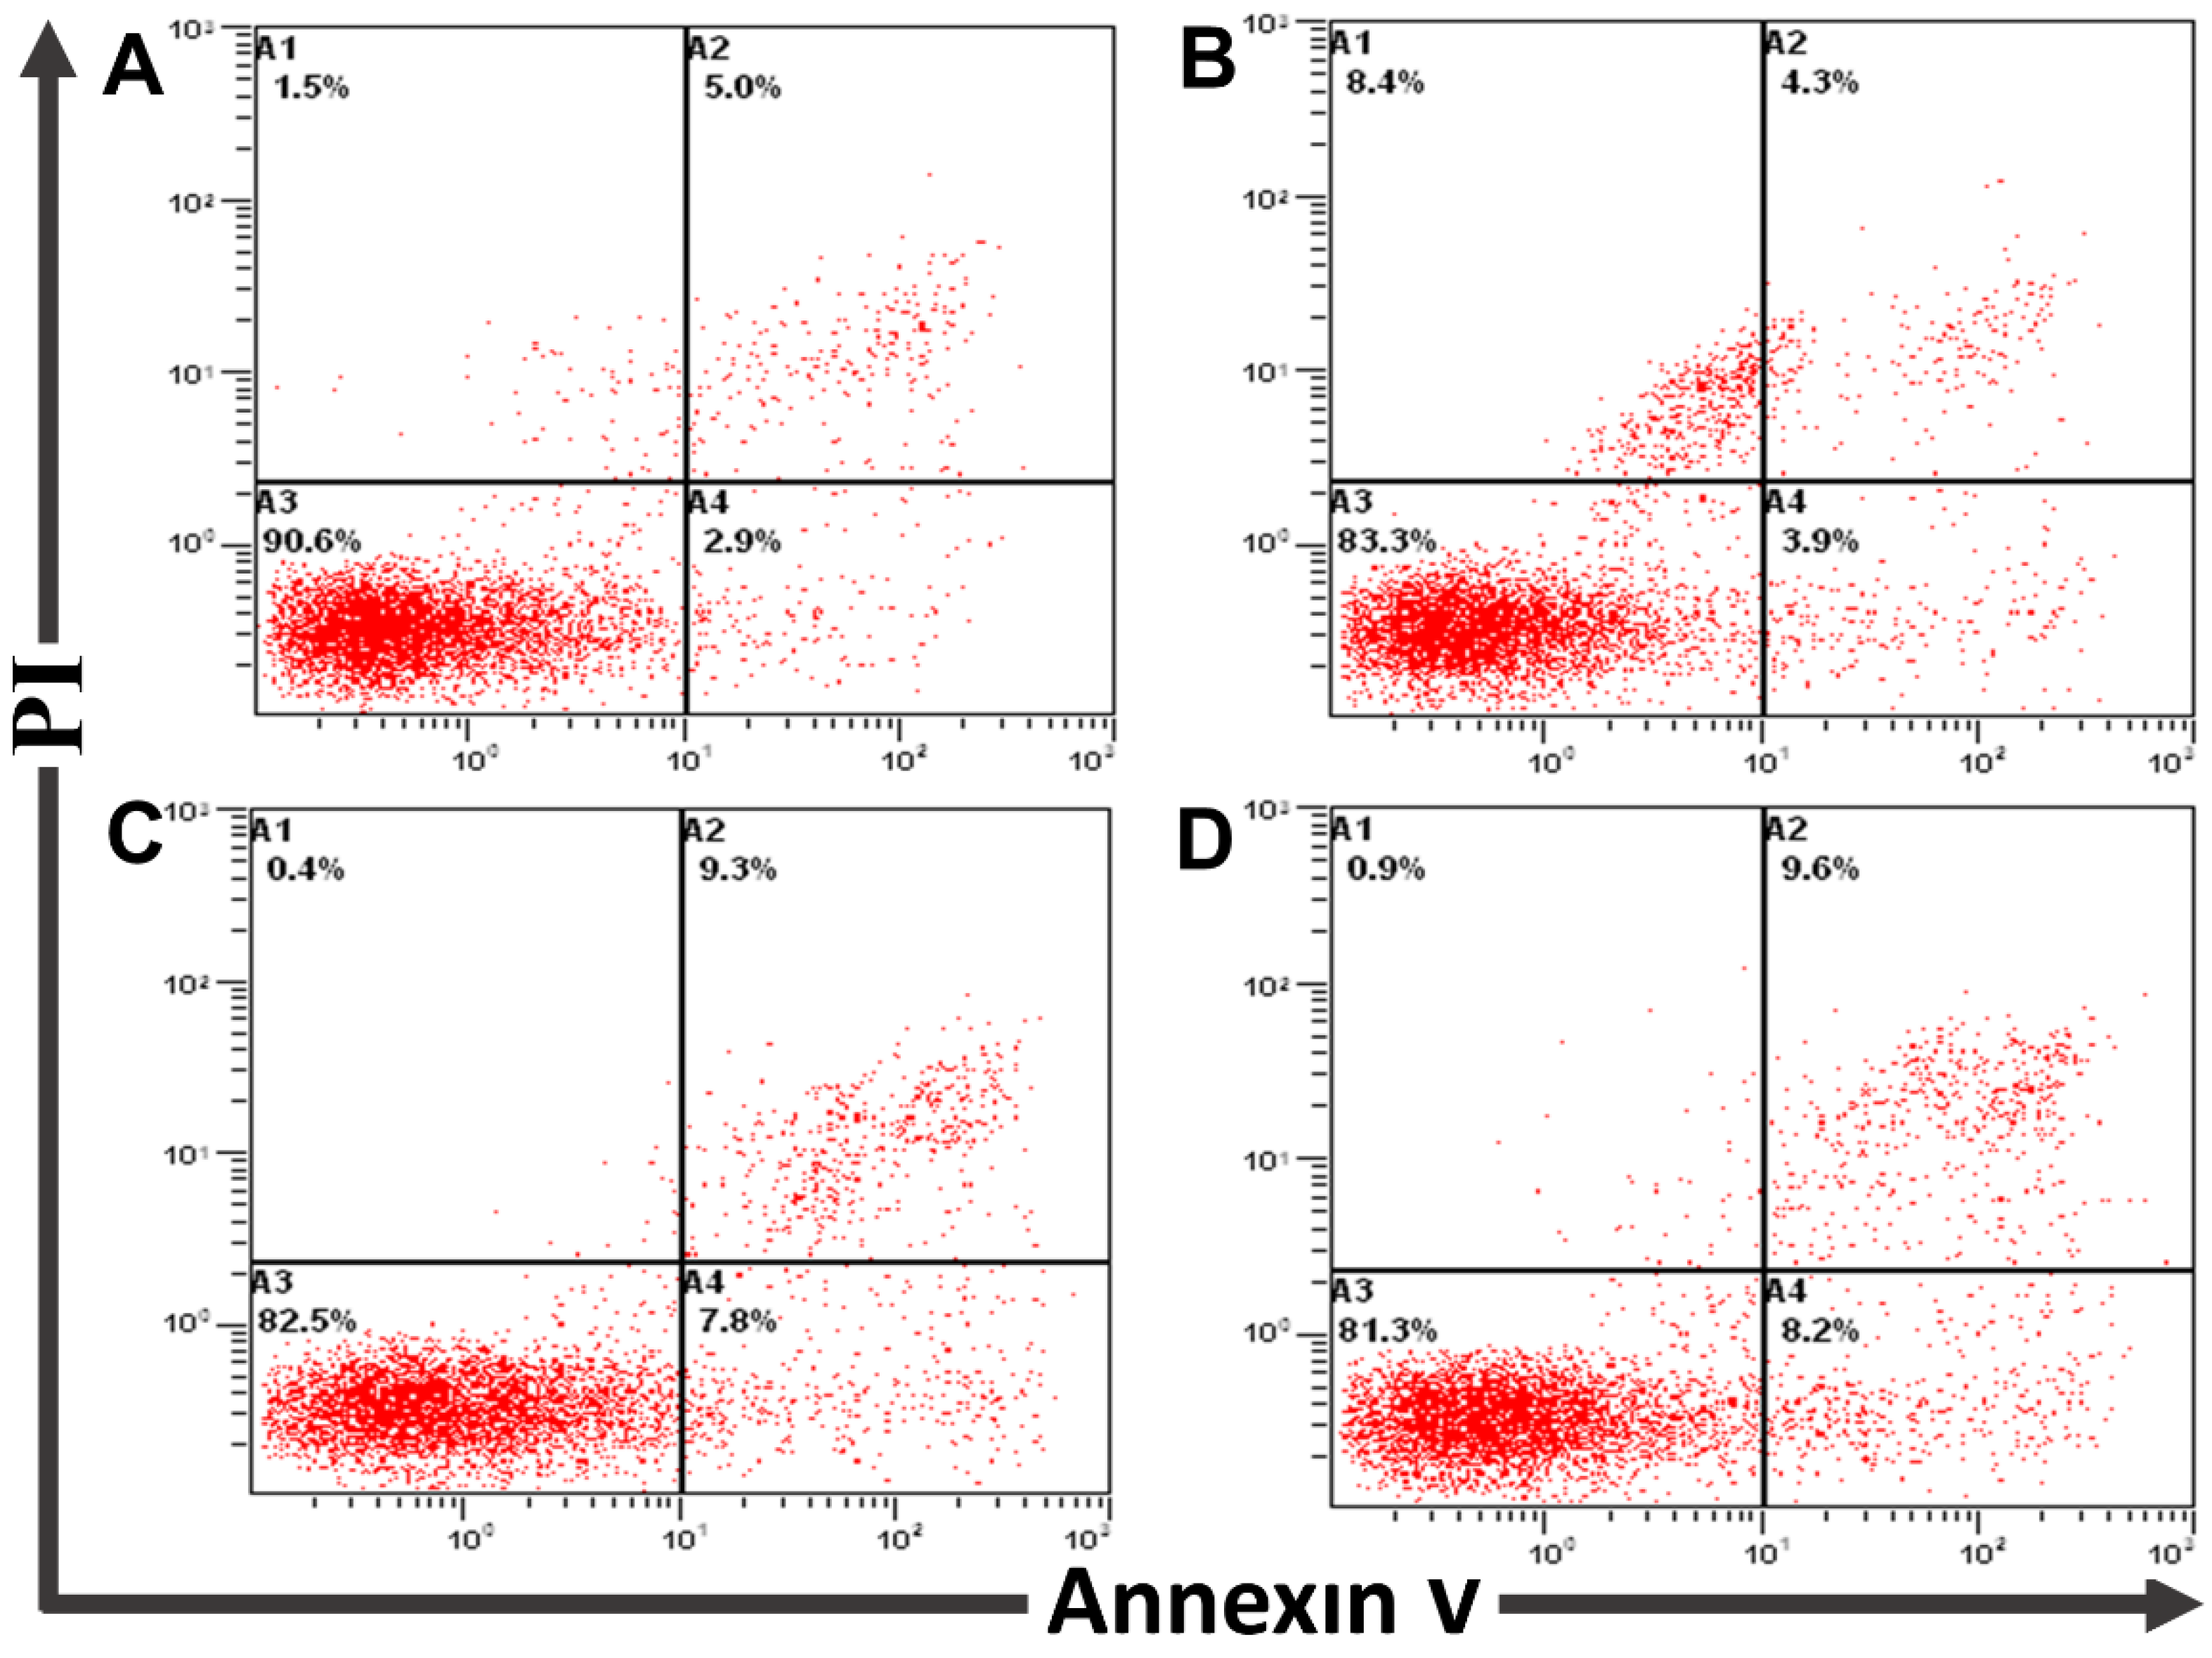
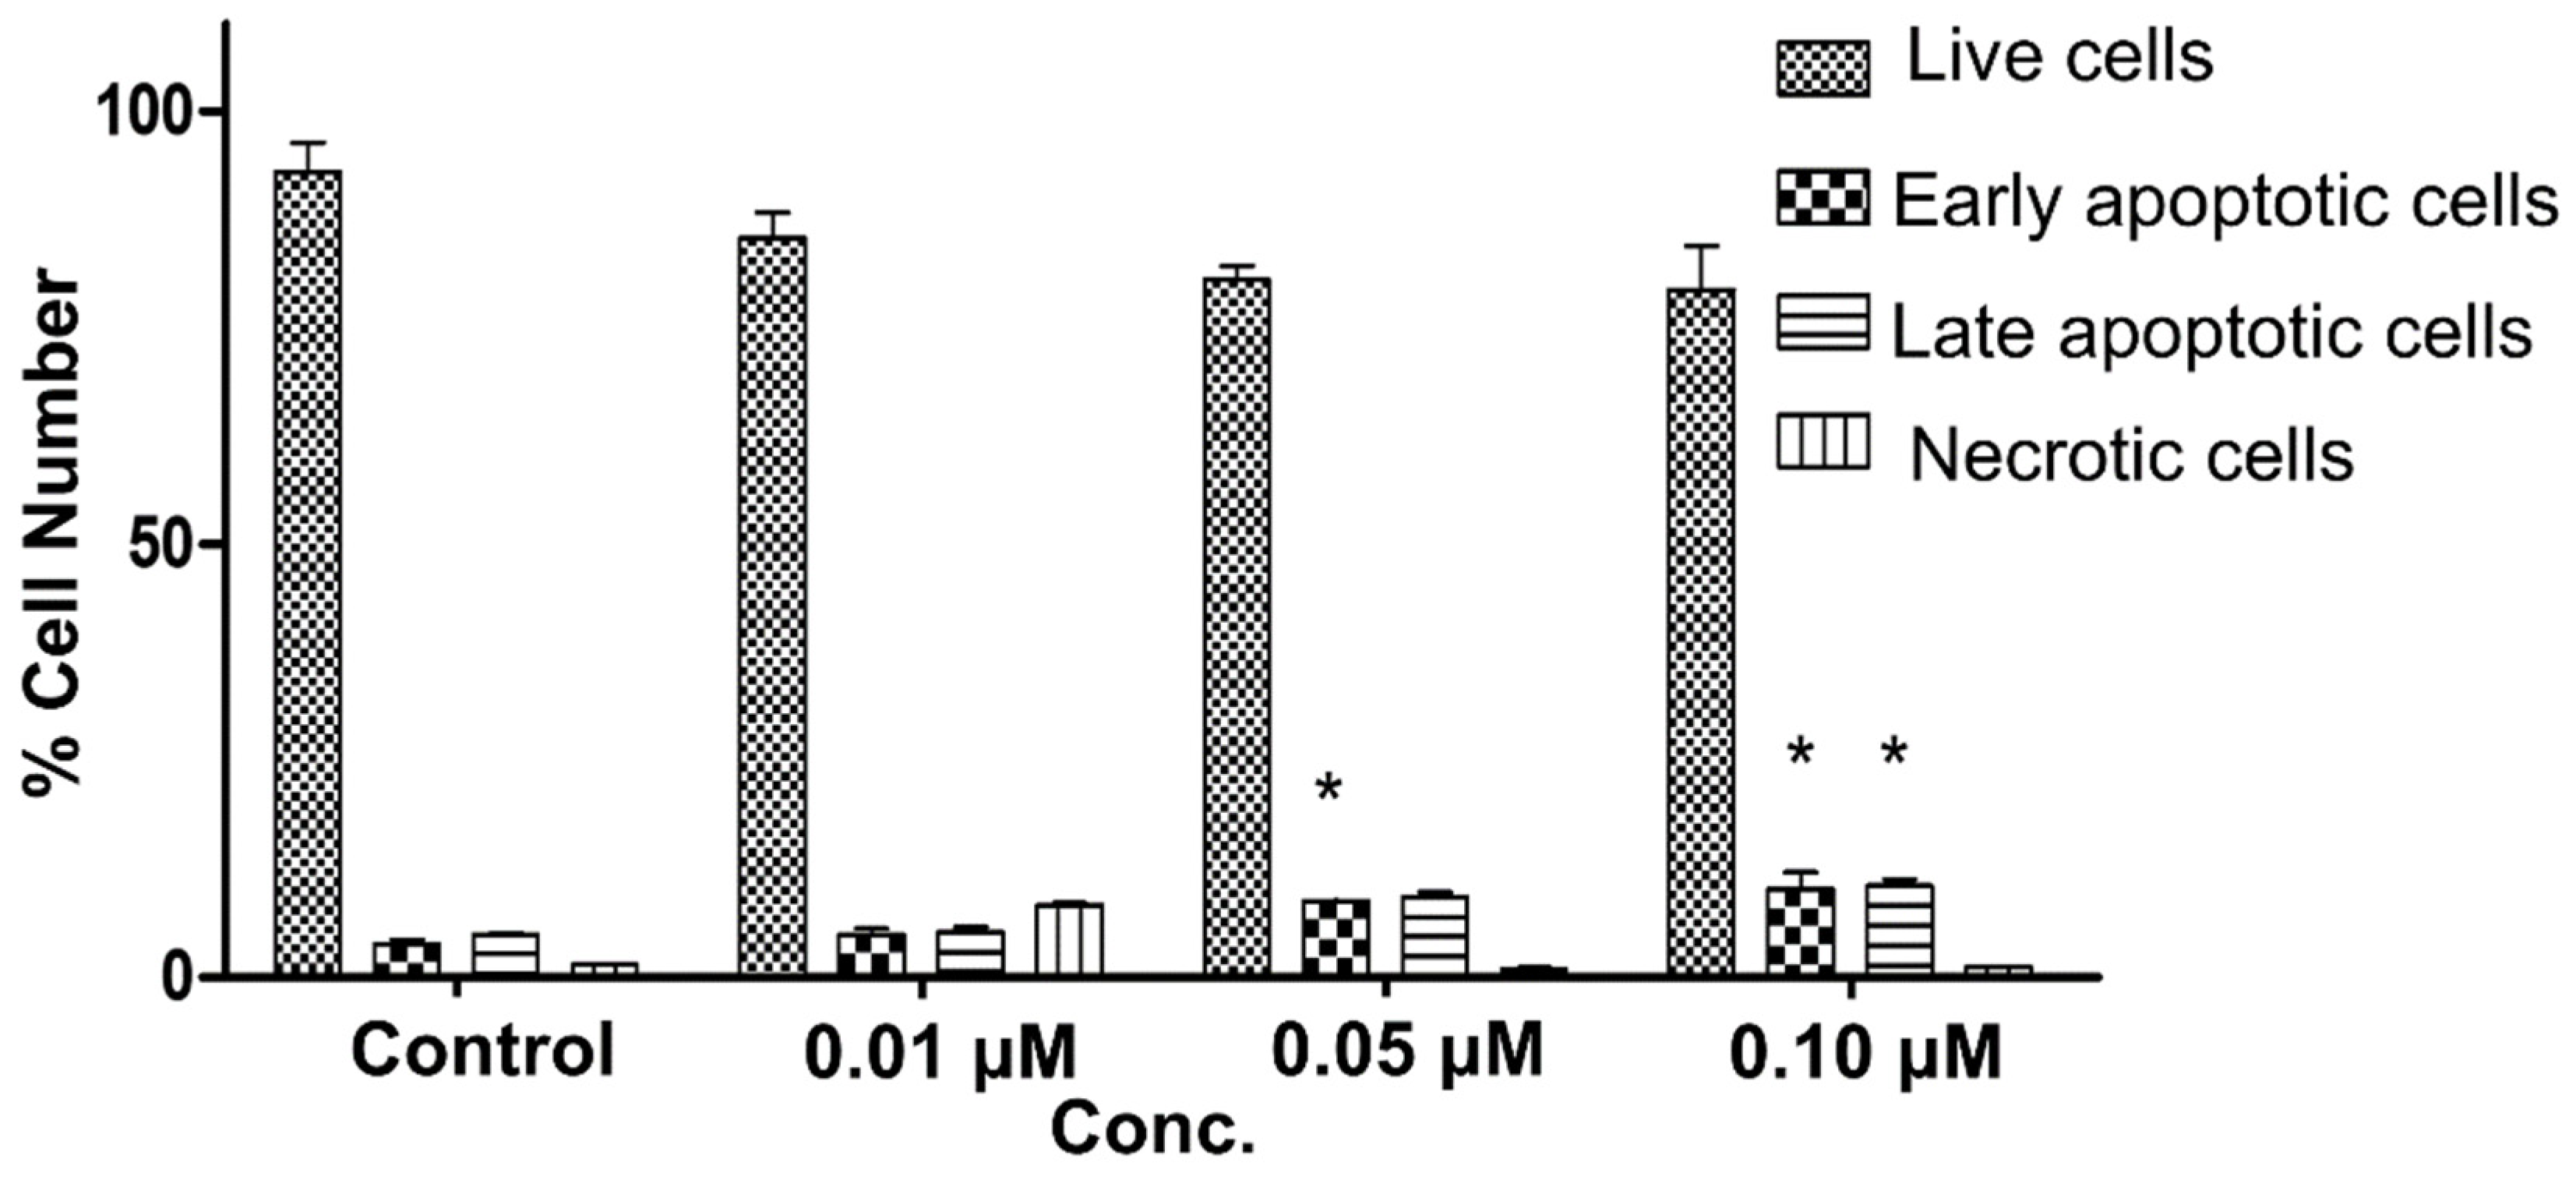
2.3.3. Annexin V FITC/PI Apoptosis Assay
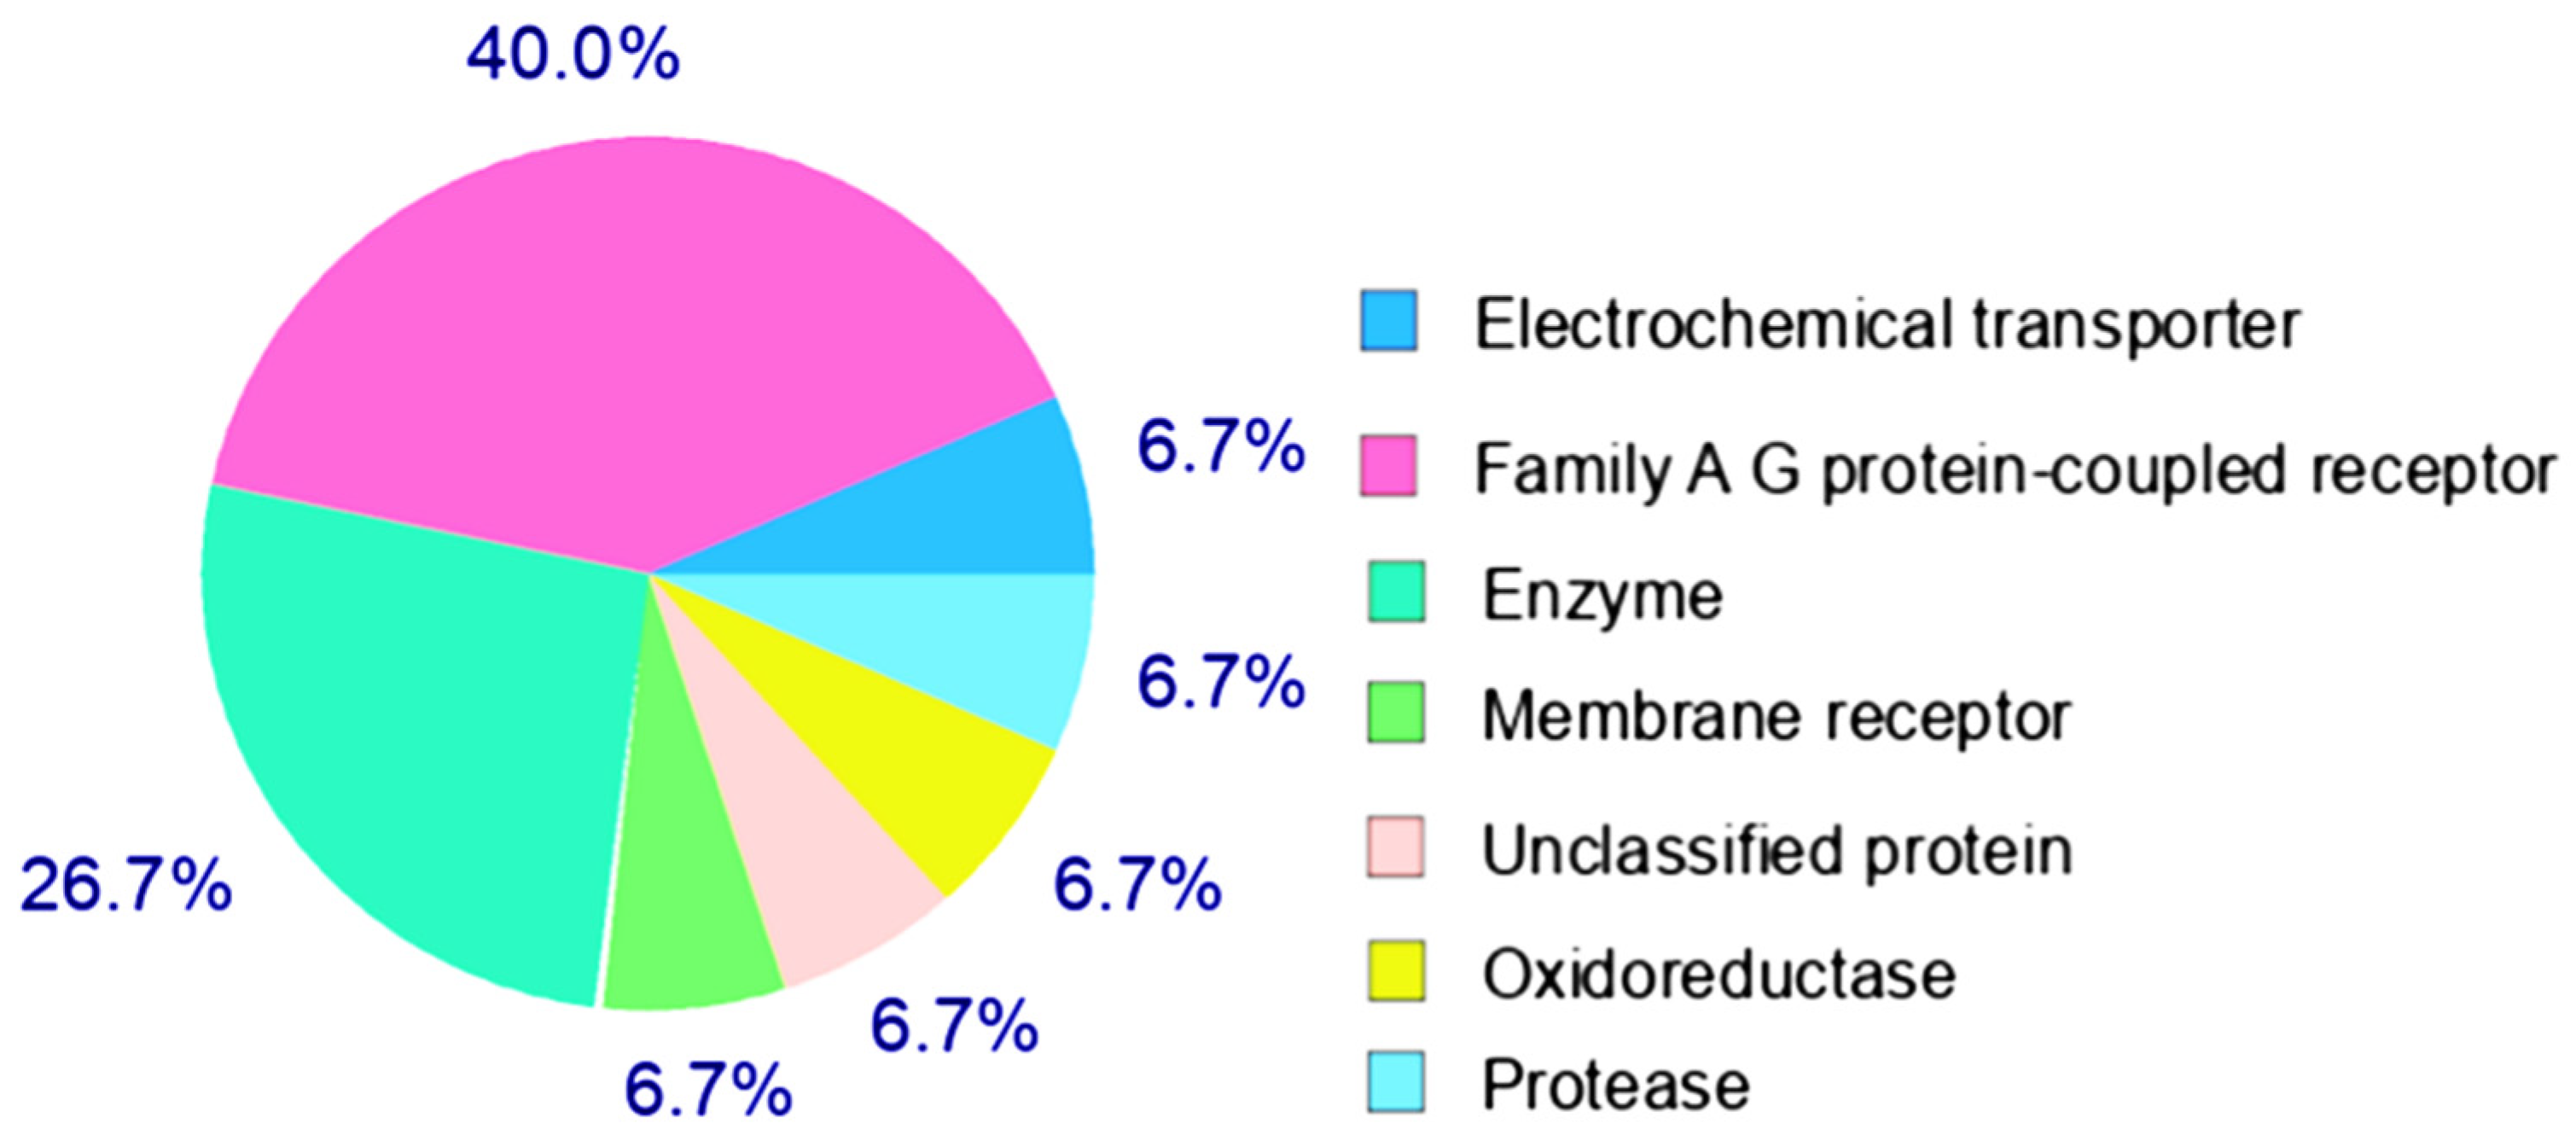
2.4. Target Prediction
2.5. Molecular Docking and Binding Mode Analysis
2.5.1. Docking into the Targets Involved in Inflammation
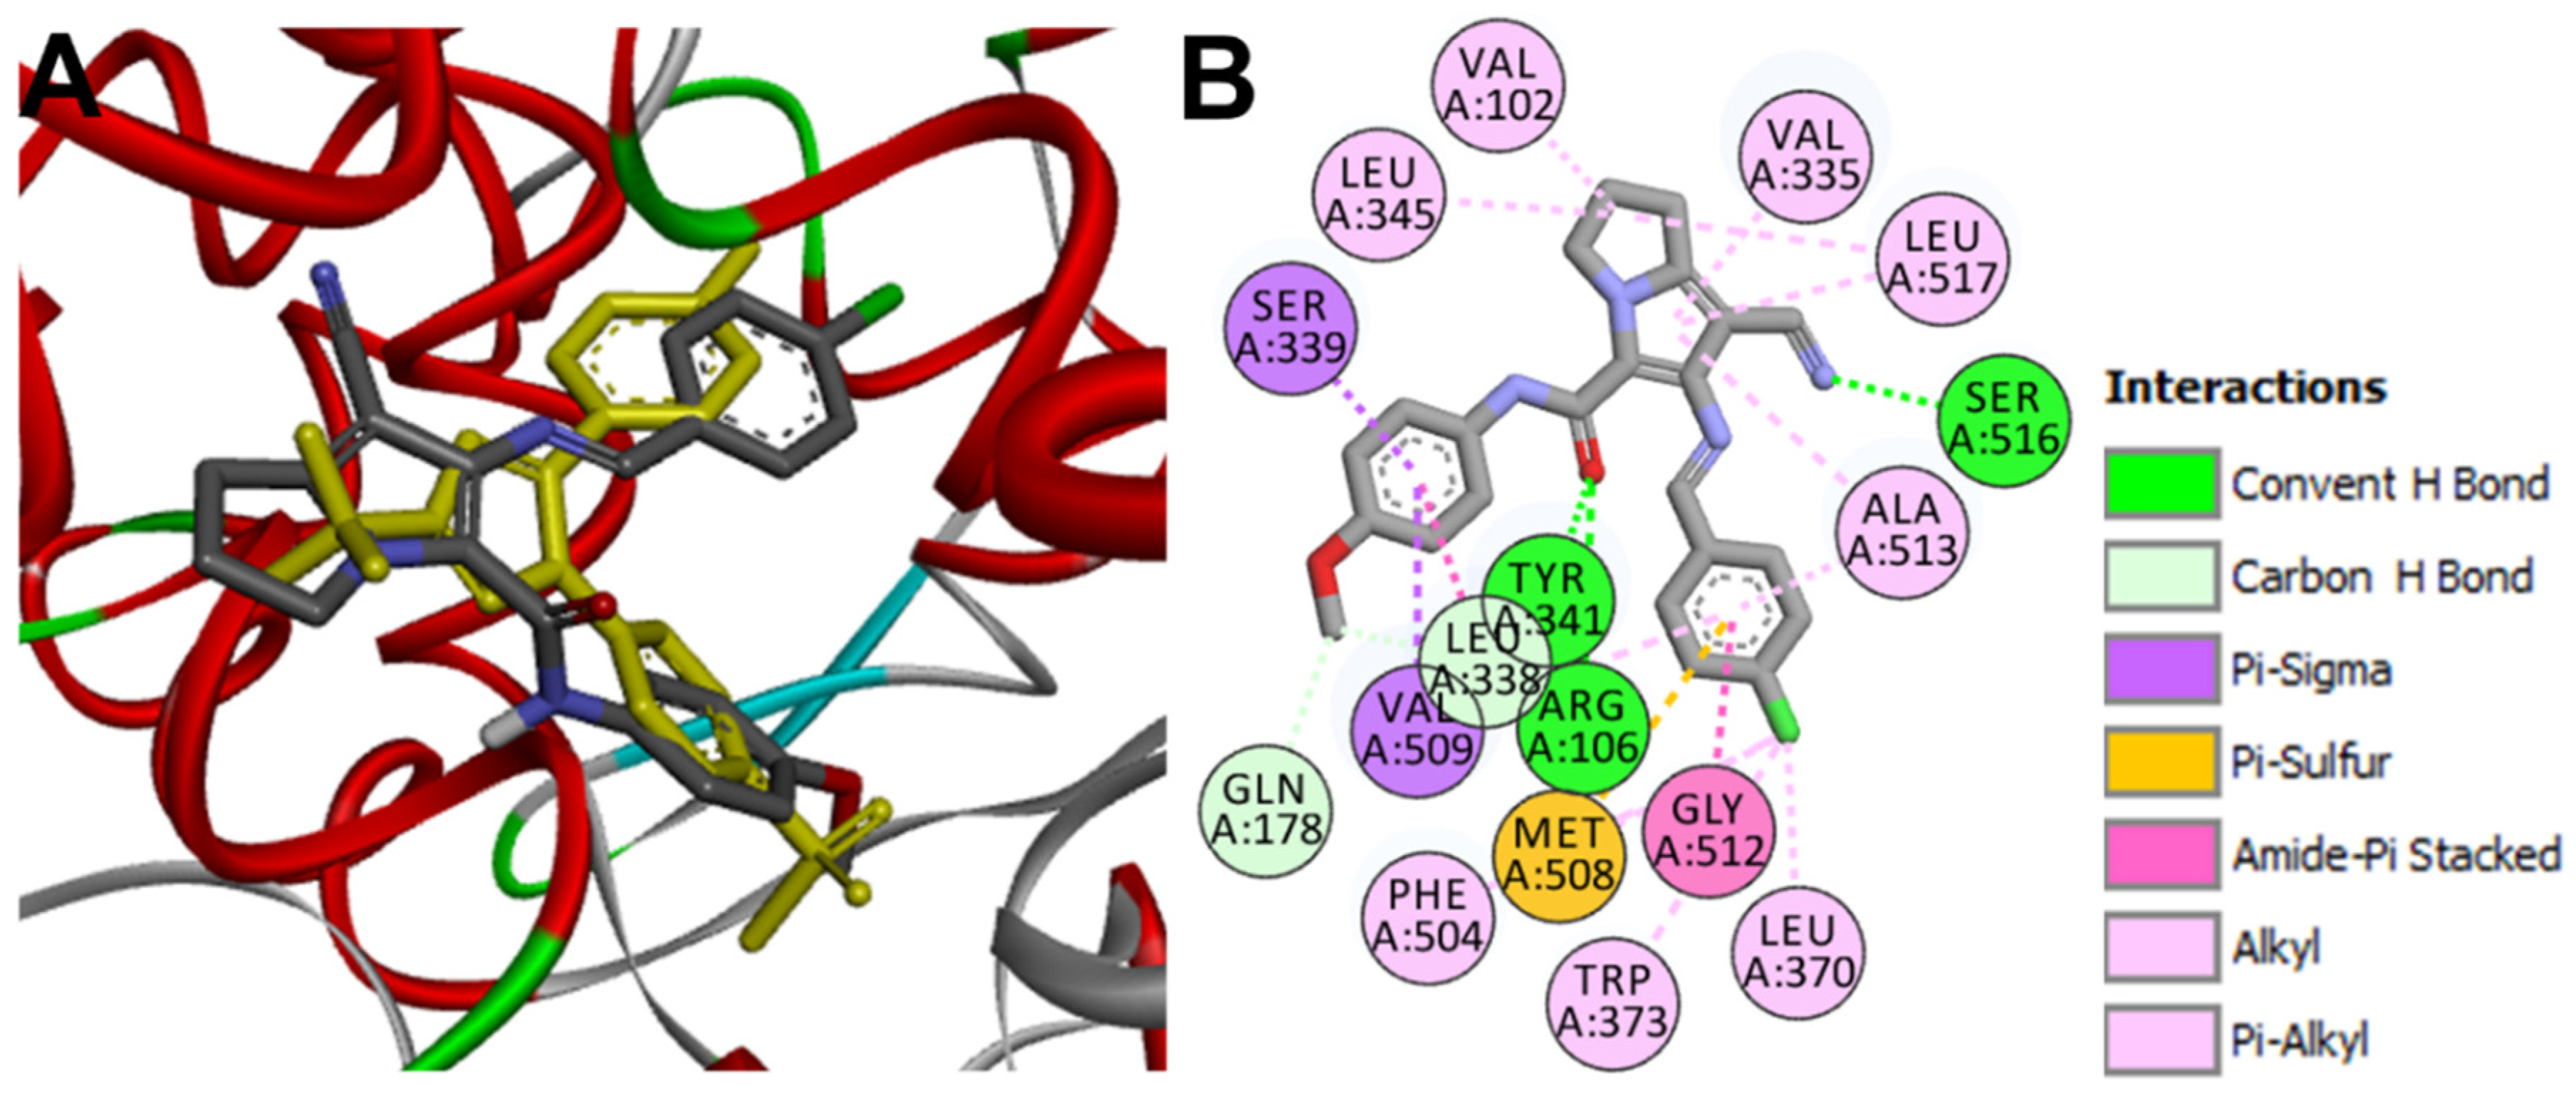
Docking into COX-2
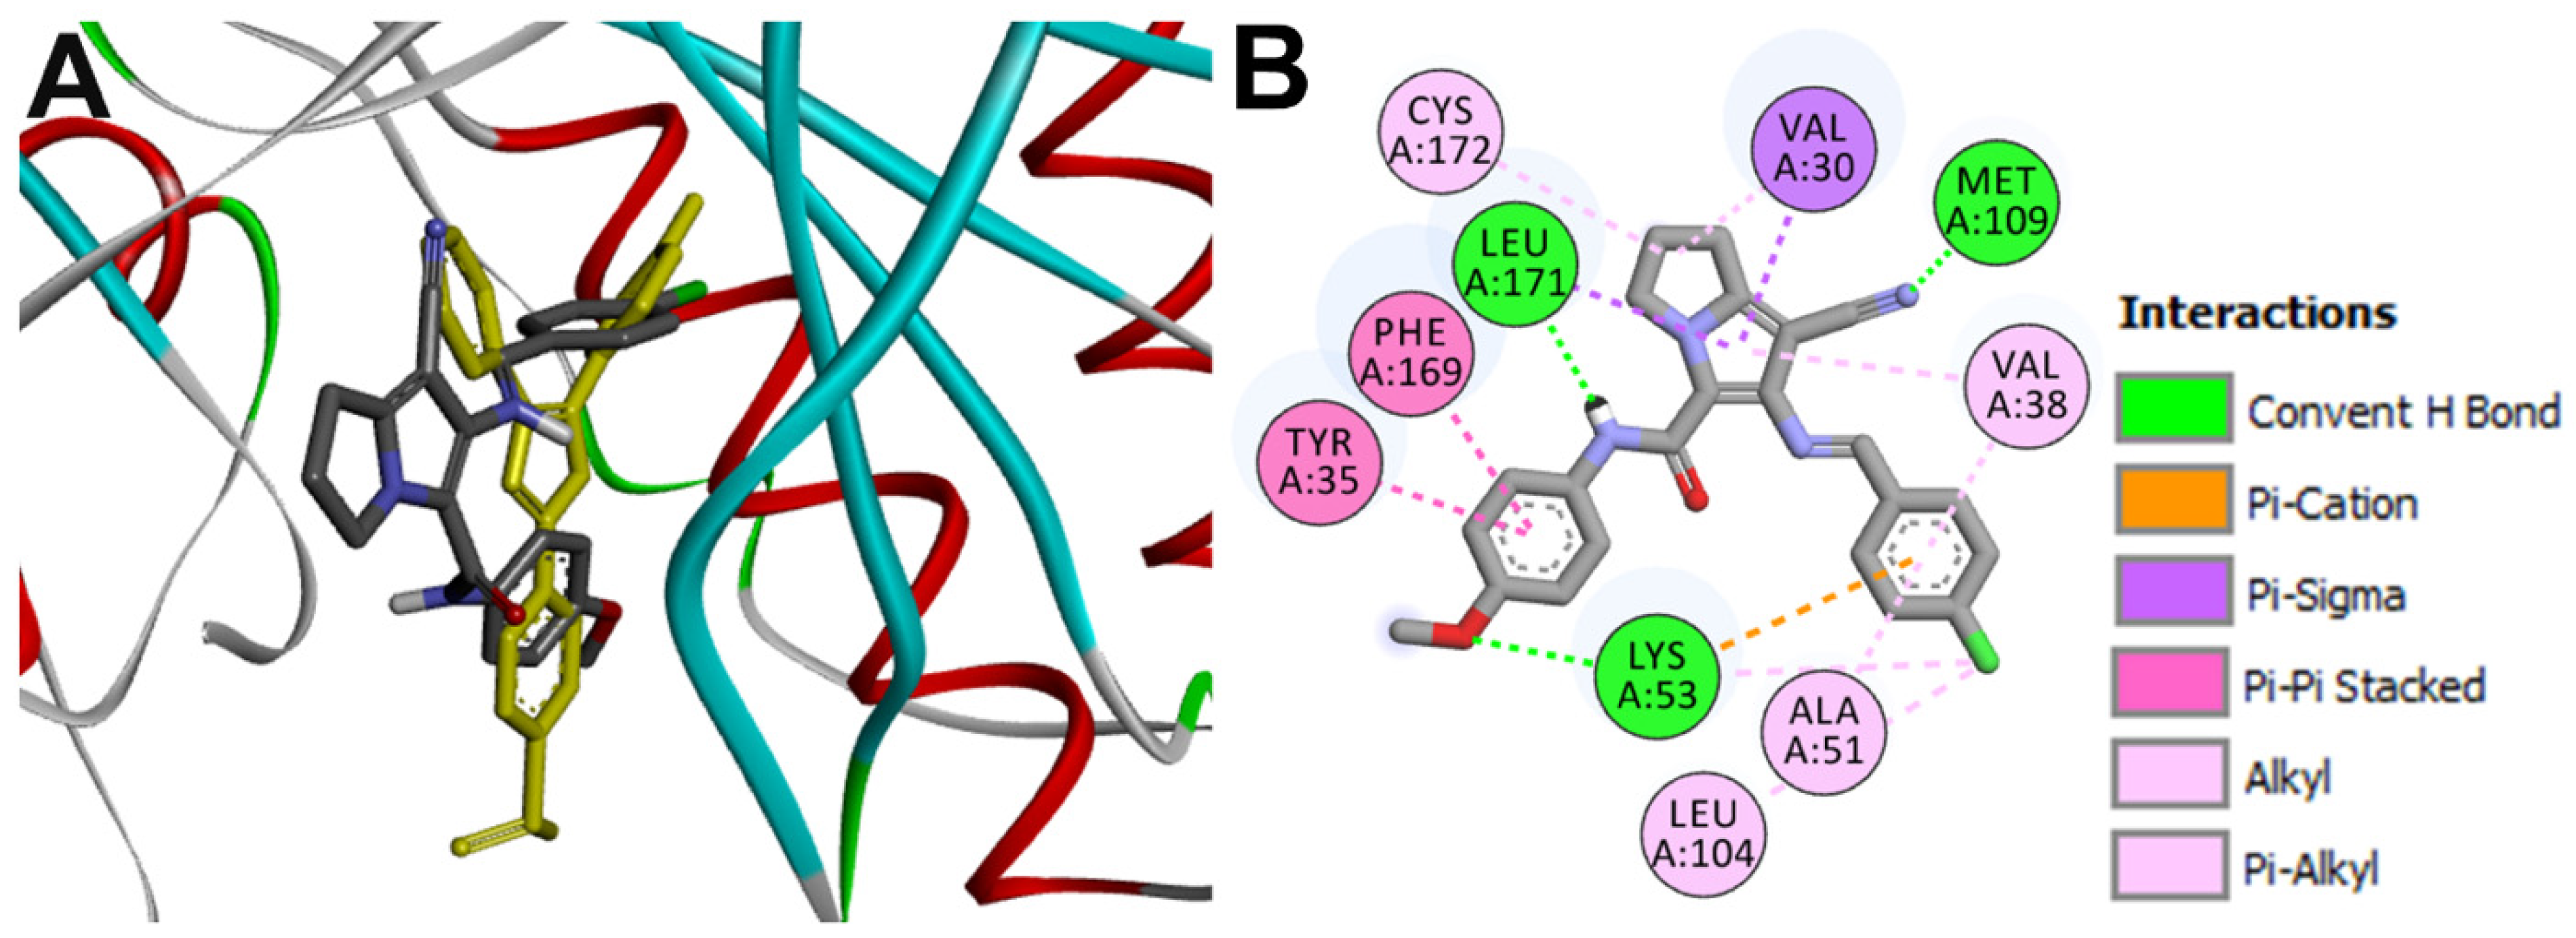
Docking into MAP p38α
2.5.2. Docking Study into Oncogenic Kinases
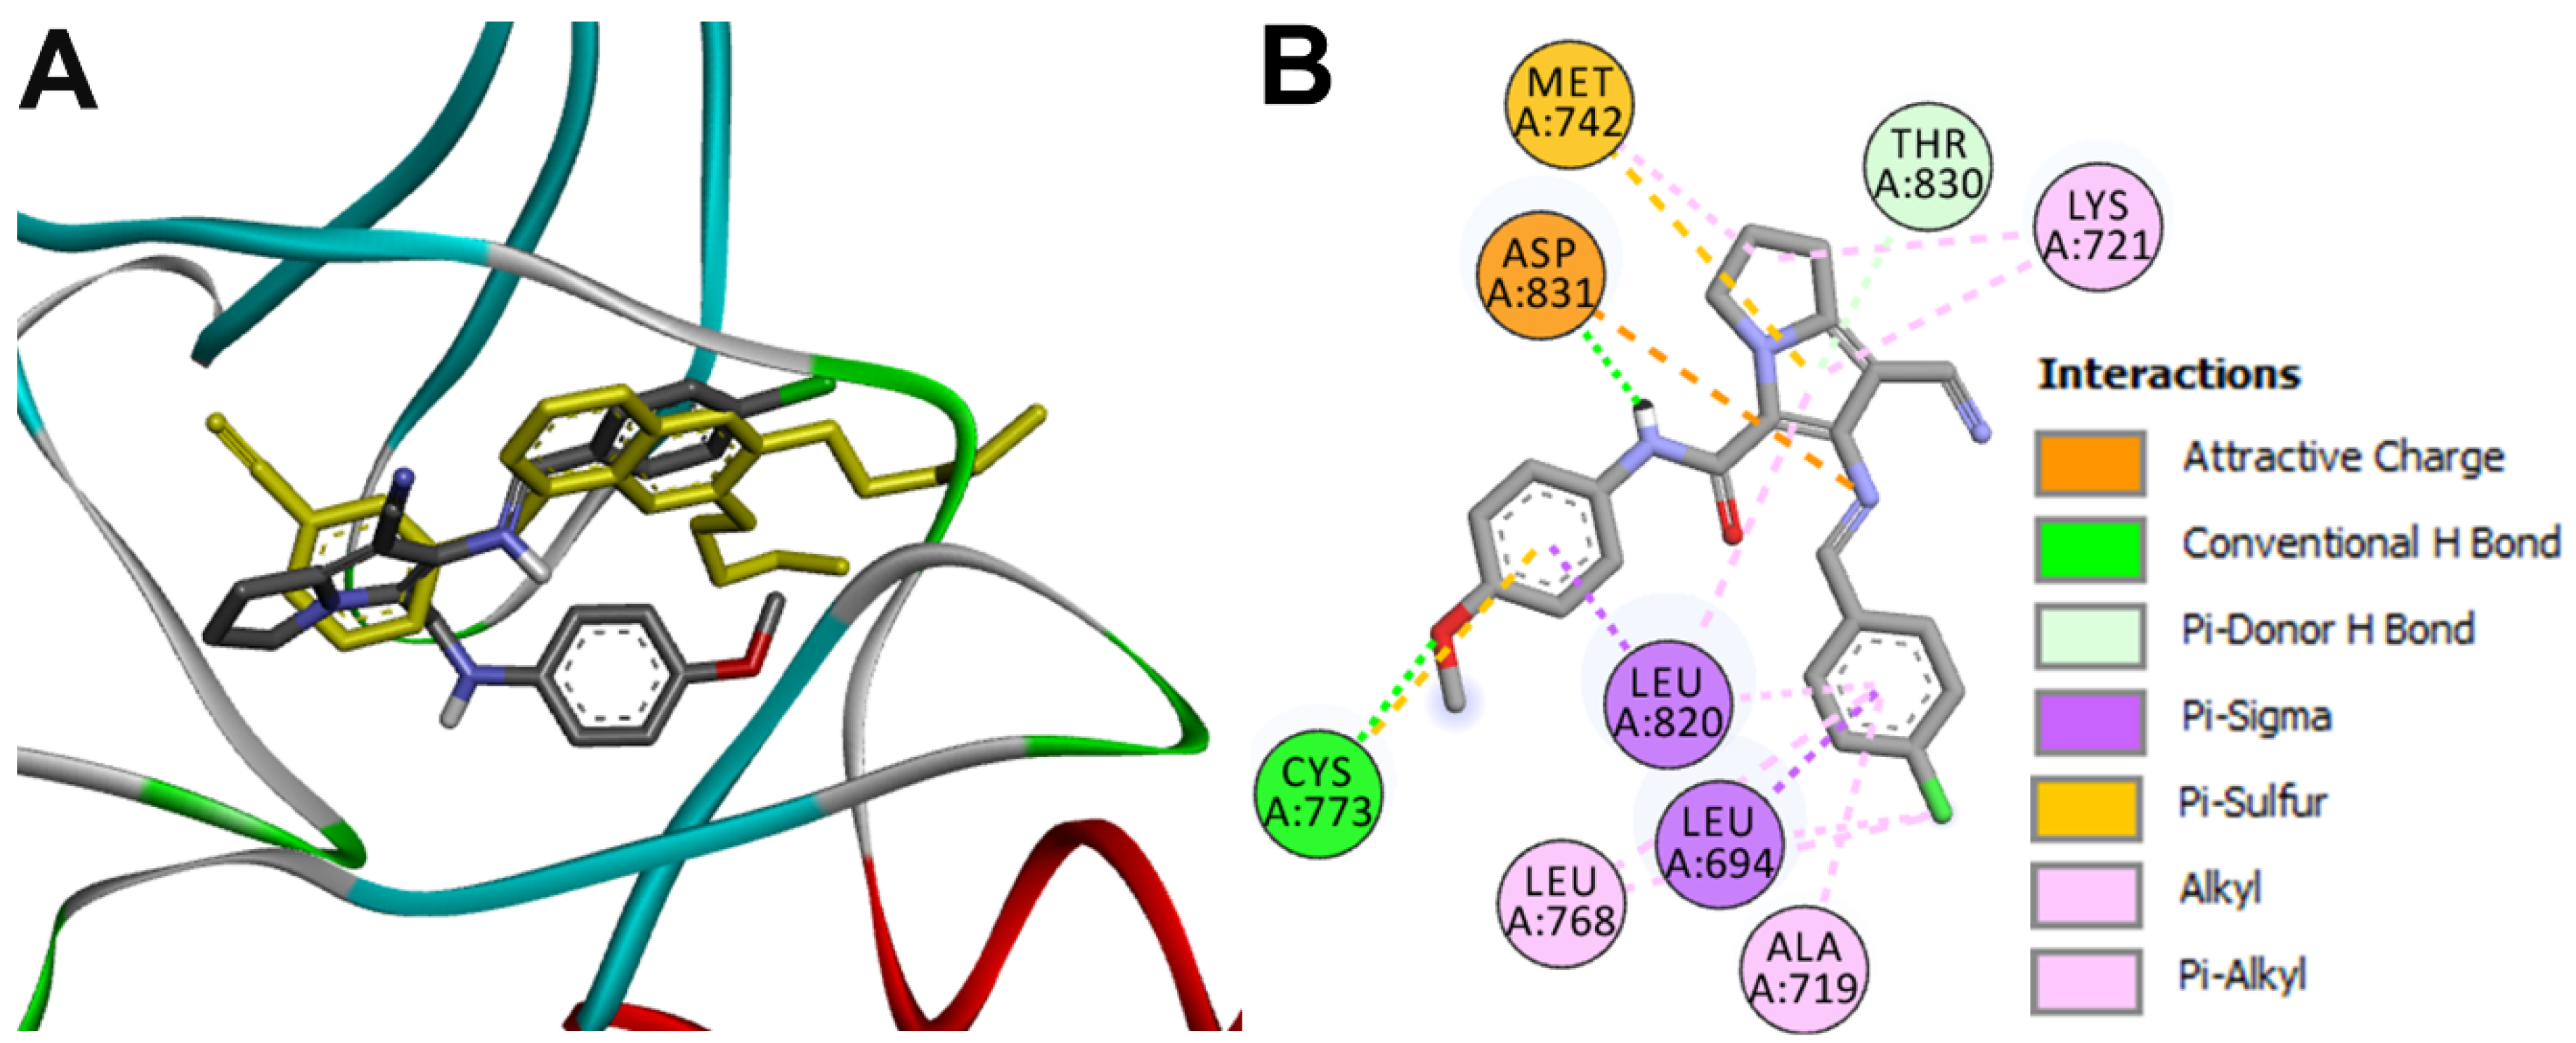
Docking into EGFR
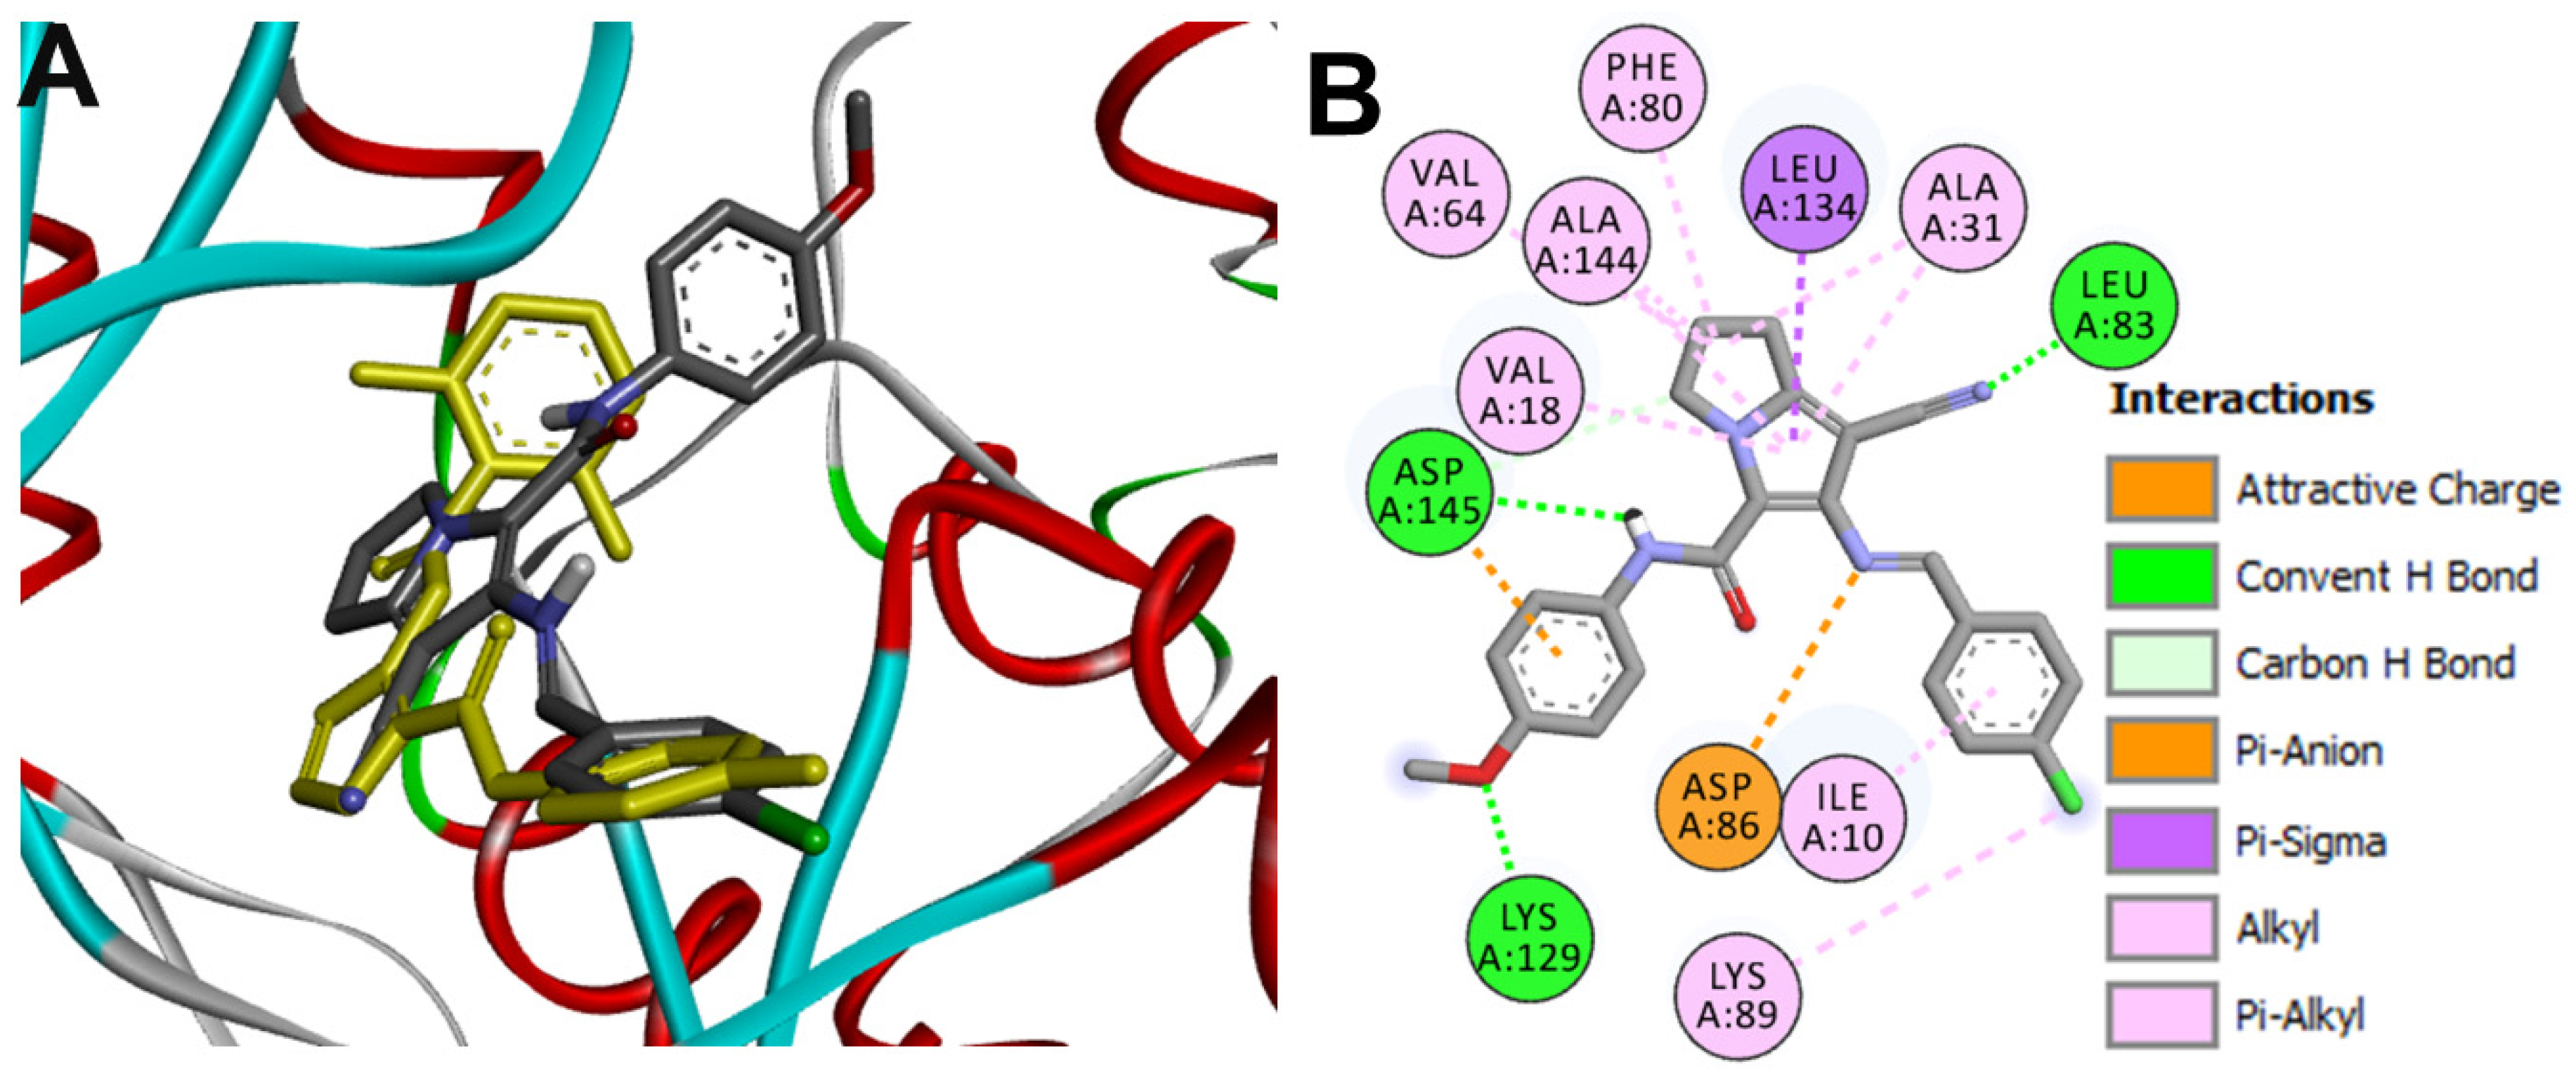
Docking into CDK2
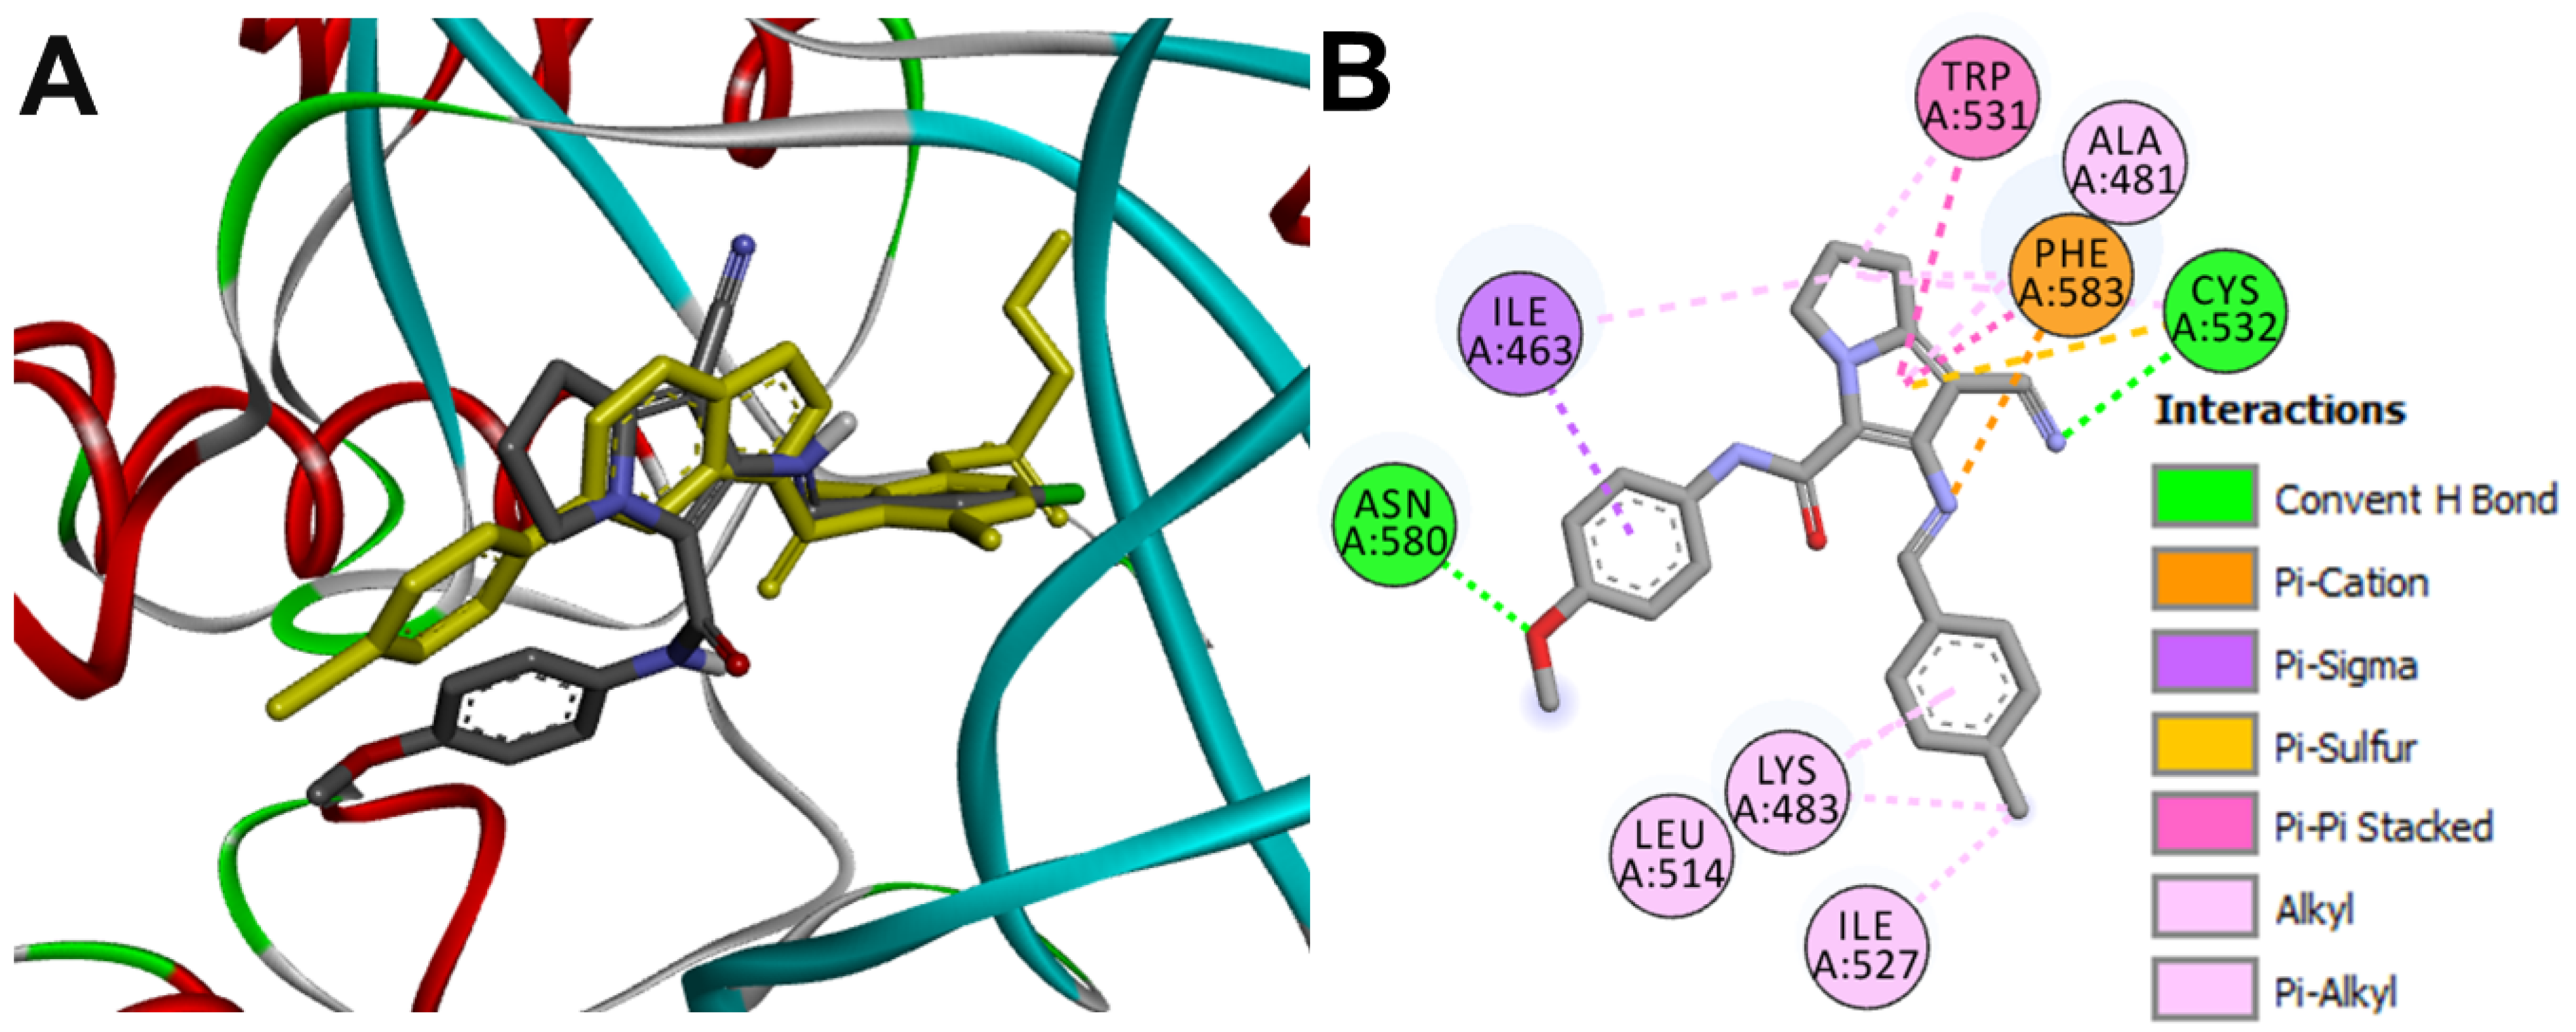
Docking into BRAF
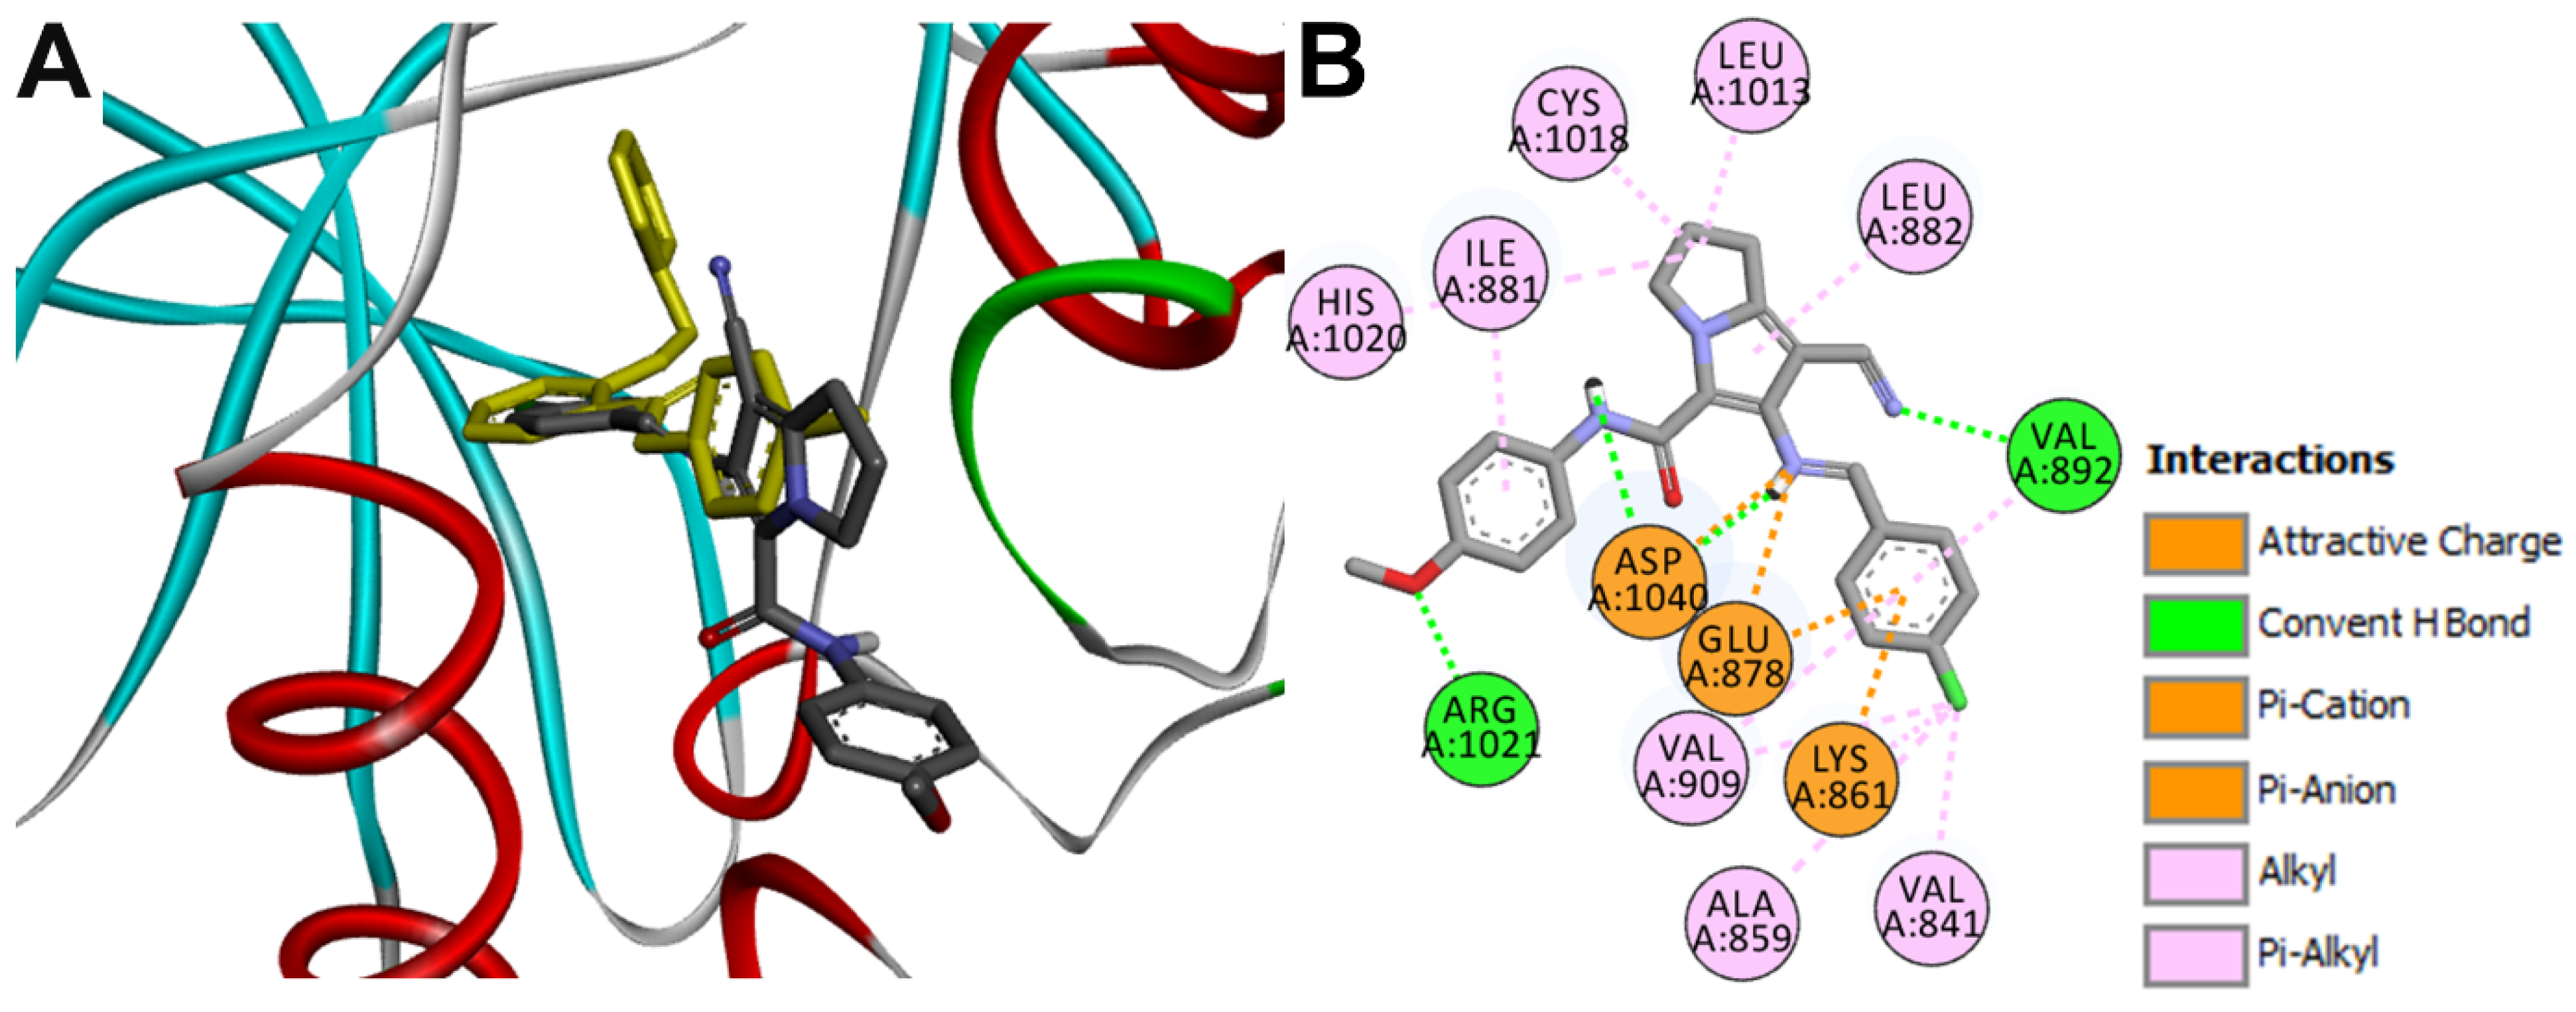
Docking into VEGFR1
2.6. Molecular Dynamic Simulation
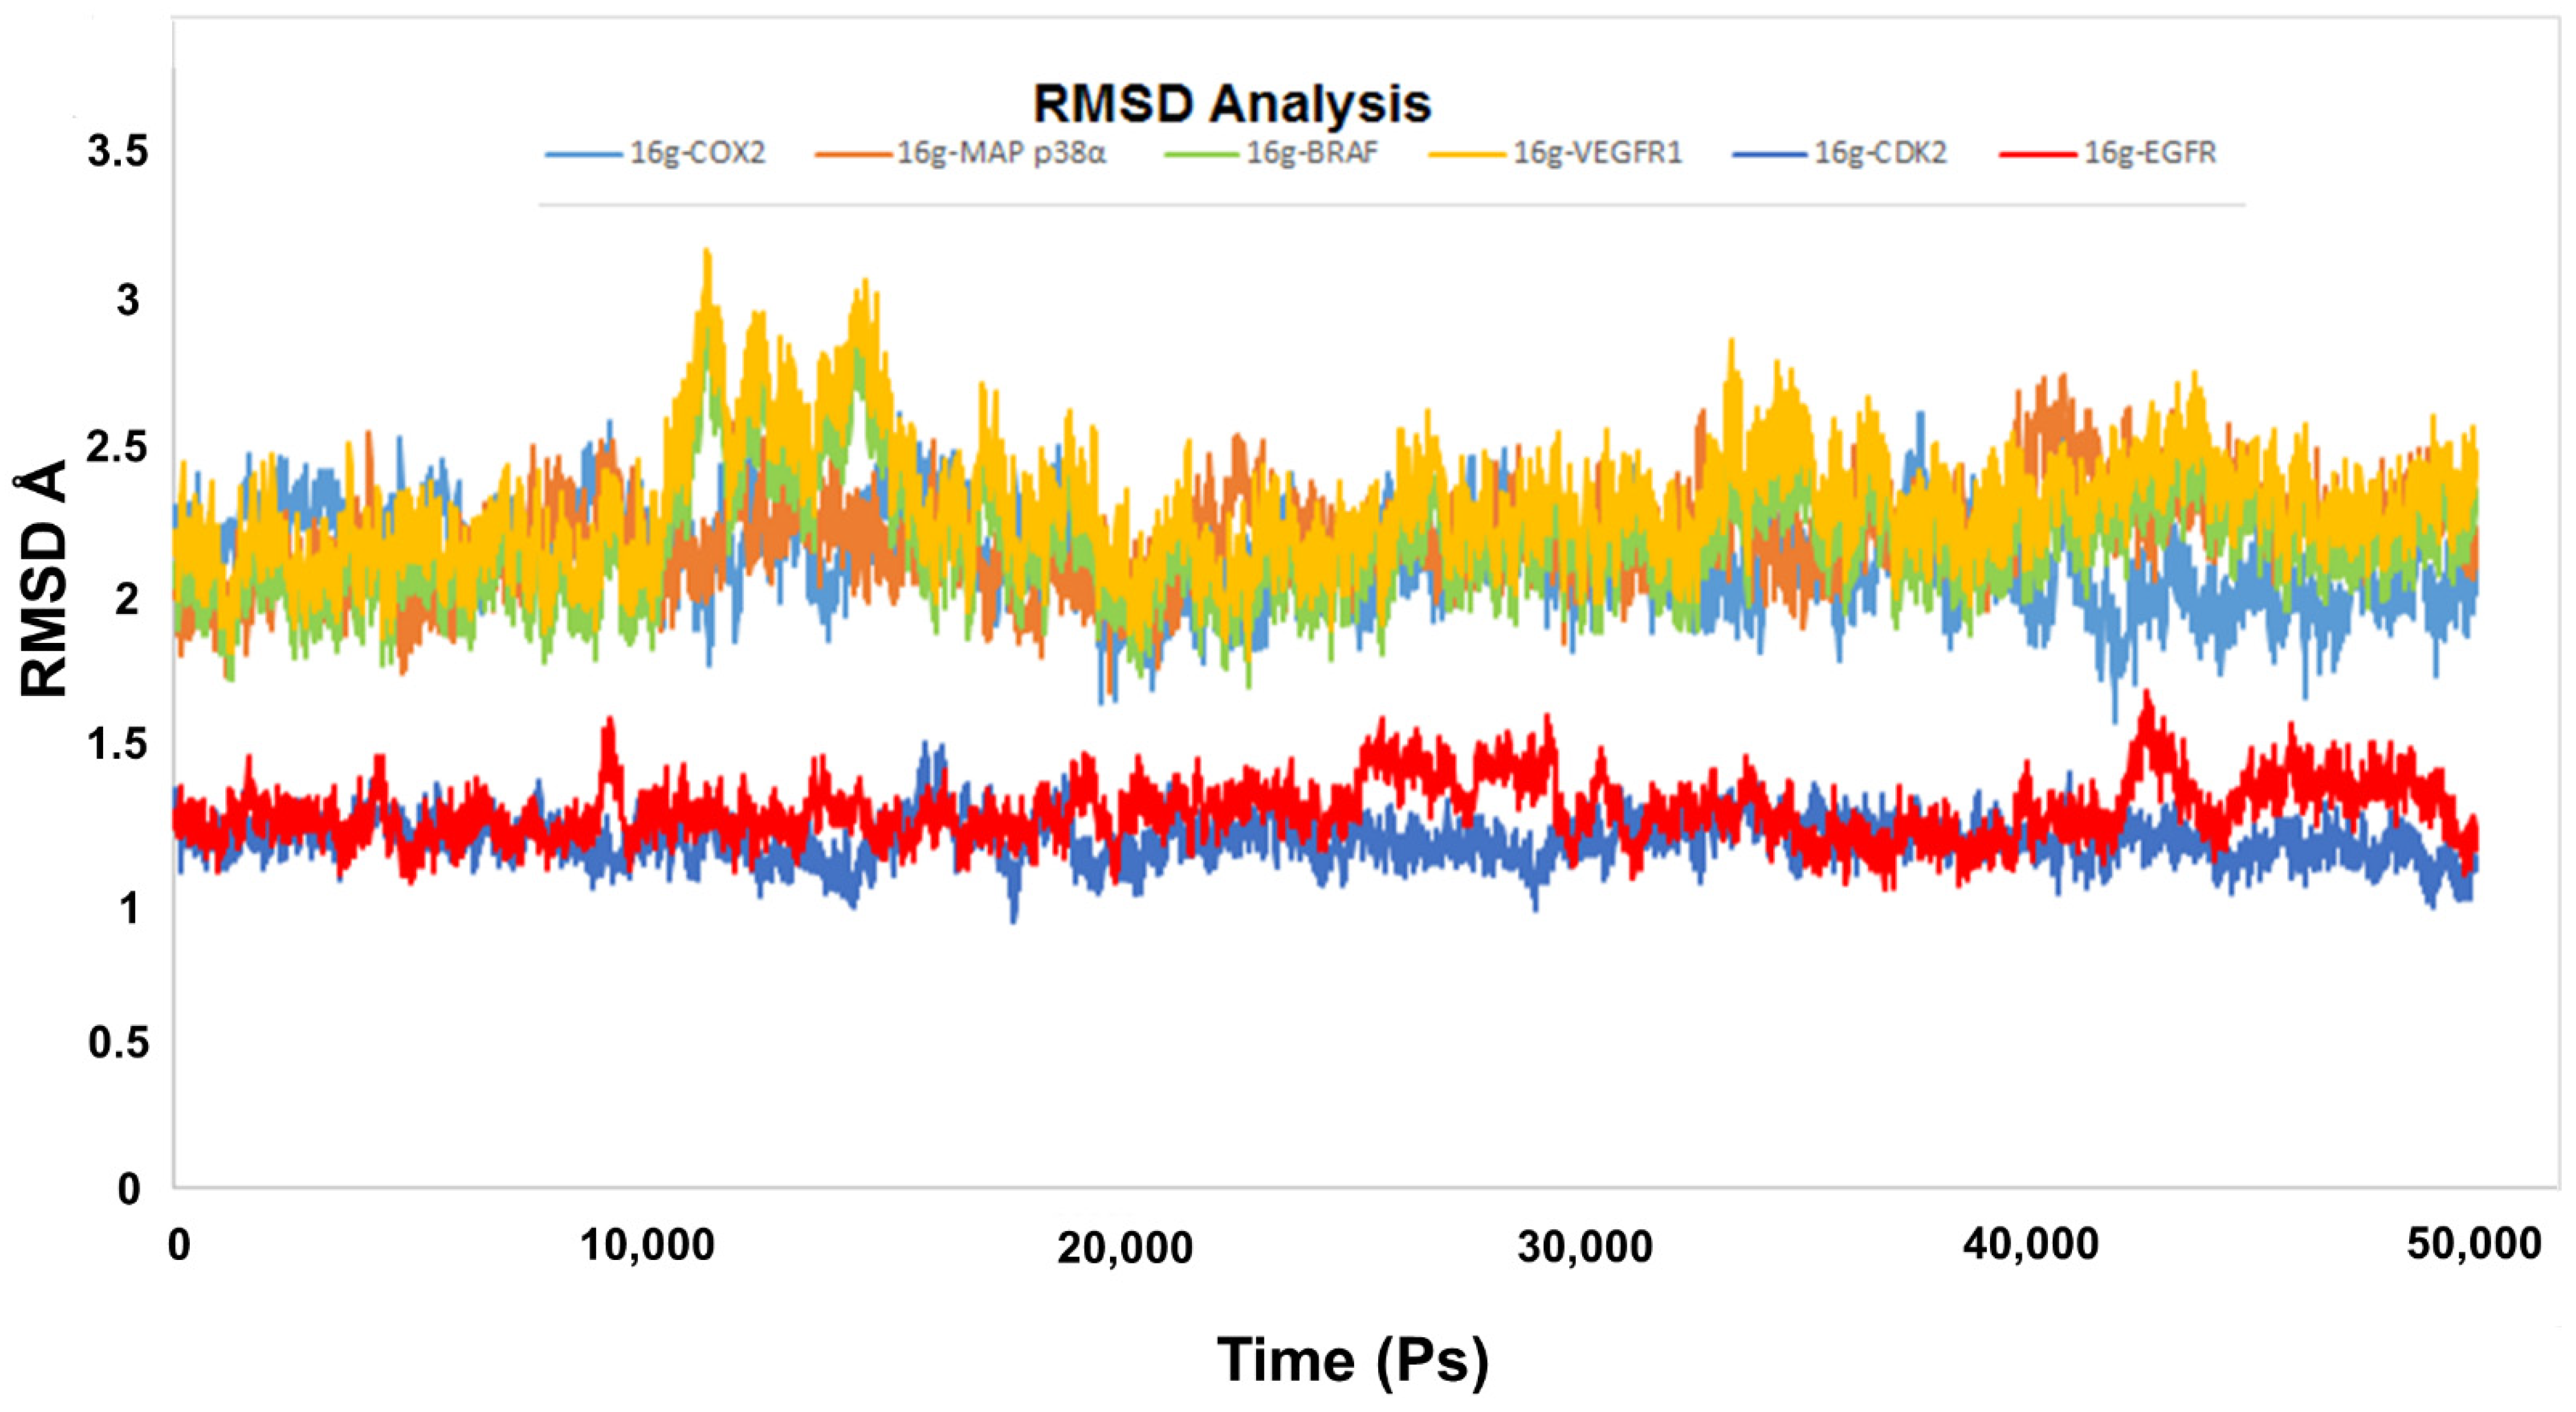
2.6.1. RMSD Analysis and Hydrogen Bond Interaction Estimation
2.6.2. MM-PBSA Calculations
2.7. ADME Study
2.7.1. Physicochemical Properties and Drug-Likeness
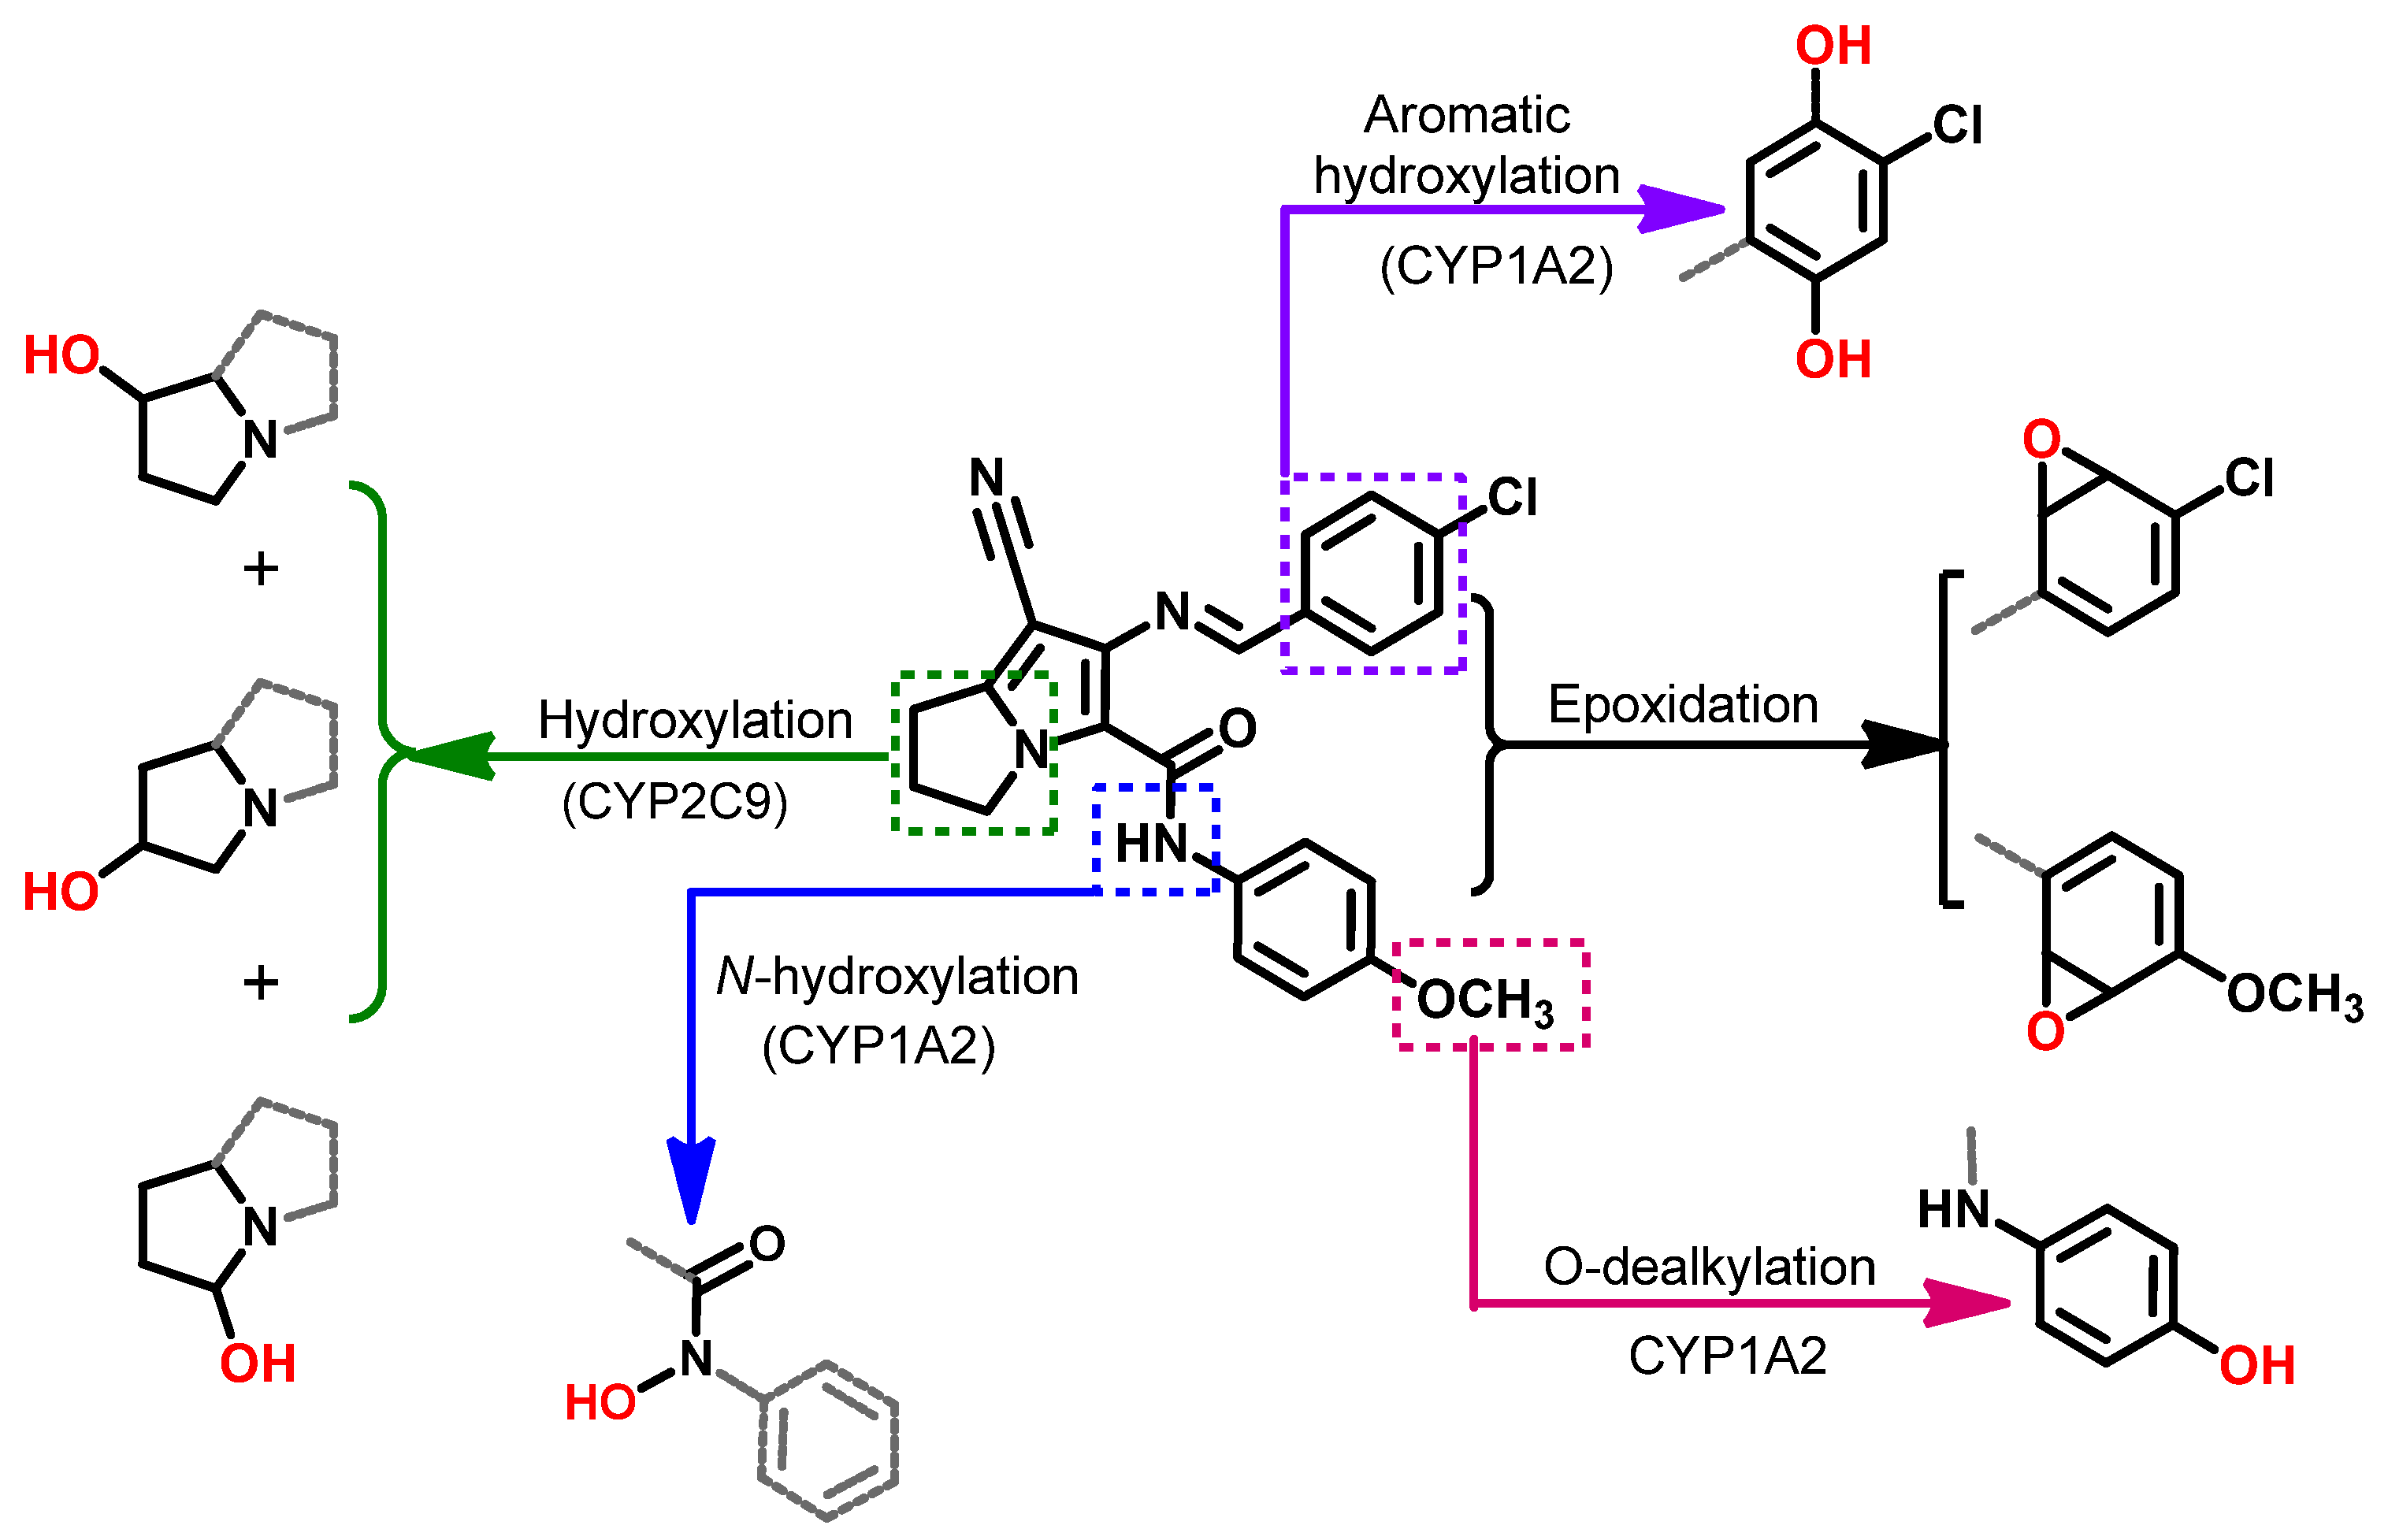
2.7.2. Metabolic Study
3. Materials and Methods
3.1. Pharmacophore Search
3.2. Chemistry
3.2.1. General Procedure (A) for Preparation of Compounds (16a–h)
7-Cyano-6-((4-(dimethylamino)benzylidene)amino)-N-(4-methoxyphenyl)-2,3-dihydro-1H-pyrrolizine-5-carboxamide (16a)
7-Cyano-6-((4-(dimethylamino)benzylidene)amino)-N-(4-fluorophenyl)-2,3-dihydro-1H-pyrrolizine-5-carboxamide (16b)
7-Cyano-N-(4-methoxyphenyl)-6-((4-methylbenzylidene)amino)-2,3-dihydro-1H-pyrrolizine-5-carboxamide (16c)
7-Cyano-N-(4-fluorophenyl)-6-((4-methylbenzylidene)amino)-2,3-dihydro-1H-pyrrolizine-5-carboxamide (16d)
7-Cyano-6-((4-fluorobenzylidene)amino)-N-(4-methoxyphenyl)-2,3-dihydro-1H-pyrrolizine-5-carboxamide (16e)
7-Cyano-6-((4-fluorobenzylidene)amino)-N-(4-fluorophenyl)-2,3-dihydro-1H-pyrrolizine-5-carboxamide (16f)
6-((4-Chlorobenzylidene)amino)-7-cyano-N-(4-methoxyphenyl)-2,3-dihydro-1H-pyrrolizine-5-carboxamide (16g)
6-((4-Chlorobenzylidene)amino)-7-cyano-N-(4-fluorophenyl)-2,3-dihydro-1H-pyrrolizine-5-carboxamide (16h)
3.3. Biological Evaluation
3.3.1. Antiproliferative Activity
Cell Culture
Antiproliferative Activity Assay
3.3.2. Cell Cycle Analysis
3.3.3. Annexin V FITC/PI Assay
3.4. Target Prediction
3.5. Molecular Docking
3.6. Molecular Dynamic Simulation
3.6.1. RMSD Analysis and Hydrogen Bond Interaction Estimation
3.6.2. MM-PBSA Calculation
3.7. ADME Study
3.7.1. Physicochemical Properties and Drug-Likeness
3.7.2. Metabolic Study
4. Conclusions
Supplementary Materials
Author Contributions
Funding
Institutional Review Board Statement
Informed Consent Statement
Data Availability Statement
Acknowledgments
Conflicts of Interest
Sample Availability
References
- Siegel, R.L.; Miller, K.D.; Fuchs, H.E.; Jemal, A. Cancer Statistics, 2021. CA Cancer J. Clin. 2021, 71, 7–33. [Google Scholar] [CrossRef]
- Gouda, A.M.; Beshr, E.A.; Almalki, F.A.; Halawah, H.H.; Taj, B.F.; Alnafaei, A.F.; Alharazi, R.S.; Kazi, W.M.; AlMatrafi, M.M. Arylpropionic acid-derived NSAIDs: New insights on derivatization, anticancer activity and potential mechanism of action. Bioorg. Chem. 2019, 92. [Google Scholar] [CrossRef]
- Rayburn, E.R.; Ezell, S.J.; Zhang, R. Anti-Inflammatory Agents for Cancer Therapy. Mol. Cell. Pharmacol. 2009, 1, 29–43. [Google Scholar] [CrossRef] [PubMed]
- Li, J.; Hao, Q.; Cao, W.; Vadgama, J.V.; Wu, Y. Celecoxib in breast cancer prevention and therapy. Cancer Manag. Res. 2018, 10, 4653–4667. [Google Scholar] [CrossRef] [Green Version]
- Kerr, D.J.; Chamberlain, S.; Kerr, R.S. Celecoxib for Stage III Colon Cancer. JAMA 2021, 325, 1257–1258. [Google Scholar] [CrossRef]
- Casanova, I.; Parreño, M.; Farré, L.; Guerrero, S.; Céspedes, M.V.; Pavon, M.A.; Sancho, F.J.; Marcuello, E.; Trias, M.; Mangues, R. Celecoxib induces anoikis in human colon carcinoma cells associated with the deregulation of focal adhesions and nuclear translocation of p130Cas. Int. J. Cancer 2006, 118, 2381–2389. [Google Scholar] [CrossRef] [PubMed]
- Suri, A.; Sheng, X.; Schuler, K.M.; Zhong, Y.; Han, X.; Jones, H.M.; Gehrig, P.A.; Zhou, C.; Bae-Jump, V.L. The effect of celecoxib on tumor growth in ovarian cancer cells and a genetically engineered mouse model of serous ovarian cancer. Oncotarget 2016, 7, 39582–39594. [Google Scholar] [CrossRef]
- Wen, B.; Wei, Y.-T.; Mu, L.-L.; Wen, G.-R.; Zhao, K. The molecular mechanisms of celecoxib in tumor development. Medicine 2020, 99, e22544. [Google Scholar] [CrossRef]
- Arico, S.; Pattingre, S.; Bauvy, C.; Gane, P.; Barbat, A.; Codogno, P.; Ogier-Denis, E. Celecoxib induces apoptosis by inhibiting 3-phosphoinositide-dependent protein kinase-1 activity in the human colon cancer HT-29 cell line. J. Biol. Chem. 2002, 277, 27613–27621. [Google Scholar] [CrossRef] [PubMed] [Green Version]
- Hsu, A.L.; Ching, T.T.; Wang, D.S.; Song, X.; Rangnekar, V.M.; Chen, C.S. The cyclooxygenase-2 inhibitor celecoxib induces apoptosis by blocking Akt activation in human prostate cancer cells independently of Bcl-2. J. Biol. Chem. 2000, 275, 11397–11403. [Google Scholar] [CrossRef] [Green Version]
- Chun, K.-S.; Kim, S.-H.; Song, Y.-S.; Surh, Y.-J. Celecoxib inhibits phorbol ester-induced expression of COX-2 and activation of AP-1 and p38 MAP kinase in mouse skin. Carcinogenesis 2004, 25, 713–722. [Google Scholar] [CrossRef] [PubMed] [Green Version]
- Zhang, Z.; Chen, F.; Shang, L. Advances in antitumor effects of NSAIDs. Cancer Manag. Res. 2018, 10, 4631–4640. [Google Scholar] [CrossRef] [Green Version]
- Joishy, S.K.; Walsh, D. The opioid-sparing effects of intravenous ketorolac as an adjuvant analgesic in cancer pain: Application in bone metastases and the opioid bowel syndrome. J. Pain Symptom Manag. 1998, 16, 334–339. [Google Scholar] [CrossRef]
- Nguyen, B.C.Q.; Takahashi, H.; Uto, Y.; Shahinozzaman, M.D.; Tawata, S.; Maruta, H. 1,2,3-Triazolyl ester of Ketorolac: A “Click Chemistry”-based highly potent PAK1-blocking cancer-killer. Eur. J. Med. Chem. 2017, 126, 270–276. [Google Scholar] [CrossRef]
- Gouda, A.M.; Abdelazeem, A.H. An integrated overview on pyrrolizines as potential anti-inflammatory, analgesic and antipyretic agents. Eur. J. Med. Chem. 2016, 114. [Google Scholar] [CrossRef]
- Becker, J.C.; Domschke, W.; Pohle, T. Current approaches to prevent NSAID-induced gastropathy--COX selectivity and beyond. Br. J. Clin. Pharmacol. 2004, 58, 587–600. [Google Scholar] [CrossRef] [Green Version]
- Liu, W.; Zhou, J.; Bensdorf, K.; Zhang, H.; Liu, H.; Wang, Y.; Qian, H.; Zhang, Y.; Wellner, A.; Rubner, G.; et al. Investigations on cytotoxicity and anti-inflammatory potency of licofelone derivatives. Eur. J. Med. Chem. 2011, 46, 907–913. [Google Scholar] [CrossRef] [PubMed]
- Tavolari, S.; Bonafè, M.; Marini, M.; Ferreri, C.; Bartolini, G.; Brighenti, E.; Manara, S.; Tomasi, V.; Laufer, S.; Guarnieri, T. Licofelone, a dual COX/5-LOX inhibitor, induces apoptosis in HCA-7 colon cancer cells through the mitochondrial pathway independently from its ability to affect the arachidonic acid cascade. Carcinogenesis 2008, 29, 371–380. [Google Scholar] [CrossRef] [Green Version]
- Narayanan, N.K.; Nargi, D.; Attur, M.; Abramson, S.B.; Narayanan, B.A. Anticancer effects of licofelone (ML-3000) in prostate cancer cells. Anticancer Res. 2007, 27, 2393–2402. [Google Scholar]
- Gouda, A.M.; Abdelazeem, A.H.; Abdalla, A.N.; Ahmed, M. Pyrrolizine-5-carboxamides: Exploring the impact of various substituents on anti-inflammatory and anticancer activities. Acta Pharm. 2018, 68. [Google Scholar] [CrossRef] [Green Version]
- Yu, W.; MacKerell, A.D.J. Computer-Aided Drug Design Methods. Methods Mol. Biol. 2017, 1520, 85–106. [Google Scholar] [CrossRef] [Green Version]
- Baig, M.H.; Ahmad, K.; Rabbani, G.; Danishuddin, M.; Choi, I. Computer Aided Drug Design and its Application to the Development of Potential Drugs for Neurodegenerative Disorders. Curr. Neuropharmacol. 2018, 16, 740–748. [Google Scholar] [CrossRef] [PubMed]
- Agamah, F.E.; Mazandu, G.K.; Hassan, R.; Bope, C.D.; Thomford, N.E.; Ghansah, A.; Chimusa, E.R. Computational/in silico methods in drug target and lead prediction. Brief. Bioinform. 2020, 21, 1663–1675. [Google Scholar] [CrossRef]
- Sunseri, J.; Koes, D.R. Pharmit: Interactive exploration of chemical space. Nucleic Acids Res. 2016, 44, W442–W448. [Google Scholar] [CrossRef] [Green Version]
- Kurumbail, R.G.; Stevens, A.M.; Gierse, J.K.; McDonald, J.J.; Stegeman, R.A.; Pak, J.Y.; Gildehaus, D.; Miyashiro, J.M.; Penning, T.D.; Seibert, K.; et al. Structural basis for selective inhibition of cyclooxygenase-2 by anti-inflammatory agents. Nature 1996, 384, 644–648. [Google Scholar] [CrossRef]
- Wang, J.L.; Limburg, D.; Graneto, M.J.; Springer, J.; Hamper, J.R.B.; Liao, S.; Pawlitz, J.L.; Kurumbail, R.G.; Maziasz, T.; Talley, J.J.; et al. The novel benzopyran class of selective cyclooxygenase-2 inhibitors. Part 2: The second clinical candidate having a shorter and favorable human half-life. Bioorg. Med. Chem. Lett. 2010, 20, 7159–7163. [Google Scholar] [CrossRef] [PubMed]
- Orlando, B.J.; Malkowski, M.G. Crystal structure of rofecoxib bound to human cyclooxygenase-2. Acta Crystallogr. Sect. F Struct. Biol. Commun. 2016, 72, 772–776. [Google Scholar] [CrossRef] [PubMed] [Green Version]
- Dassault systems BIOVIA. Discovery Studio Visualizer, v16.1.0.15350; Dassault Systems: San Diego, CA, USA, 2016. [Google Scholar]
- Chan, C.C.; Boyce, S.; Brideau, C.; Charleson, S.; Cromlish, W.; Ethier, D.; Evans, J.; Ford-Hutchinson, A.W.; Forrest, M.J.; Gauthier, J.Y.; et al. Rofecoxib [Vioxx, MK-0966; 4-(4′-methylsulfonylphenyl)-3-phenyl-2-(5H)-furanone]: A potent and orally active cyclooxygenase-2 inhibitor. Pharmacological and biochemical profiles. J. Pharmacol. Exp. Ther. 1999, 290, 551–560. [Google Scholar]
- SwissADME. Available online: http://www.swissadme.ch/ (accessed on 30 April 2021).
- Molsoft. Available online: http://molsoft.com/mprop/ (accessed on 30 April 2021).
- Shawky, A.M.; Abdalla, A.N.; Ibrahim, N.A.; Abourehab, M.A.; Gouda, A.M. Discovery of new pyrimidopyrrolizine/indolizine-based derivatives as P-glycoprotein inhibitors: Design, synthesis, cytotoxicity, and MDR reversal activities. Eur. J. Med. Chem. 2021, 218, 113403. [Google Scholar] [CrossRef] [PubMed]
- Shawky, A.M.; Ibrahim, N.A.; Abourehab, M.A.S.; Abdalla, A.N.; Gouda, A.M. Pharmacophore-based virtual screening, synthesis, biological evaluation, and molecular docking study of novel pyrrolizines bearing urea/thiourea moieties with potential cytotoxicity and CDK inhibitory activities. J. Enzyme Inhib. Med. Chem. 2021, 36. [Google Scholar] [CrossRef]
- Elsaady, M.T.; Gouda, A.M.; Edrees, F.H.; Gawad, N.M.A. synthesis and biological evaluation of some novel Schiff base derivatives as potential anticancer agents. J. Chem. Pharm. Res. 2016, 8, 273–282. [Google Scholar]
- Alkahtani, H.M.; Alanazi, M.M.; Aleanizy, F.S.; Alqahtani, F.Y.; Alhoshani, A.; Alanazi, F.E.; Almehizia, A.A.; Abdalla, A.N.; Alanazi, M.G.; El-Azab, A.S.; et al. Synthesis, anticancer, apoptosis-inducing activities and EGFR and VEGFR2 assay mechanistic studies of 5,5-diphenylimidazolidine-2,4-dione derivatives: Molecular docking studies. Saudi Pharm. J. SPJ Off. Publ. Saudi Pharm. Soc. 2019, 27, 682–693. [Google Scholar] [CrossRef] [PubMed]
- Abdalla, A.N.; Malki, W.H.; Qattan, A.; Shahid, I.; Hossain, M.A.; Ahmed, M. Chemosensitization of HT29 and HT29-5FU Cell Lines by a Combination of a Multi-Tyrosine Kinase Inhibitor and 5FU Downregulates ABCC1 and Inhibits PIK3CA in Light of Their Importance in Saudi Colorectal Cancer. Molecules 2021, 26, 334. [Google Scholar] [CrossRef]
- Abdalla, A.N.; Qattan, A.; Malki, W.H.; Shahid, I.; Hossain, M.A.; Ahmed, M. Significance of Targeting VEGFR-2 and Cyclin D1 in Luminal-A Breast Cancer. Molecules 2020, 25, 4606. [Google Scholar] [CrossRef] [PubMed]
- Hixson, L.J.; Alberts, D.S.; Krutzsch, M.; Einsphar, J.; Brendel, K.; Gross, P.H.; Paranka, N.S.; Baier, M.; Emerson, S.; Pamukcu, R. Antiproliferative effect of nonsteroidal antiinflammatory drugs against human colon cancer cells. Cancer Epidemiol. Prev. Biomark. 1994, 3, 433–438. [Google Scholar]
- Daina, A.; Michielin, O.; Zoete, V. SwissTargetPrediction: Updated data and new features for efficient prediction of protein targets of small molecules. Nucleic Acids Res. 2019, 47, W357–W364. [Google Scholar] [CrossRef] [PubMed] [Green Version]
- Koul, H.K.; Pal, M.; Koul, S. Role of p38 MAP Kinase Signal Transduction in Solid Tumors. Genes Cancer 2013, 4, 342–359. [Google Scholar] [CrossRef]
- Simard, J.R.; Getlik, M.; Grütter, C.; Pawar, V.; Wulfert, S.; Rabiller, M.; Rauh, D. Development of a fluorescent-tagged kinase assay system for the detection and characterization of allosteric kinase inhibitors. J. Am. Chem. Soc. 2009, 131, 13286–13296. [Google Scholar] [CrossRef]
- Stamos, J.; Sliwkowski, M.X.; Eigenbrot, C. Structure of the epidermal growth factor receptor kinase domain alone and in complex with a 4-anilinoquinazoline inhibitor. J. Biol. Chem. 2002, 277, 46265–46272. [Google Scholar] [CrossRef] [Green Version]
- Wyatt, P.G.; Woodhead, A.J.; Berdini, V.; Boulstridge, J.A.; Carr, M.G.; Cross, D.M.; Davis, D.J.; Devine, L.A.; Early, T.R.; Feltell, R.E.; et al. Identification of N-(4-piperidinyl)-4-(2,6-dichlorobenzoylamino)-1H-pyrazole-3-carboxamide (AT7519), a novel cyclin dependent kinase inhibitor using fragment-based X-ray crystallography and structure based drug design. J. Med. Chem. 2008, 51, 4986–4999. [Google Scholar] [CrossRef]
- Karoulia, Z.; Wu, Y.; Ahmed, T.A.; Xin, Q.; Bollard, J.; Krepler, C.; Wu, X.; Zhang, C.; Bollag, G.; Herlyn, M.; et al. An Integrated Model of RAF Inhibitor Action Predicts Inhibitor Activity against Oncogenic BRAF Signaling. Cancer Cell 2016, 30, 485–498. [Google Scholar] [CrossRef] [PubMed] [Green Version]
- Sun, Q.; Zhou, J.; Zhang, Z.; Guo, M.; Liang, J.; Zhou, F.; Long, J.; Zhang, W.; Yin, F.; Cai, H.; et al. Discovery of fruquintinib, a potent and highly selective small molecule inhibitor of VEGFR 1, 2, 3 tyrosine kinases for cancer therapy. Cancer Biol. Ther. 2014, 15, 1635–1645. [Google Scholar] [CrossRef] [PubMed] [Green Version]
- Morris, G.M.; Huey, R.; Lindstrom, W.; Sanner, M.F.; Belew, R.K.; Goodsell, D.S.; Olson, A.J. AutoDock4 and AutoDockTools4: Automated docking with selective receptor flexibility. J. Comput. Chem. 2009, 30, 2785–2791. [Google Scholar] [CrossRef] [Green Version]
- Daina, A.; Michielin, O.; Zoete, V. SwissADME: A free web tool to evaluate pharmacokinetics, drug-likeness and medicinal chemistry friendliness of small molecules. Sci. Rep. 2017, 7, 42717. [Google Scholar] [CrossRef] [Green Version]
- Djoumbou-Feunang, Y.; Fiamoncini, J.; Gil-de-la-Fuente, A.; Greiner, R.; Manach, C.; Wishart, D.S. BioTransformer: A comprehensive computational tool for small molecule metabolism prediction and metabolite identification. J. Cheminform. 2019, 11, 2. [Google Scholar] [CrossRef] [PubMed] [Green Version]
- Almalki, F.A.; Gouda, A.M.; Ali, M.H.B.; Almehmadi, O.M. Profens: A comparative molecular docking study into cyclooxygenase-1/2. Drug Invent. Today 2019, 11, 480–487. [Google Scholar]
- Mohamed, F.A.M.; Gomaa, H.A.; Hendawy, O.; Ali, A.T.; Farghaly, H.S.; Gouda, A.M.; Abdelazeem, A.H.; Abdelrahman, M.H.; Trembleau, L.; Youssif, B.G.M. Design, synthesis, and biological evaluation of novel EGFR inhibitors containing 5-chloro-3-hydroxymethyl-indole-2-carboxamide scaffold with apoptotic antiproliferative activity. Bioorg. Chem. 2021, 112, 104960. [Google Scholar] [CrossRef]
- Abraham, M.J.; Murtola, T.; Schulz, R.; Páll, S.; Smith, J.C.; Hess, B.; Lindahl, E. GROMACS: High performance molecular simulations through multi-level parallelism from laptops to supercomputers. SoftwareX 2015, 1–2, 19–25. [Google Scholar] [CrossRef] [Green Version]
- Malde, A.K.; Zuo, L.; Breeze, M.; Stroet, M.; Poger, D.; Nair, P.C.; Oostenbrink, C.; Mark, A.E. An Automated Force Field Topology Builder (ATB) and Repository: Version 1.0. J. Chem. Theory Comput. 2011, 7, 4026–4037. [Google Scholar] [CrossRef]
- Bhardwaj, V.K.; Singh, R.; Sharma, J.; Rajendran, V.; Purohit, R.; Kumar, S. Identification of bioactive molecules from tea plant as SARS-CoV-2 main protease inhibitors. J. Biomol. Struct. Dyn. 2020, 1–10. [Google Scholar] [CrossRef]
- Chiu, S.-W.; Pandit, S.A.; Scott, H.L.; Jakobsson, E. An Improved United Atom Force Field for Simulation of Mixed Lipid Bilayers. J. Phys. Chem. B 2009, 113, 2748–2763. [Google Scholar] [CrossRef] [PubMed]
- Berendsen, H.J.C.; Postma, J.P.M.; van Gunsteren, W.F.; DiNola, A.; Haak, J.R. Molecular dynamics with coupling to an external bath. J. Chem. Phys. 1984, 81, 3684–3690. [Google Scholar] [CrossRef] [Green Version]
- Parrinello, M.; Rahman, A. Polymorphic transitions in single crystals: A new molecular dynamics method. J. Appl. Phys. 1981, 52, 7182–7190. [Google Scholar] [CrossRef]
- Kumari, R.; Kumar, R.; Lynn, A. g_mmpbsa—A GROMACS tool for high-throughput MM-PBSA calculations. J. Chem. Inf. Model. 2014, 54, 1951–1962. [Google Scholar] [CrossRef] [PubMed]


| Hits | Code | RMSD a | MW b | RBs c |
|---|---|---|---|---|
| 1 | 4och3pyr | 0.753 | 427 | 7 |
| 2 | 4och3pyr | 0.765 | 414 | 7 |
| 3 | 4och3pyr | 0.769 | 419 | 6 |
| 4 | 4och3pyr | 0.769 | 510 | 6 |
| 5 | 4och3pyr | 0.769 | 398 | 6 |
| 6 | 4och3pyr | 0.769 | 402 | 6 |
| 7 | 4och3pyr | 0.769 | 463 | 6 |
| 8 | 8chpyr | 0.777 | 419 | 6 |
| 9 | 10ipyr | 0.777 | 510 | 6 |
| 10 | 3ch3pyr | 0.777 | 398 | 6 |
| 11 | 9brpyr | 0.777 | 463 | 6 |
| 12 | 7fpyr | 0.777 | 402 | 6 |
| 13 | 10ipyr | 0.780 | 510 | 6 |
| 14 | 9brpyr | 0.780 | 463 | 6 |
| 15 | 7fpyr | 0.780 | 402 | 6 |
| Comp. | IC50 (µM) a,b | ||
|---|---|---|---|
| MCF7 | A2780 | HT29 | |
| 16a | 40.50 ± 10.64 | 13.94 ± 1.92 | 0.19 ± 0.02 |
| 16b | 0.08 ± 0.01 | 0.90 ± 0.08 | 10.22 ± 0.12 |
| 16c | 0.03 ± 0.01 | 0.14 ± 0.02 | 2.27 ± 0.61 |
| 16d | 7.05 ± 0.28 | 21.16 ± 2.43 | 0.17 ± 0.01 |
| 16e | 0.15 ± 0.02 | 1.40 ± 0.21 | 0.34 ± 0.03 |
| 16f | 40.45 ± 7.70 | 0.49 ± 0.12 | 0.21 ± 0.12 |
| 16g | 0.01 ± 0.00 | 0.56 ± 0.01 | 0.37 ± 0.18 |
| 16h | 26.95 ± 1.67 | 42.57 ± 3.47 | 0.71 ± 0.29 |
| 10c | 0.33 ± 0.12 | 0.44 ± 0.01 | 0.41 ± 0.02 |
| Lapatinib | 5.98 ± 1.31 | 9.86 ± 1.72 | 13.22 ± 1.82 |
| Comp. | MRC5 (IC50 (µM) a,b) | Selectivity Index b | ||
|---|---|---|---|---|
| MCF7 | A2780 | HT29 | ||
| 16a | 1.27 ± 0.48 | 0.03 | 0.09 | 6.68 |
| 16b | 1.27 ± 0.32 | 15.88 | 1.41 | 0.12 |
| 16c | 24.06 ± 1.31 | 802.00 | 171.86 | 10.60 |
| 16d | 2.42 ± 0.56 | 0.34 | 0.11 | 14.24 |
| 16e | 2.77 ± 0.09 | 18.47 | 1.98 | 8.15 |
| 16f | 1.34 ± 0.45 | 0.03 | 2.73 | 6.38 |
| 16g | 5.78 ± 0.63 | 578.00 | 10.32 | 15.62 |
| 16h | 1.60 ± 0.12 | 0.06 | 0.04 | 2.25 |
| Lapatinib | 14.89 ± 2.45 | 2.49 | 1.51 | 1.13 |
| Comp. | Molecular Targets | |||||
|---|---|---|---|---|---|---|
| COX-2 | P38α | EGFR | CDK2 | BRAF | VEGFR1 | |
| 16a | + | + | + | + | − | - |
| 16b | + | − | + | + | + | + |
| 16c | + | + | + | + | − | + |
| 16d | + | − | + | + | − | + |
| 16e | + | + | + | + | + | + |
| 16f | + | − | − | + | + | + |
| 16g | + | + | + | + | + | + |
| 16h | + | + | + | + | − | + |
| 10 | + | + | + | + | − | + |
| Complex | Amino Acids Involved | Average Distance (Å) ± SD |
|---|---|---|
| 16g-COX2 | Arg106 | 3.52 ± 0.66 |
| Arg106 | 3.46 ± 0.51 | |
| Tyr341 | 2.99 ± 0.72 | |
| Ser516 | 2.83 ± 0.37 | |
| 16g-P38 | Lys53 | 2.71 ± 0.81 |
| Lys53 | 2.68 ± 0.56 | |
| Met109 | 2.00 ± 0.39 | |
| Leu171 | 3.01± 0.78 | |
| 16g-BRAF | Cys532 | 3.1 ± 0.29 |
| Asn580 | 2.49 ± 0.5 | |
| 16g-VEGFR1 | Val892 | 3.02 ± 0.33 |
| Arg1021 | 2.41 ± 0.53 | |
| Asp1040 | 2.15 ± 0.55 | |
| Asp1040 | 3.22 ± 0.6 | |
| 16g-CDK2 | Leu83 | 1.98 ± 0.04 |
| Lys129 | 2.03 ± 0.11 | |
| Asp145 | 2.28 ± 0.06 | |
| 16g-EGFR | Cyc773 | 2.87 ± 0.20 |
| Asp831 | 1.88 ± 0.09 |
| Complex | ΔEbinding (kj/mol) | ΔEElectrostatic (kj/mol) | ΔEVan der Waals’ (kj/mol) | ΔEpolar solvation (kj/mol) | SASA (kJ/mol) |
|---|---|---|---|---|---|
| 16g-CDK2 | −401 ± 20 | −160 ± 17 | −320 ± 28 | 107 ± 15 | −28 ± 2 |
| 16g-EGFR | −387 ± 18 | −155 ± 17 | −306 ± 24 | 103 ± 14 | −29 ± 2 |
| 16g-COX-2 | −360 ± 14 | −139 ± 13 | −291 ± 20 | 95 ± 12 | −25 ± 1 |
| 16g-p38α | −354 ± 17 | −128 ± 14 | −294 ± 24 | 92 ± 14 | −26 ± 3 |
| 16g-BRAF | −337 ± 17 | −126 ± 13 | −280 ± 22 | 92 ± 15 | −23 ± 1 |
| 16g-VEGFR1 | −328 ± 15 | −106 ± 12 | −285 ± 22 | 85 ± 10 | −22 ± 1 |
| Comp. | Physicochemical Properties | Lipinski’s Rule | %Abs d | BS | DLS | ||||
|---|---|---|---|---|---|---|---|---|---|
| MW a | TPSA b | ilogP c | HA | HD | |||||
| 16a | 427.50 | 82.65 | 3.58 | 4 | 1 | Yes | 80.49 | 0.55 | 0.25 |
| 16b | 415.46 | 73.42 | 3.97 | 4 | 1 | Yes | 83.67 | 0.55 | 0.46 |
| 16c | 398.46 | 79.41 | 3.62 | 4 | 1 | Yes | 81.60 | 0.55 | 0.44 |
| 16d | 386.42 | 70.18 | 3.37 | 4 | 1 | Yes | 84.79 | 0.55 | 0.63 |
| 16e | 402.42 | 79.41 | 3.94 | 5 | 1 | Yes | 81.60 | 0.55 | 0.77 |
| 16f | 390.39 | 70.18 | 3.27 | 5 | 1 | Yes | 84.79 | 0.55 | 0.65 |
| 16g | 418.88 | 79.41 | 3.82 | 4 | 1 | Yes | 81.60 | 0.55 | 0.95 |
| 16h | 406.84 | 70.18 | 3.46 | 4 | 1 | Yes | 84.79 | 0.55 | 0.76 |
| 10 | 402.88 | 70.18 | 3.48 | 3 | 1 | Yes | 84.79 | 0.55 | 0.80 |
Publisher’s Note: MDPI stays neutral with regard to jurisdictional claims in published maps and institutional affiliations. |
© 2021 by the authors. Licensee MDPI, Basel, Switzerland. This article is an open access article distributed under the terms and conditions of the Creative Commons Attribution (CC BY) license (https://creativecommons.org/licenses/by/4.0/).
Share and Cite
Almalki, F.A.; Abdalla, A.N.; Shawky, A.M.; El Hassab, M.A.; Gouda, A.M. In Silico Approach Using Free Software to Optimize the Antiproliferative Activity and Predict the Potential Mechanism of Action of Pyrrolizine-Based Schiff Bases. Molecules 2021, 26, 4002. https://doi.org/10.3390/molecules26134002
Almalki FA, Abdalla AN, Shawky AM, El Hassab MA, Gouda AM. In Silico Approach Using Free Software to Optimize the Antiproliferative Activity and Predict the Potential Mechanism of Action of Pyrrolizine-Based Schiff Bases. Molecules. 2021; 26(13):4002. https://doi.org/10.3390/molecules26134002
Chicago/Turabian StyleAlmalki, Faisal A., Ashraf N. Abdalla, Ahmed M. Shawky, Mahmoud A. El Hassab, and Ahmed M. Gouda. 2021. "In Silico Approach Using Free Software to Optimize the Antiproliferative Activity and Predict the Potential Mechanism of Action of Pyrrolizine-Based Schiff Bases" Molecules 26, no. 13: 4002. https://doi.org/10.3390/molecules26134002
APA StyleAlmalki, F. A., Abdalla, A. N., Shawky, A. M., El Hassab, M. A., & Gouda, A. M. (2021). In Silico Approach Using Free Software to Optimize the Antiproliferative Activity and Predict the Potential Mechanism of Action of Pyrrolizine-Based Schiff Bases. Molecules, 26(13), 4002. https://doi.org/10.3390/molecules26134002