
The Evaluation of Multiple Linear Regression–Based Limited Sampling Strategies for Mycophenolic Acid in Children with Nephrotic Syndrome

 ,
,
Abstract
1. Introduction
2. Results
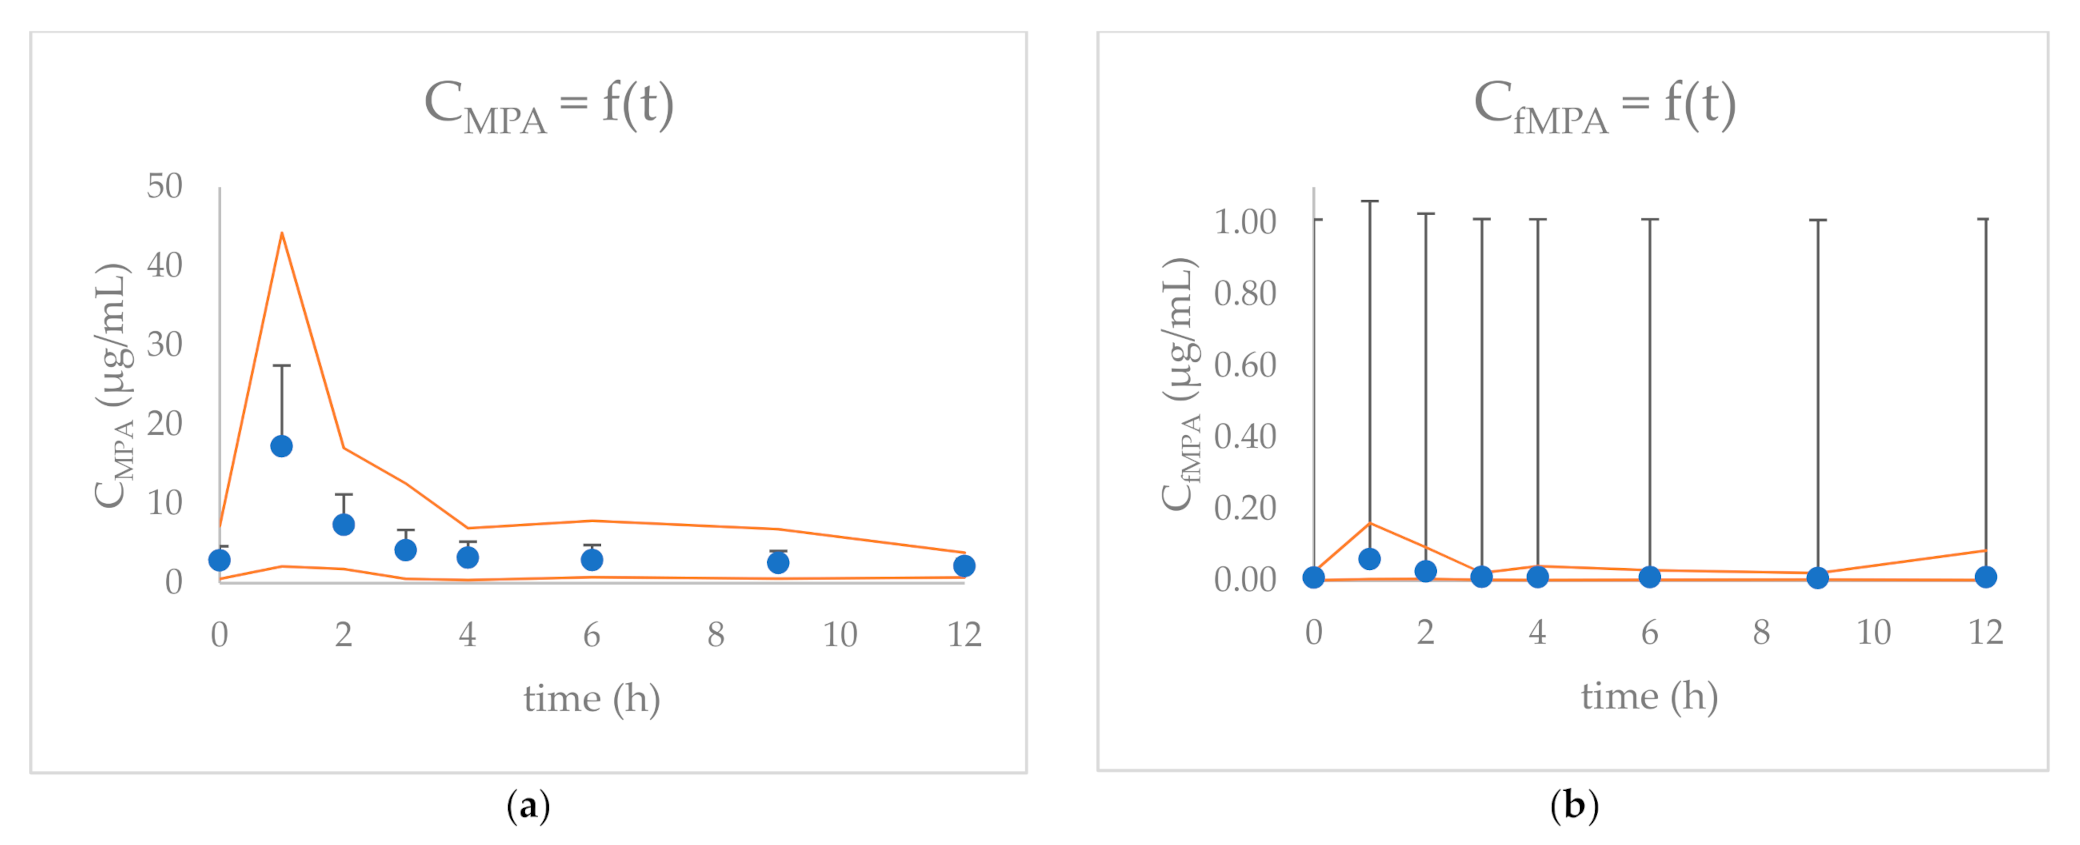
2.1. MPA and fMPA Pharmacokinetics
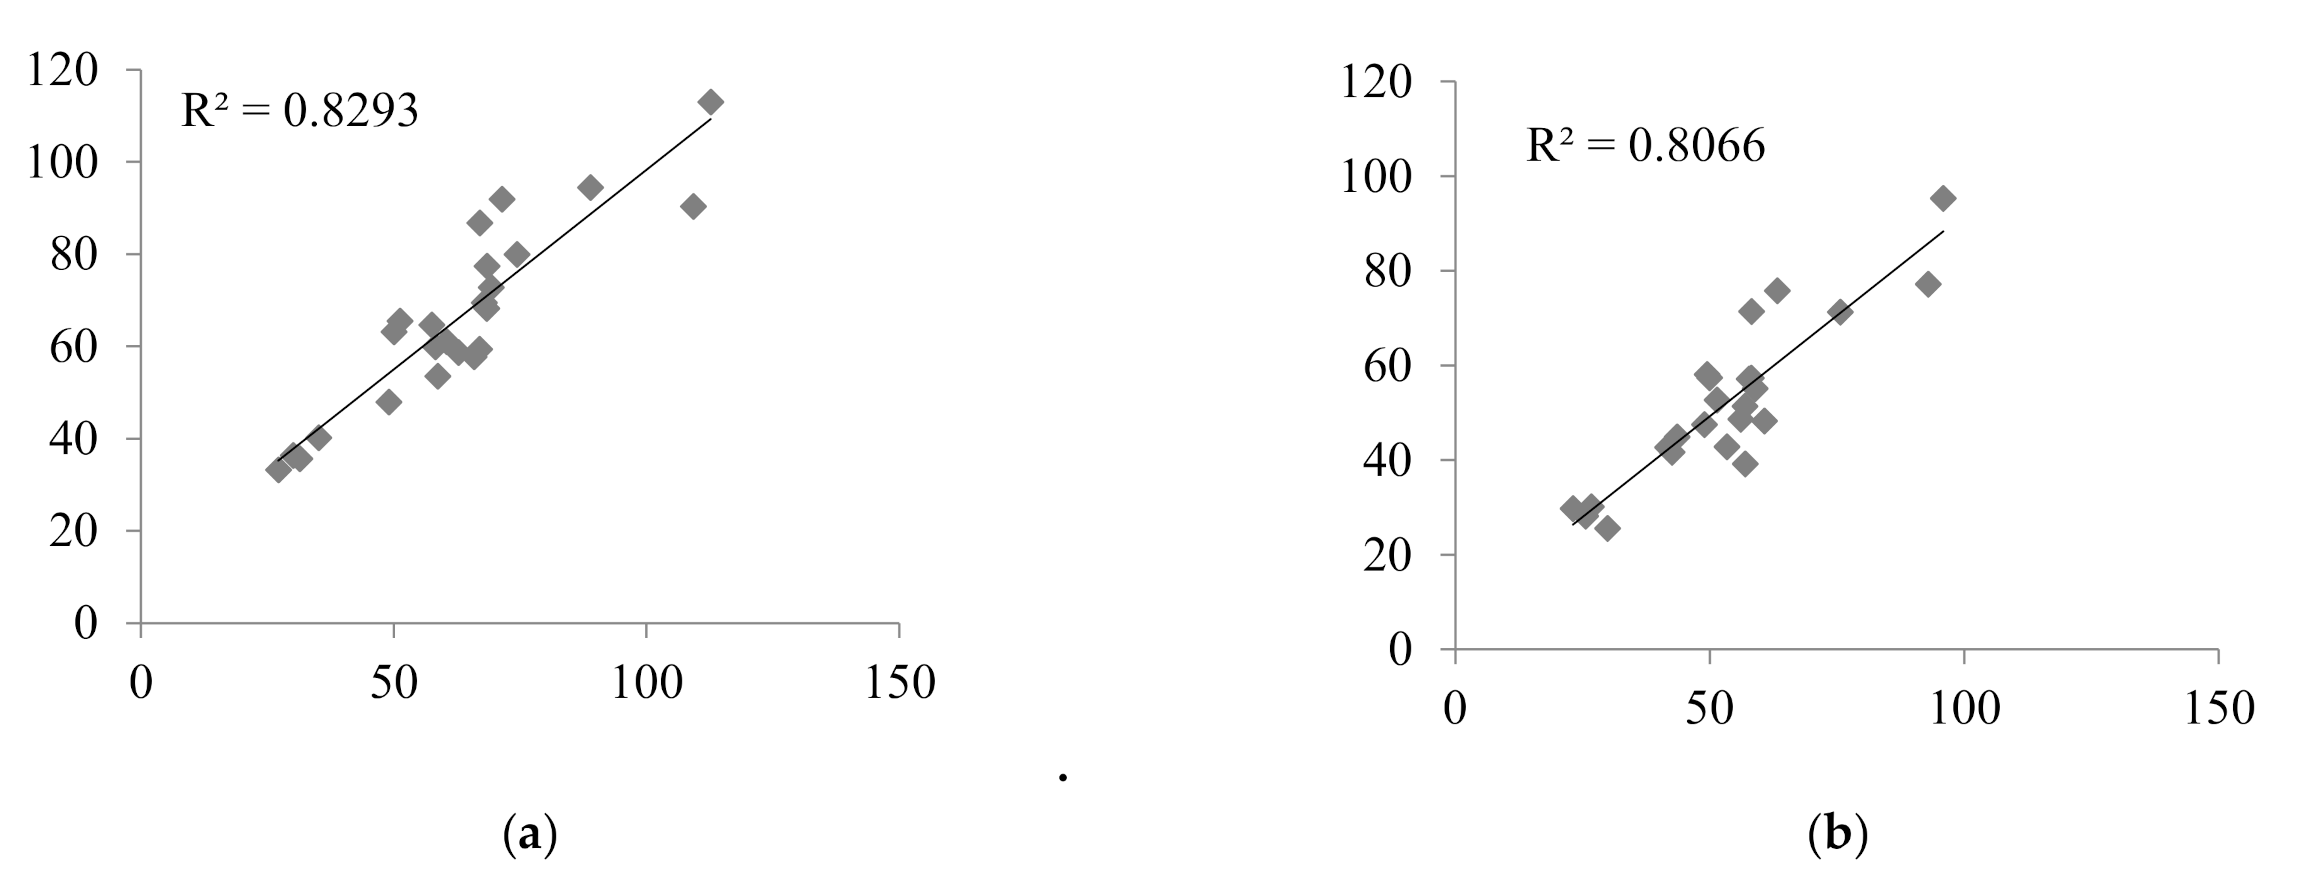
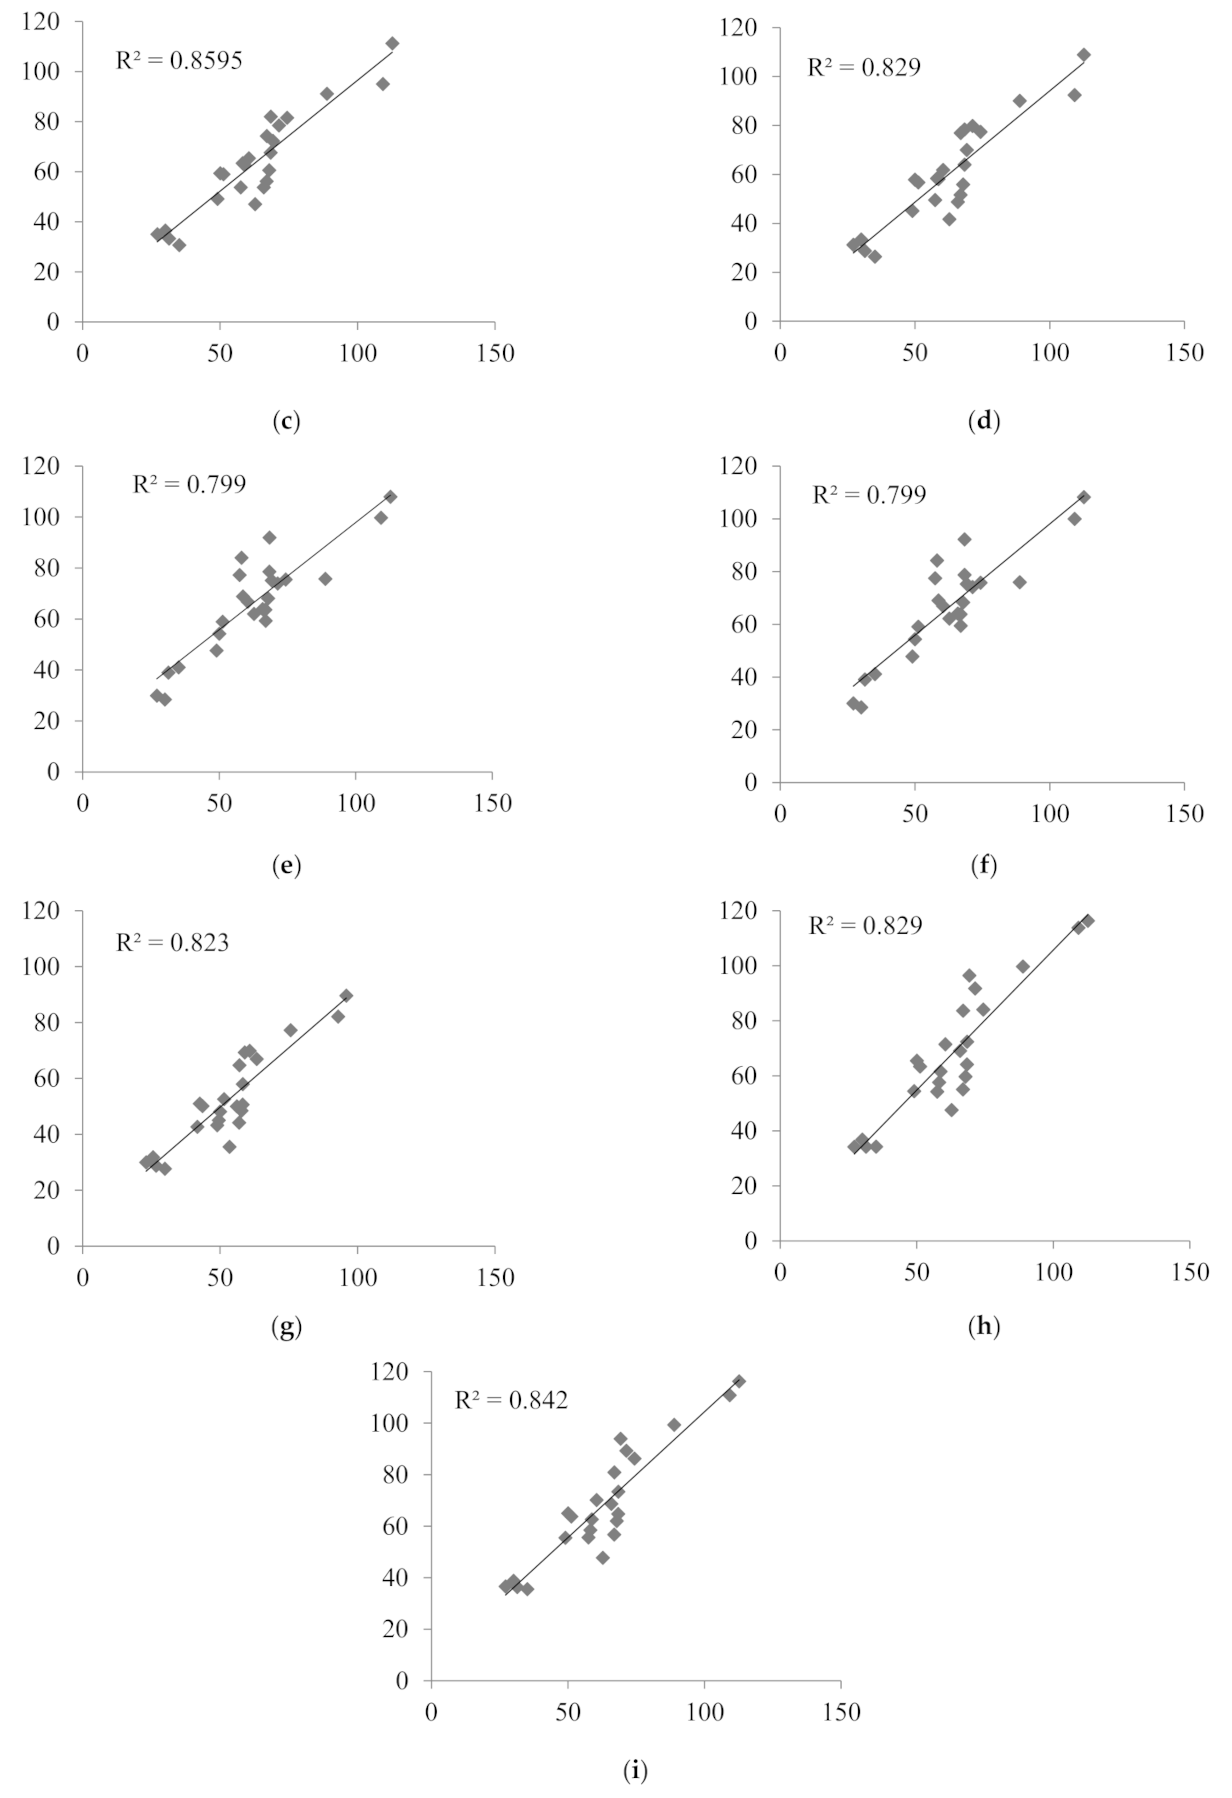
2.2. The Evaluation of MLR LSSs in Children with Nephrotic Syndrome
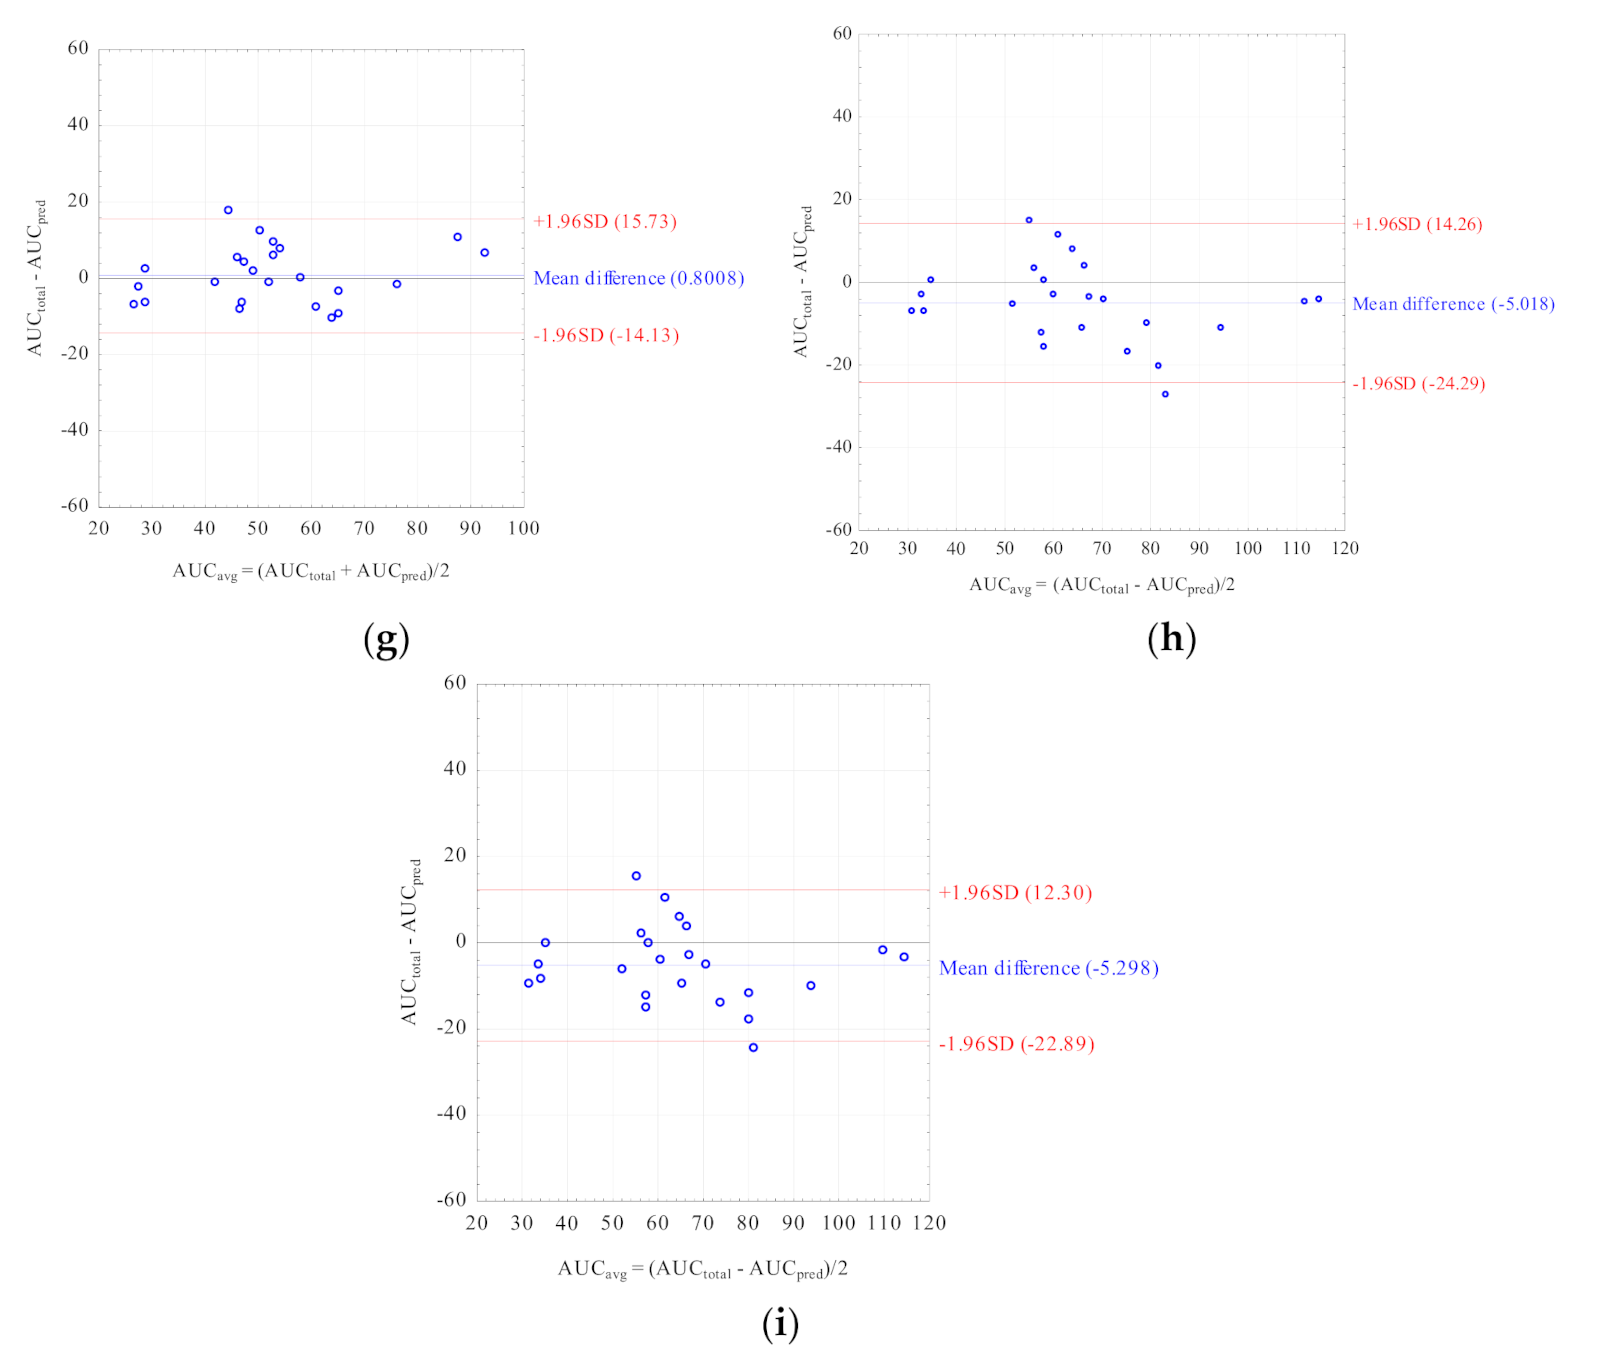
2.3. Comparison of the Best Matched MLR LSSs
3. Discussion
4. Materials and Methods
4.1. Ethical Considerations
4.2. Children’s Characteristics
4.3. Analytical Methods
4.4. The Literature Data Search
4.5. Pharmacokinetic Calculations and Statistical Analyses
5. Conclusions
Author Contributions
Funding
Institutional Review Board Statement
Informed Consent Statement
Data Availability Statement
Acknowledgments
Conflicts of Interest
Sample Availability
References
- Staatz, C.E.; Tett, S.E. Pharmacology and Toxicology of Mycophenolate in Organ Transplant Recipients: An Update. Arch. Toxicol. 2014, 88, 1351–1389. [Google Scholar] [CrossRef]
- Ostalska-Nowicka, D.; Malinska, A.; Silska, M.; Perek, B.; Zachwieja, J.; Nowicki, M. Mycophenolate Mofetil (MMF) Treatment Efficacy in Children with Primary and Secondary Glomerulonephritis. Arch. Med. Sci. 2011, 7, 1042–1048. [Google Scholar] [CrossRef]
- Kiang, T.K.; Ensom, M.H. Population Pharmacokinetics of Mycophenolic Acid: An Update. Clin. Pharm. 2018, 57, 547–558. [Google Scholar] [CrossRef]
- Dias-Polak, D.; Bergman, R.; Avitan-Hersh, E. Mycophenolate Mofetil Therapy in Adult Patients with Recalcitrant Atopic Dermatitis. J. Dermatol. Treat. 2019, 30, 49–51. [Google Scholar] [CrossRef] [PubMed]
- Chen, B.; Gu, Z.; Chen, H.; Zhang, W.; Fen, X.; Cai, W.; Fan, Q. Establishment of High-Performance Liquid Chromatography and Enzyme Multiplied Immunoassay Technology Methods for Determination of Free Mycophenolic Acid and Its Application in Chinese Liver Transplant Recipients. Ther. Drug Monit. 2010, 32, 653–660. [Google Scholar] [CrossRef] [PubMed]
- Filler, G.; Alvarez-Elías, A.C.; McIntyre, C.; Medeiros, M. The Compelling Case for Therapeutic Drug Monitoring of Mycophenolate Mofetil Therapy. Pediatr. Nephrol. 2017, 32, 21–29. [Google Scholar] [CrossRef] [PubMed]
- Bruchet, N.K.; Ensom, M.H. Limited Sampling Strategies for Mycophenolic Acid in Solid Organ Transplantation: A Systematic Review. Expert Opin. Drug Metab. Toxicol. 2009, 5, 1079–1097. [Google Scholar] [CrossRef]
- Filler, G. Abbreviated Mycophenolic Acid AUC from CO, C1, C2, and C4 Is Preferable in Children after Renal Transplantation on Mycophenolate Mofetil and Tacrolimus Therapy. Transplant. Int. 2004, 17, 120–125. [Google Scholar] [CrossRef]
- David-Neto, E.; Araujo, L.M.; Sumita, N.M.; Mendes, M.E.; Castro, M.C.; Alves, C.F.; Kakehashi, E.; Romano, P.; Yagyu, E.M.; Queiroga, M.; et al. Mycophenolic Acid Pharmacokinetics in Stable Pediatric Renal Transplantation. Pediatr. Nephrol. 2003, 18, 266–272. [Google Scholar] [CrossRef] [PubMed]
- Staatz, C.E.; Tett, S.E. Clinical Pharmacokinetics and Pharmacodynamics of Mycophenolate in Solid Organ Transplant Recipients. Clin. Pharm. 2007, 46, 13–58. [Google Scholar] [CrossRef]
- Sobiak, J.; Resztak, M.; Ostalska-Nowicka, D.; Zachwieja, J.; Gąsiorowska, K.; Piechanowska, W.; Chrzanowska, M. Monitoring of Mycophenolate Mofetil Metabolites in Children with Nephrotic Syndrome and the Proposed Novel Target Values of Pharmacokinetic Parameters. Eur. J. Pharm. Sci. 2015, 77, 189–196. [Google Scholar] [CrossRef]
- Hackl, Á.; Cseprekál, O.; Gessner, M.; Liebau, M.C.; Habbig, S.; Ehren, R.; Müller, C.; Taylan, C.; Dötsch, J.; Weber, L.T. Mycophenolate Mofetil Therapy in Children with Idiopathic Nephrotic Syndrome: Does Therapeutic Drug Monitoring Make a Difference? Ther. Drug Monit. 2016, 38, 274–279. [Google Scholar] [CrossRef]
- Tellier, S.; Dallocchio, A.; Guigonis, V.; Saint-Marcoux, F.; Llanas, B.; Ichay, L.; Bandin, F.; Godron, A.; Morin, D.; Brochard, K.; et al. Mycophenolic Acid Pharmacokinetics and Relapse in Children with Steroid–Dependent Idiopathic Nephrotic Syndrome. CJASN 2016, 11, 1777–1782. [Google Scholar] [CrossRef] [PubMed]
- Hibino, S.; Nagai, T.; Yamakawa, S.; Ito, H.; Tanaka, K.; Uemura, O. Pharmacokinetics of Mycophenolic Acid in Children with Clinically Stable Idiopathic Nephrotic Syndrome Receiving Cyclosporine. Clin. Exp. Nephrol. 2017, 21, 152–158. [Google Scholar] [CrossRef]
- Gellermann, J.; Weber, L.; Pape, L.; Tönshoff, B.; Hoyer, P.; Querfeld, U. Mycophenolate Mofetil versus Cyclosporin A in Children with Frequently Relapsing Nephrotic Syndrome. JASN 2013, 24, 1689–1697. [Google Scholar] [CrossRef] [PubMed]
- Abd Rahman, A.N.; Tett, S.E.; Staatz, C.E. How Accurate and Precise Are Limited Sampling Strategies in Estimating Exposure to Mycophenolic Acid in People with Autoimmune Disease? Clin. Pharm. 2014, 53, 227–245. [Google Scholar] [CrossRef]
- Katsuno, T.; Ozaki, T.; Ozeki, T.; Hachiya, A.; Kim, H.; Kato, N.; Ishimoto, T.; Kato, S.; Kosugi, T.; Tsuboi, N.; et al. Investigation on the Benefits of Mycophenolate Mofetil and Therapeutic Drug Monitoring in the Treatment of Japanese Patients with Lupus Nephritis. Clin. Exp. Nephrol. 2018, 22, 1341–1350. [Google Scholar] [CrossRef]
- Zicheng, Y.; Xianghui, W.; Peijun, Z.; Da, X.; Weixia, Z.; Hongzhuan, C. Evaluation of the Practicability of Limited Sampling Strategies for the Estimation of Mycophenolic Acid Exposure in Chinese Adult Renal Recipients. Ther. Drug Monit. 2007, 29, 600–606. [Google Scholar] [CrossRef] [PubMed]
- Saint-Marcoux, F.; Guigonis, V.; Decramer, S.; Gandia, P.; Ranchin, B.; Parant, F.; Bessenay, L.; Libert, F.; Harambat, J.; Bouchet, S.; et al. Development of a Bayesian Estimator for the Therapeutic Drug Monitoring of Mycophenolate Mofetil in Children with Idiopathic Nephrotic Syndrome. Pharmacol. Res. 2011, 63, 423–431. [Google Scholar] [CrossRef]
- Ting, L.S.; Partovi, N.; Levy, R.D.; Ignaszewski, A.P.; Ensom, M.H. Performance of Limited Sampling Strategies for Predicting Mycophenolic Acid Area under the Curve in Thoracic Transplant Recipients. J. Heart Lung Transplant. 2008, 27, 325–328. [Google Scholar] [CrossRef]
- Prabha, R.; Mathew, B.; Jeyaseelan, V.; Kumar, T.; Agarwal, I.; Fleming, D. Development and Validation of Limited Sampling Strategy Equation for Mycophenolate Mofetil in Children with Systemic Lupus Erythematosus. Indian J. Nephrol. 2016, 26, 408–412. [Google Scholar] [CrossRef] [PubMed]
- Al-Khatib, M.; Shapiro, R.J.; Partovi, N.; Ting, L.S.; Levine, M.; Ensom, M.H. Limited Sampling Strategies for Predicting Area under the Concentration-Time Curve of Mycophenolic Acid in Islet Transplant Recipients. Ann. Pharm. 2010, 44, 19–27. [Google Scholar] [CrossRef] [PubMed]
- Tong, K.; Mao, J.; Fu, H.; Shen, H.; Liu, A.; Shu, Q.; Du, L. The Value of Monitoring the Serum Concentration of Mycophenolate Mofetil in Children with Steroid-Dependent/Frequent Relapsing Nephrotic Syndrome. Nephron 2016, 132, 327–334. [Google Scholar] [CrossRef]
- Neuberger, M.; Sommerer, C.; Böhnisch, S.; Metzendorf, N.; Mehrabi, A.; Stremmel, W.; Gotthardt, D.; Zeier, M.; Weiss, K.H.; Rupp, C. Effect of Mycophenolic Acid on Inosine Monophosphate Dehydrogenase (IMPDH) Activity in Liver Transplant Patients. Clin. Res. Hepatol. Gastroenterol. 2020, 44, 543–550. [Google Scholar] [CrossRef]
- Benz, M.; Ehren, R.; Kleinert, D.; Müller, C.; Gellermann, J.; Fehrenbach, H.; Schmidt, H.; Weber, L. Generation and Validation of a Limited Sampling Strategy to Monitor Mycophenolic Acid Exposure in Children with Nephrotic Syndrome. Ther. Drug Monit. 2019, 41, 696–702. [Google Scholar] [CrossRef]
- Cai, W.; Cai, Q.; Xiong, N.; Qin, Y.; Lai, L.; Sun, X.; Hu, Y. Limited Sampling Strategy for Estimating Mycophenolic Acid Exposure on Day 7 Post-Transplant for Two Mycophenolate Mofetil Formulations Derived from 20 Chinese Renal Transplant Recipients. Transplant. Proc. 2018, 50, 1298–1304. [Google Scholar] [CrossRef]
- Chaabane, A.; Aouam, K.; Fredj, N.B.; Hammouda, M.; Chadly, Z.; May, M.E.; Boughattas, N.; Skhiri, H. Limited Sampling Strategy of Mycophenolic Acid in Adult Kidney Transplant Recipients: Influence of the Post-Transplant Period and the Pharmacokinetic Profile. J. Clin. Pharmacol. 2013, 53, 925–933. [Google Scholar] [CrossRef]
- Chen, H.; Gu, Z.; Chen, B.; Mao, H.; Zhang, W.; Fan, Q. Models for the Prediction of Mycophenolic Acid Area under the Curve Using a Limited-Sampling Strategy and an Enzyme Multiplied Immunoassay Technique in Chinese Patients Undergoing Liver Transplantation. Clin. Ther. 2008, 30, 2387–2401. [Google Scholar] [CrossRef]
- Chen, H.; Peng, C.; Yu, Z.; Shen, B.; Deng, X.; Qiu, W.; Fei, Y.; Shen, C.; Zhou, G.; Yang, W.; et al. Pharmacokinetics of Mycophenolic Acid and Determination of Area under the Curve by Abbreviated Sampling Strategy in Chinese Liver Transplant Recipients. Clin. Pharmacokinet. 2007, 46, 175–185. [Google Scholar] [CrossRef]
- Enokiya, T.; Nishikawa, K.; Muraki, Y.; Iwamoto, T.; Kanda, H.; Sugimura, Y.; Okuda, M. Usefulness of Limited Sampling Strategy for Mycophenolic Acid Area under the Curve Considering Postoperative Days in Living-Donor Renal Transplant Recipients with Concomitant Prolonged-Release Tacrolimus. J. Pharm. Health Care Sci. 2017, 3, 17. [Google Scholar] [CrossRef]
- Fatela-Cantillo, D.; Hinojosa-Pérez, R.; Peralvo-Rodríguez, M.I.; Serrano-Díaz Canedo, J.; Gómez-Bravo, M.A. Pharmacokinetic Evaluation of Mycophenolic Acid Profiles during the Period Immediately Following an Orthotopic Liver Transplant. Transplant. Proc. 2006, 38, 2482–2485. [Google Scholar] [CrossRef] [PubMed]
- Filler, G.; Feber, J.; Lepage, N.; Weiler, G.; Mai, I. Universal Approach to Pharmacokinetic Monitoring of Immunosuppressive Agents in Children. Pediatr. Transplant. 2002, 6, 411–418. [Google Scholar] [CrossRef] [PubMed]
- Filler, G.; Mai, I. Limited Sampling Strategy for Mycophenolic Acid Area under the Curve. Ther. Drug Monit. 2000, 22, 169–173. [Google Scholar] [CrossRef] [PubMed]
- Gota, V.; Purohit, V.; Gurjar, M.; Nayak, L.; Punatar, S.; Gokarn, A.; Bonda, A.; Bagal, B.; Vora, C.S.; Patil, A.; et al. A Limited Sampling Strategy for Therapeutic Drug Monitoring of Mycophenolate Mofetil for Prophylaxis of Acute Graft-Versus-Host Disease in Allogeneic Stem Cell Transplantation. Cell Transplant. 2020, 29, 0963689720912925. [Google Scholar] [CrossRef]
- Gu, Z.; Chen, B.; Song, Y.; Shen, B.; Zhu, Z.; Zhang, W.; Xie, J.; Deng, X.; Peng, C.; Fan, Q.; et al. Pharmacokinetics of Free Mycophenolic Acid and Limited Sampling Strategy for the Estimation of Area under the Curve in Liver Transplant Patients. Eur. J. Pharm. Sci. 2012, 47, 636–641. [Google Scholar] [CrossRef] [PubMed]
- Jiao, Z.; Zhong, J.; Zhang, M.; Shi, X.; Yu, Y.; Lu, W. Total and Free Mycophenolic Acid and Its 7-O-Glucuronide Metabolite in Chinese Adult Renal Transplant Patients: Pharmacokinetics and Application of Limited Sampling Strategies. Eur. J. Clin. Pharm. 2007, 63, 27–37. [Google Scholar] [CrossRef]
- Johnson, A.G.; Rigby, R.J.; Taylor, P.J.; Jones, C.E.; Allen, J.; Franzen, K.; Falk, M.C.; Nicol, D. The Kinetics of Mycophenolic Acid and Its Glucuronide Metabolite in Adult Kidney Transplant Recipients. Clin. Pharmacol. Ther. 1999, 66, 492–500. [Google Scholar] [CrossRef]
- Karimani, A.; Abedi, H.; Nazemian, F.; Poortaji, A.; Pour, A.H. Estimation of Abbreviated Mycophenolic Acid Area under the Concentration-Time Curve during Stable Post-Transplant Period by Limited Sampling Strategy. Curr. Clin. Pharm. 2020. [Google Scholar] [CrossRef]
- Kuriata-Kordek, M.; Boratynska, M.; Falkiewicz, K.; Porazko, T.; Urbaniak, J.; Wozniak, M.; Patrzalek, D.; Szyber, P.; Klinger, M. The Influence of Calcineurin Inhibitors on Mycophenolic Acid Pharmacokinetics. Transplant. Proc. 2003, 35, 2369–2371. [Google Scholar] [CrossRef]
- Guellec, C.L.; Büchler, M.; Giraudeau, B.; Meur, Y.L.; Gakoué, J.E.; Lebranchu, Y.; Marquet, P.; Paintaud, G. Simultaneous Estimation of Cyclosporin and Mycophenolic Acid Areas under the Curve in Stable Renal Transplant Patients Using a Limited Sampling Strategy. Eur. J. Clin. Pharm. 2002, 57, 805–811. [Google Scholar] [CrossRef]
- Miura, M.; Satoh, S.; Niioka, T.; Kagaya, H.; Saito, M.; Hayakari, M.; Habuchi, T.; Suzuki, T. Limited Sampling Strategy for Simultaneous Estimation of the Area under the Concentration-Time Curve of Tacrolimus and Mycophenolic Acid in Adult Renal Transplant Recipients. Ther. Drug Monit. 2008, 30, 52–59. [Google Scholar] [CrossRef]
- Ng, J.; Rogosheske, J.; Barker, J.; Weisdorf, D.; Jacobson, P.A. A Limited Sampling Model for Estimation of Total and Unbound Mycophenolic Acid (MPA) Area under the Curve (AUC) in Hematopoietic Cell Transplantation (HCT). Ther. Drug Monit. 2006, 28, 394–401. [Google Scholar] [CrossRef] [PubMed]
- Poulin, E.; Greanya, E.D.; Partovi, N.; Shapiro, R.J.; Al-Khatib, M.; Ensom, M.H. Development and Validation of Limited Sampling Strategies for Tacrolimus and Mycophenolate in Steroid-Free Renal Transplant Regimens. Ther. Drug Monit. 2011, 33, 50–55. [Google Scholar] [CrossRef] [PubMed]
- Ting, L.S.; Partovi, N.; Levy, R.D.; Riggs, K.W.; Ensom, M.H. Limited Sampling Strategy for Predicting Area under the Concentration-Time Curve of Mycophenolic Acid in Adult Lung Transplant Recipients. Pharmacother. J. Hum. Pharmacol. Drug Ther. 2006, 26, 1232–1240. [Google Scholar] [CrossRef] [PubMed]
- Wada, K.; Takada, M.; Kotake, T.; Ochi, H.; Morishita, H.; Komamura, K.; Oda, N.; Mano, A.; Hanatani, A.; Nakatani, T. Limited Sampling Strategy for Mycophenolic Acid in Japanese Heart Transplant Recipients Comparison of Cyclosporin and Tacrolimus Treatment. Circ. J. 2007, 7, 1022–1028. [Google Scholar] [CrossRef][Green Version]
- de Winter, B.C.; Neumann, I.; van Hest, R.M.; Gelder, T.; Mathot, R. Limited Sampling Strategies for Therapeutic Drug Monitoring of Mycophenolate Mofetil Therapy in Patients with Autoimmune Disease. Ther. Drug Monit. 2009, 31, 382–390. [Google Scholar] [CrossRef] [PubMed]
- Yamaguchi, K.; Fukuoka, N.; Kimura, S.; Watanabe, M.; Tani, K.; Tanaka, H.; Sofue, T.; Kosaka, S.; Inui, M.; Kakehi, Y.; et al. Limited Sampling Strategy for the Estimation of Mycophenolic Acid Area under the Concentration–Time Curve Treated in Japanese Living-Related Renal Transplant Recipients with Concomitant Extended-Release Tacrolimus. Biol. Pharm. Bull. 2013, 36, 1036–1039. [Google Scholar] [CrossRef]
- Yeung, S.; Tong, K.L.; Tsang, W.K.; Tang, H.L.; Fung, K.S.; Chan, H.W.; Chan, A.Y.; Chan, L. Determination of Mycophenolate Area under the Curve by Limited Sampling Strategy. Transplant. Proc. 2001, 33, 1052–1053. [Google Scholar] [CrossRef]
- Czyrski, A.; Kondys, K.; Szałek, E.; Karbownik, A.; Grześkowiak, E. The Pharmacokinetic Interaction between Levofloxacin and Sunitinib. Pharm. Rep. 2015, 67, 542–544. [Google Scholar] [CrossRef]
- Danielak, D.; Sobiak, J.; Wachowiak, J.; Glówka, F.; Chrzanowska, M. Development of a Limited Sampling Strategy for the Estimation of Exposure to High-Dose Etoposide after Intravenous Infusion in Pediatric Patients. Ther. Drug Monit. 2017, 39, 138–144. [Google Scholar] [CrossRef]
- Pawinski, T.; Luszczynska, P.; Durlik, M.; Majchrzak, J.; Baczkowska, T.; Chrzanowska, M.; Sobiak, J.; Glyda, M.; Kuriata-kordek, M.; Kamińska, D.; et al. Development and Validation of Limited Sampling Strategies for the Estimation of Mycophenolic Acid Area under the Curve in Adult Kidney and Liver Transplant Recipients Receiving Concomitant Enteric-Coated Mycophenolate Sodium and Tacrolimus. Ther. Drug Monit. 2013, 35, 760–769. [Google Scholar] [CrossRef]
- Sobiak, J.; Resztak, M.; Pawiński, T.; Żero, P.; Ostalska-Nowicka, D.; Zachwieja, J.; Chrzanowska, M. Limited Sampling Strategy to Predict Mycophenolic Acid Area under the Curve in Pediatric Patients with Nephrotic Syndrome: A Retrospective Cohort Study. Eur. J. Clin. Pharm. 2019, 75, 1249–1259. [Google Scholar] [CrossRef]
- Kunicki, P.K.; Pawinski, T.; Boczek, A.; Was, J.; Bodnar-Broniarczyk, M. A Comparison of the Immunochemical Methods, PETINIA and EMIT, with That of HPLC-UV for the Routine Monitoring of Mycophenolic Acid in Heart Transplant Patients. Ther. Drug Monit. 2015, 37, 311–318. [Google Scholar] [CrossRef]
- Abd Rahman, A.N.; Tett, S.E.; Staatz, C.E. Clinical Pharmacokinetics and Pharmacodynamics of Mycophenolate in Patients with Autoimmune Disease. Clin. Pharm. 2013, 52, 303–331. [Google Scholar] [CrossRef]
- Zhou, P.J.; Xu, D.; Yu, Z.C.; Wang, X.H.; Shao, K.; Zhao, J.P. Pharmacokinetics of Mycophenolic Acid and Estimation of Exposure Using Multiple Linear Regression Equations in Chinese Renal Allograft Recipients. Clin. Pharm. 2007, 46, 389–401. [Google Scholar] [CrossRef] [PubMed]
- Downing, H.J.; Pirmohamed, M.; Beresford, M.W.; Smyth, R.L. Paediatric Use of Mycophenolate Mofetil. Br. J. Clin. Pharm. 2013, 75, 45–59. [Google Scholar] [CrossRef] [PubMed]
- Elbarbry, F.A.; Shoker, A.S. Liquid Chromatographic Determination of Mycophenolic Acid and Its Metabolites in Human Kidney Transplant Plasma: Pharmacokinetic Application. J. Chromatogr. B 2007, 859, 276–281. [Google Scholar] [CrossRef] [PubMed]
- Jia, Y.; Peng, B.; Li, L.; Wang, J.; Wang, X.; Qi, G.; Rong, R.; Wang, L.; Qiu, J.; Xu, M.; et al. Estimation of Mycophenolic Acid Area under the Curve with Limited-Sampling Strategy in Chinese Renal Transplant Recipients Receiving Enteric-Coated Mycophenolate Sodium. Ther. Drug Monit. 2017, 39, 29–36. [Google Scholar] [CrossRef]
- Gaies, E.; Ben Sassi, M.; El Jebari, H.; Jebabli, N.; Charfi, R.; Chokri, I.; Salouage, I.; Klouz, A.; Trabelsi, S. Limited Sampling Strategy for the Estimation of Mycophenolic Acid Area under the Curve in Tunisian Renal Transplant Patients. Nephrol. Ther. 2017, 13, 460–462. [Google Scholar] [CrossRef]
- Barraclough, K.; Isbel, N.; Franklin, M.; Lee, K.; Taylor, P.; Campbell, S.; Petchey, W.; Staatz, C. Evaluation of Limited Sampling Strategies for Mycophenolic Acid after Mycophenolate Mofetil Intake in Adult Kidney Transplant Recipients. Ther. Drug Monit. 2010, 32, 723–733. [Google Scholar] [CrossRef]
- Hao, C.; Erzheng, C.; Anwei, M.; Zhicheng, Y.; Baiyong, S.; Xiaxing, D.; Weixia, Z.; Chenghong, P.; Hongwei, L. Validation of Limited Sampling Strategy for the Estimation of Mycophenolic Acid Exposure in Chinese Adult Liver Transplant Recipients. Liver Transplant. 2007, 13, 1684–1693. [Google Scholar] [CrossRef] [PubMed]
- Miura, M.; Satoh, S.; Niioka, T.; Kagaya, H.; Saito, M.; Hayakari, M.; Habuchi, T.; Suzuki, T. Early Phase Limited Sampling Strategy Characterizing Tacrolimus and Mycophenolic Acid Pharmacokinetics Adapted to the Maintenance Phase of Renal Transplant Patients. Ther. Drug Monit. 2009, 31, 467–474. [Google Scholar] [CrossRef] [PubMed]


| Parameter | Mean ± SD | Range | |
|---|---|---|---|
| MPA | Cmax (μg/mL) | 18.20 ± 9.34 | 4.96–44.22 |
| tmax (h) | 1 ± 1 | 1–3 | |
| AUCtotal (μg∙h/mL) | 53.14 ± 17.77 | 22.27–94.54 | |
| fMPA | Cmax (μg/mL) | 0.0660 ± 0.0081 | 0.1605–0.0409 |
| AUCtotal (μg∙h/mL) | 0.1837 ± 0.0867 | 0.0551–0.3806 |
| No | Equation | Indication for MMF Treatment | Drugs Co-Administered | Reference | %MPE | %MAE | r2 | % of AUCpred within ±15% of AUCtotal |
|---|---|---|---|---|---|---|---|---|
| (95% CI) | (95% CI) | |||||||
| 1 | AUCpred = 9.328 + 1.311 × C1 + 1.455 × C2 + 2.901 × C4 | adult renal Tx | Tac | [43] | −0.55 | 11.68 | 0.807 | 67 |
| (−6.89–5.78) | (7.83–15.53) | |||||||
| 2 | AUCpred = 15.94 + 1.77 × C2 + 2.34 × C4 + 4.76 × C9 | adult renal Tx | Tac, steroids | [41] | −5.08 | 15.74 | 0.619 | 50 |
| (−13.08–2.92) | (10.97–20.51) | |||||||
| 3 | AUCpred = 20.38 + 0.26 × C0 + 2.06 × C2 + 3.82 × C4 | adult renal Tx | Tac, steroids | [41] | −4.19 | 17.23 | 0.465 | 46 |
| (−13.17–4.78) | (11.87–22.58) | |||||||
| 4 | AUCpred = 9.02 + 3.77 × C0 + 1.33 × C1 + 1.68 × C3 + 2.96 × C6 | adult renal Tx | CsA, steroids | [37] | 12.91 | 18.00 | 0.773 | 54 |
| (5.53–20.30) | (12.97–23.03) | |||||||
| 5 | AUCpred = 6.02 + 5.61 × C0 + 1.28 × C1 + 0.9 × C2 + 2.54 × C4 | adult renal Tx | CsA, steroids | [48] | 13.43 | 18.35 | 0.723 | 50 |
| (1.59–25.28) | (9.55–27.14) | |||||||
| 6 | AUCpred = 3.504 + 1.098 × C1 + 0.670 × C2 + 5.659 × C4 | adult renal Tx | CsA, steroids | [36] | −14.12 | 19.95 | 0.684 | 33 |
| (−21.65–[−6.58]) | (15.50–24.40) | |||||||
| 7 | AUCpred = 15.19 + 6.92 × C0 + 1.08 × C1 + 0.72 × C2 | adult renal Tx | CsA, steroids | [48] | 16.28 | 24.56 | 0.527 | 42 |
| (4.44–28.13) | (15.76–33.36) | |||||||
| 8 | AUCpred = −0.247 + 11.73 × C6 + 2.92 × C2 | adult renal Tx | CsA, steroids | [39] | 3.04 | 26.45 | 0.487 | 46 |
| (−11.63–17.71) | (17.13–35.76) | |||||||
| 9 | AUCpred = 9.57 × C6 + 27.238 | adult renal Tx | no data | [38] | 9.88 | 28.31 | 0.265 | 29 |
| (−4.88–24.63) | (18.99–37.62) | |||||||
| 10 | AUCpred = 10.403 + 0.841 × C2 + 1.105 × C3 + 0.447 × C4 | adult renal Tx | CsA, steroids | [36] | −54.94 | 54.94 | 0.372 | 0 |
| (−59.83–[−50.05]) | (50.05–59.83) | |||||||
| 11 | AUCpred = 10.229 + 0.925 × C1 + 1.750 × C2 + 4.586 × C6 | adult liver Tx | Tac, steroids | [29] | 0.49 | 12.57 | 0.823 | 63 |
| (−6.08–7.05) | (8.85–16.28) | |||||||
| 12 | AUCpred = 17.930 + 1.992 × C2 + 4.136 × C6 | adult liver Tx | Tac, steroids | [29] | −12.17 | 18.22 | 0.565 | 50 |
| (−20.08–[−4.25]) | (12.89–23.54) | |||||||
| 13 | AUCpred = 1.783 + 1.248 × C1 + 0.888 × C2 + 8.027 × C4 | adult islet Tx | Tac | [22] | 4.18 | 17.47 | 0.648 | 50 |
| (−6.31–14.68) | (9.94–24.99) | |||||||
| 14 | AUCpred = 2.778 + 1.413 × C1 + 0.963 × C3 + 7.511 × C4 | adult islet Tx | Tac | [22] | 4.04 | 17.93 | 0.619 | 50 |
| (−6.34–14.41) | (10.80–25.06) | |||||||
| 15 | AUCpred = 1.547 + 1.417 × C1 + 9.448 × C4 | adult islet Tx | Tac | [22] | 5.48 | 21.29 | 0.557 | 50 |
| (−7.15–18.10) | (12.31–30.28) | |||||||
| 16 | AUCpred = 1.410 − 0.259 × C0 + 1.443 × C1 + 9.622 × C4 | adult islet Tx | Tac | [22] | 5.60 | 21.86 | 0.551 | 50 |
| (−4.78–15.97) | (14.73–28.99) | |||||||
| 17 | logAUCpred = 1.024 + 0.192 × logC0 + 0.213 × logC1 + 0.355 × logC2 | adult lung Tx | CsA, steroids | [44] | −14.11 | 17.79 | 0.718 | 42 |
| (−20.76–[−7.45]) | (13.05–22.53) | |||||||
| 18 | logAUCpred = 1.14 + 0.241 × logC0 + 0.406 × logC2 | adult lung Tx | CsA, steroids | [44] | −25.96 | 28.88 | 0.427 | 21 |
| (−34.21–[−17.72]) | (22.70–35.07) | |||||||
| 19 | AUCpred = 4.43 + 2.76 × C0 + 0.51 × C1 + 1.97 × C2 + 4.27 × C6 | adult HSCT | CsA | [42] | −8.34 | 15.79 | 0.708 | 54 |
| (−15.19–[−1.50]) | (12.13–19.45) | |||||||
| 20 | AUCpred = 1.2039 × AUC1–4 + 8.9727 | adult HSCT | CsA | [34] | −31.85 | 31.85 | 0.841 | 4 |
| (−35.91–[−27.80]) | (27.80–35.91) | |||||||
| 21 | AUCpred = 0.10 + 11.15 × C0 + 0.42 × C1 + 2.80 × C2 | adult heart Tx | CsA, steroids | [45] | 15.24 | 31.94 | 0.366 | 33 |
| (−1.66–32.14) | (20.15–43.72) | |||||||
| 22 | AUCpred = −0.51 + 11.47 × C0 + 3.24 × C2 | adult heart Tx | CsA, steroids | [45] | 8.19 | 35.54 | 0.264 | 25 |
| (−10.63–27.02) | (24.06–47.02) | |||||||
| 23 | AUCpred = 13.81 + 0.68 × C1 + 1.08 × C2 + 2.21 × C3 + 4.62 × C0 | children systemiclupus erythematosus | none | [21] | 9.82 | 16.26 | 0.738 | 50 |
| (1.38–18.25) | (9.95–22.57) |
| No | Equation | Indication for MMF Treatment | Drugs Co-Administered | Reference | %MPE | %MAE | r2 | % of AUCpred within ±15% of AUCtotal |
|---|---|---|---|---|---|---|---|---|
| (95% CI) | (95% CI) | |||||||
| 1 | AUCpred = 10.6 + 1.1 × C1 + 1.1 × C2 + 2.0 × C4 + 3.9 × C6 | adult renal Tx | Tac, steroids | [30] 1 | 2.90 | 11.56 | 0.860 | 67 |
| (−2.92–8.73) | (8.30–14.82) | |||||||
| 2 | AUCpred = 7.4 + 2.3 × C0 + 1.2 × C1 + 2.3 × C3 + 4.4 × C6 | adult renal Tx | Tac, steroids | [30] 1 | 7.32 | 12.21 | 0.829 | 71 |
| (1.50–13.14) | (8.20–16.22) | |||||||
| 3 | AUCpred = 3.8 + 3.5 × C0 + 1.2 × C1 + 1.9 × C3 + 5.4 × C6 | adult renal Tx | Tac, steroids | [30] 1 | 9.85 | 15.90 | 0.742 | 63 |
| (2.24–17.47) | (10.51–21.28) | |||||||
| 4 | AUCpred = 4.42 + 1.74 × C1 + 2.99 × C4 + 5.43 × C9 | adult renal Tx | CsA | [40] | 8.16 | 15.92 | 0.826 | 58 |
| (0.88–15.43) | (11.67–20.18) | |||||||
| 5 | AUCpred = 17.3 + 4.4 × C0 + 1.1 × C1 + 2.9 × C4 | adult renal Tx | Tac, steroids | [27] | 9.13 | 18.63 | 0.638 | 50 |
| (0.09–18.17) | (12.91–24.35) | |||||||
| 6 | AUCpred = 23.37 + 4.21 × C0 + 3.60 × C4 | adult renal Tx | Tac | [47] | −12.35 | 21.82 | 0.198 | 46 |
| (−22.77–[−1.92]) | (14.85–28.78) | |||||||
| 7 | AUCpred = 4.38 + 2.14 × C1 + 7.19 × C9 | adult renal Tx | CsA | [40] | 11.62 | 22.50 | 0.722 | 42 |
| (0.49–22.75) | (15.10–29.91) | |||||||
| 8 | AUCpred = 20.30 + 5.80 × C0 + 3.06 × C4 | adult renal Tx | Tac | [47] | −12.12 | 23.57 | 0.160 | 42 |
| (−25.13–0.88) | (18.18–28.96) | |||||||
| 9 | AUCpred = 8.149 + 1.442 × C2 + 1.056 × C4 + 7.133 × C6 | adult renal Tx | Tac, steroids | [26] | −20.52 | 25.56 | 0.501 | 25 |
| (−29.19–[−11.85]) | (19.90–31.21) | |||||||
| 10 | AUCpred = 22.93 + 4.63 × C0 + 5.60 × C6 | adult renal Tx | Tac | [47] | −1.86 | 27.50 | 0.208 | 17 |
| (−14.87–11.14) | (22.11–32.89) | |||||||
| 11 | AUCpred = 14.9 + 1.3 × C1 + 3 × C4 + 3.7 × C6 | adult renal Tx | Tac, steroids | [27] | 96.25 | 98.30 | 0.549 | 4 |
| (71.31–121.19) | (74.90–121.71) | |||||||
| 12 | AUCpred = 5.92 + 1.10 × C1 + 1.01 × C2 + 1.77 × C4 + 4.80 × C6 | adult liver Tx | Tac, steroids | [28] | −3.29 | 11.84 | 0.829 | 67 |
| (−9.47–2.88) | (8.09–15.59) | |||||||
| 13 | AUCpred = 8.144 + 2.880 × C3 | adult liver Tx | Tac, steroids | [31] | −62.44 | 62.44 | 0.134 | 0 |
| (−68.53–[−56.35]) | (56.35–68.53) | |||||||
| 14 | AUCpred = 8.22 + 3.16 × C0 + 0.99 × C1 + 1.33 × C2 + 4.18 × C4 | children renal Tx | CsA | [32] | 7.93 | 12.58 | 0.799 | 67 |
| (1.47–14.39) | (7.68–17.48) | |||||||
| 15 | AUCpred = 8.217 + 3.163 × C0+ 0.994 × C1 + 1.334 × C2 + 4.183 × C4 | children renal Tx | CsA | [8] | 8.14 | 12.65 | 0.799 | 67 |
| (1.68–14.61) | (7.71–17.58) | |||||||
| 16 | AUCpred = 7.73 + 0.94 × C1 + 2.55 × C2 + 5.48 × C6 | children renal Tx | CsA | [32] | 8.94 | 14.67 | 0.829 | 58 |
| (2.19–15.68) | (10.17–19.18) | |||||||
| 17 | AUCpred = 10.75 + 0.98 × C1 + 2.38 × C2 + 4.86 × C6 | children renal Tx | CsA | [33] | 10.08 | 14.76 | 0.842 | 50 |
| (3.46–16.66) | (10.10–19.42) | |||||||
| 18 | AUCpred = 12.62 + 7.78 × C0 + 0.9 × C1 + 1.3 × C2 | children renal Tx | CsA | [9] | 13.81 | 23.20 | 0.515 | 50 |
| (2.00–25.62) | (14.55–31.85) | |||||||
| 19 | AUCpred = 13.73 + 9.024 × C0 + 1.779 × C2 | children renal Tx | CsA | [9] | 0.31 | 28.79 | 0.203 | 21 |
| (−14.71–15.34) | (20.33–37.25) | |||||||
| 20 | AUCpred = 15.1 + 9.68 × C0 + 1.28 × C1 | children renal Tx | CsA | [9] | 23.57 | 33.21 | 0.374 | 29 |
| (8.22–38.91) | (21.65–44.77) | |||||||
| 21 | AUCpred = 12.3 + 4.7 × C0 + 1.2 × C1 + 2.7 × C3 + 1.8 × C6 | adult autoimmune disease | CsA | [46] | 18.85 | 20.15 | 0.811 | 50 |
| (11.45–26.25) | (13.42–26.88) | |||||||
| 22 | AUCpred = 17.5 + 7.1 × C0 + 1.0 × C1 + 2.6 × C3 | adult autoimmune disease | CsA | [46] | 24.84 | 27.45 | 0.607 | 33 |
| (13.36–36.02) | (17.47–37.43) | |||||||
| 23 | AUCpred = 38.3 + 11.7 × C0 | adult autoimmune disease | CsA | [46] | 35.64 | 47.39 | 0.051 | 21 |
| (13.52–57.76) | (29.84–64.94) | |||||||
| 24 | AUCpred = 21.971 + 2.6059 × C2 | children INS | CsA | [14] 1 | −24.57 | 26.14 | 0.455 | 33 |
| (−32.54–[−16.59]) | (19.16–33.12) | |||||||
| 25 | AUCpred = 8.7 + 4.63 × C0 + 1.90 × C1 + 1.52 × C2 | children NS | none | [25] | 24.21 | 29.03 | 0.718 | 17 |
| (14.28–34.13) | (21.90–36.15) |
| No | Equation | Indication for MMF Treatment | Drugs Co-Administered | Reference | %MPE | %MAE | r2 | % of AUCpred within ±15% of AUCtotal |
|---|---|---|---|---|---|---|---|---|
| (95% CI) | (95% CI) | |||||||
| 1 | fMPA AUCpred = 34.2 + 1.12 × C1 + 1.29 × C2 + 2.28 × C4 + 3.95 × C6 | liver Tx | Tac, steroids | [35] | 13.68 | 18.53 | 0.871 | 38 |
| (6.44–20.91) | (13.71–23.35) | |||||||
| 2 | fMPA AUCpred = 63.92 + 2.01 × C0 + 0.67 × C1 + 2.05 × C2 + 4.26 × C6 | HSCT | CsA | [42] | −14.45 | 22.17 | 0.725 | 33 |
| (−23.61–[−5.28]) | (16.56–27.77) | |||||||
| 3 | fMPA AUCpred = 136.826 + 0.76 × C1 + 0.84 × C2 + 3.914 × C4 | renal Tx | CsA, steroids | [36] | 52.65 | 54.69 | 0.768 | 21 |
| (29.91–75.39) | (32.86–76.52) | |||||||
| 4 | fMPA AUCpred = 178.167 + 0.954 × C2 + 4.001 × C4 | renal Tx | CsA, steroids | [36] | 59.46 | 63.35 | 0.564 | 43 |
| (28.68–90.25) | (34.04–92.65) | |||||||
| 5 | fMPA AUCpred = 180.543 + 0.956 × C2 − 0.223 × C3 + 4.342 × C4 | renal Tx | CsA, steroids | [36] | 61.48 | 64.84 | 0.560 | 25 |
| (30.43–92.54) | (35.08–94.60) |
| Parameter | Mean ± SD | Range |
|---|---|---|
| 24 children | 10 boys/14 girls | |
| age | 11 ± 4 | 3–18 |
| body weight | 36.9 ± 14.7 | 17.7–66.5 |
| body surface (m2) | 1.20 ± 0.32 | 0.70–1.85 |
| MMF daily dose (mg) | Number of children | |
| 500/600/700/800/1000/1200/1500/2000 | 2/1/1/1/10/1/7/1 | |
| MMF daily dose (mg/m2) | 933 ± 218 | 505–1250 |
| duration of MMF treatment (months) | 12 ± 7 | 2–29 |
| Protein concentration (g/dL) | 6.60 ± 0.53 | 5.52–7.54 |
| Glomerular filtration rate (mL/min/1.73 m2) | 133 ± 23 | 101–183 |
| Creatinine concentration (mg/dL) | 0.45 ± 0.13 | 0.25–0.72 |
| Leukocytes count (109/L) | 6.75 ± 2.34 | 3.46–13.88 |
| Erythrocytes count (1012/L) | 4.65 ± 0.31 | 4.07–5.54 |
| Hemoglobin (g/dL) | 13.0 ± 1.1 | 11.1–15.5 |
| Hematocrit (%) | 37.8 ± 2.8 | 33.6–44.3 |
| Alanine aminotransferase (U/L) | 13 ± 4 | 5–25 |
| Aspartate aminotransferase (U/L) | 26 ± 6 | 17–45 |
Publisher’s Note: MDPI stays neutral with regard to jurisdictional claims in published maps and institutional affiliations. |
© 2021 by the authors. Licensee MDPI, Basel, Switzerland. This article is an open access article distributed under the terms and conditions of the Creative Commons Attribution (CC BY) license (https://creativecommons.org/licenses/by/4.0/).
Share and Cite
Sobiak, J.; Resztak, M.; Chrzanowska, M.; Zachwieja, J.; Ostalska-Nowicka, D. The Evaluation of Multiple Linear Regression–Based Limited Sampling Strategies for Mycophenolic Acid in Children with Nephrotic Syndrome. Molecules 2021, 26, 3723. https://doi.org/10.3390/molecules26123723
Sobiak J, Resztak M, Chrzanowska M, Zachwieja J, Ostalska-Nowicka D. The Evaluation of Multiple Linear Regression–Based Limited Sampling Strategies for Mycophenolic Acid in Children with Nephrotic Syndrome. Molecules. 2021; 26(12):3723. https://doi.org/10.3390/molecules26123723
Chicago/Turabian StyleSobiak, Joanna, Matylda Resztak, Maria Chrzanowska, Jacek Zachwieja, and Danuta Ostalska-Nowicka. 2021. "The Evaluation of Multiple Linear Regression–Based Limited Sampling Strategies for Mycophenolic Acid in Children with Nephrotic Syndrome" Molecules 26, no. 12: 3723. https://doi.org/10.3390/molecules26123723
APA StyleSobiak, J., Resztak, M., Chrzanowska, M., Zachwieja, J., & Ostalska-Nowicka, D. (2021). The Evaluation of Multiple Linear Regression–Based Limited Sampling Strategies for Mycophenolic Acid in Children with Nephrotic Syndrome. Molecules, 26(12), 3723. https://doi.org/10.3390/molecules26123723