Article

Evaluation of Leaf Mineral, Flavonoid, and Total Phenolic Content in Spider Plant Germplasm

by
Fhatuwani Thovhogi
1,*,
Godwin Richard Ainamensa Mchau
1,
Eastonce Tendayi Gwata
2 and
Nombasa Ntushelo
3
1
Department of Horticulture, School of Agriculture, University of Venda, Private Bag X5050, Thohoyandou 0950, South Africa
2
Department of Crop Science, School of Agriculture, University of Venda, Private Bag X5050, Thohoyandou 0950, South Africa
3
Agricultural Research Council (Infruitec-Nietvoorbij), Private Bag X5026, Stellenbosch 7599, South Africa
*
Author to whom correspondence should be addressed.
Molecules 2021, 26(12), 3600; https://doi.org/10.3390/molecules26123600
Submission received: 20 April 2021 / Revised: 4 May 2021 / Accepted: 5 May 2021 / Published: 11 June 2021

Abstract

:
Spider plant (Cleome gynandra L.) is an important leafy vegetable that grows naturally in many parts of the world. The leaves are highly nutritious and are used mainly for human consumption. The mineral content and phenolic compounds of 17 genotypes (local and exotic) of spider plant and four standards (swiss chard, jute mallow, cowpea, and pumpkin) were investigated. Leaf samples were harvested from plants raised at Thohoyandou, South Africa. Exotic genotypes were superior to local genotypes for most of the minerals. Swiss chard possessed significantly high levels of some minerals such as iron and manganese in comparison with exotic spider plant genotypes. The calcium content in the local (‘MP-B-3-CG’) and exotic (‘GPS’) genotypes was >30.0% and >60.0% higher than in swiss chard, respectively. Total phenolics among spider plant genotypes ranged from 9.86 to 12.21 mg GAE/g DW and were superior to pumpkin. In addition, the spider plant genotypes varied significantly in the antioxidant capacity as estimated by the 2,2 diphenyl-1-picrylhydrazyl method and ferric-reducing antioxidant power. The main flavonoid in the leaves of spider plant genotypes was quercetin-3-rutinoside. Crotonoside (glycoside) was detected in all the spider plant genotypes and swiss chard. A positive correlation was observed between total phenolic content and each of the three flavonoids. The PCA biplot associated exotic genotypes (‘ML-SF-29′, ‘PS’, ‘TZ-1’, and ‘GPS’) and local genotypes (‘ML-3-KK’, ‘ML-13-SDM’, and ‘ML-12-TMP’) with high Al, Fe, Zn, N, and TPC. Cluster analysis indicated high “distant groups” between exotic and local genotypes of spider plant. These results indicated that some of the local germplasm of spider plant was largely inferior to the exotic germplasm in terms of their mineral composition but contained considerable quantities of quercetin-3-rutinoside, particularly in the local genotypes ‘MP-B-2-CG’ and ‘MP-B-1-CG’. There is a need for genetic improvement of the local germplasm in some of the minerals particularly to benefit the end-users.

1. Introduction

Spider plant (Cleome gynandra L.) is an important indigenous leafy vegetable that is important particularly in the diet of many rural communities in Africa, including South Africa [1]. It belongs to the family Cleomaceae and it is widely distributed as a weed in tropical and subtropical regions of the world, including South Africa [2]. This vegetable can play a vital role in food security and income generation particularly for marginalized rural communities in Africa. The vegetable is collected from the wild during the rainy season in many parts of the world [3,4]. However, in parts of East Africa, the vegetable is cultivated by smallholder growers [5]. Compared to other leafy vegetables, it is highly nutritious and is classified as a functional food due to the presence of phenolic compounds that are beneficial for human health [6].
In Africa, the consumption of indigenous leafy vegetables such as spider plant depends on a variety of factors such as poverty status and degree of urbanization [4]. In general, the leafy indigenous vegetables are an inexpensive source of dietary minerals, trace elements, and antioxidant phytochemicals [6]. The young tender leaves that are preferred by end-users are boiled and consumed as a side dish or dried for consumption during the off-season [7]. Indigenous leafy vegetables are also rich in flavonoids, which have anti-inflammatory, antibacterial, antihistaminic, and antimutagenic properties. They also possess micro- and macro-elements.
Micronutrient deficiency is a huge problem that affects the health of many people worldwide [8]. This is mainly due to changes in dietary preferences resulting from social economic development [9]. In many African countries, there is a decline in the consumption of indigenous leafy vegetables such as the spider plant in exchange for exotic vegetables [10]. Consumption of spider plant can be an alternative means to improve human health since the vegetable is rich in minerals such as, iron (Fe), manganese (Mn), and zinc (Zn).
The variation in the nutritional and phytochemical content of plant foods is influenced by a wide range of factors such as geographical location, season, cultivar, and physiological state [11,12]. A study conducted in South Africa showed variation in the nutritional content of spider plant across two provinces due to geographical and climatic factors [6]. Conversely, a similar study carried out in Malawi showed no significant differences in protein, fiber, and vitamin C content of the vegetables [7]. However, limited research has been conducted in South Africa on the nutritional composition of spider plant. Moreover, the studies utilized samples that were collected from the wild or purchased from the market [6,13,14] or planted in the field [15]. However, for those planted in the field, chicken and cattle manure were added [15]. There is merit in evaluating the nutrient composition of this vegetable cultivated in fertilizer-free environments. Most of the studies conducted in South Africa concentrated largely on the mineral, vitamin, and total phenolics profiling of spider plant [6,13,14,15].
The spider plant is also rich in secondary metabolites such as glucosinolates and flavonoids [11,16]. Glucosinolates are the sulfur and nitrogen-containing secondary metabolites responsible for the bitter taste in cruciferous vegetables. Genetic and environmental factors contribute to the variation in the amount and pattern of glucosinolates [17]. Flavonoids are the largest and most abundant group of secondary metabolites with marked antioxidant properties [18]. Some of the properties of flavonoids include free radical scavenging, strong antioxidant activities in preventing oxidation, inhibition of low lipoproteins, inhibition of hydrolytic and oxidative enzymes, and anti-inflammatory actions [19]. The determination of the radical scavenging activity of the spider plant using the 2,2 diphenyl-1-picrylhydrazyl (DPPH) free radical scavenging activity method is dependent on concentration [13] and time [20]. The leaves of the spider plant also contain phenolic compounds and other phytochemicals that have health beneficial properties [21]. Plant phenolics include phenolic acids, flavonoids, and condensed tannins.
Limited information is available on the quantification and identification of flavonoids of spider plant in South Africa. In addition, there is inadequate information regarding the variation in the mineral and phenolic content in spider plant in South Africa. Few studies utilized germplasm from different ecological regions in Kenya [16] and in the Netherlands [22]. Glucosinolates including glucocapparin, glucobrassicin, and 3-hydroxypropylglucosinolate as well as quercetin-3-O-rutinoside and several hydroxycinnamic acid derivatives were reported [11,16,22]. The content and distribution of flavonoids among 91 edible plant species including spider plant were evaluated [23]. Also, plant secondary metabolites in six selected species (African nightshade, spider plant, amaranth, cowpea, common kale, and Ethiopian kale) from East Africa were identified and quantified [11]. The major flavonoids identified in the leaves and shoots of spider plant include quercetin, kaempferol, and isorhamnetin [11,16,22,
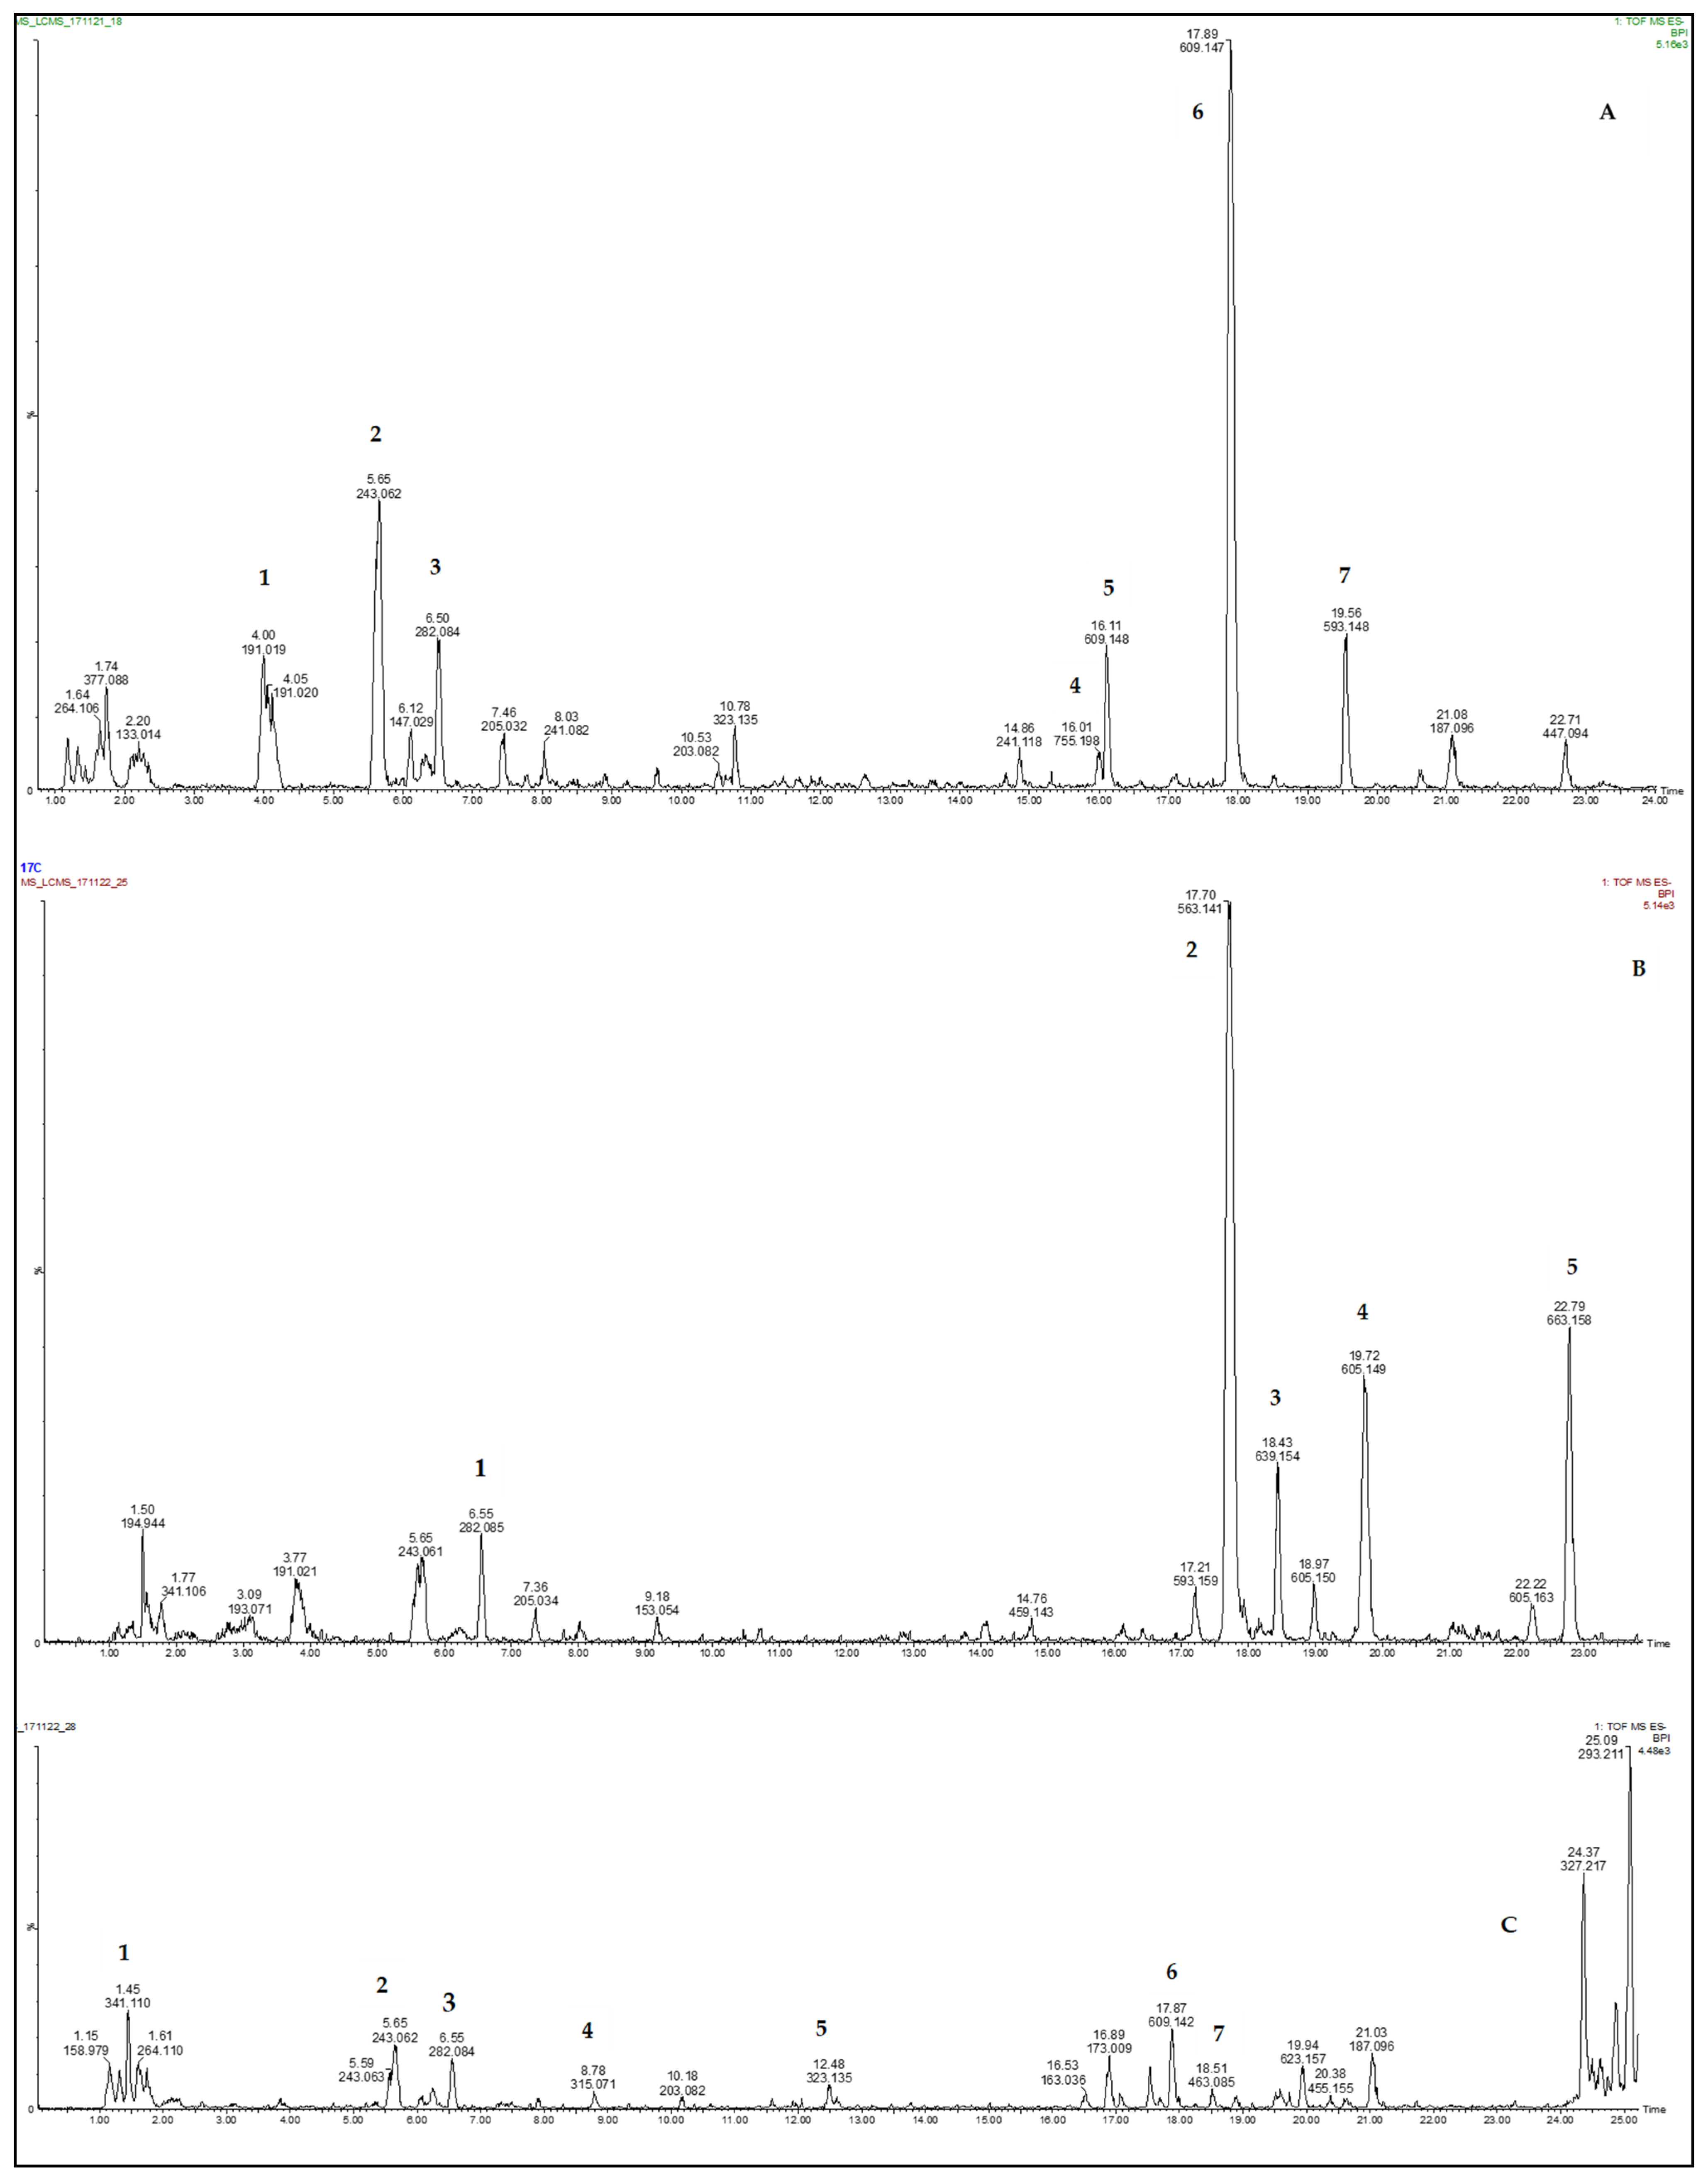
23]. The objective of this study was to determine the nutritional composition in a wide range of spider plant genotypes that were collected from different agro-ecological zones in South Africa and exotic accessions from different countries as a prerequisite for their subsequent selection and genetic improvement. The study also identified and quantified the flavonoids in the leaves of the germplasm.

2. Results

2.1. Leaf Mineral Content

There were highly significant differences (p ≤ 0.001) among the genotypes from different ecological regions for most of the mineral contents including Mg, P, Al, Cu, Fe, Mn, and Zn (Table 1). The Fe content was six-fold higher than the Zn leaf content. The mean for the potentially toxic element Al was 202.72 mg/kg, while Fe and Mn attained 330.00 mg/kg DW and 200.50 mg/kg DW, respectively. Similarly, the leaf Ca content (14.6 g/kg DW) was more than double the leaf content of both Mg and P (Table 1). The exotic genotype ‘GPS’ contained the highest (6.5 g/kg DW) leaf Mg content followed by ‘PS’ (6.3 g/kg DW), ‘UG-SF-15′ (6.1 g/kg DW), and ‘IP-3′ (6.1 g/kg DW), which were comparable to local genotypes ‘ML-2-DD’ (6.4 g/kg DW), ‘ML-13-SDM’ (6.3 g/kg DW), and ‘ML-12-TMP’ (6.1 g/kg DW), but this was significantly lower than that observed for the standard leafy vegetable swiss chard (11.5 g/kg DW). In addition, the genotype ‘ML-13-SDM’ showed significantly high Cu content (15.70 mg/kg DW) and Fe (346.67 mg/kg DW), but these were similar to both pumpkin and swiss chard (Table 1). The local genotype ‘ML-2-DD’ attained the highest Al content (316.33 mg/kg DW), which was more than double the content in both pumpkin and jute mallow leaves.
The leaf Fe content in the leaves of exotic genotype ‘ML-SF-29’ (431.33 mg/kg DW) was higher than that observed in cowpea (54.28%), jute mallow (45.32%) and pumpkin (20.63%) (Table 2). The highest Mn leaf content (509.33 mg/kg DW) was attained by the exotic genotype ‘ML-SF-29’, which was >45.0% higher than in the leaves of cowpea (48.10%), jute mallow (46.33%), and pumpkin (75.85%) (Table 2). Similarly, the leaf Zn content (75.00 mg/kg DW) in the exotic genotype ‘UG-SF-15’ was >50.0% higher than in both cowpea and jute mallow (Table 2). The leaf Fe content in the local genotype ‘ML-14-MAG’ (419.33 mg/kg DW) was similar to the leaf Fe content in the standard genotype swiss chard (405.67 mg/kg DW). However, the leaf Fe content in the local genotype was at least seven-fold higher than that observed for the rest of the standard genotypes (Table 2). In comparison with the highest leaf Mn content of the genotype ‘ML-2-DD’ (302.33 mg/kg DW), swiss chard was approximately 44% higher. Similarly, the Zn leaf content in the genotype ‘ML-13-SDM’ (63.67 mg/kg DW) was 58% higher than that observed in the standard genotype cowpea (41.37%) and jute mallow (41.89%) (Table 2).
The mineral content was generally higher in the genotypes from Limpopo province in comparison with the Mpumalanga genotypes (Table 1). However, some of the genotypes showed similar mineral profiles. For, instance the leaf Fe content from genotypes collected in Limpopo province ranged from 235.00 to 419.33 mg/kg DW, while in Mpumalanga, it ranged from 289.00 to 359.67 mg/kg DW. These genotypes ‘ML-14-MAG’, ‘ML-2-DD’, ‘ML-12-TMP’, and ‘ML-3-KK’ from Limpopo had high leaf Fe content greater than 359.67 mg/kg DW, which was higher when compared with all the genotypes from Mpumalanga Province. This trend was also observed with the leaf Al, Cu, and Mn content. The leaf zinc content was similar between genotypes from Limpopo and Mpumalanga province, but ‘ML-13-SDM’ (63.67 mg/kg DW) and ‘MP-B-1 CG’ (59.00 mg/kg DW) had high Zn leaf content when compared to other local genotypes.

2.2. Polyphenol Content and Antioxidant Activity

There were highly significant (p ≤ 0.001) differences among the spider plant genotypes in both polyphenol content and antioxidant activity. The highest (12.21 mg GAE/g) and lowest (9.86 mg GAE/g) total phenolic content (TPC) were attained by ‘ML-13-SDM’ and ‘ML-SF-29)’, respectively (Table 3). The highest antioxidant activity as measured by the DPPH free radical scavenging activity was observed for the local spider plant genotype ‘ML-14-MAG’. This antioxidant activity was significantly higher (p < 0.05) than in each of the standard common leafy vegetables except in cowpea. In addition, the antioxidant activity determined by the ferric-reducing antioxidant power (FRAP) in all the five exotic spider plant genotypes was significantly (p < 0.05) lower than in the local genotype (‘ML-6-BTK’).
When comparing spider plant genotypes from different ecological regions in South Africa, the genotypes from different agro-ecological zones in Limpopo and Mpumalanga did not differ significantly in total phenolic content. Meanwhile, a significant difference was found for antioxidant activity as measured by the DPPH method between genotype from Limpopo and Mpumalanga province with most of the genotypes from Limpopo attaining high DPPH of 22.68%, 22.55%, and 21.98% for ‘ML-14-MAG’, ‘ML-5-TGM’, and ‘ML-6-BTK’, respectively when compared to 15.14% for ‘MP-B-1-CG’, which was the highest for genotypes from Mpumalanga Province (Table 3).

2.3. Phenolic Compounds

Two local genotypes namely ‘MP-B-2-CG’ and ‘MP-B-1-CG’ attained significantly (p < 0.05) higher quercetin (QC) than all the exotic genotypes (Table 4). The highest QC content (1.76 × 10⁻² mg/g) among the exotic genotypes was only 46.31% of the best local ‘MP-B-2-CG’ genotype (Table 4). Similarly, the local genotypes were superior to the exotic genotypes as well as the standards in terms of quercetin-3-rutinoside (Q3R). Quercetin 3-glucoside was identified in all the indigenous leafy vegetables in this study except in swiss chard (Table 4). The concentration of this flavonoid differed among the indigenous leafy vegetables. However, all the spider plant genotypes were inferior to jute mallow (7.34 × 10⁻² mg/g) in terms of quercetin-3-β-d-glucoside (Q3βDG)
The quercetin glycosides were present in spider plant, cowpea, jute mallow, and pumpkin leaves (Figure 1 and Table 5). Quercetin, quercetin 3-glucoside, and kaempferol 3-O-rutinoside were identified in the leaves of spider plant. In addition, crotonoside was identified in the leaves of spider plant and swiss chard (Figure 1 and Table 5). The flavonoids apiin and apigenin 7-6″-malonyl neohesperidoside were observed in swiss chard leaves. Furthermore, crotonoside was identified in the leaves of spider plant and swiss chard, but it was not detected in jute mallow, cowpea, and pumpkin (Figure 1 and Table 5).

2.4. Correlations among Mineral, Flavonoid Content, and Antioxidant Activity

A highly significant (p ≤ 0.01) positive correlation was observed between N and Ca (Table 6). Mg showed a positive significant (p < 0.05) correlation with each of P, Cu, N, Zn, and Fe and highly significant (p ≤ 0.01) correlation with Ca. QC also showed a highly significant (p ≤ 0.01) correlation with quercetin-3-rutinoside (Q3R) and Q3βDG. Weak positive correlations were observed between QC and FRAP (r = 0.37) and TFC (r = 0.33). However, both the total flavonoid content (TFC) and the antioxidant activity showed no significant correlation with any of the minerals (Table 6). Nonetheless, FRAP showed a positive significant (p < 0.01) correlation with DPPH and TFC.

2.5. Principal Component Analysis (PCA)

The first two principal components contributed 63.15% of the total variance in the data. The first principal component (F1) explained 35.06% followed by the second principal component (F2) with 28.09%. Variables that contributed the most to (F1) were P (0.92), N (0.87), TFC (0.79), Ca (0.72), Zn (0.70), and TPC (0.65). The first principal component increased with increasing P, N, TFC, Ca, Zn, and TPC and this suggests that these variables vary together. Thus, if one of these variable increased, then the remaining ones tended to increase as well (Table 7). Furthermore, it was observed that F1 correlated most strongly with P. It would follow that genotypes with high values for the variables mentioned above tend to be high in P, N, TFC, Ca, Zn, and TPC, while genotypes with small values would have low amount of these nutrients. The second principal component (F2) was strongly correlated with five of the variables and increased with increasing Mg, Al, Cu, and Fe. This suggested that genotypes with high Mg tended to have high Al, Cu, and Fe (Table 7). Furthermore, Mg, Al, Cu, and Fe were positively correlated but negatively correlated to DPPH. Thus, Mg, Al, Cu, and Fe negatively correlated with DPPH, indicating that genotypes that were high in Mg, Al, Cu, and Fe tended to have low DPPH values.
The PCA biplot illustrated the relationship between the genotypes and 12 variables for mineral content, total polyphenol, and antioxidant activity. The variables on the first and second quadrant were positively correlated and included Al, Fe, Zn, N, Ca, TPC, TFC, and DPPH, and these variables were associated with all the spider plant genotypes. Swiss chard, jute mallow, cowpea, and pumpkin on the third and fourth quadrant were associated with Mg, Mn, and Cu (Figure 2). Four exotic genotypes (‘ML-SF-29’, ‘PS’, ‘TZ-1’, and ‘GPS’) and local genotypes (‘ML-3-KK’, ‘ML-13-SDM’, and ‘ML-12-TMP’) were associated with high Al, Fe, Zn, N, and TPC and low Ca, TFC, and DPPH. In addition, two exotic genotypes (‘UG-SF-15’ and ‘IP-3’) and six local genotypes (‘MP-B-4-CG’, ‘MP-B-3-CG’, ‘MP-B-1-CG’, ‘ML-5-TGM’, ‘ML-6-BTK’, and ‘ML-14-MAG’) were associated with high Ca, TFC, and DPPH while low on Al, Fe, Zn, N, and TPC.

2.6. Cluster Analysis

The dendrogram produced five clusters out of 15 spider plant genotypes and four standards (Figure 3). Cluster I consisted of two spider plant genotypes and a standard. The exotic genotype ‘ML-SF-29’ was clustered with swiss chard, while the local genotype ‘ML-13-SDM’ was a singleton. A singleton is an accession that is placed separately from the rest of the genotypes in a cluster (Table 8). This type of genotype is more diverse and superior over other genotypes. The second cluster had two standards (cowpea and jute mallow) and local genotype ‘ML-5-TGM’. The third cluster consisted of 12 spider plant genotypes and one standard and was subdivided into sub-cluster A, which contained pumpkin as a singleton and four spider plant genotypes. The local genotypes ‘MP-B-3-CG’ and ‘ML-6-BTK’ were similar to exotic genotypes ‘UG-SF-15’and ‘PS’, respectively. Sub-cluster B contained two local genotypes from Limpopo ‘ML-12-TMP’and ‘ML-14-MAG’, which were similar to exotic genotypes TZ-1 and ‘GPS’, respectively (Figure 3 and Table 8).

3. Discussion

The results that were reported showed strong evidence that the leaves of spider plant contained a wide range of minerals that are useful in the human diet. The concentration of both micro- and macro-elements in the leaf tissue of the vegetable was generally comparable with those reported previously in similar studies [13,16,24]. Nonetheless, where differences exist in some individual minerals, it is likely due to the environmental factors such as edaphic attributes and management of the cropping systems. In the present study, the spider plants were raised without applying any fertilizers. In contrast, chemical [25] and organic [16] fertilizers were utilized in similar studies involving spider plant. Previous reports observed that the application of calcium ammonium nitrate fertilizers enhanced leaf calcium content and farmyard manure decreased Fe content but did not influence Zn or K content in spider plant [26]. In addition, the difference in agro-ecological regions between this study and similar investigations probably contributed to some of the individual differences in individual mineral levels. There is a considerable degree of diversity and environmental variations in Sub-Saharan Africa particularly in soil moisture availability, temperatures, and cropping systems [27].
Variation in mineral concentration between spider plant germplasm suggested that there is potential for the genetic improvement of the local germplasm in terms of leaf mineral content. Therefore, future genetic improvement activities aimed at enhancing the leaf mineral content in this vegetable will need to identify genotypes that are stable in mineral content in the target production areas. In addition, genotypes that were significantly higher in specific minerals could be utilized as source materials for introgressing such traits (also referred to as attributes or distinct plant characteristics) into the inferior genotypes. For instance, the two local genotypes (‘ML-13-SDM’ and ‘ML-12-TMP’) that were comparable to exotic genotypes ‘GPS’ and ’IP-3’ in TPC could be utilized in a breeding program aimed at enhancing this trait.
The leaf extract of the local spider plant genotypes (‘ML-6-BTK’, MP-B-1-CG’, and ‘MP-B-4-CG’) produced the highest FRAP values and were superior to both the exotic genotypes and all the standards. The DPPH and FRAP values in the leaf extract are an indication of the antioxidant potentials of the local and exotic spider plant genotypes showing that some of the local genotypes were superior in antioxidant properties. Therefore, the high antioxidant activities and ferric-reducing antioxidant power of the leaf extracts strongly supported the utilization of these vegetables. The relatively low antioxidant activity as measured by DPPH may be due to the difference in the concentration or dosage of the extract used. Previous studies reported that an increase in radical scavenging activity was dose or concentration dependent [13].
This study observed that quercetin glycosides were present in spider plant and the three standards (cowpea, jute mallow, and pumpkin) but differed in their concentrations. This agreed with the findings from previous studies [11,23]. The present study also showed that quercetin was the most abundant flavonoid in the spider plant leaf tissue, but the flavonoid content was generally high in the genotypes originating from South Africa (‘MP-B-2-CG’ and ‘ML-6-BTK’). Quercetin represents the main flavonoid in our daily diets among the polyphenols [28]. Quercetin is a versatile molecule with many pharmacological properties such as antioxidant, neurological, antiviral, anticancer, cardiovascular, and antimicrobial activities as well as the ability to protect the reproductive system [29,30,31,32]. Quercetin was found to have therapeutic potential for the treatment of breast cancer [33]. In a study involving male rats, quercetin in conjunction with sulfasalazine-induced alterations in steroidogenic enzyme activity, which enhanced organ weights, sperm integrity, and plasma hormone management, among other beneficial activities [34]. In addition, quercetin possessed antiviral activity during the early stage of infection by the influenza A virus [35]. The absence of detectable levels of phenolic compounds in swiss chard but their abundance in spider plant suggested that indigenous leafy vegetables such as the spider plant maybe superior to commercial leafy vegetables in some of the nutritional attributes. Therefore, the consumption of both indigenous and non-indigenous leafy vegetable types can provide a relatively wider spectrum of valuable nutrients that are necessary for human health. Nonetheless, the absence of some of the flavonoids (such as 3-hydroxypropyl glucosinolate and 4-methoxyglucobrassicin) that were detected in spider plant in other studies [11,22] could be attributed to the limited number of standards that were used in the present study. Furthermore, in a previous study, alteration of plants regulatory network which led to an accumulation of flavonoid, was attributed to UV-B radiation [36].
However, the presence of crotonoside (glycoside) in spider plant leaves was interesting in this study, since it is a potent tyrosine inhibitor with immunosuppressive effects on immune cells [37], antitumor activity [38], as well as selective inhibition in acute myeloid leukemia cells [39]. The study showed a positive relationship between quercetin and the derivatives (quercetin-3-rutinoside and quercetin-3-β-d-glucoside). The absence of a strong correlation between the antioxidant activity (using FRAP and DPPH) with the phenolic content agreed with the observations reported in a similar study involving the spider plant [40]. This suggests that the antioxidant activity is not entirely influenced by the phenolic compounds but other factors such as the presence of non-phenolic compounds. Antioxidant activity is partially influenced by other non-phenolic compounds such as ascorbates, reducing carbohydrates, tocopherols, carotenoids, and terpenes probably acting synergistically to produce the total antioxidant activity [41], and pigments as well as the synergistic effect among them could possibly contribute to the total antioxidant activity. The significant positive relationship between total phenolic content, quercetin, quercetin-3-β-d-glucoside, and quercetin-3-rutinoside could be useful in selection programs that are aimed at the concomitant improvement of both total phenolic content and flavonoids in spider plant. On the other hand, a positive relationship that was observed between Cu and Zn could be attributed partly to the role of Cu as a cofactor of the antioxidant enzyme Cu, Zn-superoxide [42].
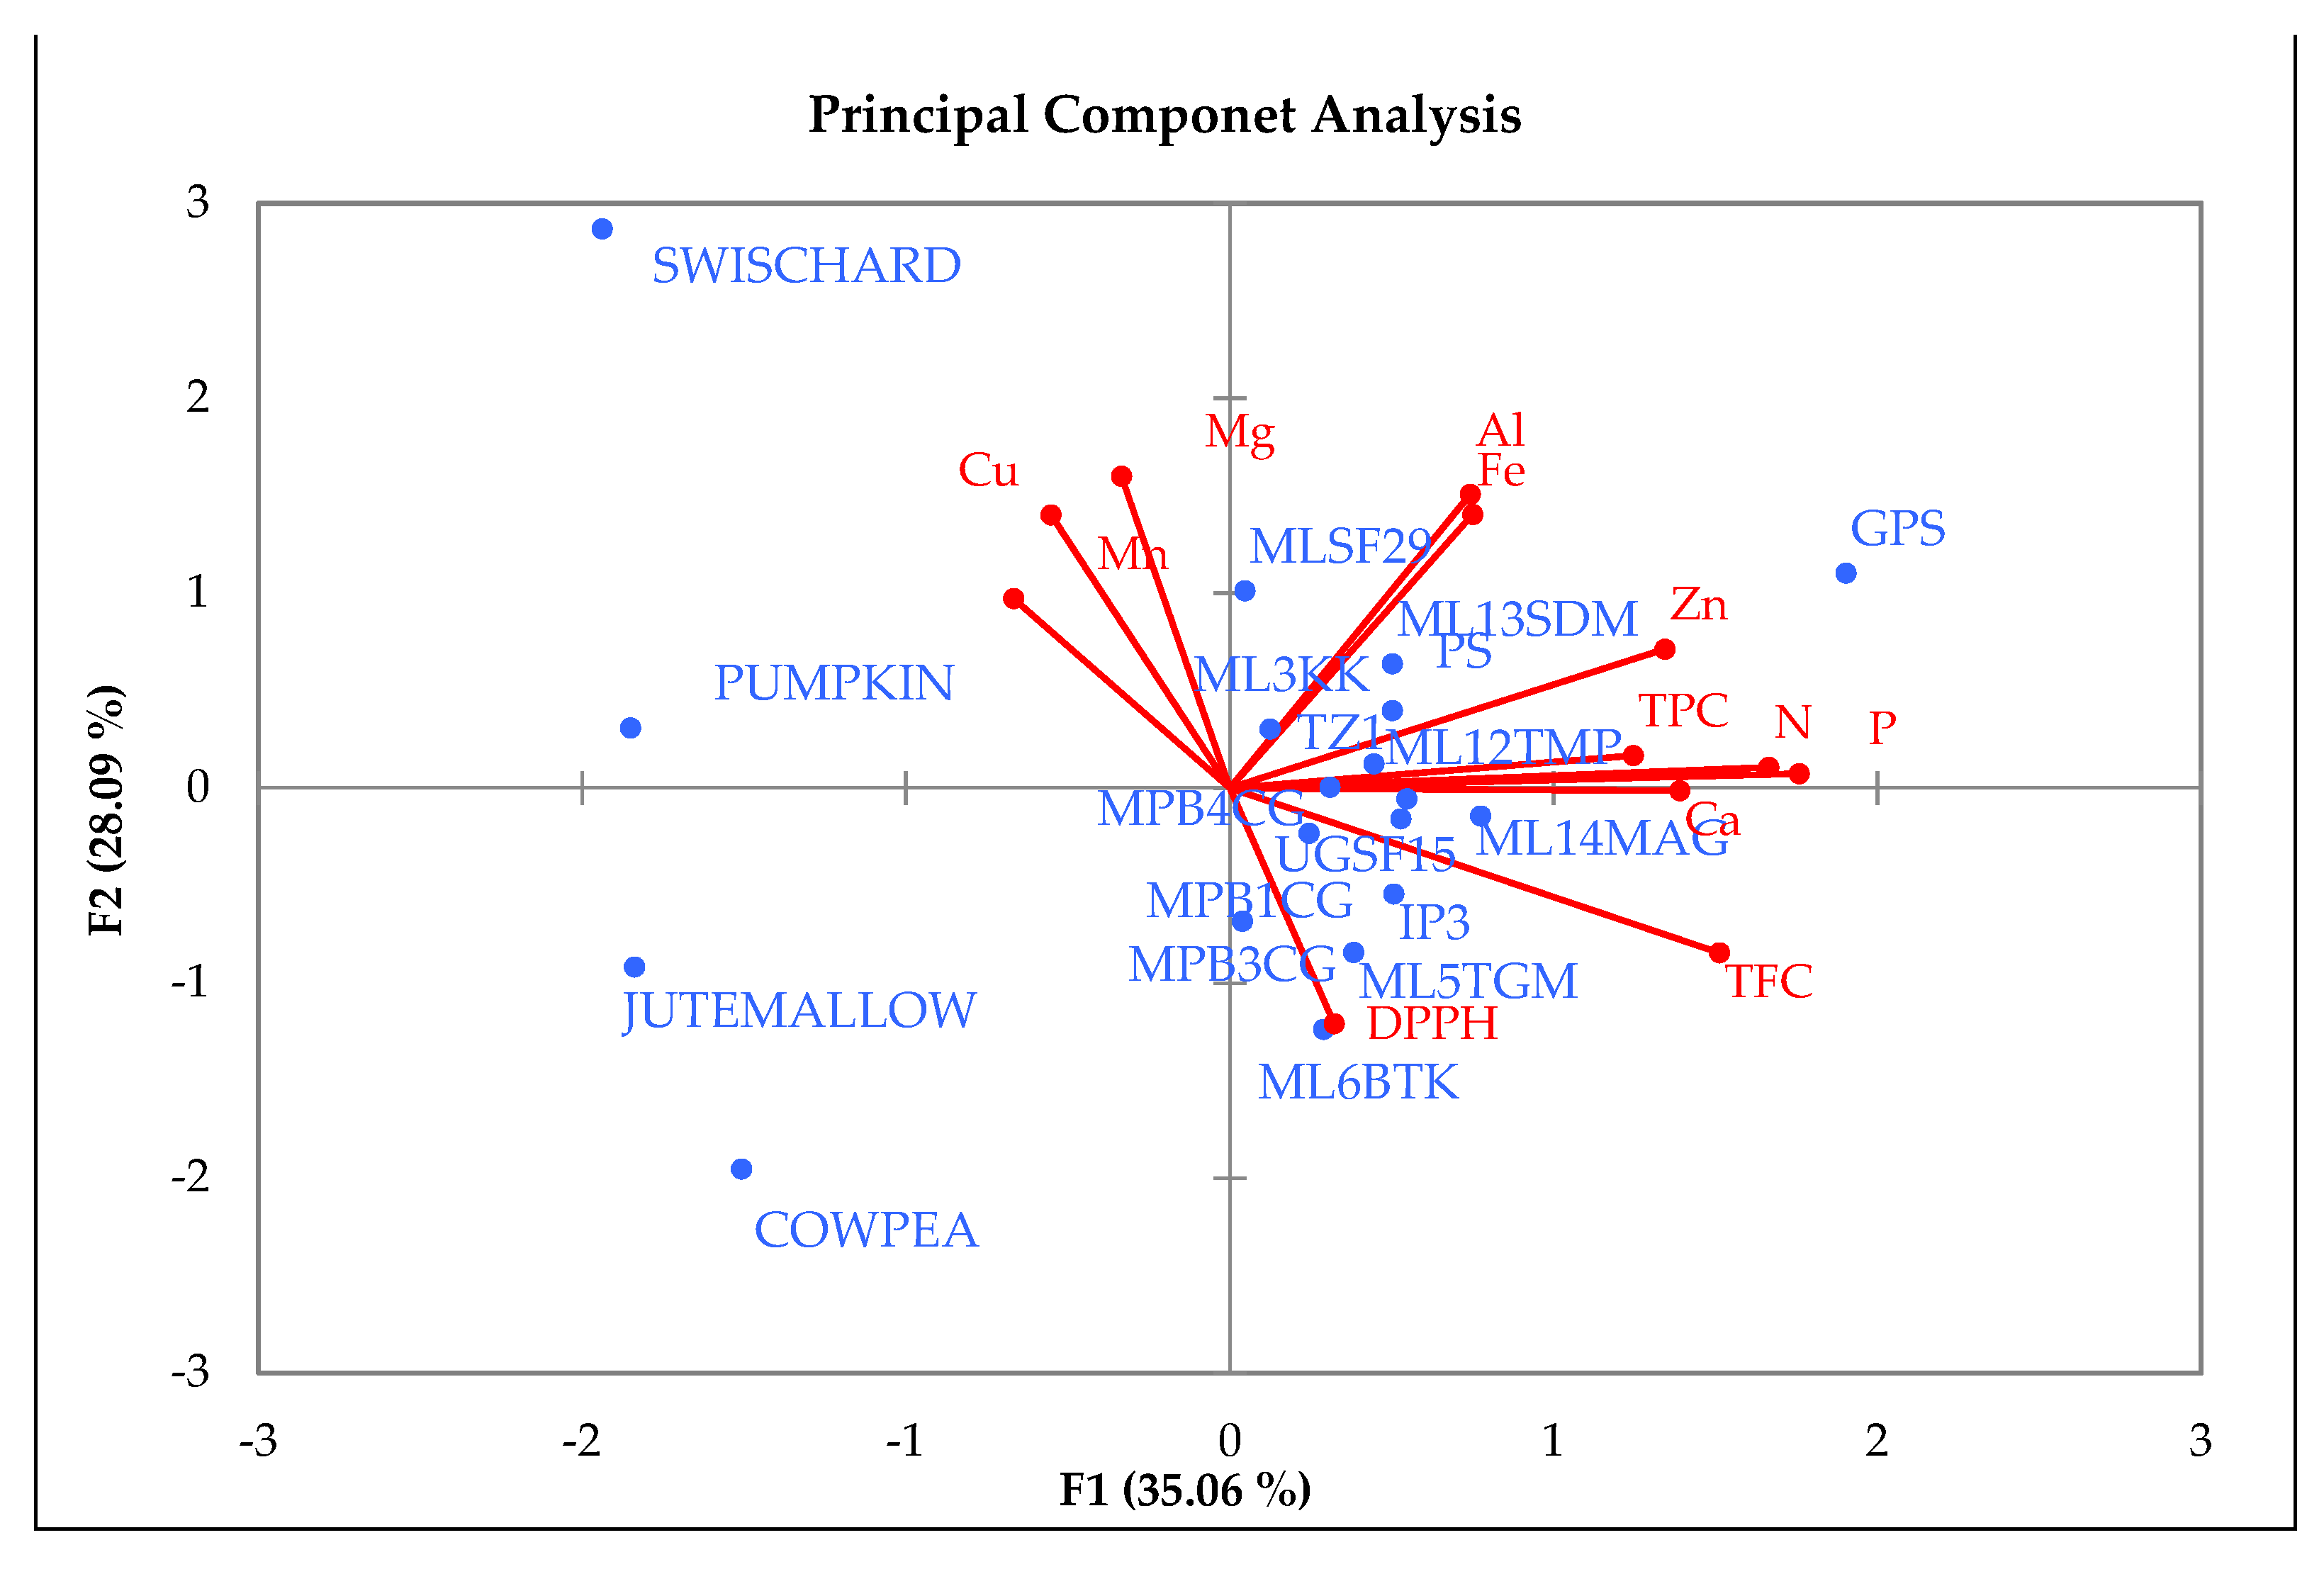
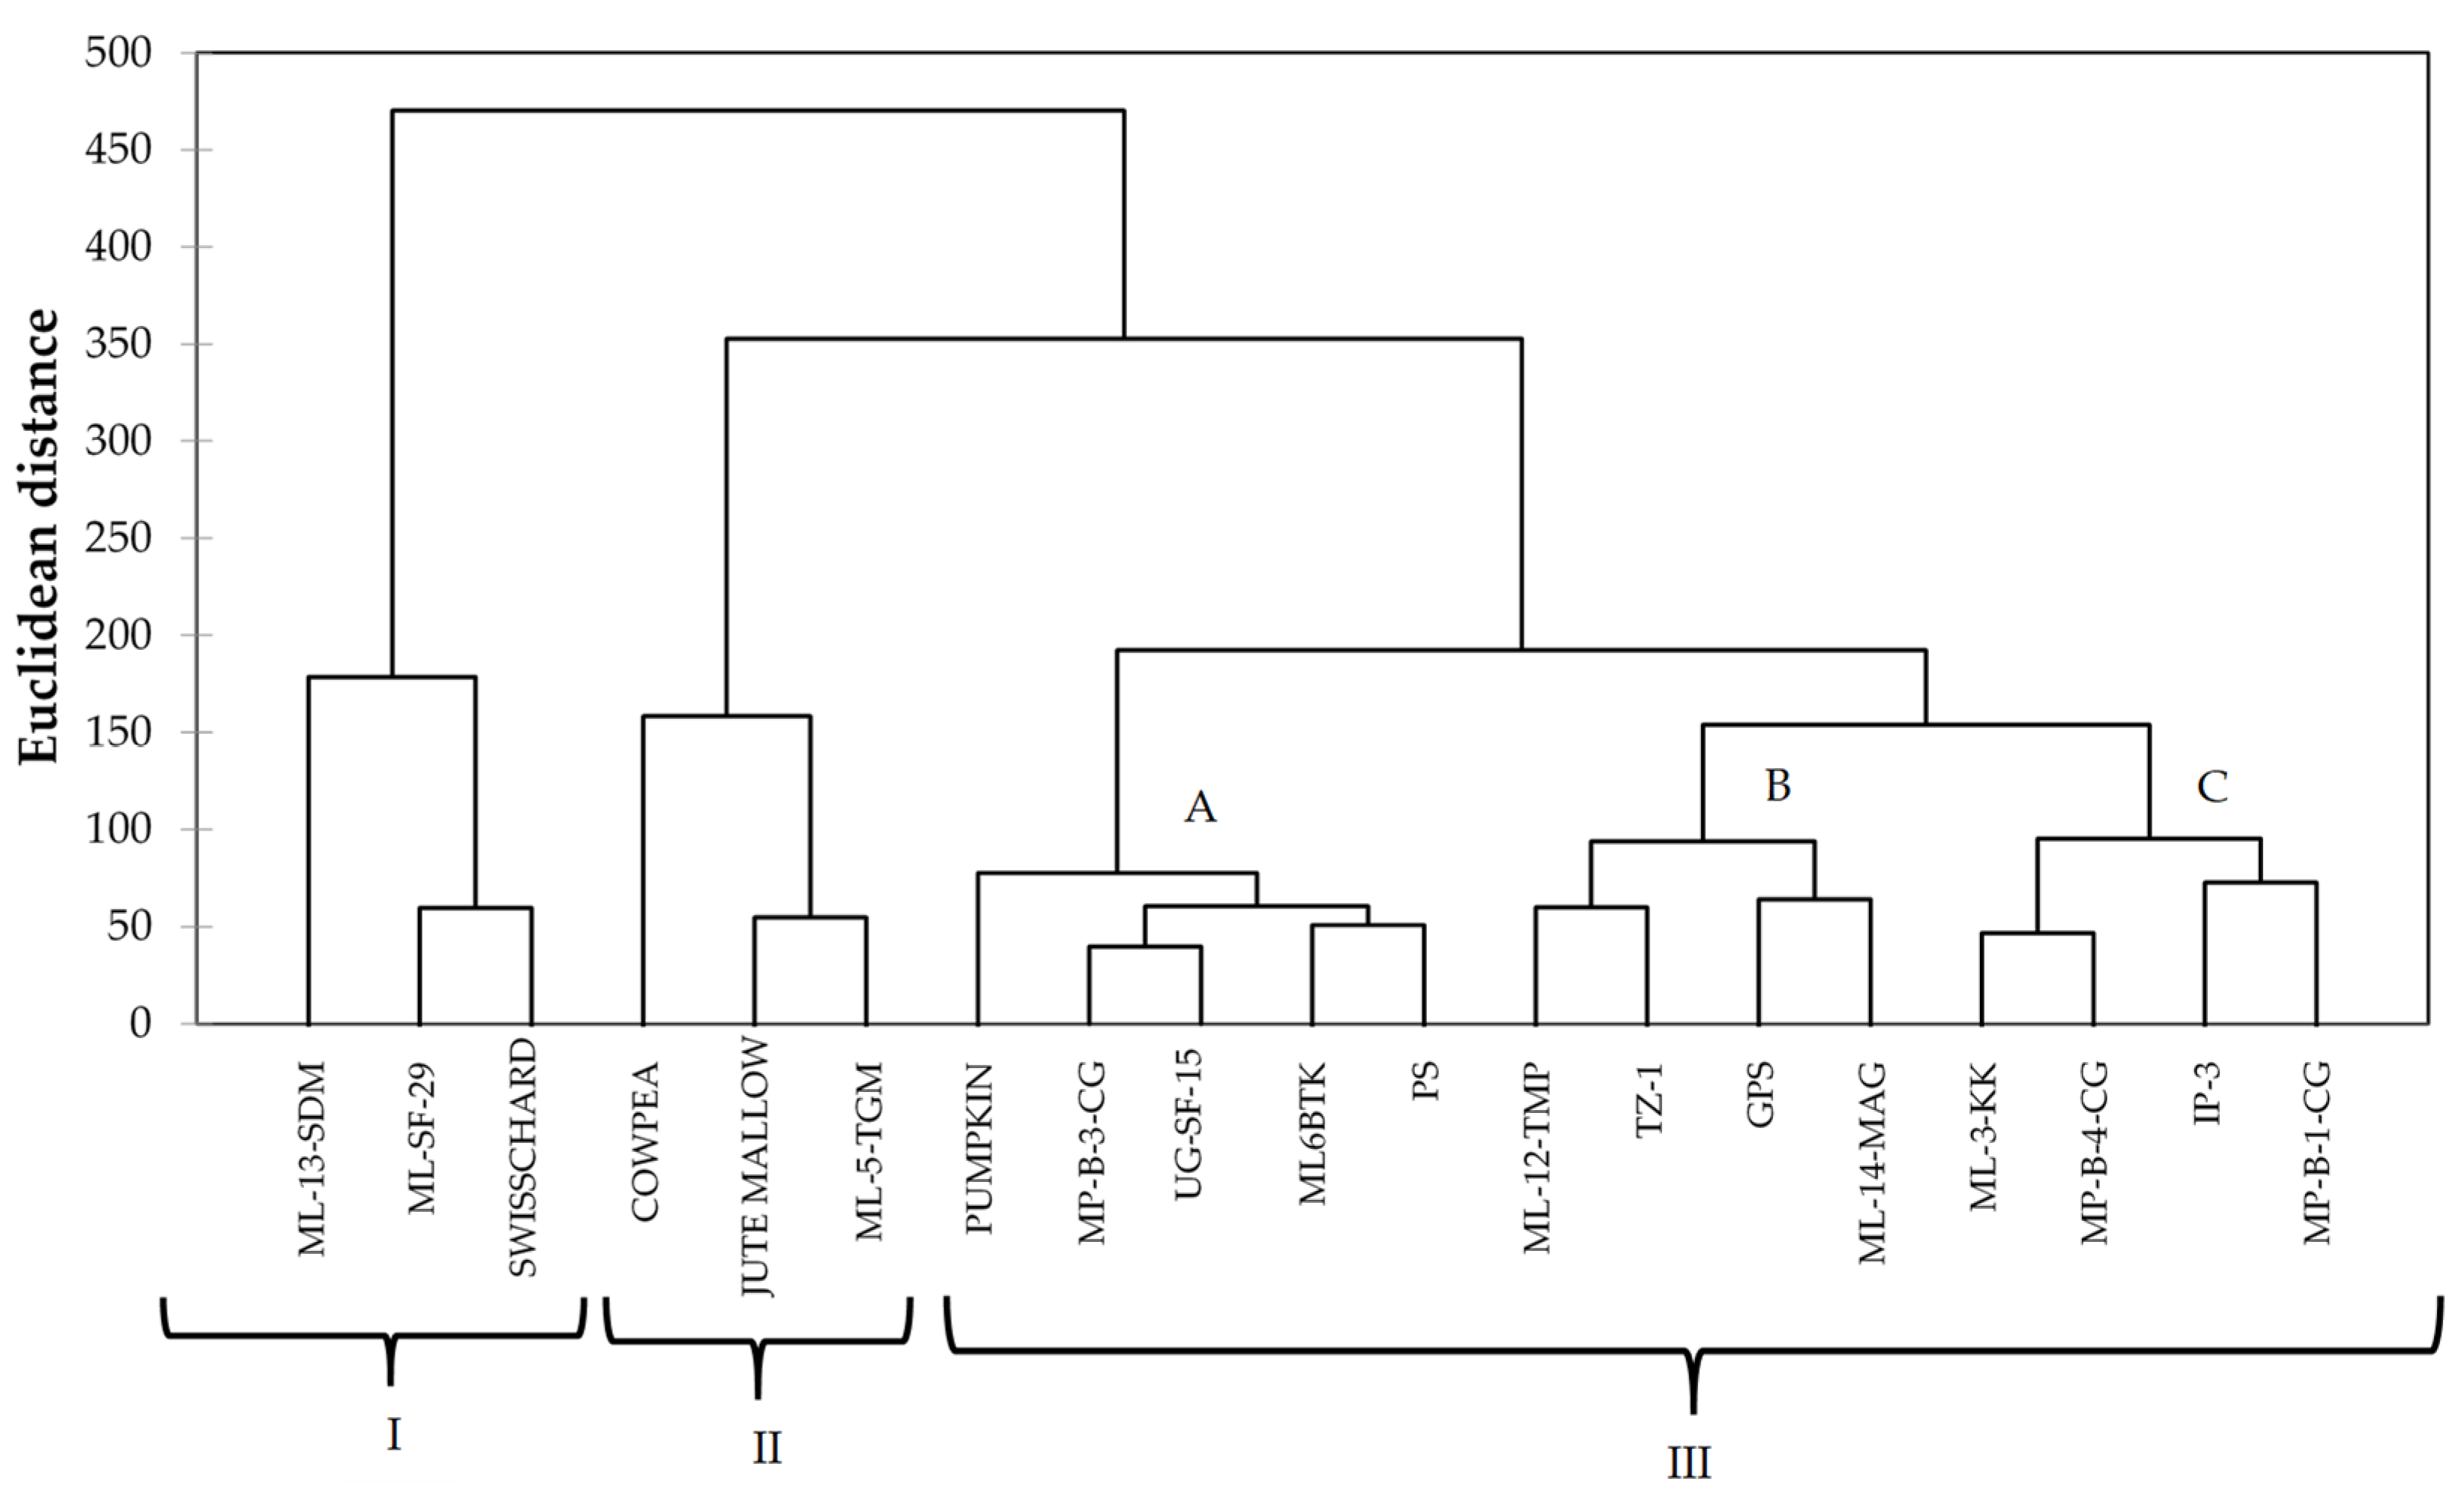
The PCA biplot showed a high level of similarity between the spider plant genotypes and the four standards. All the spider plant accessions were clustered together in the first and second quadrant, while the standards (swiss chard, jute mallow, cowpea, and pumpkin) were isolated from the spider plant genotypes. This is an indication that the indigenous leafy vegetable spider plant is superior in terms of the nutritional composition when compared to the standards in this study. Four exotic genotypes and three local genotypes were associated with high Al, Fe, Zn, N, and TPC and low Ca, TFC, and DPPH and were positively correlated with each other. These genotypes could be used for spider plant genetic improvement. The cluster analysis showed the diversity between spider plant genotypes from different agro-ecological regions and the four common leafy vegetables that were used as standards in the study. The clustering pattern showed that some of the exotic genotypes were similar to the local genotypes. The clusters showed three groups consisting of local genotypes from Limpopo ‘ML-12-TMP’ and ‘ML-14- MAG’ clustering with exotic genotypes ‘TZ-1’ and ‘GPS’ and indicating a high level of similarity. In cases where clusters consisted of both local and exotic genotypes, it indicated that some of the local genotypes are comparable to exotic genotypes in terms of the nutritional composition.

4. Materials and Methods

4.1. Plant Material

Seventeen genotypes of spider plant (Cleome gynandra L.) were used in the study (Table 9). However, the total number of genotypes that were analyzed per specific attribute varied between 15 and 17 depending on the availability of sufficient leaf quantity for analysis. Four standard leafy vegetables that are common in many parts of Africa were included in the study. Three of these (namely cowpea, jute mallow, and pumpkin) were local traditional varieties, whereas the remainder (swiss chard) was a commercial variety.

4.2. Location and Planting

The experiments were conducted during the summer growing seasons (October–March). The plants were raised in the field at Thohoyandou, (22°95′ S; 30°48′ E, 595 m 437 a.s.l.). Daily temperatures at the location vary between 25 and 40 °C in summer and 18 and 26 °C in winter, and the rainfall is highly seasonal with 95% occurring between October and March. The annual average rainfall is about 500 mm. The soils at Thohoyandou are deep (>1500 mm), dystrophic, and well-drained clays with apedal structure, and they are classified as Hutton form [43]. The seed of the genotype was planted manually at a depth of 2.0 cm in a row of 2.0 m long and spaced at 30.0 cm within the row and 1.5 m between rows. Standard Cleome management practices were followed, and no chemical fertilization was applied. Leaves were harvested 6 weeks after germination.

4.3. Determination of Mineral Content

Leaf samples were harvested from five randomly selected plants per row and bulked. The leaf samples were washed with distilled water and dried to a constant weight overnight at 75 °C until there was no further moisture loss. The dried leaves were milled using a porcelain mortar and pestle and sieved through a 1 mm stainless steel sieve to obtain a homogenized sample. Approximately 5 g of the samples were weighed and stored in zip-sealed plastic bags at −20 °C until analysis. The milled samples (0.5 g) were ashed at 450 °C for 4 h. For digestion and filtration, a few drops of distilled water were added to the ashed contents, after which 2 mL of hydrochloric acid (HCl) was added. The samples were evaporated slowly to dryness in a water bath prior to the addition of 2.5 mL of freshly prepared 1:9 HCl solution to each sample. Then, the samples were filtered using Advantec 5B: 90 MM filter papers. The filtrate was diluted with de-ionized water at a ratio of 5:20. The diluted solution was analyzed for mineral elements using the Varian 720 Inductively Coupled Plasma Emission Spectrometer (ICP-OES, Frankfurt, Germany). The raw data from ICP-OES were taken for further calculations using the dry matter determined earlier as well as the weight of the weighed sample.

4.4. Preparation, Identification, and Quantification of Phenolic Compounds

Phenolic extracts were prepared by refluxing 2 g of the dried leaves samples in 20 mL of acidified methanol for 2 h at 60 ± 5 °C. The mixtures were centrifuged at 5000 rpm for 20 min, and the supernatants were separated and used for analysis of total phenolic content, total flavonoid content, and antioxidant activity. The identification and quantification of the phenolic content were determined using the LC-MS method [44]. Previous studies also utilized instruments with increased sensitivity and reliability to identify and quantify compounds [45]. The separation and identification of the phenolic compounds in the extracts were carried out using a Waters Synapt G2 quadrupole time-of-flight mass spectrometer (MS) (Milford, MA, USA). It was fitted with a Waters Ultra pressure liquid chromatograph (UPLC) and photo diode array (PDA) detector. The mass spectrometer was optimized for best sensitivity, the cone voltage was 15 V, the desolvation gas was nitrogen at 650 L/hr, and the desolvation temperature was 275 °C. Separation was achieved on a Waters HSS T3, 150 × 2.1 mm column. A gradient was applied using 0.1% (v/v) formic acid (solvent A) and acetonitrile containing 0.1% formic acid (solvent B). The gradient for the analysis of phenolic compounds started at 100% (solvent A) for 1 min and changed to 28% (solvent B) over 22 min in a linear way. Then, it went to 40% (solvent B) over 50 s and a wash step of 1.5 min at 100% (solvent B), followed by re-equilibration to initial conditions for 4 min. The flow rate was 0.3 mL/min and the column was kept at 55 °C. The injection volume was 2 µL. Rutin, citric acid, chlorogenic acid, and quercetin were used as standards. In a study involving flavonoid content analysis in safflower, rutin was also used as a standard [46].

4.5. Determination of Total Phenolic Content

The total phenolic content of the leaf extracts was determined according to the method by [47] with slight modifications. Briefly, 0.1 mL of acidified methanolic extract was mixed with 5 mL distilled water in a 50 mL volumetric flask. Folin–Ciocalteu’s reagent (2.5 mL) and 7.5 mL 15% sodium carbonate solution were added, mixed thoroughly, made up to 50 mL, and allowed to react for 30 min. The absorbance of the reaction mixture was read at 760 nm with a 96-well microplate spectrophotometer. The result was expressed as mg of gallic acid equivalent (GAE) per g of the sample.

4.6. Determination of Antioxidant Activity

The antioxidant properties of the plant extracts may be influenced by many factors such as the method used for extraction, the composition of the extract, and the type of procedure used [48]. In the present study, the antioxidant activity of the leaf extract was measured using the DPPH free radical scavenging activity and FRAP methods.

4.6.1. 2,2 Diphenyl-1-picrylhydrazyl Free Radical Scavenging Activity (DPPH)

The DPPH radical scavenging activity was determined according to the method by [49] with slight modifications. An aliquot (10 µL) of acidified methanolic extract was mixed with distilled water (90 µL) and 3.9 mL of methanolic 0.1 mM DPPH solution. The mixture was thoroughly vortexed and kept in the dark for 30 min, and the absorbance was read at 515 nm. The result was expressed as the percentage inhibition of the DPPH radical. The percentage inhibition of the DPPH radical was calculated according to the following equation:
% Inhibition of DPPH = [Abs control − Abs sample/ Abs control] × 100
where: Abs control is the absorbance of the DPPH solution without the extract.

4.6.2. Ferric-Reducing Antioxidant Power

The reducing power assay was determined according to the method of [47] with slight modifications. Approximately, 100 µL of the extract was placed in a test tube, and the volume adjusted to 1 mL with methanol. Phosphate buffer (2.5 mL 0.2 M, pH 6.6) and 2.5 mL 1% potassium ferricyanide were added to the tube and vortexed. The mixture was left for 20 min at 50 °C, in a water bath. After incubation, 2.5 mL 10% (w/v) trichloroacetic acid was added, and the mixture centrifuged at 5000 rpm for 20 min; then, 2.5 mL of the supernatant was taken and mixed with 2.5 mL distilled water and 0.5 mL 0.1% (w/v) ferric chloride in a test tube, and the absorbance was measured at 700 nm. Higher absorbance indicates higher reducing power.

4.7. Statistical Analysis

Data obtained were subjected to analysis of variance (ANOVA) using SAS software (Version 9.4; SAS Institute Inc., Cary, NC, USA). The least significant difference test was used to separate means [50]. The mean values were statistically significant at p < 0.05. Pearson’s correlation coefficient test was used to measure the association between variables using SAS software (Version 9.4; SAS Institute Inc., Cary, NC, USA). Principal component analysis (PCA) was performed to determine the significant variables (mineral content, total phenols, and antioxidant activity) that contributed to the variation between spider plant genotypes from different agro-ecological regions and among local genotypes. Hierarchical cluster analysis based on the mineral content, total phenols, and antioxidant activity data were performed to generate a dendrogram describing the variability and similarity between genotypes. These data were subjected to cluster analysis, and the Euclidean measure of distance was used to estimate the genetic distance between genotypes.

5. Conclusions

The spider plant genotypes differed in the concentration of minerals, total phenolics, antioxidant capacity, and flavonoids. There were variations between local spider plant genotypes from different agro-ecological zones of South Africa for some of the nutritional composition; thus, these genotypes can be utilized in future genetic programmes. In addition, the bioavailability of the minerals that were assayed in this study could be useful to end-users. In future, there will be merit in the genetic improvement of the nutrient profile of the spider plant genotypes particularly where they were inferior to the exotic genotypes. Distant groups were observed for some of the local and exotic genotypes of spider plant, and this indicated potential for the genetic enhancement of this leafy vegetable.

Author Contributions

Conceptualization, F.T. and E.T.G.; Methodology F.T. and E.T.G.; formal analysis, N.N. and E.T.G.; writing—original draft preparation, F.T.; writing—review and editing, E.T.G. and G.R.A.M. All authors have read and agreed to the published version of the manuscript.

Funding

This research was funded by the University of Venda (SARDF/17/HRT/01) and the National Research Foundation (TTK160510164545).

Institutional Review Board Statement

Not applicable.

Informed Consent Statement

Not applicable.

Data Availability Statement

Not applicable.

Conflicts of Interest

The authors declare no conflict of interest.

Sample Availability

Limited leaf samples are available from the authors.

References

  1. Muchuweti, M.; Kasiamhuru, A.; Benhura, M.A.N.; Chipurura, B.; Amuna, P.; Zotor, F.; Parawira, W. Assessment of the nutritional value of wild leafy vegetables consumed in the Buhera District of Zimbabwe: A preliminary study. Acta Hort. 2009, 806, 323–329. [Google Scholar] [CrossRef]
  2. Chweya, J.A.; Mnzava, N.A. Cat’s Whiskers. Cleome gynandra L. Promoting the Conservation and Use of Underutilized and Neglected Crops; Institute of Plant Genetics and Crop Plant Research: Gatersleben, Germany; International Plant Genetic Resources Institute (IPGRI): Rome, Italy, 1997; Volume 11. [Google Scholar]
  3. Faber, M.; Oelofse, A.; van Jaarsveld, P.J.; Wenhold, F.A.M.; van Rensburg, W.S. African leafy vegetables consumed by households in the Limpopo and KwaZulu Natal Province of South Africa. S. Afr. J. Clin. Nutr. 2010, 23, 30–38. [Google Scholar] [CrossRef] [Green Version]
  4. van Rensburg, W.S.J.; van Averbeke, W.; Slabbert, R.; Faber, M.; van Jaarsveld, P.; van Heerden, I.; Wenhold, F.; Oelofse, A. African leafy vegetable in South Africa. Water SA 2007, 33, 317–326. [Google Scholar] [CrossRef] [Green Version]
  5. Onyango, C.M.; Kunyanga, C.N.; Ontita, E.G.; Narla, R.D.; Kimenju, J.W. Current status on production and utilization of Spider plant (Cleome gynandra L.) an underutilized leafy vegetable in Kenya. Genet. Resour. Crop Evol. 2013, 60, 2183–2189. [Google Scholar] [CrossRef]
  6. van der Walt, A.M.; Loots, D.T.; Ibrahima, M.I.M.; Bezuidenhout, C.C. Minerals, trace elements and antioxidant phytochemicals in wild African dark-green leafy vegetables (morogo). S. Afr. J. Sci. 2009, 105, 444–448. [Google Scholar]
  7. Jinazali, H.; Mtimuni, B.; Chilembwe, E. Nutrient composition of Cat’s whiskers (Cleome gynandra L.) from different agro-ecological zones in Malawi. Afr. J. Food Sci. 2017, 11, 24–29. [Google Scholar]
  8. Flyman, M.V.; Afolayan, A.J. The suitability of wild vegetables for alleviating human dietary deficiencies. S. Afri. J. Bot. 2006, 72, 492–497. [Google Scholar] [CrossRef] [Green Version]
  9. Orech, F.O.; Christensen, D.L.; Larsen, T.; Friis, H.; Aagaard-Hansen, J.; Estambale, B.A. Mineral content of traditional leafy vegetables from western Kenya. Int. J. Food Sci. Nutr. 2007, 8, 595–602. [Google Scholar] [CrossRef] [PubMed]
  10. Lewu, F.B.; Mavengahama, S. Wild vegetables in Northern KwaZulu Natal, South Africa: Current status of production and research needs. Sci. Res. Ess. 2010, 20, 3044–3048. [Google Scholar]
  11. Neugart, S.; Baldermann, S.; Ngwene, B.; Wasonga, J.; Schreiner, M. Indigenous leafy vegetables of Eastern Africa—A source of extraordinary secondary plant metabolites. Food Res. Int. 2017, 100, 411–422. [Google Scholar] [CrossRef] [PubMed]
  12. Greenfield, H.; Southgate, D.A.T. Food Composition Data. Production, Management, and Use, 2nd ed.; Food & Agriculture Organization: Rome, Italy, 2003; pp. 78–79. [Google Scholar]
  13. Moyo, M.; Amoo, S.O.; Aremu, A.O.; Gru, J.; Šubrtová, M.; Jarošová, M.; Doležal, K. Determination of mineral constituents, phytochemicals and antioxidant qualities of Cleome gynandra, compared to Brassica oleracea and Beta vulgaris. Front. Chem. 2018, 5, 128. [Google Scholar] [CrossRef] [Green Version]
  14. Nesamvuni, C.; Potgieter, M.J.; Steyn, N.P. Nutritional value of wild, leafy plants consumed by the Vhavenda. SA J. Sci. 2001, 97, 51–54. [Google Scholar]
  15. Schoenfeldt, H.C.; Pretorius, B. The nutrient content of five traditional South African dark green leafy vegetables—A preliminary study. J. Food Comp. Anal. 2011, 24, 1141–1146. [Google Scholar] [CrossRef]
  16. Omondi, E.O.; Engels, C.; Nambafu, G.; Schreiner, M.; Neugart, S.; Abukutsa-Onyango, M.; Winkelmann, T. Nutritional compound analysis and morphological characterization of Spider plant (Cleome gynandra)—An African indigenous leafy vegetable. Food Res. Int. 2017, 100, 284–295. [Google Scholar] [CrossRef] [PubMed]
  17. Cartea, M.E.; Velasco, P. Glucosinolates in Brassica foods: Bioavailability in food and significance for human health. Phytochem. Rev. 2008, 7, 213–229. [Google Scholar] [CrossRef]
  18. Corradini, E.; Foglia, P.; Giansanti, P.; Gubbiotti, R.; Samperi, R.; Lagana, A. Flavonoids: Chemical properties and analytical methodologies of identification and quantitation in foods and plants. Nat. Prod. Res. 2011, 25, 469–495. [Google Scholar] [CrossRef] [PubMed]
  19. Frankel, E.N. Nutritional Benefits of Flavonoids. In Food Factors for Cancer Prevention; Ohigashi, H., Osawa, T., Terao, J., Watanabe, S., Yoshikawa, T., Eds.; Springer: Tokyo, Japan, 1997; p. 613. [Google Scholar]
  20. Muchuweti, M.; Mupure, C.; Ndhlala, A.; Murenje, T.; Benhura, M.A.N. Screening of antioxidant and radical scavenging activity of Vigna ungiculata, Bidens pilosa and Cleome gynandra. Am. J. Food Technol. 2007, 2, 161–168. [Google Scholar] [CrossRef]
  21. Uusiku, N.P.; Oelofse, A.; Duodu, K.G.; Bester, M.J.; Faber, M. Nutritional value of leafy vegetables of sub-Saharan Africa and their potential contribution to human health: A review. J. Food Comp. Anal. 2010, 23, 499–509. [Google Scholar] [CrossRef]
  22. Sogbohossou, E.O.D.; Achigan-Dako, E.G.; Mumm, R.; de Vos, R.C.H.; Schranz, M.E. Natural variation in specialised metabolites production in the leafy vegetable spider plant (Gynandropsis gynandra L. (Briq.) in Africa and Asia. Phytochemistry 2020, 178, 112468. [Google Scholar] [CrossRef]
  23. Yang, R.Y.; Lin, S.; Kuo, G. Content and distribution of flavonoids among 91 edible plant species. Asia Pac. J. Clin. Nutr. 2008, 17, 275–279. [Google Scholar]
  24. Odhav, B.; Beekrum, S.; Akula, U.S.; Baijnath, H.B. Preliminary assessment of nutritional value of traditional leafy vegetables in KwaZulu-Natal, South Africa. J. Food Comp. Anal. 2007, 20, 430–435. [Google Scholar] [CrossRef]
  25. Moyo, M.; Amoo, S.O.; Ncube, B.; Ndhlala, A.R.; Finnie, J.F.; Van Staden, J. Phytochemical and antioxidant properties of unconventional leafy vegetables consumed in southern Africa. S. Afr. J. Bot. 2013, 84, 65–71. [Google Scholar] [CrossRef] [Green Version]
  26. Hutchinson, M.J. The effect of farmyard manure and calcium ammonium nitrate fertilizers on micronutrient density (iron, zinc, manganese, calcium and potassium) and seed yields of Solanum villosum (Black nightshade) and Cleome gynandra (Cat’s whiskers) on eutric nitisol. J. Agric. Sci. Technol. 2011, 13, 35–52. [Google Scholar]
  27. Tadesse, W.; Bishaw, Z.; Assefa, S. Wheat production and breeding in Sub-Saharan Africa: Challenges and opportunities in the face of climate change. Int. J. Clim. Chang. Strateg. 2019, 11, 696–715. [Google Scholar] [CrossRef] [Green Version]
  28. Jan, A.T.; Kamli, M.R.; Murtaza, I.; Singh, J.B.; Ali, A.; Haq, Q.M. Dietary flavonoid quercetin and associated health benefits—an overview. Food Rev. Int. 2010, 26, 302–317. [Google Scholar] [CrossRef]
  29. Choi, Y.M.; Yoon, H.; Lee, S.; Lee, M.C.; Oh, S.; Rauf, M. Characterization of agro-morphological traits of Tartary buckwheat germplasm under spring cultivation and analysis of health-related primary bioactive components in seeds by HPLC method. J. Plant Biol. 2021, 64, 87–98. [Google Scholar] [CrossRef]
  30. Maalik, A.; Khan, F.A.; Mumtaz, A.; Mehmood, A.; Azhar, S.; Atif, M.; Karim, S.; Altaf, Y.; Tariq, I. Pharmacological applications of quercetin and its derivatives: A short review. Trop. J. Pharm. Res. 2014, 13, 1561–1566. [Google Scholar] [CrossRef]
  31. David, A.V.A.; Arulmoli, R.; Parasuraman, S. Overviews of biological importance of quercetin: A bioactive flavonoid. Pharmacogn. Rev. 2016, 10, 84–89. [Google Scholar]
  32. Dabeek, W.M.; Marra, M.V. Dietary quercetin and kaempferol: Bioavailability and potential cardiovascular-related bioactivity in humans. Nutrients 2019, 11, 2288. [Google Scholar] [CrossRef] [Green Version]
  33. Oh, S.J.; Kim, O.; Lee, J.S.; Kim, J.A.; Kim, M.R.; Choi, H.S.; Shim, J.H.; Kang, K.W.; Kim, Y.C. Inhibition of angiogenesis by quercetin in tamoxifen-resistant breast cancer cells. Food Chem. Toxicol. 2010, 48, 3227–3234. [Google Scholar] [CrossRef]
  34. Osawe, S.O.; Farombi, E.O. Quercetin and rutin ameliorates sulphasalazine-induced spermiotoxicity, alterations in reproductive hormones and steroidogenic enzyme imbalance in rats. Andrologia 2018, 50, e12981. [Google Scholar] [CrossRef]
  35. Wu, W.; Li, R.; Li, X.; He, J.; Jiang, S.; Liu, S.; Yang, J. Quercetin as an antiviral agent inhibits influenza A virus (IAV) entry. Viruses 2015, 8, 6. [Google Scholar] [CrossRef]
  36. Li, Y.; Qin, W.; Fu, X.; Zhang, Y.; Hassani, D.; Kayani, S.I.; Xie, L.; Liu, H.; Chen, T.; Yan, X.; et al. Transcriptomic analysis reveals the parallel transcriptional regulation of UV-B-induced artemisinin and flavonoid accumulation in Artemisia annua L. Plant Physiol. Biochem. 2021, 163, 189–200. [Google Scholar] [CrossRef]
  37. Lin, S.C.; Lin, C.C.; Li, S.; Lin, W.Y.; Lehman, C.W.; Bracci, N.R.; Tsa, S.W. Alleviation of Collagen-Induced Arthritis by Crotonoside through Modulation of Dendritic Cell Differentiation and Activation. Plants 2020, 9, 1535. [Google Scholar] [CrossRef]
  38. Yan, P.; Zhang, L.; Peng, C.; Zhang, R. Pharmacokinetics and tissue distribution of crotonoside. Xenobiotica 2018, 48, 28–36. [Google Scholar] [CrossRef]
  39. Li, Y.Z.; Yu, S.; Yan, P.A.; Gong, D.Y.; Wu, F.L.; He, Z.; Yuan, Y.Y.; Zhao, A.Y.; Tang, X.; Zhang, R.Q.; et al. Crotonoside exhibits selective post-inhibition effect in AML cells via inhibition of FLT3 and HDAC3/6. Oncotarget 2017, 8, 103087. [Google Scholar] [CrossRef] [Green Version]
  40. Chipurura, B. Nutritional Content, Phenolic Compounds Composition and Antioxidant Activities of Selected Indigenous Vegetables of Zimbabwe. MSc Thesis, University of Zimbabwe, Zimbabwe, South Africa, 2014. [Google Scholar]
  41. Babbar, N.; Oberoi, H.S.; Uppal, D.S.; Patil, R.T. Total phenolic content and antioxidant capacity of extracts obtained from six important fruit residues. Food Res. Int. 2011, 44, 391–396. [Google Scholar] [CrossRef]
  42. Haris, E.D. Copper as a cofactor and regulator of copper, zinc superoxide dismutase. J. Nutr. 1992, 122, 636–640. [Google Scholar] [CrossRef]
  43. Mzezewa, J.; Misi, T.; van Rensburg, L.D. Characterization of rainfall at a semi-arid ecotope in the Limpopo Province (South Africa) and its implications for sustainable crop production. Water SA 2009, 36, 19–26. Available online: http://www.wrc.org.za (accessed on 5 December 2020).
  44. Mphahlelea, R.R.; Stander, M.A.; Fawolea, O.A.; Opara, U.L. Effect of fruit maturity and growing location on the postharvest contents of flavonoids, phenolic acids, vitamin C and antioxidant activity of pomegranate juice (cv. Wonderful). Sci. Hortic. 2014, 179, 36–45. [Google Scholar] [CrossRef]
  45. Odoemelam, C.S.; Percival, B.; Ahmad, Z.; Chang, M.V.; Schoeley, D.; Burton, E.; Okafor, P.N.; Wilson, P.B. Characterization of yellow root cassava and food products: Investigation of cyanide and β-carotene concentrations. BMC Res. Notes 2020, 13, 333. [Google Scholar] [CrossRef]
  46. Wu, Z.; Liu, H.; Zhan, W.; Yu, Z.; Qin, E.; Liu, S.; Yang, T.; Xiang, N.; Kudrna, D.; Chen, Y.; et al. The chromosome-scale reference genome of safflower (Carthamus tinctorius) provides insights into linoleic acid and flavonoid biosynthesis. Plant Biotechnol. J. 2021, 1–18. [Google Scholar] [CrossRef]
  47. Meda, N.T.R.; Bangou, M.J.; Bakasso, S.; Millogo-Rasolodimby, J.; Nacoulma, O.G. Antioxidant activity of phenolic and flavonoid fractions of Cleome gynandra and Maerua angolensis of Burkina Faso. J. Appl. Pharm. Sci. 2013, 3, 036–042. [Google Scholar]
  48. Gupta, A.K.; Rather, M.A.; Jha, A.K.; Shashank, A.; Singhal, S.; Sharma, M.; Pathak, U.; Sharma, D.; Mastinu, A. Artocarpus lakoocha roxb. and artocarpus heterophyllus lam. flowers: New sources of bioactive compounds. Plants 2020, 9, 1329. [Google Scholar] [CrossRef]
  49. Brand-Williams, W.; Cuvelier, M.E.; Berset, C. Use of a free radical method to evaluate antioxidant activity. LWT-Food Sci. Technol. 1995, 28, 25–30. [Google Scholar] [CrossRef]
  50. Fisher, R.A. Design of experiments. Br. Med. J. 1936, 1, 554. [Google Scholar] [CrossRef]
Figure 1. Chromatograms of spider plant (A), swiss chard (B), pumpkin (C), cowpea (D), and jute mallow (E).
Molecules 26 03600 g001aMolecules 26 03600 g001b
Figure 2. Principal component analysis of spider plant genotypes with mineral content, total polyphenol, and antioxidant activity.
Molecules 26 03600 g002
Figure 3. Complete linkage dendrogram showing existing groups in 15 spider plant accessions and four standards based on 12 variables for mineral content, total polyphenol count, and antioxidant activity.
Molecules 26 03600 g003
Table 1. Mineral content of exotic and local genotypes of spider plant and four standards (swiss chard, pumpkin, cowpea, and jute mallow).
g/kg DWmg/kg DW
GenotypesN Ca Mg PAl Cu Fe Mn Zn
GPS (E)67.3 a19.1 a6.5 b8.4 ab256.3 bc14.7 bcd409.3 ab123.3 fg71.3 ab
UG-SF-15 (E)66.7 ab15.6 bcd6.1 bcd6.8 bcde152.0 ghij15.4 bc275.7 def130.3 fg75.0 a
PS (E)65.6 ab15.5 bcd6.3 bc7.9 abc195.0 defgh14.5 bcd367.3 abcd109.7 fg65.3 bc
ML-5-TGM (L)64.4 ab14.8 bcde4.5 efg7.1 abcd146.7 ghij9.6 gh235.0 f199.3 bcdefg58.0 def
ML-SF-29 (E)63.7 ab16.3 abc5.5 cbde6.3 cde299.7 ab11.6 defgh431.3 a509.3 a50.3 ghij
ML-3-KK (L)62.6 abc13.7 bcdef4.9 cdefg7.3 abcd254.3 bc11.3 defgh373.3 abc169.3 defg52.0 efghij
MP-B-3-CG (L)61.4 abcd15.3 bcd4.7 defg6.8 bcde178.3 efghi11.6 defgh289.3 cdef134.0 fg47.0 ijk
ML-13-SDM (L)60.9 abcd15.3 bcd6.3 bc8.7 a201.3 cdefg15.7 abc346.7 abcde285.3 bc63.7 cd
IP-3 (E)60.5 abcd16.4 abc6.1 bcd6.2 de210.3 cdef10.2 fgh288.7 cdef169.3 defg52.0 efghij
ML-14-MAG(L)60.4 abcd16.6 abc5.2 bcdef7.1 abcd231.0 cde12.5 cdefg419.3 ab175.7 cdefg48.7 hij
MP-B-1-CG (L)60.1 abcd12.8 defg5.5 bcde7.3 abcd177.7 efghi12.3 cdefgh331.0 bcde217.0 bcdef59.0 cde
MP-B-4-CG (L)59.2 abcd14.6 bcde4.9 cdefg7.1 abcd246.3 bcd12.4 cdefg359.7 abcd157.3 efg55.3 efgh
ML-12-TMP (L)57.8 abcd15.7 bcde6.1 bcd7.8 abcd249.0 bcd13.8 bcde399.3 ab139.7 fg51.7 fghij
Pumpkin (S)55.8 abcd14.1 bcde6.1 bcd4.4 f135.7 ij16.3 ab342.3 abcde123.0 fg41.0 kl
MP-B-2-CG (L)55.8 abcd13.8 bcdef5.4 bcde6.8 bcde219.7 cdef13.4 bcdef352.0 abcd280.0 bcd54.0 efghi
ML-2-DD (L)54.8 bcde16.9 ab6.4 bc7.9 abcd316.3 a9.9 gh405.0 ab302.3 b50.3 ghij
ML-6-BTK (L)54.7 bcde13.4 cdef4.7 defg5.3 ef167.7 fghi8.9 h254.3 ef137.0 fg48.7 hij
Cowpea (S)51.2 cde15.2 bcd3.8 fg4.1 f124.3 ij10.7 efgh196.7 f264.3 bcde37.3 l
Swiss chard (S)50.0 de11.8 efg11.5 a3.9 f256.3 bc18.9 a405.7 ab436.3 a56.0 efg
Jute mallow (S)49.7 de10.8 g3.7 fg4.3 f97.0 j14.1 bcd236.0 f273.3 bcd37.0 l
TZ-1 (E)4.37 e9.8 g3.7 g5.3 ef142.3 hij9.2 gh229.0 f91.0 g45.7 jk
Mean58.414.55.66.5202.712.7330.0200.553.3
R2 (%)52.9962.8882.7275.4482.4470.6170.8279.8988.29
C.V. (%)12.5613.8916.2315.6316.6516.3317.1332.708.30
LSD12.773.501.601.8046.393.5456.2785.855.17
a–l Means with the same superscript in a column are not significantly different (p < 0.05). E = exotic; L = local; S = standard; N = nitrogen; Mg = magnesium; Ca = calcium; P = phosphorus; Al = aluminum; Cu = copper; Fe = iron; Mn = manganese; and Zn = zinc.
Table 2. Percentage deficit between the highest (a) exotic and (b) local spider plant genotype and individual standard leafy vegetable.
(a) Exotic highest spider plant genotype
GenotypeFe (ML-SF-29)Mn (UG-SF-15)Zn (ML-SF-29)
Cowpea54.28%48.10%50.22%
Jute mallow 45.32%46.33%50.66%
Pumpkin20.63%75.85%45.33%
Swiss chard5.90%14.33%25.33%
(b) Local highest spider plant genotype
Fe (ML-14-MAG)Mn (ML-2-DD)Zn (ML-13-SDM)
Cowpea53.10%12.57%41.37%
Jute mallow 44.72%9.59%41.89%
Pumpkin18.36%59.32%35.61%
Swiss chard3.26%−44.32%12.05%
Table 3. Total polyphenol content and antioxidant activities of the spider plant genotypes, swiss chard, pumpkin, cowpea, and jute mallow.
GenotypeTPC (mg GAE/g)DPPH (%)
ML-13-SDM (L)12.21 a19.13 bcd
ML-12-TMP (L)12.15 a18.93 cd
GPS (E)12.24 a11.90 fgh
IP-3 (E)12.14 a13.16 efg
MP-B-4-CG (L)12.04 ab11.34 ghi
TZ-1 (E)12.04 ab8.70 hij
MP-B-1-CG (L)11.87 abc15.14 ef
ML-5-TGM (L)11.63 abcd22.55 ab
UG-SF-15 (E)11.45 abcde15.17 ef
ML-14-MAG (L)11.27 abcde22.68 a
Swiss chard (S)11.17 abcde5.06 k
MP-B-3-CG (L)10.76 bcdef11.59 ghi
ML-3-KK (L)10.76 bcdef5.37 jk
Jute mallow (S)10.62 cdef16.39 de
ML-6-BTK (L)10.38 def21.98 abc
PS (E)10.38 def8.07 ijk
Cowpea (S)10.27 ef22.55 ab
ML-SF-29 (E)9.86 f9.83 ghi
Pumpkin (S)7.46 g4.87 k
Mean11.0113.92
R2 (%)92.0897.76
C.V. (%)3.848.22
LSD0.0351.49
a–k Means with the same superscript in a column are not significantly different (p < 0.05). E = exotic; L= local and S = standard; TPC = total phenolic content and DPPH = 2,2 diphenyl-1-picrylhydrazyl free radical scavenging activity.
Table 4. Phenolic compounds in spider plant genotypes, swiss chard, pumpkin, cowpea, and jute mallow.
GenotypeQCQ3RQ3βDG
(×102 mg/g)
MP-B-2-CG (L)3.80 a85.57 ab5.80 b
MP-B-1-CG (L)3.10 ab92.64 a4.45 bc
ML-6-BTK (L)2.17 bc75.49 bc3.69 c
IP-3 (E)1.76 cd65.34 cd4.53 c
ML-2-DD (L)1.71 cde66.00 cd1.93 de
UG-SF-15 (E)1.68 cdef61.45 def5.44 b
ML-3-KK (L)1.48 cdef60.25 def2.17 d
MP-B-3-CG (L)1.22 cdefg52.38 ef1.46 def
ML-13-SDM (L)0.92 defg63.57 cde0.76 efg
PS (E)0.90 defg63.85 cde1.80 def
GPS (E)0.85 defg63.88 cde1.65 def
ML-12-TMP (L)0.53 defg58.81 def0.00 g
TZ-1 (E)0.49 efg49.46 f0.61 efg
MP-B-4-CG (L)0.47 efg30.56 g0.45 fg
ML-SF-29 (E)0.45 gf61.03 def1.87 de
Cowpea (S)0.14 g0.00 i0.00 g
ML-14-MAG (L)0.00 g18.52 hg1.09 defg
Pumpkin (S)0.00 g9.8 hi1.60 def
Swiss chard (S)0.00 g0.00 i0.00 g
Jute mallow (S)0.00 g0.00 i7.34 a
Mean1.08 ± 0.0648.93 ± 1.62.3 ± 0.12
R2 (%)91.2598.7897.19
C.V. (%)36.927.9719.15
a–i Means with the same superscript in a column are not significantly different (p < 0.05). E = exotic; L = local and S = standard; QC = Quercetin; Q3R = quercetin-3-rutinoside; Q3βDG = quercetin-3-β-d-glucoside.
Table 5. Molecules identified in spider plant and four standards (swiss chard, jute mallow, cowpea, and pumpkin).
Rank RTFragmentationsMolecular Weight Molecular Formula Molecular Name
(Min)[M − H]− (m/z)[M − H]− (m/z)
Spider plant (Cleome gynandra)
13.87111.0085191.0184C6H8O7Citric acid
25.68110.0231243.0605C9H12N2O6Uridine
36.55150.0441282.0850C10H13N5O5Crotonoside
415.97301.0343755.2135C33H40O20Quercetin 3-(2G-rhamnosylrutinoside)
516.11301.0392609.1432C27H30O17Quercetin 3,4-di-O-glucoside
617.87301.0392609.1462C27H30O16Quercetin 3-O-rutinoside
718.50300.0275; 301.0359463.0868C21H20O12Quercetin 3′-glucoside
819.52285.044593.1566C27H30015Kaempferol 3-O-rutinoside
924.19151.0045301.0371C15H1007Quercetin
Swiss chard (Beta vulgaris var. cicla)
16.55150.0418282.0847C10H13N5O5Crotonoside
217.69413.0872; 293.0449563.1420C26H28O14Apiin
318.43315.0501639.1563C28H32O17Isorhamnetin-3,4’-diglucoside
419.74455.0970; 293.0444605.1505C28H30O15Vicenin-1 6’’-O-acetate
522.79293.0457663.1564C30H32O17Apigenin 7-6’’-malonyl neohesperidoside
Pumpkin (Cucurbita pepo)
11.45203.0518; 185.0415341.110C12H22O11Sucrose
25.65-243.062C14H12O43-desmethyl 5-deshydroxy seleroin
36.55168.0508; 140.0563283.084C10H13N5O58-hydroxy-2-deoxy guanosine
48.78301.0396; 136.0171315.071C16H12O17Quercetin 3-methyl ether
512.48162.1292; 146.0570323.135C19H20N2O3P-Hydroxyphenyl butazone
617.87301.0392609.142C27H30O16Rutin/quercetin-3-O-rutinoside
718.51301.0371463.085C21H20O12Isoquercetin/ Quercetin 3′-glucoside
Cowpea (Vigna unguiculata)
11.78203.0518; 185.0415341.108C12H22O11Sucrose
26.54168.0508282.081C10H13N5058-hydroxy-2-deoxy guanosine
38.78301.0359315.074C16H12O17Quercetin 3-methyl ether
417.43300.0316609.137C27H30O16Rutin/quercetin-3-O-rutinoside
518.18329.1206639.161C32H32O14Chartreusin
618.22300.0291463.083C21H20O12Isoquercetin/Quercetin 3′-glucoside
Jute mallow (Corchorus olitorius)
16.54168.0508282.084C10H13N5O58-hydroxy-2-deoxy guanosine
218.23300.0291463.090C21H20O12Isoquercetin/Quercetin 3′-glucoside
31851300.0291463.086C21H20O12Isoquercetin/Quercetin 3′-glucoside
Table 6. Pearson correlation coefficient for mineral content, phenolic compounds, and antioxidant activities of spider plant.
NCaMgPAlCuFeMnZnQCQ3RQ3βDG TPCDPPH FRAPTFC
N1.00
Ca0.72 **1.00
Mg0.58 *0.74 **1.00
P0.53 *0.57 *0.69 *1.00
Al 0.290.56 *0.450.391.00
Cu 0.46 *0.410.64 *0.68 *0.081.00
Fe 0.410.60 *0.56 *0.58 *0.87 **0.431.00
Mn 0.220.200.190.070.55 *−0.030.45 *1.00
Zn 0.47 *0.380.59 *0.54 *−0.170.74 **0.05−0.161.00
QC0.12−0.260.06−0.13−0.22−0.09−0.290.100.081.00
Q3R0.12−0.160.270.02−0.140.01−0.190.210.220.82 **1.00
Q3βDG0.23−0.090.14−0.30−0.30−0.01−0.350.080.260.84 **0.64 *1.00
TPC−0.220.010.170.32−0.150.22−0.13−0.360.25−0.02−0.06−0.131.00
DPPH0.180.140.030.04−0.29−0.03−0.170.00−0.010.06−0.060.070.211.00
FRAP0.11−0.05−0.15−0.08−0.34−0.11−0.28−0.140.020.370.030.200.260.62 *1.00
TFC−0.13−0.04−0.14−0.40−0.25−0.27−0.39−0.36−0.030.33−0.050.43 *0.48 *0.210.59 *1.00
**, * = significant at the 1% and 5% probability level respectively. QC = quercetin; Q3R = quercetin-3-rutinoside; Q3βDG = quercetin-3-β-D-glucoside; TPC = total phenolic content; TFC = total flavonoid content; DPPH = 2,2-diphenyl-1-picrylhydrazyl free radical scavenging activity and FRAP = ferric-reducing antioxidant power assay.
Table 7. The principal component (PC) factor loadings and eigenvalues for mineral content, total polyphenol, and antioxidant activity.
VariablesF1F2
N0.8670.056
Ca0.723−0.007
Mg−0.1740.833
Zn0.7000.371
Cu−0.2880.730
Mn−0.3480.507
Fe0.3900.730
P0.9150.039
Al0.3860.785
TPC0.6490.087
TFC0.788−0.440
DPPH0.168−0.629
Eigenvalue4.2073.371
Variability (%)35.06228.092
Cumulative %35.06263.154
Table 8. List of clusters of 15 spider plant genotypes and four standards (swiss chard, jute mallow, cowpea, and pumpkin) according to cluster analysis.
Cluster Number of GenotypesGenotypesType
I3ML-13-SDMLocal
ML-SF-29Exotic
Swiss chardStandard
II3CowpeaStandard
Jute mallowStandard
ML-5-TGMLocal
III13PumpkinStandard
MP-B-3-CGLocal
UG-SF-15Exotic
ML-6-BTKLocal
PSExotic
ML-12-TMPLocal
TZ-1Exotic
GPSExotic
ML-14-TMPLocal
ML-3-KKLocal
MP-B-4-CGLocal
IP-3Exotic
MP-B-1-CGLocal
Table 9. Origins of the spider plant genotypes and other leafy vegetables that were used in this study.
Code/NameOrigin Classification
1. ML-2-DDLimpopo Province (South Africa)Local
2. ML-3-KKLimpopo Province (South Africa)Local
3. ML-5-TGMLimpopo Province (South Africa)Local
4. ML-12-TMPLimpopo Province (South Africa)Local
5. ML-13-SDMLimpopo Province (South Africa)Local
6. ML-14-MAGLimpopo Province (South Africa)Local
7. ML-6-BTKLimpopo Province (South Africa)Local
8. MP-B-1-CGMpumalanga Province (South Africa)Local
9. MP-B-2-CGMpumalanga Province (South Africa)Local
10. MP-B-3-CGMpumalanga Province (South Africa)Local
11. MP-B-4-CGMpumalanga Province (South Africa)Local
12. TZ-1Tanzania Local seedExotic
13. IP-3Kenya (WorldVeg, Tanzania, Arusha)Exotic
14. ML-SF-29Malawi (WorldVeg, Tanzania, Arusha)Exotic
15. PSTanzania (WorldVeg, Tanzania, Arusha)Exotic
16. GPSTanzania (WorldVeg, Tanzania, Arusha)Exotic
17. UG-SF-15Uganda (WorldVeg, Tanzania, Arusha)Exotic
18. Cowpea (Vigna unguiculata) Limpopo Province (South Africa)Local standard
19. Jute mallow (Corchorus olitorius) Limpopo Province (South Africa)Local standard
20. Pumpkin (Cucurbita pepo)Limpopo Province (South Africa)Local standard
21. Swiss chard (Beta vulgaris var. cicla)Commercial varietyLocal standard
Exotic genotype = genotypes originating in a foreign country. WorldVeg = World Vegetable Center.
Publisher’s Note: MDPI stays neutral with regard to jurisdictional claims in published maps and institutional affiliations.

