Article

Functional Domains and Evolutionary History of the PMEL and GPNMB Family Proteins

1
Department of Medical Genetics, University of Alberta, Edmonton, AB T6G 2R3, Canada
2
Department of Biological Sciences, University of Alberta, Edmonton, AB T7Y 1C4, Canada
3
Centre for Prions & Protein Folding Disease, University of Alberta, Edmonton, AB T6G 2M8, Canada
*
Authors to whom correspondence should be addressed.
These authors contributed equally to this work.
Molecules 2021, 26(12), 3529; https://doi.org/10.3390/molecules26123529
Submission received: 19 April 2021 / Revised: 31 May 2021 / Accepted: 2 June 2021 / Published: 9 June 2021
(This article belongs to the Special Issue Recent Advances in Understanding and Treating Amyloidosis)

Abstract

:
The ancient paralogs premelanosome protein (PMEL) and glycoprotein nonmetastatic melanoma protein B (GPNMB) have independently emerged as intriguing disease loci in recent years. Both proteins possess common functional domains and variants that cause a shared spectrum of overlapping phenotypes and disease associations: melanin-based pigmentation, cancer, neurodegenerative disease and glaucoma. Surprisingly, these proteins have yet to be shown to physically or genetically interact within the same cellular pathway. This juxtaposition inspired us to compare and contrast this family across a breadth of species to better understand the divergent evolutionary trajectories of two related, but distinct, genes. In this study, we investigated the evolutionary history of PMEL and GPNMB in clade-representative species and identified TMEM130 as the most ancient paralog of the family. By curating the functional domains in each paralog, we identified many commonalities dating back to the emergence of the gene family in basal metazoans. PMEL and GPNMB have gained functional domains since their divergence from TMEM130, including the core amyloid fragment (CAF) that is critical for the amyloid potential of PMEL. Additionally, the PMEL gene has acquired the enigmatic repeat domain (RPT), composed of a variable number of imperfect tandem repeats; this domain acts in an accessory role to control amyloid formation. Our analyses revealed the vast variability in sequence, length and repeat number in homologous RPT domains between craniates, even within the same taxonomic class. We hope that these analyses inspire further investigation into a gene family that is remarkable from the evolutionary, pathological and cell biology perspectives.

1. Introduction

In recent years, the disease-causing genes GPNMB (Glycoprotein nonmetastatic melanoma protein B) (i.e., HGFIN, NMB and Osteoactivin) and PMEL (premelanosome protein) (i.e., PMEL17, SILV, MMP115 and gp100) have generated increased interest from disparate biomedical fields. GPNMB and PMEL are related genes that encode for proteins with a common functional domain architecture: a signal peptide, core amyloid fragment, Kringle-like domain and a single transmembrane domain [1]. Consistent with this common architecture, both have also been implicated in the same diverse biological roles via their association with phenotypic presentation and disease, i.e., cancer [2,3,4,5,6], glaucoma [7,8,9], neurodegenerative disease [10,11,12,13], melanin-based pigmentation [14,15,16,17] and amyloid formation/amyloidosis [18,19,20,21,22]. It is therefore surprising that these related proteins with a strikingly similar suite of functional domains have yet to be identified as interacting in, or being partially redundant in, any biological process or pathway.
PMEL is a single-pass Type I transmembrane glycoprotein expressed in pigmented melanocytes, retinal pigmented epithelium and the substantia nigra [5]. This protein is processed through several complex steps of O-linked glycosylation and ADAM/BACE2/proprotein convertase/γ-secretase proteolytic cleavages [23,24,25,26,27,28,29,30] and shuttled to stage I melanosomes. Mature PMEL fragments assemble into striated amyloid fibrils within stage II melanosomes, elongating the organelles and providing a scaffold for eumelanin deposition, driving melanosome maturation [24,25,31,32,33]. In this role, PMEL represents a protein of significant interest as a functional amyloid (discussed further in references [20,34]). Amyloid has historically been studied in relation to its toxicity and association with degenerative neuropathies such as Alzheimer’s and Parkinson’s disease. How the PMEL amyloid is tolerated within cells is therefore of major therapeutic interest [34,35].
PMEL mutations have been selected in domesticated animals for at least a century [36] thanks to desirable changes in coats and plumage colors. However, it was not until the 1990s that molecular genetic analyses have identified the allele in Pmel responsible for the autosomal recessive, progressive greying fur of the Silver mouse [37,38]. Since then, a panoply of striking pigmentation patterns has been associated with mutations of the pmel gene (Figure 1). The majority of these represent recessive, loss-of-function mutations that give rise to hypopigmentation phenotypes [9,38,39,40,41,42]. However, dominant, missense mutations have also been described, suggestive of gain-of-function (GOF) pathology [16,17,43,44,45]. These dominantly inherited mutations sometimes cause more severe phenotypes, including ocular anterior segment dysgenesis (Figure 1) and deafness [46,47,48,49,50,51]. In humans, autosomal dominant pigmentary glaucoma is caused by missense PMEL mutations (Figure 1), providing a tantalizing suggestion that GOF mutations in a (usually) strictly regulated functional amyloid can lead to retinal neuropathy [9].
Like PMEL, the GPNMB protein undergoes glycosylation and proteolytic cleavage to produce the mature peptide [52,53,54,55]. GPNMB also localizes to melanosomes [54,56,57], is transcriptionally regulated by the Melanocyte-Inducing Transcription Factor (MITF) [58,59,60,61] and, when mutated, can lead to hypopigmented lesions and pigmentary glaucoma in mice (Figure 2) [7,8,18,19]. Surprisingly, there has been no functional evidence of the amyloid-forming roles of GPNMB, perhaps owing to the post-transcriptional modification of its PKD domain [62], although disease presentation suggests a relationship between GPNMB and the amyloid. Human mutations of GPNMB cause recessive and semi-dominant amyloidosis cutis dyschromica [18,63,64,65,66], a condition characterized by amyloid deposition in the papillary dermis; remarkably, though, the GPNMB protein is not a constituent of amyloid deposits [18]. Furthermore, GPNMB is more broadly expressed than PMEL and has been implicated in a broad array of biological processes outside of pigmentation.
GPNMB is highly expressed in the nervous system, kidney nephrons, macrophages, dendritic cells and astrocytes [52,61,67,68,69,70]. A major role appears to be as a negative regulator of inflammation [71,72], and the breakdown of the ocular immune privilege is hypothesized to be the cause of Gpnmb-associated glaucoma in mice [73,74]. GPNMB is required for the differentiation of osteoblasts [58,67,75,76,77,78,79,80], and the protein localizes to the plasma membrane, as well as is cleaved in some cell types to act as a matricellular protein regulating extracellular matrix remodeling [53,54,55,58,81,82,83,84,85,86,87,88]. Most strikingly, the heightened expression of GPNMB has been associated with amyotrophic lateral sclerosis (ALS) [10,11], Parkinson’s disease [12,89,90] and Alzheimer’s Disease [91], all of which have pathogenic amyloids as major components of the disease progression. Perhaps counterintuitively, elevated levels of GPNMB are neuroprotective in Parkinson’s and ALS models, and the protein has not been described as a component of amyloid plaques [92,93,94].
Despite apparent differences in protein functions, the GPNMB and PMEL genes are putative paralogs that arose from an ancient common ancestor. In this paper, we synthesized the existing literature and performed new bioinformatic comparisons to help situate these (and future) comparisons of PMEL and GPNMB in the correct framework. We identified the enigmatic TMEM130 as the most ancient paralog in the protein family, from which PMEL and GPNMB evolved in early craniate radiation. We then compared-and-contrasted their protein domains across a diversity of metazoans to identify the characteristic motifs unique to each gene. Of particular interest, the PMEL-specific repeat (RPT) domain, a key accessory domain to amyloid formation, was thoroughly analyzed across clade-representative species to interrogate the most highly conserved features of the domain. We hope that this work will stimulate interest in this important protein family, further elucidating the overlapping but divergent roles of GPNMB and PMEL and encouraging investigations into the functions of TMEM130.

2. Methods

2.1. Animal Ethics

Zebrafish were maintained and bred using typical husbandry methods and with the approval of the Animal Care and Use Committee at the University of Alberta (protocol AUP00000077). Zebrafish mutants pmelaua5022 described previously as larvae [9] are assigned as ZFIN ID: ZDB-ALT-191119-1.

2.2. Identification of PKAT Family Homologs

PKAT (PKD- and KLD-Associated Transmembrane, see end of Section 3.2 for further explanation) homologs were identified via tblastn searches of the NCBI (https://blast.ncbi.nlm.nih.gov/Blast.cgi (accessed on 19 March 2021)) and ENSEMBL (https://uswest.ensembl.org/Multi/Tools/Blast?db=core (accessed on 19 March 2021)) genome assembly databases. For E. muelleri, the BLAST search was performed at https://spaces.facsci.ualberta.ca/ephybase/ (accessed on 19 March 2021). The query sequence was human TMEM130, GPNMB or the PMEL PKD domain. All default parameters were maintained, including BLOSUM62 and an E-value cut-off of 0.05. For predicted/uncharacterized loci, a reciprocal blastp to the human assembly was performed. Percentage homology between paralogs was reported as the sequence identity/sequence length calculated after Clustal Omega alignment.

2.3. Annotating PKAT Protein Domain Architecture and Intron–Exon Architecture

Human TMEM130 (ENST00000416379.6), GPNMB (NP_001005340.1) and PMEL (ENST00000548493.5) protein sequences were analyzed with the InterPro Scan web client (https://www.ebi.ac.uk/interpro/search/sequence (accessed on 19 March 2021)) [95] to receive domain predictions. Schematic representations of these domains were created in CorelDRAW X7. Exon length was determined by uploading genomic DNA sequences of each gene into Geneious software and exporting the exon length information. Schematics representing the protein domain boundaries were created in CorelDRAW X7.

2.4. Production of Cladogram/Phylograms

The clade names and branching structure reported in Section 3.3 were derived from the NCBI Taxonomy Browser, building a phylip-formatted tree with selected taxa at https://www.ncbi.nlm.nih.gov/Taxonomy/CommonTree/wwwcmt.cgi (accessed on 19 March 2021). The phylogram reported in Section 3.4 was created using clade-representative protein sequences. Sequences were uploaded to MEGA X, and phylogeny was inferred using the Maximum Likelihood method and Whelan and Goldman + Frequency model. One thousand bootstrap iterations were performed, and Trichoplax tmem130 was chosen as the outgroup. Color of the monophyletic groups was added in Photoshop v22.1.

2.5. Synteny Analysis

One hundred genes upstream and downstream (or until the end of the chromosome) of the lamprey PKAT outparalogs were downloaded from the NCBI genome assembly (kPetMar1.pri). The gene identity tracks were then compared against the human Ch7 and Ch12 (GRCh38.p13), chicken Ch2 and Ch33 (GRCg6a) and skate Ch2 and Ch46 (sAmbRad1.pri). Genes shared with any of the other species were used as evidence of paralogous regions. The schematic representation figure was produced in Photoshop v22.1.

2.6. Functional Domain Alignments

Representative protein sequences for each gene in each major clade were chosen from the annotated and curated organismal lists at Ensembl (https://uswest.ensembl.org/index.html (accessed on 19 March 2021)) or NCBI (https://www.ncbi.nlm.nih.gov/ (accessed on 19 March 2021)) where possible. For incompletely-annotated genes, BLASTp and tBLASTn [96] searches of the NCBI database (https://blast.ncbi.nlm.nih.gov/Blast.cgi (accessed on 19 March 2021)) were performed to identify representative gene entries or unannotated gene fragments in whole-genome shotgun contigs. Protein sequences were aligned in Geneious Prime 2020.1.2, created by Biomatters (https://www.geneious.com (accessed on 19 March 2021)), using the MUSCLE algorithm and manual editing.

2.7. RPT Domain Identification and Comparison

Rapid Automated Detection of Repeats (RADAR) (https://www.ebi.ac.uk/Tools/pfa/radar/ (accessed on 19 March 2021)) [97,98] was used to identify repetitive regions in the premelanosome (Pmel) protein amino acid sequences prior to aligning repeats via similarity by hand. The corresponding cDNA of each protein repeat was aligned to correspond with the amino acids, polarity color coding was selected and consensus sequences and sequence logos were made in Geneious Prime.

3. Results and Discussion

3.1. Mutations of PMEL or GPNMB Cause an Overlapping Spectrum of Pathologies but Highlight the Disparate Functional Roles of Each Protein

Many mutations have been described in the PMEL gene from a variety of animals, owing to the striking pigmentary changes that result (Figure 1). Correlating genotypes to phenotypes reveals that missense mutations in PMEL homologs typically exhibit a dominant inheritance pattern (Table 1 and the references therein). For example, the dominant inheritance of the pigment phenotypes in white chicken, Charolais cattle and Silver dapple horses are caused by missense mutations in PMEL. This contrasts the recessive pigmentation phenotypes in the Silver/Pmel-/- mouse and two alleles of zebrafish, which harbor nonsense mutations (Table 1). This correlation is also apparent in human dominantly inherited pigmentary glaucoma associated with missense mutations in PMEL (Table 2 and the references therein). The exceptions to this trend include a variable expansion of the SINE intron insertion within Merle dogs that is a dominantly inherited nonsense mutation. This overall pattern suggests that nonsense mutations in PMEL homologs are often better-tolerated and require two mutant alleles for detectable phenotypes. However, the phenotype–genotype correlation for pigmentation defects is not retained across the ocular phenotypes associated with PMEL mutation, which have been described in zebrafish (recessive), horses (recessive), dogs (recessive) and humans (dominant).
In contrast, the human disease amyloidosis cutis dyschromica (Figure 2) is caused by GPNMB mutations with both recessive and semi-dominant inheritance patterns described (Table 3 and the references therein). Causal mutations can be either nonsense or missense, and the symptoms include generalized hypopigmented skin mottled with hyperpigmented macules [18]. While no detectable phenotype has been described in zebrafish gpnmb mutants, murine Gpnmb, Tryp1 double-homozygotes develop pigment dispersion, pigmentary glaucoma and iris atrophy (Table 4) without reported dermal amyloidosis [8,74]. These murine phenotypes highlight an intriguing overlap between Gpnmb and Pmel, as the mutations in each can result in pigmentary and ocular defects.

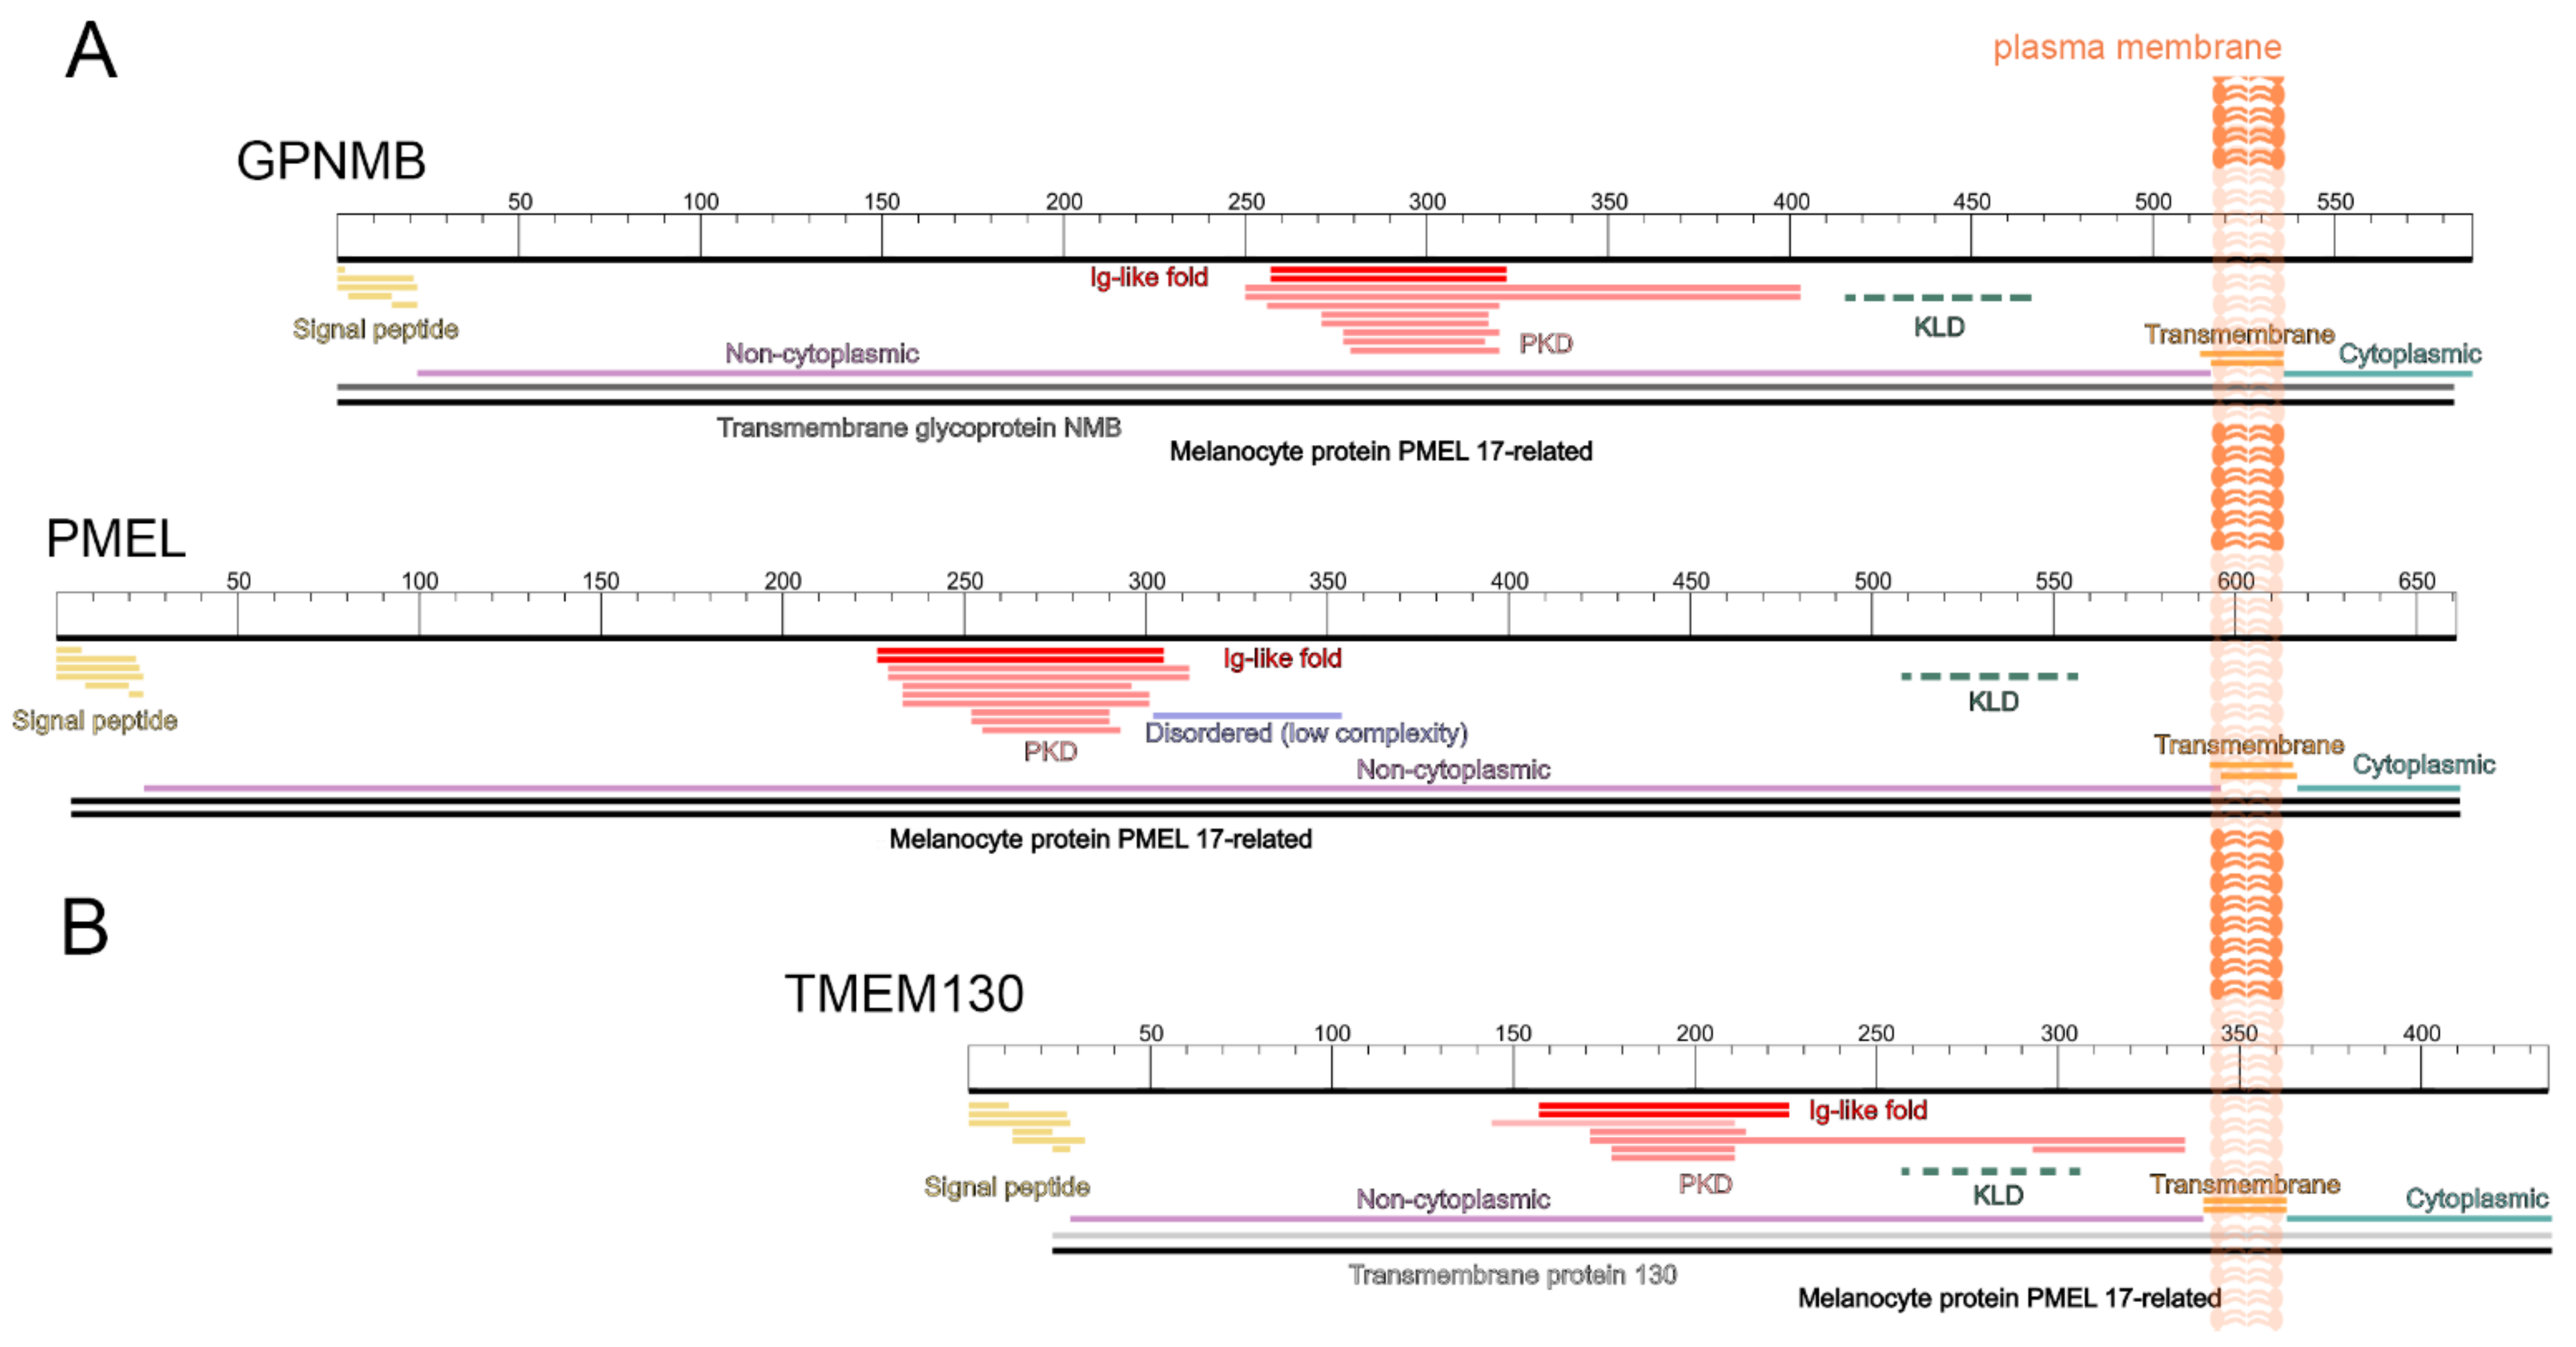
3.2. TMEM130, GPNMB and PMEL Form a Protein Family and Share a Common Protein Domain Architecture

GPNMB and PMEL have long been recognized as outparalogs (genes arising from an ancient duplication event (for review, see reference [99]) and studied together as a gene family. However, TMEM130 is also a recognized member of the PANTHER melanocyte protein PMEL-17-related (PTHR11861) family (http://www.pantherdb.org (accessed on 19 March 2021)) but remains poorly studied. If TMEM130 does indeed represent a third member of the gene family, then comparisons of the three genes could provide insight as to how PMEL and GPNMB evolved different functions.
Despite being predicted homologs, the MUSCLE alignment of the full-length human sequences (Tables S1 and S2) demonstrated the limited sequence identity of PMEL to the other members at either the cDNA level (38.7% vs. TMEM130 and 33.2% vs. GPNMB) or the protein level (13.7% vs. TMEM130 and 24.9% vs. GPNMB). We therefore opted to investigate the similarities at the level of the shared domain architecture. The sequences for human TMEM130 (ENST00000416379.6), GPNMB (ENST00000647578.1) and PMEL (ENST00000548493.5) proteins were run through InterPro Scan to identify the functional domains based on the database signatures [95]. As expected, the GPNMB and PMEL proteins displayed a conserved protein domain architecture: (1) an N-terminal secretory pathway targeting signal (signal peptide, SP), (2) a large non-cytoplasmic (luminal) region containing an immunoglobulin-like polycystic kidney domain (PKD) and (3) a single Type I transmembrane domain with a short, C-terminal cytosolic domain (Figure 3A and Table S3).
The InterPro Scan analysis does not annotate the highly conserved Kringle-like domain (KLD) that has been previously characterized in GPNMB and PMEL [100,101]; this domain, (named after the triple-loop fold Kringle domain) lies downstream of the PKD (Figure 3A dashed line) and contains six highly conserved cysteine residues that are critical for forming the disulphide bonds of mature PMEL dimers [100]. However, the InterPro Scan analysis does identify a disordered (low complexity) region unique to PMEL. This region corresponds to the enigmatic PMEL repeat domain (RPT), which is sufficient to form fibrils outside of the normal physiological conditions [21,102,103] but is dispensable for amyloid formation in vivo [22,104,105]. Instead, the most recent data suggests that the RPT is an essential accessory domain required for physiological amyloid packing [22]; this is consistent with the absence of a RPT domain in GPNMB, which does not contribute to melanosome amyloid [62].
An analysis of the human TMEM130 domain architecture revealed that, despite being considerably shorter than the other two family members (435 residues vs. 588 GPNMB and 661 PMEL), TMEM130 has a strikingly similar domain architecture (Figure 3B and Table S3). The signal peptide, PKD and transmembrane domains were present and conserved in order with the other two proteins. Furthermore, a KLD was resolved via multiple sequence alignment (see Section 3.6). Despite lacking identifiable homology in the region between the SP and PKD domains, this analysis strongly supports the inclusion of TMEM130 as a member of the same protein family. Consistently, all three proteins were identified as “melanocyte protein PMEL-17- related family members”. This nomenclature is based upon the previous naming convention of PMEL (PMEL-17) and is outdated. We therefore propose the use of “PKD- and KLD-Associated Transmembrane (PKAT) protein family” for this interesting protein family. This name reflects the highly conserved domain architecture of the three human gene members and remains inclusive of species-specific paralogs (inparalogs) that arise during gene duplication events (see Section 3.3).

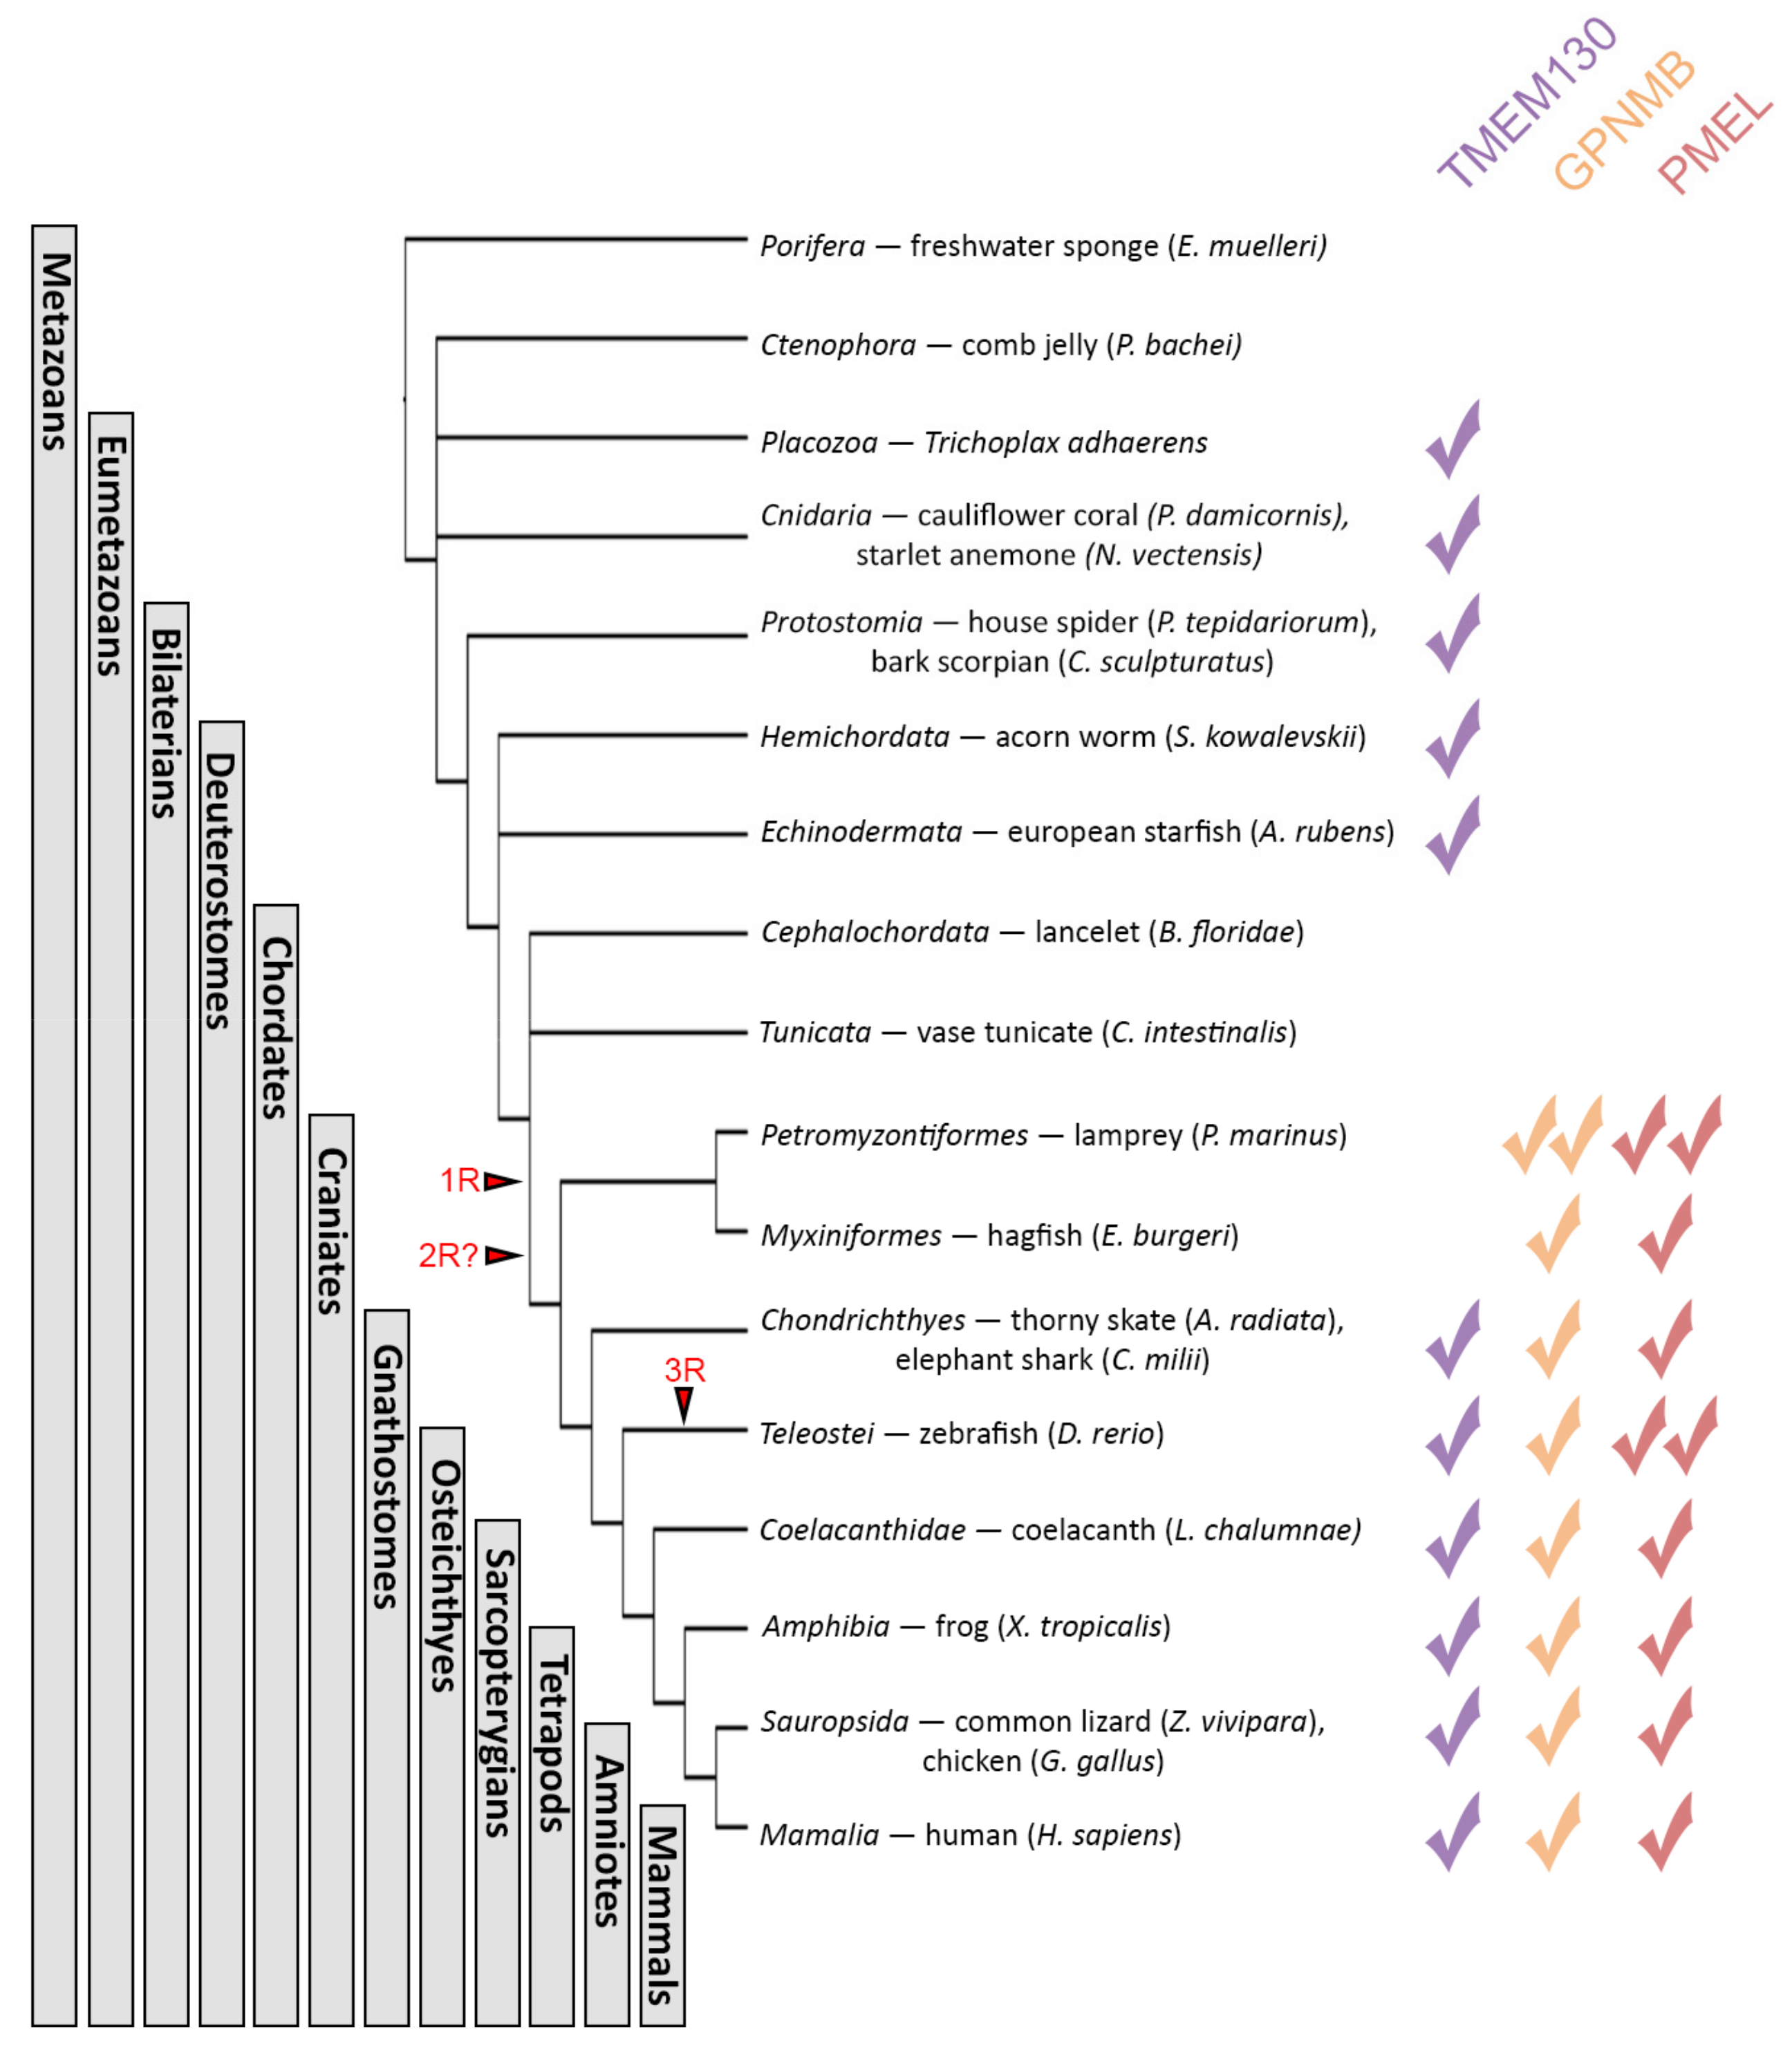
3.3. The PKAT Family Genes Are Distantly Related Paralogs and TMEM130 Represents the Most Ancient Homolog

The conservation of the domain architecture between all three PKAT members suggests that these genes are either related by descent (homologs) or arose via convergent evolution. To investigate if there is support for homology, we first investigated when each gene arose. Using the human PKD domains, we can identify hundreds of potential homologs from the ENSEMBL and NCBI databases using translated nucleotide (tblastn) searches. A selection of these hits has been used as representatives of major animal clades and was included in all subsequent analyses (Table S4, Supplementary Materials). The first evidence of putative tmem130 orthologs was discovered in Placozoa (T. adhaerens) and Cnidaria (P. damicornis and N. vectensis), but no regions of significant sequence identity can be detected in the early metazoan genome assemblies of Porifera (E. mulleri) and Ctenophora (P. bachei) [106,107]. In more derived species, including the Protostomia, Hemichordata and Echinodermata, tmem130 orthologs can also be identified (Figure 4); however, no gpnmb or pmel orthologs were identified in any of the invertebrate clades examined. These data suggest that tmem130 is the most ancient of the PKAT family genes and originated in early eumetazoans prior to the divergence of Cnidaria, Placozoa and Ctenophora.
Orthologs of all three PKAT family members were identified in cartilaginous fish (A. radiata and C. milli), and all subsequent Gnathostomes that were analyzed (Figure 4). Assuming the PKAT genes are homologs then this pattern suggests that two rounds of TMEM130 duplication followed by neo- or sub-functionalization [108,109] gave rise to vertebrate TMEM130, GPNMB and PMEL, with the final of the four paralogs being lost. This proposal is consistent with the two rounds of whole-genome duplications (1R and 2R, Figure 4) that occurred during early vertebrate evolution [110,111,112]. While the exact timing of the 2R duplication is still contested [113,114,115,116,117], the inheritance pattern of the PKAT gene family favors the 2R duplication occurring prior to the divergence of the Cyclostomata: gpnmb and pmel orthologs discovered in lamprey (P. marinus) and hagfish (E. burgeri). Intriguingly, no evidence for the tmem130 orthologs were discovered in the early Chordates lancelet (B. belcheri) or tunicate (C. intestinalis), nor in the Cyclostomes, suggesting an independent tmem130 gene loss in these species [118] or incomplete genome sequences that prevent orthologs from being identified. The tmem130 orthologs were also absent from several protostome species assemblies that we probed (e.g., C. elegans WBcel235 and Octopus vulgaris ASM395772v1), despite orthologs existing in other members of the clade. In conjunction with the absence of tmem130 in basal chordates, these data suggest that TMEM130 has been lost independently multiple times throughout animal evolution. Conversely, duplication of the PKAT genes was also apparent. Two gpnmb and two pmel orthologs were discovered in the lamprey, presumably via a segmental duplication similar to that which gave rise to the six lamprey hox clusters compared to the four found in most tetrapods [119]. Furthermore, zebrafish (and other teleosts) possess two recent PMEL inparalogs (pmela and pmelb) but only one copy of the other PKAT genes, likely because of the teleost-specific genome duplication event (3R, Figure 4) and subsequent rapid gene loss [120,121,122,123]. Taken together, these data support a paralogous relationship between the PKAT family genes and demonstrate that TMEM130 is the most ancient, eumetazoan gene from which the other two genes evolved. It has not escaped our notice that the emergence of GPNMB and PMEL also coincides with the evolution of the complex, camera-style vertebrate eye. Considering the ocular phenotypes that arise when these genes are mutated, it seems plausible that these two events are related.
To further interrogate the paralogous relationship of the PKAT genes, we next examined the intron–exon structure of the clade-representative genes. The exon length (bps) from the PKAT genomic DNA sequences was correlated with the functional domains that they encoded. When displayed graphically, several features were apparent that supported a shared origin (Figure 5). A signal peptide domain was detected in all the sequences examined and was encoded by the first two exons of the gene. In 27/31 genes, the majority of the SP was encoded within an initial, small (<110 bp) exon. The Kringle-like domain was encoded by two exons in 30/31 genes examined, and the exon lengths were conserved by ± 5% in most of the clade representatives: TMEM130 85 bp (9/11) and 203 bp (9/11), GPNMB 103 bp (7/10) and 206 bp (7/10) and PMEL 106 bp (6/10) and 206 bp (9/10). This analysis also supported an ancient homology, because the close similarities of the exon sizes between these three genes were consistent with them arising from a common origin.
Interestingly, this comparison of gene architectures revealed differences between the genes that speak to the evolution and divergence of the gene family. Firstly, the PKD domain was encoded by two exons in 9/11 of the TMEM130 genes examined but within a single exon in GPNMB and PMEL (Figure 5). This suggests that there was a loss of the intron from the PKD after the 1R genome duplication and prior to the divergence of GPNMB and PMEL as novel genes. Furthermore, there were multiple exons introduced upstream of the PKD in the GPNMB and PMEL genes that were absent from TMEM130. These exons (ex2-5) showed particularly high conservations ±5% of the exon length in both GPNMB (153 bp (7/10), 144 bp (6/10), 174 bp (6/10) and 159 bp (5/10)) and PMEL (135 bp (6/10), 147 bp (9/10), 141 bp (6/10) and 16 2bp (10/10)), respectively, supportive of a shared origin. In PMEL, these exons encoded for the N-terminal region and core amyloid fragment, which was critical for the formation of amyloid filaments [1]. It was therefore surprising that the exon length was conserved in this region in GPNMB that does not form amyloids; however, this apparent contradiction may be due to a lack of protein residue conservation between the two. Finally, the RPT domain, which is found only in PMEL orthologs, was encoded within either one or two exons in the species examined without any discernable patterns between the species.

3.4. TMEM130 Is a Sister Group of Both GPNMB and PMEL

With evidence of a paralogous relationship between the PKAT family genes, we next produced a Maximum Likelihood phylogenetic tree based on the whole-protein sequence alignment of the clade representative sequences. TMEM130 was the most ancient paralog detected (Figure 4) and was selected as an outgroup for tree construction, and the Trichoplax sequence was used as the most basal PKAT sequence that was identified. Within our model, there are three strongly supported monophyletic groups that correlated to TMEM130, GPNMB and PMEL (Figure 6). In our phylogram, TMEM130 formed a sister group with both GPNMB and PMEL.
Intriguingly, sea lamprey possesses four inparalogs: pmel, pmel-like, gpnmb and gpnmb-like but no putative tmem130 ortholog. These inparalogs cannot confidently be separated into the three clades and, instead, form a separate, paraphyletic group of their own (Figure 6, bracket). Unexpectedly, Gpnmb and Pmel-like are predicted to be more closely related to each other, whereas pmel and gpnmb-like are separately more closely related to each other, suggesting that these inparalogs may be incorrectly annotated. To test whether lamprey gpnmb-like (XP_032831262.1) and pmel-like (XP_032807179.1) were named incorrectly, we examined the chromosomal synteny of up to 100 genes upstream and downstream of the lamprey PKAT genes, making comparisons to the homologous chromosomal regions (paralogons) of both GPNMB and PMEL in three Gnathostomes: human, chicken and thorny skate (supplemental dataset). All four lamprey chromosomal regions have syntenic genes in common with Gnathostome GPNMB and PMEL; surprisingly, for each lamprey PKAT gene, there are more neighboring genes in common with the homologous Gnathostome GPNMB region than with the PMEL regions (Figure S1, Supplementary Materials). Lamprey gpnmb and pmel-like possess the strongest signals, each with a higher ratio of genes syntenic with Gnathostome GPNMB than with PMEL (47/3 = 15.7 and 33/6 = 5.5, respectively). Conversely, lamprey pmel and gpnmb-like have a lower ratio of genes syntenic with Gnathostome GPNMB than with PMEL (22/16 = 1.4 and 25/10 = 2.5, respectively). Since these analyses demonstrate that the lamprey paralogons have mixtures of homologous genes relative to both the GPNMB and PMEL chromosomal regions (Table S5, Supplementary Materials), it was therefore not possible to conclude what gene names ultimately should be applied to the lamprey inparalogs pmel-like and gpnmb-like via synteny analysis alone. However, Gpnmb-like does appear to possess an RPT domain (discussed in detail below), suggesting that it may be the canonical inparalog of pmel.

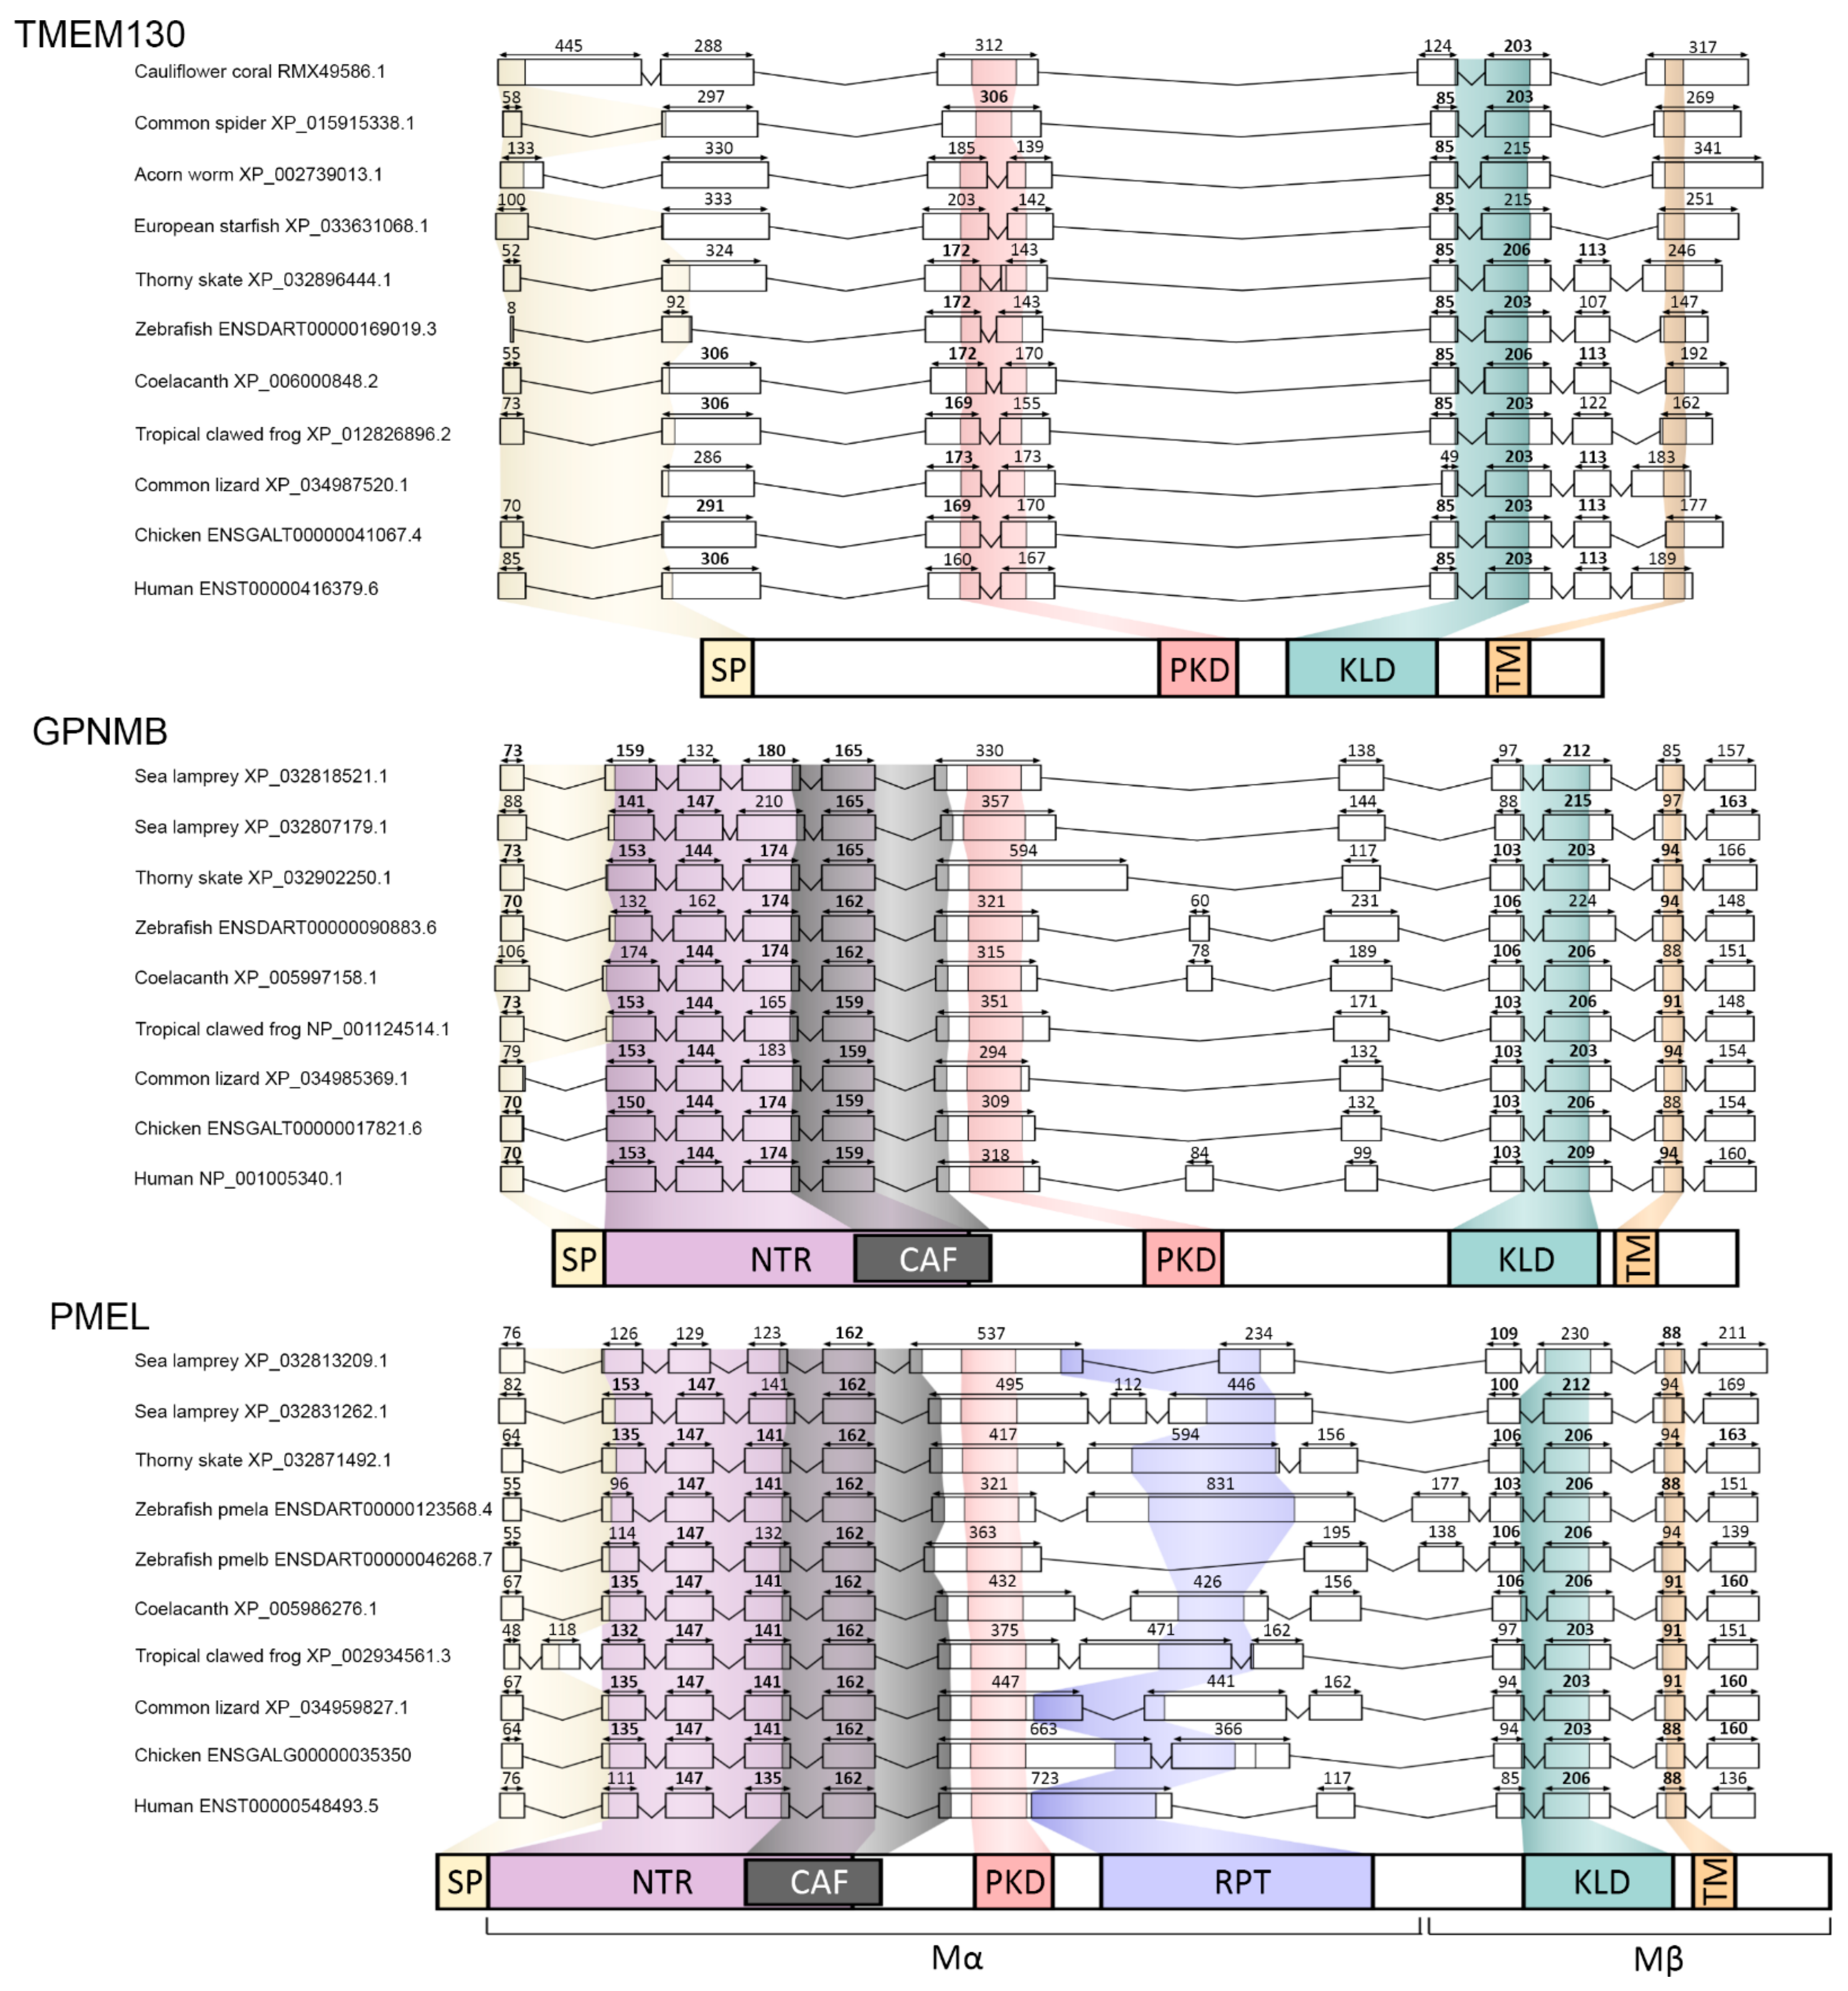
3.5. The Amino-Terminal Region of PKAT Proteins Show Conservation of a Signal Peptide and the Core Amyloid Fragment in PMEL and GPNMB

Despite the poor overall sequence conservation between the PKAT family proteins, several functional domains have been described as being well-conserved between PMEL and GPNMB [1]. The conservation of functional domains is suggestive of a common function within the cell; however, as discussed in the introduction, there has been a dearth of studies that demonstrate that the two proteins function within the same pathway. Furthermore, nothing has been published about the role of TMEM130 in the cell. To interrogate the conserved and divergent domains of the family, we performed multiple sequence alignments of clade-representative sequences. Firstly, the presumptive signal peptides (SPs) from our clade representatives display little sequence homology, as expected for a nonstructural determinant of the protein function [124]. Instead, we observed a stretch of eight or more amino acids with uncharged side chains, which were also rich in nonpolar side chains [125]. We determined that most of the outparalogs have a basic or acidic charged residue within 1–13 positions after the start methionine, followed by an easily detected SP of 7–33 residues long, before another basic or acidic residue appears (Figure 7A). The SP is cleaved from the mature protein in the ER once it has been translocated into the secretory pathway. Our alignment also revealed that there may be errors in the gene annotation of common lizard tmem130, where the start methionine of the sequence aligns downstream of the conserved position of SPs; correspondingly, its gene model lacks the “exon 1” that is annotated for all the other TMEM130s.
It has long been known that the N-terminal regions, following the SP of PMEL and GPNMB, share considerable sequence homology [1]. However, some 12 years after this discovery, the essential residues necessary for the formation of PMEL amyloids were uncovered via an unbiased alanine-scanning screen [126]. These residues overlap the PMEL N-terminal region and constitute the core amyloid fragment (CAF). By aligning the GPNMB and PMEL orthologs separately to create a GPNMB consensus and PMEL consensus, we demonstrated that there was considerable sequence identity conservation within these two regions (Figure 7B). Several key aromatic residues were shown to be critical for PMEL amyloid formation, and the mutagenesis of these residues prevented amyloid formation [126]. Interestingly all of these residues were biochemically conserved (but not identical) in GPNMB (Figure 7B, asterisks), despite no known amyloid-forming potential. The CAF sequence was not detectable in TMEM130, and there was no significant region of homology detected upstream of the PKD (data not shown).

3.6. Multiple Carboxy-Terminus Domains and Functional Motifs Are Conserved in the PKAT Family

The PKD domain is named after the polycystic kidney disease-associated gene PKD1 [127], which possesses 17 PKD domains (P98161—www.uniprot.org). PKD domains have been described in several membrane-anchored glycoproteins (e.g., PKD1, PKD1L1 and SORCS1-3) and are often expected to play a role in protein–protein/protein–matrix interactions [128]. By analyzing the PKAT proteins, we found that many of the residues were well-conserved with the archetypal PKD domain (Figure 8A, carets), including the core WDFGDGS motif [129]. However, we also determined that key residues in the PKAT PKD domain were distinct from other PKD domains i.e., the [LI][HY]DP motif in positions 244–247 (Figure 8A). These commonalities could be a useful motif for assigning newly discovered sequences to the family and in predicting which residues are most critical for protein structure and function. Only GPNMBs and PMELs have a conserved cysteine at the end of the PKD domain (position 301 in Figure 8A), which corresponds to PMEL Cys301 and has been shown to be critical for protein dimerization [100]. The presence of this cysteine in GPNMBs suggests that GPNMB also dimerizes in the same fashion as PMEL.
Next, we generated a sequence logo for the Kringle-like domains (KLDs) of all 27 clade-representative sequences and generated separate consensuses for each ortholog (Figure 8b). The six cysteine residues were perfectly conserved in both GPNMB and PMEL and highly conserved in the TMEM130 sequences (Figure S2, Supplementary Materials); the inter-amino acid spacing of the KLDs was also well-conserved in all outparalogs. The KLD cysteine residues were shown to be required PMEL dimerization [100], strengthening the evidence for GPNMB dimerization. The C-terminal to the KLD type 1 transmembrane domains of the outparalogs were composed primarily of nonpolar amino acid side chains (Figure 8C). There was poor sequence conservation overall for these residues, suggesting that the TM domain was conserved merely for membrane localization of the proteins and not for other functions.
Finally, all three family members have conservation of a C-terminal dileucine-based endocytic signal motif of [DE]XXXL[LI] sequence (Figure 8D) [130]. A notable exception is zebrafish Pmelb that lacks the two leucines. The endocytic signal is necessary to prevent the accumulation of PMEL at the plasma membrane [39], in turn allowing its internalization into the multivesicular bodies that become melanosomes. One could predict that zebrafish Pmelb might therefore be present only at the plasma membrane or be secreted and thus not accumulate in melanosomes. Alternatively, Pmelb could be recruited to melanosomes via some other process. Likewise, the dileucine signal in quail GPNMB/QNR-71 mediates its intracellular transport away from the cell membrane to localize the protein in endosomal/premelanosomal compartments [131]. TMEM130 in basal metazoans (coral and Trichoplax) also have poor conservation of the endocytic signal motif; this may be due to (1) the relatively low-quality genomic sequence/annotation of these gene entries, (2) that these organisms have different constraints on endocytosis or (3) different functions of TMEM130 in these species.
The strong conservation between the PKAT family members may be considered surprising, if one interprets the phenotypic effects as relatively minor in these loss of function mutations across a variety of species (Figure 1 and Figure 2; [40]). Pigmentation may be very important to survival, as it has impacts on camouflage, social interactions, protection from damaging electromagnetic radiation and mating. Moreover, any subtle deficits in vision or neuroprotection pathways would be selected against. Perhaps these and other potential functions provide enough selective pressure on this gene family to support strong purifying conservation. Alternatively, if mutations are likely to create a dominant and undesirable phenotype (akin to what is described with chicken pmel mutations), there would be a selection against them in a natural population [16,45]. Additionally, the PKAT family could provide some redundancy for an important developmental role that we have been unable to detect. Continuing studying into the functions of the PKAT family members—in particular, the more distantly related and ancient TMEM130 or concurrent mutations of all PKAT genes within an animal—may reveal why they have retained shared features over evolutionary time.

3.7. The PMEL RPT Domain Sequence Is Highly Divergent between Species but Considerably Conserved within Repeat Units of Most Species

The repeat domain (RPT) is a low complexity region unique to PMEL, and in mammals, it contains a variable number of proline/serine/threonine-rich imperfect repeats [103]. The RPT domain is controversial with respect to its role in PMEL amyloid formation, having originally been shown to be sufficient for fibril formation in vitro [102,132] but also dispensable for the formation of fibrils containing the N-terminal region and PKD domains [104,105]. Recent studies have instead demonstrated that the RPT domain has an accessory role in amyloid formation, at least in the few species studied to date. The PMEL RPT domain undergoes the heavy O-glycosylation of Thr/Ser residues that are required to sustain the sheet-like architecture of melanosomal amyloids. Deletion of the RPT domain or pharmacological inhibition of O-glycosylation causes amyloid collapse. Conversely, replacement of the RPT domain with a region of the MUC2 gene (which is also highly O-glycosylated) can rescue the fibril architecture [22].
To investigate the evolutionary relationship between orthologous PMEL RPT domains, we used RADAR predictions [97,133] and manually curated these to predict the RPT domain sequences of each PMEL protein (Figure 9 and Figures S3–S6, Supplementary Materials). Our results highlighted the high variability of the RPT domain in terms of the repeat unit length and repeat unit number between clade-representative organisms (Figure 9, c.f., thorny skate has seven 22-mer repeats vs. human has ten 13-mer repeats). These data also highlight the difficulty in accurately predicting the RPT domain sequence, since some organisms, like the common lizard, have a dearth of repeating residues per unit yet retain a similar chemical composition. Furthermore, even within a clade, there is much variability; for example, 11/11 mammalian proteins examined have 13-mer repeats, but these range from five repeat units in the Tasmanian devil to 16 units in sperm whale PMEL (Figure S3); in fish, the repeat unit length is highly variable, as exemplified by the difference between cod (11-mer length) and Pachon cavefish (26-mer length) (Figure S5).
The primary sequences of individual repeats are also drastically different between species. The human RPT contains two motifs that we noted are highly conserved amongst the repeats: GTT and PTXE; in contrast, the chicken RPT domain has a much more divergent TXXXTXX[DE] motif, despite also being a similar 12-mer-repeating unit. These striking differences in sequences are especially remarkable considering that the chicken RPT domain is sufficient to rescue the fibrilogenesis defects of human PMEL lacking a RPT domain, while the zebrafish RPT domain can provide a partial rescue [22]. These data suggest that, despite huge variations in RPT domain evolution, this region has a conserved protein function.
Despite the extremely poor sequence conservation between orthologous PMEL RPT domains, there are notable similarities. As discussed above, the repeat domain is highly O-glycosylated in vivo, and all of our clade representative sequences have threonine/serine residues evenly spaced to form a “[TS] ladder” (Figure 9, asterisks). The pharmacological inhibition of O-glycosylation using benzyl-2-acetamido-2-deoxy-α-d-galactopyranoside causes a collapsed PMEL amyloid [22], highlighting the importance of these residues. However, it is not currently known if the precise spacing of these residues is also important for their function. Furthermore, 7/10 of the RPT domains in fish lacked a clear [TS] ladder (Figure S6, Supplementary Materials). It would be interesting to determine if the PMEL amyloid structure of these species is more densely packed than those with clear [TS] ladders and whether the RPT domain of these fish can rescue the loss of the charged residues in PMEL fibril formation.
The glutamic acid residues in the Pmel RPT have been speculated to form hydrogen bonds similar to β-zippers of other amyloids in low-pH conditions [102]. However, the recently discovered accessory role of the PMEL RPT domain may instead implicate the regularly spaced, negatively charged residues with supporting the fibril arrangement of the amyloid. Evenly spaced glutamic acid/aspartic acid residues are a common feature of most (7/8) clade representative repeats (Figure 9), as well as most mammals (9/11) and fish (9/10) (Figures S3 and S6, Supplementary Materials). However, this pattern of [ED] ladders is rarely observed in bird (Figure S4) and reptile (Figure S5) species, even when negatively charged residues are present. More work is required to determine the functional significance of these negatively mammalian RPT domains.

3.8. A Strong Evolutionary Pressure for Uniform Repeat Unit Sequence, Length and E/D Ladder Conservation Is Evident in Teleost Fish

An interesting observation made during the analysis of the RPT domain sequences was that some species had near-perfect repeating protein sequences. For example, the RPT domain of zebrafish (Danio rerio), blunt-snouted clingfish (Gouania willdenowi) and Atlantic herring (Clupea harengus) each possess many repeat units that are almost perfectly identical in amino acid sequence within the species. However, comparing the near-perfect regions between species reveals that these closely related species underwent considerable sequence divergences (Figure 10A). We therefore examined these species in more detail at the amino acid and nucleotide levels to determine whether the evolutionary mechanisms could be deduced from the sequences. Firstly, the repeat unit numbers are different between all three species, suggesting an expansion or contraction of the tandem repeats after their divergence. Secondly, the lengths of the repeats are different between species, with a 22-mer in zebrafish, a 17-mer in clingfish and 23-mer repeat in herring. This variability cannot be explained at the DNA level by a frameshift event (since the motif V/A DAAA is common to all three species; a frameshift would shift the codon and disrupt this motif in subsequent repeats). Instead, each clingfish repeat lacks a total of 15 nucleotides per unit at the beginning of each repeat and a 3-bp deletion surrounded by a highly conserved GATGC motif upstream and GCT motif downstream that is found in 23/25 of the repeats (Figure 10B). For these nucleotides to have been deleted in clingfish (or inserted in herring and zebrafish), these mutations would have had to occur multiple times over (once per repeat unit). A more parsimonious explanation is therefore that these changes occurred after the divergence of these species from the last common ancestor but before there was expansion of the number of repeat units. Alternatively, it could be explained by very strong purifying/positive selection pressure to return to a uniform repeat unit length and consistent sequence. This area of the genome could also be particularly prone to DNA duplication, gene conversion and mobile elements of unequal recombination/crossing over events.
One might speculate that these near-perfect repeat units confer an evolutionary advantage to the species examined or that imperfect repeats confer an evolutionary disadvantage. However, a far greater number of sequences from individual animals than are currently available would be required to test this hypothesis. Despite this divergence, these three species did have regularly spaced D/E ladders within all of the repeats, separated by speciation events.

4. Conclusions

The PKAT family of genes are linked by a common ancestor and share a common domain architecture. However, the functional roles of PMEL and GPNMB have few commonalities, whereas practically nothing is known about the most ancient member, TMEM130. In this manuscript, we investigated the commonalities in the mutant phenotypes, evolutionary origin and functional domains between GPNMB and PMEL and analyzed the major difference: the RPT domain. Furthermore, we established that TMEM130 is well-suited to serve as an outgroup for future analyses comparing PMEL and GPNMB functions. We hope that this analysis assists with improving the understanding of the PKAT family and encourages further investigations into their evolution and diversification to perform such disparate functions.

Supplementary Materials

The following are available online: Figure S1: Gene synteny analysis of the pmel and gpnmb inparalogs in lamprey. Figure S2: Clade representative alignments of the tmem130 KLD. Figure S3: Cladogram of the mammalian RPT domains. Figure S4: Cladogram showing avian species Pmel RPT domains. Figure S5: Cladogram showing the amphibian and reptile Pmel RPT domains. Figure S6: Cladogram showing the fish Pmel RPT domain. Table S1: Percentage sequence similarity of the human PTHR11861 members at the cDNA level. Table S2: Percentage sequence similarity of the human PTHR11861 members at the protein level. Table S3: Functional domains predicted in human TMEM130 (ENST00000416379.6), GPNMB (ENST00000647578.1) and PMEL (ENST00000548493.5) by the InterPro server. Table S4: Clade-representative paralog sequences used. Table S5: Paralogous genes from humans, chickens or thorny skate that were found in neighboring lamprey gpnmb, pmel-like, pmel or gpnmb-like. Table S6: Additional PMEL paralog sequences used for the RPT domain predictions.

Author Contributions

Formal analysis, P.W.C., T.F., J.A.J. and E.D.H.; writing—original draft preparation, P.W.C., T.F., E.D.H. and W.T.A.; visualization, P.W.C., T.F., J.A.J. and E.D.H.; supervision, M.A.W. and W.T.A. and funding acquisition, M.A.W. and W.T.A. All authors contributed to writing—review and editing. All authors have read and agreed to the published version of the manuscript.

Funding

Operating funds to W.T.A. were from Alberta Innovates via their Alberta Prion Research Institute and to M.A.W. from Fighting Blindness Canada. E.D.H. was supported by the Alberta Graduate Excellence Scholarship, and J.A.J. was supported by the Undergraduate Research Initiative.

Institutional Review Board Statement

Zebrafish use was approved by the Animal Care and Use Committee at the University of Alberta (protocol AUP00000077, approved and renewed continuously from 2015 until time of writing in 2021) under the auspices of the Canadian Council on Animal Care.

Data Availability Statement

Data is contained within the article or Supplementary Material.

Acknowledgments

The authors would like to thank Nicole C. L. Noel and Casey Carlisle for critical reading of this manuscript and Yan-Yin Wang for the translation of reference [66].

Conflicts of Interest

The authors declare no conflict of interest. The funders had no role in the design of the study; in the collection, analyses or interpretation of the data; in the writing of the manuscript or in the decision to publish the results.

Sample Availability

Zebrafish mutants are available from the authors (W.T.A.) for supply to qualified requestors.

References

  1. Theos, A.C.; Truschel, S.T.; Raposo, G.; Marks, M.S. The Silver locus product Pmel17/gp100/Silv/ME20: Controversial in name and in function. Pigment Cell Res. 2005, 18, 322–336. [Google Scholar] [CrossRef] [Green Version]
  2. Weterman, M.A.J.; Ajubi, N.; Vandinter, I.M.R.; Degen, W.G.J.; Vanmuijen, G.N.P.; Ruiter, D.J.; Bloemers, H.P.J. NMB, a novel gene, is expressed in low-metastatic human-melanoma cell-lines and xenografts. Int. J. Cancer 1995, 60, 73–81. [Google Scholar] [CrossRef] [PubMed] [Green Version]
  3. Onaga, M.; Ido, A.; Hasuike, S.; Uto, H.; Moriuchi, A.; Nagata, K.; Hori, T.; Hayash, K.; Tsubouchi, H. Osteoactivin expressed during cirrhosis development in rats fed a choline-deficient, L-amino acid-defined diet, accelerates motility of hepatoma cells. J. Hepatol. 2003, 39, 779–785. [Google Scholar] [CrossRef]
  4. Rose, A.A.N.; Pepin, F.; Russo, C.; Abou Khalil, J.E.; Hallett, M.; Siegell, P.M. Osteoactivin promotes breast cancer metastasis to bone. Mol. Cancer Res. 2007, 5, 1001–1014. [Google Scholar] [CrossRef] [PubMed] [Green Version]
  5. Wagner, S.N.; Wagner, C.; Schultewolter, T.; Goos, M. Analysis of Pmel17/gp100 expression in primary human tissue specimens: Implications for melanoma immuno- and gene-therapy. Cancer Immunol. Immunother. 1997, 44, 239–247. [Google Scholar] [CrossRef]
  6. Nawrath, M.; Pavlovic, J.; Dummet, R.; Schultz, J.; Strack, B.; Heinrich, J.; Moelling, K. Reduced melanoma tumor formation in mice immunized with DNA expressing the melanoma-specific antigen gp100/pmel17. Leukemia 1999, 13, S48–S51. [Google Scholar] [CrossRef]
  7. John, S.W.M.; Smith, R.S.; Savinova, O.V.; Hawes, N.L.; Chang, B.; Turnbull, D.; Davisson, M.; Roderick, T.H.; Heckenlively, J.R. Essential iris atrophy, pigment dispersion, and glaucoma in DBA/2J mice. Investig. Ophthalmol. Vis. Sci. 1998, 39, 951–962. [Google Scholar]
  8. Anderson, M.G.; Smith, R.S.; Hawes, N.L.; Zabaleta, A.; Chang, B.; Wiggs, J.L.; John, S.W.M. Mutations in genes encoding melanosomal proteins cause pigmentary glaucoma in DBA/2J mice. Nat. Genet. 2002, 30, 81–85. [Google Scholar] [CrossRef]
  9. Lahola-Chomiak, A.A.; Footz, T.; Nguyen-Phuoc, K.; Neil, G.J.; Fan, B.J.; Allen, K.F.; Greenfield, D.S.; Parrish, R.K.; Linkroum, K.; Pasquale, L.R.; et al. Non-Synonymous variants in premelanosome protein (PMEL) cause ocular pigment dispersion and pigmentary glaucoma. Hum. Mol. Genet. 2019, 28, 1298–1311. [Google Scholar] [CrossRef]
  10. Zhu, S.C.; Wuolikainen, A.; Wu, J.F.; Ohman, A.; Wingsle, G.; Moritz, T.; Andersen, P.M.; Forsgren, L.; Trupp, M. Targeted Multiple Reaction Monitoring Analysis of CSF Identifies UCHL1 and GPNMB as Candidate Biomarkers for ALS. J. Mol. Neurosci. 2019, 69, 643–657. [Google Scholar] [CrossRef] [Green Version]
  11. Deckl, P.; Weydt, P.; Thal, D.R.; Weishaupt, J.H.; Ludolph, A.C.; Otto, M. Proteomics in cerebrospinal fluid and spinal cord suggests UCHL1, MAP2 and GPNMB as biomarkers and underpins importance of transcriptional pathways in amyotrophic lateral sclerosis. Acta Neuropathol. 2020, 139, 119–134. [Google Scholar] [CrossRef]
  12. Pihlstrom, L.; Axelsson, G.; Bjornara, K.A.; Dizdar, N.; Fardell, C.; Forsgren, L.; Holmberg, B.; Larsen, J.P.; Linder, J.; Nissbrandt, H.; et al. Supportive evidence for 11 loci from genome-wide association studies in Parkinson’s disease. Neurobiol. Aging 2013, 34, 1708.e7–1708.e13. [Google Scholar] [CrossRef] [Green Version]
  13. Dean, D.N.; Lee, J.C. Defining an amyloid link Between Parkinson’s disease and melanoma. Proc. Natl. Acad. Sci. USA 2020, 117, 22671–22673. [Google Scholar] [CrossRef]
  14. Haraszti, T.; Trantow, C.M.; Hedberg-Buenz, A.; Grunze, M.; Anderson, M.G. Spectral analysis by XANES reveals that GPNMB influences the chemical composition of intact melanosomes. Pigment Cell Melanoma Res. 2011, 24, 187–196. [Google Scholar] [CrossRef] [PubMed] [Green Version]
  15. Kwon, B.S.; Chintamaneni, C.; Kozak, C.A.; Copeland, N.G.; Gilbert, D.J.; Jenkins, N.; Barton, D.; Francke, U.; Kobayashi, Y.; Kim, K.K. A Melanocyte-Specific Gene, Pmel-17, Maps Near The Silver Coat Color Locus On Mouse Chromosome-10 And Is In A Syntenic Region On Human Chromosome-12. Proc. Natl. Acad. Sci. USA 1991, 88, 9228–9232. [Google Scholar] [CrossRef] [Green Version]
  16. Kerje, S.; Sharma, P.; Gunnarsson, U.; Kim, H.; Bagchi, S.; Fredriksson, R.; Schutz, K.; Jensen, P.; von Heijne, G.; Okimoto, R.; et al. The Dominant white, Dun and Smoky color variants in chicken are associated with insertion/deletion polymorphisms in the PMEL17 gene. Genetics 2004, 168, 1507–1518. [Google Scholar] [CrossRef] [PubMed] [Green Version]
  17. Brunberg, E.; Andersson, L.; Cothran, G.; Sandberg, K.; Mikko, S.; Lindgren, G. A missense mutation in PMEL17 is associated with the Silver coat color in the horse. BMC Genet. 2006, 7, 46. [Google Scholar] [CrossRef] [PubMed]
  18. Yang, C.F.; Lin, S.P.; Chiang, C.P.; Wu, Y.H.; H’ng, W.S.; Chang, C.P.; Chen, Y.T.; Wu, J.Y. Loss of GPNMB Causes Autosomal-Recessive Amyloidosis Cutis Dyschromica in Humans. Am. J. Hum. Genet. 2018, 102, 219–232. [Google Scholar] [CrossRef] [Green Version]
  19. Biswas, K.B.; Takahashi, A.; Mizutani, Y.; Takayama, S.; Ishitsuka, A.; Yang, L.L.; Yang, F.; Iddamalgoda, A.; Katayama, I.; Inoue, S. GPNMB is expressed in human epidermal keratinocytes but disappears in the vitiligo lesional skin. Sci. Rep. 2020, 10, 4930. [Google Scholar] [CrossRef]
  20. Fowler, D.M.; Koulov, A.V.; Alory-Jost, C.; Marks, M.S.; Balch, W.E.; Kelly, J.W. Functional amyloid formation within mammalian tissue. PLoS Biol. 2006, 4, e6. [Google Scholar] [CrossRef]
  21. McGlinchey, R.P.; Shewmaker, F.; McPhie, P.; Monterroso, B.; Thurber, K.; Wickner, R.B. The repeat domain of the melanosome fibril protein Pmel17 forms the amyloid core promoting melanin synthesis. Proc. Natl. Acad. Sci. USA 2009, 106, 13731–13736. [Google Scholar] [CrossRef] [PubMed] [Green Version]
  22. Graham, M.; Tzika, A.C.; Mitchell, S.M.; Liu, X.R.; Leonhardt, R.M. Repeat domain-associated O-glycans govern PMEL fibrillar sheet architecture. Sci. Rep. 2019, 9, 6101. [Google Scholar] [CrossRef] [PubMed] [Green Version]
  23. Valencia, J.C.; Rouzaud, F.; Julien, S.; Chen, K.G.; Passeron, T.; Yamaguchi, Y.; Abu-Asab, M.; Tsokos, M.; Costin, G.E.; Yamaguchi, H.; et al. Sialylated core 1 O-glycans influence the sorting of Pmel17/gp100 and determine its capacity to form fibrils. J. Biol. Chem. 2007, 282, 11266–11280. [Google Scholar] [CrossRef] [PubMed] [Green Version]
  24. Harper, D.C.; Theos, A.C.; Herman, K.E.; Tenza, D.; Raposo, G.; Marks, M.S. Premelanosome amyloid-like fibrils are composed of only Golgi-processed forms of Pmel17 that have been proteolytically processed in Endosomes. J. Biol. Chem. 2008, 283, 2307–2322. [Google Scholar] [CrossRef] [Green Version]
  25. Berson, J.F.; Harper, D.C.; Tenza, D.; Raposo, G.; Marks, M.S. Pmel17 initiates premelanosome morphogenesis within multivesicular bodies. Mol. Biol. Cell 2001, 12, 3451–3464. [Google Scholar] [CrossRef] [PubMed] [Green Version]
  26. Kummer, M.P.; Maruyama, H.; Huelsmann, C.; Baches, S.; Weggen, S.; Koo, E.H. Formation of Pmel17 Amyloid Is Regulated by Juxtamembrane Metalloproteinase Cleavage, and the Resulting C-terminal Fragment Is a Substrate for gamma-Secretase. J. Biol. Chem. 2009, 284, 2296–2306. [Google Scholar] [CrossRef] [Green Version]
  27. Kawaguchi, M.; Hozumi, Y.; Suzuki, T. ADAM protease inhibitors reduce melanogenesis by regulating PMEL17 processing in human melanocytes. J. Dermatol. Sci. 2015, 78, 133–142. [Google Scholar] [CrossRef]
  28. Rochin, L.; Hurbain, I.; Serneels, L.; Fort, C.; Watt, B.; Leblanc, P.; Marks, M.S.; De Strooper, B.; Raposo, G.; van Niel, G. BACE2 processes PMEL to form the melanosome amyloid matrix in pigment cells. Proc. Natl. Acad. Sci. USA 2013, 110, 10658–10663. [Google Scholar] [CrossRef] [Green Version]
  29. Shimshek, D.R.; Jacobson, L.H.; Kolly, C.; Zamurovic, N.; Balavenkatraman, K.K.; Morawiec, L.; Kreutzer, R.; Schelle, J.; Jucker, M.; Bertschi, B.; et al. Pharmacological BACE1 and BACE2 inhibition induces hair depigmentation by inhibiting PMEL17 processing in mice. Sci. Rep. 2016, 6, 21917. [Google Scholar] [CrossRef]
  30. Berson, J.F.; Theos, A.C.; Harper, D.C.; Tenza, D.; Raposo, G.; Marks, M.S. Proprotein convertase cleavage liberates a fibrillogenic fragment of a resident glycoprotein to initiate melanosome biogenesis. J. Cell Biol. 2003, 161, 521–533. [Google Scholar] [CrossRef] [Green Version]
  31. Kobayashi, T.; Urabe, K.; Orlow, S.J.; Higashi, K.; Imokawa, G.; Kwon, B.S.; Potterf, B.; Hearing, V.J. The Pmel-17 Silver Locus Protein—Characterization And Investigation Of Its Melanogenic Function. J. Biol. Chem. 1994, 269, 29198–29205. [Google Scholar] [CrossRef]
  32. Lee, Z.H.; Hou, L.; Moellmann, G.; Kuklinska, E.; Antol, K.; Fraser, M.; Halaban, R.; Kwon, B.S. Characterization and subcellular localization of human Pmel 17 silver, a 100-kDa (pre)melanosomal membrane protein associated with 5,6,-dihydroxyindole-2-carboxylic acid (DHICA) converting activity. J. Investig. Dermatol. 1996, 106, 605–610. [Google Scholar] [CrossRef] [PubMed] [Green Version]
  33. Hurbain, I.; Geerts, W.J.C.; Boudier, T.; Marco, S.; Verkleij, A.J.; Marks, M.S.; Raposo, G. Electron tomography of early melanosomes: Implications for melanogenesis and the generation of fibrillar amyloid sheets. Proc. Natl. Acad. Sci. USA 2008, 105, 19726–19731. [Google Scholar] [CrossRef] [PubMed] [Green Version]
  34. Watt, B.; van Niel, G.; Raposo, G.; Marks, M.S. PMEL: A pigment cell-specific model for functional amyloid formation. Pigment Cell Melanoma Res. 2013, 26, 300–315. [Google Scholar] [CrossRef] [Green Version]
  35. Bissig, C.; Rochin, L.; van Niel, G. PMEL Amyloid Fibril Formation: The Bright Steps of Pigmentation. Int. J. Mol. Sci. 2016, 17, 1438. [Google Scholar] [CrossRef] [Green Version]
  36. Silvers, W.K. The Coat Colors of Mice: A Model. for Mammalian Gene Action and Interaction; Springer: New York, NY, USA, 1979. [Google Scholar] [CrossRef]
  37. Kwon, B.S.; Kim, K.K.; Halaban, R.; Pickard, R.T. Characterization of mouse PMEL-17 gene and silver locus. Pigment Cell Res. 1994, 7, 394–397. [Google Scholar] [CrossRef]
  38. Kwon, B.S.; Halaban, R.; Ponnazhagan, S.; Kim, K.; Chintamaneni, C.; Bennett, D.; Pickard, R.T. Mouse Silver Mutation Is Caused By A Single-Base Insertion In The Putative Cytoplasmic Domain Of Pmel-17. Nucleic Acids Res. 1995, 23, 154–158. [Google Scholar] [CrossRef] [Green Version]
  39. Theos, A.C.; Berson, J.F.; Theos, S.C.; Herman, K.E.; Harper, D.C.; Tenza, D.; Sviderskaya, E.V.; Lamoreux, M.L.; Bennett, D.C.; Raposo, G.; et al. Dual loss of ER export and endocytic signals with altered melanosome morphology in the silver mutation of Pmel17. Mol. Biol. Cell 2006, 17, 3598–3612. [Google Scholar] [CrossRef] [Green Version]
  40. Hellstrom, A.R.; Watt, B.; Fard, S.S.; Tenza, D.; Mannstrom, P.; Narfstrom, K.; Ekesten, B.; Ito, S.; Wakamatsu, K.; Larsson, J.; et al. Inactivation of Pmel Alters Melanosome Shape But Has Only a Subtle Effect on Visible Pigmentation. PLoS Genet. 2011, 7, e1002285. [Google Scholar] [CrossRef] [Green Version]
  41. Schonthaler, H.B.; Lampert, J.M.; von Lintig, J.; Schwarz, H.; Geisler, R.; Neuhauss, S.C.F. A mutation in the silver gene leads to defects in melanosome biogenesis and alterations in the visual system in the zebrafish mutant fading vision. Dev. Biol. 2005, 284, 421–436. [Google Scholar] [CrossRef] [Green Version]
  42. Ishishita, S.; Takahashi, M.; Yamaguchi, K.; Kinoshita, K.; Nakano, M.; Nunome, M.; Kitahara, S.; Tatsumoto, S.; Go, Y.; Shigenobu, S.; et al. Nonsense mutation in PMEL is associated with yellowish plumage colour phenotype in Japanese quail. Sci. Rep. 2018, 8, 16732. [Google Scholar] [CrossRef] [PubMed]
  43. Karlsson, A.C.; Kerje, S.; Hallbook, F.; Jensen, P. The Dominant white mutation in the PMEL17 gene does not cause visual impairment in chickens. Vet. Ophthalmol. 2009, 12, 292–298. [Google Scholar] [CrossRef] [PubMed]
  44. Kuliawat, R.; Santambrogio, L. A mutation within the transmembrane domain of melanosomal protein Silver (Pmel17) changes lumenal fragment interactions. Eur. J. Cell Biol. 2009, 88, 653–667. [Google Scholar] [CrossRef] [PubMed] [Green Version]
  45. Watt, B.; Tenza, D.; Lemmon, M.A.; Kerje, S.; Raposo, G.; Andersson, L.; Marks, M.S. Mutations in or near the Transmembrane Domain Alter PMEL Amyloid Formation from Functional to Pathogenic. PLoS Genet. 2011, 7, e1002286. [Google Scholar] [CrossRef] [Green Version]
  46. Komaromy, A.M.; Rowlan, J.S.; La Croix, N.C.; Mangan, B.G. Equine Multiple Congenital Ocular Anomalies (MCOA) syndrome in PMEL17 (Silver) mutant ponies: Five cases. Vet. Ophthalmol. 2011, 14, 313–320. [Google Scholar] [CrossRef]
  47. Andersson, L.S.; Wilbe, M.; Viluma, A.; Cothran, G.; Ekesten, B.; Ewart, S.; Lindgren, G. Equine Multiple Congenital Ocular Anomalies and Silver Coat Colour Result from the Pleiotropic Effects of Mutant PMEL. PLoS ONE 2013, 8, e75639. [Google Scholar] [CrossRef] [Green Version]
  48. Segard, E.M.; Depecker, M.C.; Lang, J.; Gemperli, A.; Cadore, J.L. Ultrasonographic features of PMEL17 (Silver) mutant gene-associated multiple congenital ocular anomalies (MCOA) in Comtois and Rocky Mountain horses. Vet. Ophthalmol. 2013, 16, 429–435. [Google Scholar] [CrossRef]
  49. Clark, L.A.; Wahl, J.M.; Rees, C.A.; Murphy, K.E. Retrotransposon insertion in SILV is responsible for merle patterning of the domestic dog. Proc. Natl. Acad. Sci. USA 2006, 103, 1376–1381. [Google Scholar] [CrossRef] [Green Version]
  50. Ballif, B.C.; Ramirez, C.J.; Carl, C.R.; Sundin, K.; Krug, M.; Zahand, A.; Shaffer, L.G.; Flores-Smith, H. The PMEL Gene and Merle in the Domestic Dog: A Continuum of Insertion Lengths Leads to a Spectrum of Coat Color Variations in Australian Shepherds and Related Breeds. Cytogenet. Genome Res. 2018, 156, 22–34. [Google Scholar] [CrossRef]
  51. Murphy, S.C.; Evans, J.M.; Tsai, K.L.; Clarke, L.A. Length variations within the Merle retrotransposon of canine PMEL: Correlating genotype with phenotype. Mob. DNA 2018, 9, 26. [Google Scholar] [CrossRef]
  52. Kawahara, K.; Hirata, H.; Ohbuchi, K.; Nishi, K.; Maeda, A.; Kuniyasu, A.; Yamada, D.; Maeda, T.; Tsuji, A.; Sawada, M.; et al. The Novel Monoclonal Antibody 9F5 Reveals Expression of a Fragment of GPNMB/Osteoactivin Processed by Furin-like Protease(s) in a Subpopulation of Microglia in Neonatal Rat Brain. Glia 2016, 64, 1938–1961. [Google Scholar] [CrossRef] [PubMed]
  53. Abdelmagid, S.M.; Barbe, M.F.; Rico, M.C.; Salihoglu, S.; Arango-Hisijara, I.; Selim, A.H.; Anderson, M.G.; Owen, T.A.; Popoff, S.N.; Safadi, F.F. Osteoactivin, an anabolic factor that regulates osteoblast differentiation and function. Exp. Cell Res. 2008, 314, 2334–2351. [Google Scholar] [CrossRef] [PubMed]
  54. Hoashi, T.; Sato, S.; Yamaguchi, Y.; Passeron, T.; Tamaki, K.; Hearing, V.J. Glycoprotein nonmetastatic melanoma protein b, a melanocytic cell marker, is a melanosome-specific and proteolytically released protein. Faseb J. 2010, 24, 1616–1629. [Google Scholar] [CrossRef] [Green Version]
  55. Rose, A.A.N.; Annis, M.G.; Dong, Z.F.; Pepin, F.; Hallett, M.; Park, M.; Siegel, P.M. ADAM10 Releases a Soluble Form of the GPNMB/Osteoactivin Extracellular Domain with Angiogenic Properties. PLoS ONE 2010, 5, e12093. [Google Scholar] [CrossRef] [Green Version]
  56. Chi, A.; Valencia, J.C.; Hu, Z.Z.; Watabe, H.; Yamaguchi, H.; Mangini, N.J.; Huang, H.Z.; Canfield, V.A.; Cheng, K.C.; Yang, F.; et al. Proteomic and bioinformatic characterization of the biogenesis and function of melanosomes. J. Proteome Res. 2006, 5, 3135–3144. [Google Scholar] [CrossRef] [PubMed]
  57. Tomihari, M.; Hwang, S.H.; Chung, J.S.; Cruz, P.D.; Ariizumi, K. Gpnmb is a melanosome-associated glycoprotein that contributes to melanocyte/keratinocyte adhesion in a RGD-dependent fashion. Exp. Dermatol. 2009, 18, 586–595. [Google Scholar] [CrossRef] [PubMed] [Green Version]
  58. Ripoll, V.M.; Meadows, N.A.; Raggatt, L.J.; Chang, M.K.; Pettit, A.R.; Cassady, A.I.; Hume, D.A. Microphthalmia transcription factor regulates the expression of the novel osteoclast factor GPNMB. Gene 2008, 413, 32–41. [Google Scholar] [CrossRef] [Green Version]
  59. Loftus, S.K.; Antonellis, A.; Matera, I.; Renaud, G.; Baxter, L.L.; Reid, D.; Wolfsberg, T.G.; Chen, Y.D.; Wang, C.W.; Prasad, M.K.; et al. Gpnmb is a melanoblast-expressed, MITF-dependent gene. Pigment Cell Melanoma Res. 2009, 22, 99–110. [Google Scholar] [CrossRef] [PubMed] [Green Version]
  60. Zhang, P.; Liu, W.; Yuan, X.Y.; Li, D.G.; Gu, W.J.; Gao, T.W. Endothelin-1 enhances the melanogenesis via MITF-GPNMB pathway. Bmb Rep. 2013, 46, 364–369. [Google Scholar] [CrossRef] [Green Version]
  61. Gutknecht, M.; Geiger, J.; Joas, S.; Dorfel, D.; Salih, H.R.; Muller, M.R.; Grunebach, F.; Rittig, S.M. The transcription factor MITF is a critical regulator of GPNMB expression in dendritic cells. Cell Commun. Signal. 2015, 13, 19. [Google Scholar] [CrossRef] [Green Version]
  62. Theos, A.C.; Watt, B.; Harper, D.C.; Janczura, K.J.; Theos, S.C.; Herman, K.E.; Marks, M.S. The PKD domain distinguishes the trafficking and amyloidogenic properties of the pigment cell protein PMEL and its homologue GPNMB. Pigment Cell Melanoma Res. 2013, 26, 470–486. [Google Scholar] [CrossRef] [Green Version]
  63. Rahman, O.U.; Kim, J.; Mahon, C.; Jelani, M.; Kang, C. Two missense mutations in GPNMB cause autosomal recessive amyloidosis cutis dyschromica in the consanguineous pakistani families. Genes Genom. 2021, 43, 471–478. [Google Scholar] [CrossRef]
  64. Onoufriadis, A.; Hsu, C.K.; Eide, C.R.; Nanda, A.; Orchard, G.E.; Tomita, K.; Sheriff, A.; Scott, W.; Tierney, C.; Lee, J.Y.W.; et al. Semidominant GPNMB Mutations in Amyloidosis Cutis Dyschromica. J. Investig. Dermatol. 2019, 139, 2550. [Google Scholar] [CrossRef] [PubMed]
  65. Chiu, F.P.C.; Wessagowit, V.; Cakmak, M.F.; Doolan, B.J.; Kootiratrakarn, T.; Chaowalit, P.; Bunnag, T.; Simpson, M.A.; McGrath, J.A.; Onoufriadis, A. Molecular basis and inheritance patterns of amyloidosis cutis dyschromica. Clin. Exp. Dermatol. 2020, 45, 650–653. [Google Scholar] [CrossRef]
  66. Sha, Y.; Li, L. Amyloidosis cutis dyschromica due to homozygous variants of the GPNMB gene in a Chinese pedigree. Chin. J. Med. Genet. 2021, 38, 123–126. [Google Scholar] [CrossRef]
  67. Owen, T.A.; Smock, S.L.; Prakash, P.; Pinder, L.; Brees, D.; Krull, D.; Castleberry, T.A.; Clancy, Y.C.; Marks, S.C.; Safadi, F.F.; et al. Identification and characterization of the genes encoding human and mouse osteoactivin. Crit. Rev. Eukaryot. Gene Expr. 2003, 13, 205–220. [Google Scholar] [CrossRef]
  68. Huang, J.J.; Ma, W.J.; Yokoyama, S. Expression and immunolocalization of Gpnmb, a glioma-associated glycoprotein, in normal and inflamed central nervous systems of adult rats. Brain Behav. 2012, 2, 85–96. [Google Scholar] [CrossRef]
  69. Shi, F.Y.; Duan, S.Y.; Cui, J.H.; Yan, X.R.; Li, H.M.; Wang, Y.J.; Chen, F.L.; Zhang, L.H.; Liu, J.; Xie, X. Induction of Matrix Metalloproteinase-3 (MMP-3) Expression in the Microglia by Lipopolysaccharide (LPS) via Upregulation of Glycoprotein Nonmetastatic Melanoma B (GPNMB) Expression. J. Mol. Neurosci. 2014, 54, 234–242. [Google Scholar] [CrossRef] [PubMed]
  70. Murata, K.; Yoshino, Y.; Tsuruma, K.; Moriguchi, S.; Oyagi, A.; Tanaka, H.; Ishisaka, M.; Shimazawa, M.; Fukunaga, K.; Hara, H. The extracellular fragment of GPNMB (Glycoprotein nonmelanosoma protein B, osteoactivin) improves memory and increases hippocampal GluA1 levels in mice. J. Neurochem. 2015, 132, 583–594. [Google Scholar] [CrossRef]
  71. Ripoll, V.M.; Irvine, K.M.; Ravasi, T.; Sweet, M.J.; Hume, D.A. Gpnmb is induced in macrophages by IFN-gamma and lipopolysaccharide and acts as a feedback regulator of proinflammatory responses. J. Immunol. 2007, 178, 6557–6566. [Google Scholar] [CrossRef] [Green Version]
  72. Zhou, L.T.; Zhuo, H.; Ouyang, H.Y.; Liu, Y.X.; Yuan, F.; Sun, L.; Liu, F.Y.; Liu, H. Glycoprotein non-metastatic melanoma protein b (Gpnmb) is highly expressed in macrophages of acute injured kidney and promotes M2 macrophages polarization. Cell. Immunol. 2017, 316, 53–60. [Google Scholar] [CrossRef]
  73. Mo, J.S.; Anderson, M.G.; Gregory, M.; Smith, R.S.; Savinova, O.V.; Serreze, D.V.; Ksander, B.R.; Streilein, J.W.; John, S.W.M. By altering ocular immune privilege, bone marrow-derived cells pathogenically contribute to DBA/2J pigmentary glaucoma. J. Exp. Med. 2003, 197, 1335–1344. [Google Scholar] [CrossRef] [PubMed]
  74. Anderson, M.G.; Nair, K.S.; Amonoo, L.A.; Mehalow, A.; Trantow, C.M.; Masli, S.; John, S.W.M. Gpnmb(R150X) allele must be present in bone marrow derived cells to mediate DBA/2J glaucoma. BMC Genet. 2008, 9, 30. [Google Scholar] [CrossRef] [PubMed] [Green Version]
  75. Safadi, F.F.; Xu, J.; Smock, S.L.; Rico, M.C.; Owen, T.A.; Popoff, S.N. Cloning and characterization of osteoactivin, a novel cDNA expressed in osteoblasts. J. Cell. Biochem. 2002, 84, 12–26. [Google Scholar] [CrossRef]
  76. Sheng, M.H.C.; Wergedal, J.E.; Mohan, S.; Lau, K.H.W. Osteoactivin is a novel osteoclastic protein and plays a key role in osteoclast differentiation and activity. FEBS Lett. 2008, 582, 1451–1458. [Google Scholar] [CrossRef] [PubMed] [Green Version]
  77. Selim, A.A.; Abdelmagid, S.M.; Kanaan, R.A.; Smock, S.L.; Owen, T.A.; Popoff, S.N.; Safadi, F.F. Anti-osteoactivin antibody inhibits osteoblast differentiation and function in vitro. Crit. Rev. Eukaryot. Gene Expr. 2003, 13, 265–275. [Google Scholar] [CrossRef] [PubMed]
  78. Abdelmagid, S.M.; Barbe, M.F.; Arango-Hisijara, I.; Owen, T.A.; Popoff, S.N.; Safadi, F.F. Osteoactivin acts as downstream mediator of BMP-2 effects on osteoblast function. J. Cell. Physiol. 2007, 210, 26–37. [Google Scholar] [CrossRef] [PubMed]
  79. Selim, A.A.; Castaneda, J.L.; Owen, T.A.; Popoff, S.N.; Safadi, F.F. The role of osteoactivin-derived peptides in osteoblast differentiation. Med. Sci. Monit. 2007, 13, BR259–BR270. [Google Scholar]
  80. Arosarena, O.A.; Del Carpio-Cano, F.E.; Dela Cadena, R.A.; Rico, M.C.; Nwodim, E.; Safadi, F.F. Comparison of Bone Morphogenetic Protein-2 and Osteoactivin for Mesenchymal Cell Differentiation: Effects of Bolus and Continuous Administration. J. Cell. Physiol. 2011, 226, 2943–2952. [Google Scholar] [CrossRef] [Green Version]
  81. Ogawa, T.; Nikawa, T.; Furochi, H.; Kosyoji, M.; Hirasaka, K.; Suzue, N.; Sairyo, K.; Nakano, S.; Yamaoka, T.; Itakura, M.; et al. Osteoactivin upregulates expression of MMP-3 and MMP-9 in fibroblasts infiltrated into denervated skeletal muscle in mice. Am. J. Physiol. Cell Physiol. 2005, 289, C697–C707. [Google Scholar] [CrossRef]
  82. Abe, H.; Uto, H.; Takami, Y.; Takahama, Y.; Hasuike, S.; Kodama, M.; Nagata, K.; Moriuchi, A.; Numata, M.; Ido, A.; et al. Transgenic expression of osteoactivin in the liver attenuates hepatic fibrosis in rats. Biochem. Biophys. Res. Commun. 2007, 356, 610–615. [Google Scholar] [CrossRef]
  83. Sheng, M.H.C.; Wergedal, J.E.; Mohan, S.; Amoui, M.; Baylink, D.J.; Lau, K.H.W. Targeted Overexpression of Osteoactivin in Cells of Osteoclastic Lineage Promotes Osteoclastic Resorption and Bone Loss in Mice. PLoS ONE 2012, 7, e35280. [Google Scholar] [CrossRef] [Green Version]
  84. Tonogai, I.; Takahashi, M.; Yukata, K.; Sato, R.; Nikawa, T.; Yasui, N.; Sairyo, K. Osteoactivin attenuates skeletal muscle fibrosis after distraction osteogenesis by promoting extracellular matrix degradation/remodeling. J. Pediatr. Orthop. Part B 2015, 24, 162–169. [Google Scholar] [CrossRef]
  85. Arosarena, O.A.; Barr, E.W.; Thorpe, R.; Yankey, H.; Tarr, J.T.; Safadi, F.F. Osteoactivin regulates head and neck squamous cell carcinoma invasion by modulating matrix metalloproteases. J. Cell. Physiol. 2018, 233, 409–421. [Google Scholar] [CrossRef] [PubMed]
  86. Utsunomiya, K.; Owaki, K.; Okumura, Y.; Yano, M.; Oto, T.; Suzuki, E.; Tamura, S.; Abe, T.; Kohno, S.; Ohno, A.; et al. An Intracellular Fragment of Osteoactivin Formed by Ectodomain Shedding Trans located to the Nucleoplasm and Bound to RNA Binding Proteins. Biosci. Biotechnol. Biochem. 2012, 76, 2225–2229. [Google Scholar] [CrossRef] [Green Version]
  87. Furochi, H.; Tamura, S.; Mameoka, M.; Yamada, C.; Ogawa, T.; Hirasaka, K.; Okumura, Y.; Imagawa, T.; Oguri, S.; Ishidoh, K.; et al. Osteoactivin fragments produced by ectodomain shedding induce MMP-3 expression via ERK pathway in mouse NIH-3T3 fibroblasts. FEBS Lett. 2007, 581, 5743–5750. [Google Scholar] [CrossRef] [PubMed] [Green Version]
  88. Moussa, F.M.; Hisijara, I.A.; Sondag, G.R.; Scott, E.M.; Frara, N.; Abdelmagid, S.M.; Safadi, F.F. Osteoactivin Promotes Osteoblast Adhesion Through HSPG and alpha v beta 1 Integrin. J. Cell. Biochem. 2014, 115, 1243–1253. [Google Scholar] [CrossRef] [PubMed]
  89. Murthy, M.N.; Blauwendraat, C.; Guelfi, S.; Hardy, J.; Lewis, P.A.; Trabzuni, D.; UKBEC. Increased brain expression of GPNMB is associated with genome wide significant risk for Parkinson’s disease on chromosome 7p15.3. Neurogenetics 2017, 18, 121–133. [Google Scholar] [CrossRef] [Green Version]
  90. Moloney, E.B.; Moskites, A.; Ferrari, E.J.; Isacson, O.; Hallett, P.J. The glycoprotein GPNMB is selectively elevated in the substantia nigra of Parkinson’s disease patients and increases after lysosomal stress. Neurobiol. Dis. 2018, 120, 1–11. [Google Scholar] [CrossRef]
  91. Huttenrauch, M.; Ogorek, I.; Klafki, H.; Otto, M.; Stadelmann, C.; Weggen, S.; Wiltfang, J.; Wirths, O. Glycoprotein NMB: A novel Alzheimer’s disease associated marker expressed in a subset of activated microglia. Acta Neuropathol. Commun. 2018, 6, 108. [Google Scholar] [CrossRef] [Green Version]
  92. Budge, K.M.; Neal, M.L.; Richardson, J.R.; Safadi, F.F. Transgenic Overexpression of GPNMB Protects Against MPTP-Induced Neurodegeneration. Mol. Neurobiol. 2020, 57, 2920–2933. [Google Scholar] [CrossRef]
  93. Tanaka, H.; Shimazawa, M.; Kimura, M.; Takata, M.; Tsuruma, K.; Yamada, M.; Takahashi, H.; Hozumi, I.; Niwa, J.; Iguchi, Y.; et al. The potential of GPNMB as novel neuroprotective factor in amyotrophic lateral sclerosis. Sci. Rep. 2012, 2, 573. [Google Scholar] [CrossRef] [Green Version]
  94. Nagahara, Y.; Shimazawa, M.; Ohuchi, K.; Ito, J.; Takahashi, H.; Tsuruma, K.; Kakita, A.; Hara, H. GPNMB ameliorates mutant TDP-43-induced motor neuron cell death. J. Neurosci. Res. 2017, 95, 1647–1665. [Google Scholar] [CrossRef] [PubMed]
  95. Mitchell, A.L.; Attwood, T.K.; Babbitt, P.C.; Blum, M.; Bork, P.; Bridge, A.; Brown, S.D.; Chang, H.Y.; El-Gebali, S.; Fraser, M.I.; et al. InterPro in 2019: Improving coverage, classification and access to protein sequence annotations. Nucleic Acids Res. 2019, 47, D351–D360. [Google Scholar] [CrossRef] [PubMed] [Green Version]
  96. Altschul, S.F.; Gish, W.; Miller, W.; Myers, E.W.; Lipman, D.J. Basic local alignment search tool. J. Mol. Biol. 1990, 215, 403–410. [Google Scholar] [CrossRef]
  97. Heger, A.; Holm, L. Rapid automatic detection and alignment of repeats in protein sequences. Proteins-Struct. Funct. Genet. 2000, 41, 224–237. [Google Scholar] [CrossRef]
  98. Madeira, F.; Park, Y.M.; Lee, J.; Buso, N.; Gur, T.; Madhusoodanan, N.; Basutkar, P.; Tivey, A.R.N.; Potter, S.C.; Finn, R.D.; et al. The EMBL-EBI search and sequence analysis tools APIs in 2019. Nucleic Acids Res. 2019, 47, W636–W641. [Google Scholar] [CrossRef] [Green Version]
  99. Koonin, E.V. Orthologs, paralogs, and evolutionary genomics. Annu. Rev. Genet. 2005, 39, 309–338. [Google Scholar] [CrossRef] [Green Version]
  100. Ho, T.; Watt, B.; Spruce, L.A.; Seeholzer, S.H.; Marks, M.S. The Kringle-like Domain Facilitates Post-endoplasmic Reticulum Changes to Premelanosome Protein (PMEL) Oligomerization and Disulfide Bond Configuration and Promotes Amyloid Formation. J. Biol. Chem. 2016, 291, 3595–3612. [Google Scholar] [CrossRef] [Green Version]
  101. Xie, R.; Okita, Y.; Ichikawa, Y.; Fikry, M.A.; Dam, K.T.H.; Tran, S.T.P.; Kato, M. Role of the kringle-like domain in glycoprotein NMB for its tumorigenic potential. Cancer Sci. 2019, 110, 2237–2246. [Google Scholar] [CrossRef] [PubMed] [Green Version]
  102. McGlinchey, R.P.; Shewmaker, F.; Hu, K.N.; McPhie, P.; Tycko, R.; Wickner, R.B. Repeat Domains of Melanosome Matrix Protein Pmel17 Orthologs Form Amyloid Fibrils at the Acidic Melanosomal pH. J. Biol. Chem. 2011, 286, 8385–8393. [Google Scholar] [CrossRef] [PubMed] [Green Version]
  103. Hoashi, T.; Muller, J.; Vieira, W.D.; Rouzaud, F.; Kikuchi, K.; Tamaki, K.; Hearing, V.J. The repeat domain of the melanosomal matrix protein PMEL17/GP100 is required for the formation of organellar fibers. J. Biol. Chem. 2006, 281, 21198–21208. [Google Scholar] [CrossRef] [Green Version]
  104. Watt, B.; van Niel, G.; Fowler, D.M.; Hurbain, I.; Luk, K.C.; Stayrook, S.E.; Lemmon, M.A.; Raposo, G.; Shorter, J.; Kelly, J.W.; et al. N-terminal Domains Elicit Formation of Functional Pmel17 Amyloid Fibrils. J. Biol. Chem. 2009, 284, 35543–35555. [Google Scholar] [CrossRef] [PubMed] [Green Version]
  105. Leonhardt, R.M.; Vigneron, N.; Hee, J.S.; Graham, M.; Cresswella, P. Critical residues in the PMEL/Pmel17 N-terminus direct the hierarchical assembly of melanosomal fibrils. Mol. Biol. Cell 2013, 24, 964–981. [Google Scholar] [CrossRef]
  106. Kenny, N.J.; Francis, W.R.; Rivera-Vicens, R.E.; Juravel, K.; de Mendoza, A.; Diez-Vives, C.; Lister, R.; Bezares-Calderon, L.A.; Grombacher, L.; Roller, M.; et al. Tracing animal genomic evolution with the chromosomal-level assembly of the freshwater sponge Ephydatia muelleri. Nat. Commun. 2020, 11, 3676. [Google Scholar] [CrossRef]
  107. Moroz, L.L.; Kocot, K.M.; Citarella, M.R.; Dosung, S.; Norekian, T.P.; Povolotskaya, I.S.; Grigorenko, A.P.; Dailey, C.; Berezikov, E.; Buckley, K.M.; et al. The ctenophore genome and the evolutionary origins of neural systems. Nature 2014, 510, 109. [Google Scholar] [CrossRef]
  108. He, X.L.; Zhang, J.Z. Rapid subfunctionalization accompanied by prolonged and substantial neofunctionalization in duplicate gene evolution. Genetics 2005, 169, 1157–1164. [Google Scholar] [CrossRef] [Green Version]
  109. Lynch, M.; Force, A. The probability of duplicate gene preservation by subfunctionalization. Genetics 2000, 154, 459–473. [Google Scholar] [CrossRef]
  110. Holland, P.W.H.; Garciafernandez, J.; Williams, N.A.; Sidow, A. Gene Duplications And The Origins Of Vertebrate Development. Development 1994, 1994, 125–133. [Google Scholar] [CrossRef]
  111. Dehal, P.; Boore, J.L. Two rounds of whole genome duplication in the ancestral vertebrate. PLoS Biol. 2005, 3, e314. [Google Scholar] [CrossRef] [Green Version]
  112. Ohno, S. Evolution by Gene Duplication; Springer: Berlin, Germany, 1970. [Google Scholar]
  113. Putnam, N.H.; Butts, T.; Ferrier, D.E.K.; Furlong, R.F.; Hellsten, U.; Kawashima, T.; Robinson-Rechavi, M.; Shoguchi, E.; Terry, A.; Yu, J.K.; et al. The amphioxus genome and the evolution of the chordate karyotype. Nature 2008, 453, 1064–1071. [Google Scholar] [CrossRef] [PubMed] [Green Version]
  114. Smith, J.J.; Keinath, M.C. The sea lamprey meiotic map improves resolution of ancient vertebrate genome duplications. Genome Res. 2015, 25, 1081–1090. [Google Scholar] [CrossRef] [PubMed] [Green Version]
  115. Sacerdot, C.; Louis, A.; Bon, C.; Berthelot, C.; Crollius, H.R. Chromosome evolution at the origin of the ancestral vertebrate genome. Genome Biol. 2018, 19, 166. [Google Scholar] [CrossRef] [PubMed]
  116. Simakov, O.; Marletaz, F.; Yue, J.X.; O’Connell, B.; Jenkins, J.; Brandt, A.; Calef, R.; Tung, C.H.; Huang, T.K.; Schmutz, J.; et al. Deeply conserved synteny resolves early events in vertebrate evolution. Nat. Ecol. Evol. 2020, 4, 820. [Google Scholar] [CrossRef] [Green Version]
  117. Smith, J.J.; Kuraku, S.; Holt, C.; Sauka-Spengler, T.; Jiang, N.; Campbell, M.S.; Yandell, M.D.; Manousaki, T.; Meyer, A.; Bloom, O.E.; et al. Sequencing of the sea lamprey (Petromyzon marinus) genome provides insights into vertebrate evolution. Nat. Genet. 2013, 45, 415–421. [Google Scholar] [CrossRef] [PubMed]
  118. Albalat, R.; Canestro, C. Evolution by gene loss. Nat. Rev. Genet. 2016, 17, 379–391. [Google Scholar] [CrossRef] [PubMed]
  119. Mehta, T.K.; Ravi, V.; Yamasaki, S.; Lee, A.P.; Lian, M.M.; Tay, B.H.; Tohari, S.; Yanai, S.; Tay, A.; Brenner, S.; et al. Evidence for at least six Hox clusters in the Japanese lamprey (Lethenteron japonicum). Proc. Natl. Acad. Sci. USA 2013, 110, 16044–16049. [Google Scholar] [CrossRef] [Green Version]
  120. Jaillon, O.; Aury, J.M.; Brunet, F.; Petit, J.L.; Stange-Thomann, N.; Mauceli, E.; Bouneau, L.; Fischer, C.; Ozouf-Costaz, C.; Bernot, A.; et al. Genome duplication in the teleost fish Tetraodon nigroviridis reveals the early vertebrate proto-karyotype. Nature 2004, 431, 946–957. [Google Scholar] [CrossRef] [Green Version]
  121. Meyer, A.; Van de Peer, Y. From 2R to 3R: Evidence for a fish-specific genome duplication (FSGD). Bioessays 2005, 27, 937–945. [Google Scholar] [CrossRef] [Green Version]
  122. Inoue, J.; Sato, Y.; Sinclair, R.; Tsukamoto, K.; Nishida, M. Rapid genome reshaping by multiple-gene loss after whole-genome duplication in teleost fish suggested by mathematical modeling. Proc. Natl. Acad. Sci. USA 2015, 112, 14918–14923. [Google Scholar] [CrossRef] [Green Version]
  123. Pasquier, J.; Braasch, I.; Batzel, P.; Cabau, C.; Montfort, J.; Nguyen, T.; Jouanno, E.; Berthelot, C.; Klopp, C.; Journot, L.; et al. Evolution of gene expression after whole-genome duplication: New insights from the spotted gar genome. J. Exp. Zool. Part. B Mol. Dev. Evol. 2017, 328, 709–721. [Google Scholar] [CrossRef] [PubMed] [Green Version]
  124. Vonheijne, G. The Signal Peptide. J. Membr. Biol. 1990, 115, 195–201. [Google Scholar] [CrossRef] [PubMed]
  125. Duffaud, G.D.; Lehnhardt, S.K.; March, P.E.; Inouye, M. Structure And Function Of The Signal Peptide. Curr. Top. Membr. Transport. 1985, 24, 65–104. [Google Scholar]
  126. Hee, J.S.; Mitchell, S.M.; Liu, X.R.; Leonhardt, R.M. Melanosomal formation of PMEL core amyloid is driven by aromatic residues. Sci. Rep. 2017, 7, 44064. [Google Scholar] [CrossRef]
  127. Hughes, J.; Ward, C.J.; Peral, B.; Aspinwall, R.; Clark, K.; Sanmillan, J.L.; Gamble, V.; Harris, P.C. The Polycystic Kidney-Disease-1 (Pkd1) Gene Encodes A Novel Protein With Multiple Cell Recognition Domains. Nat. Genet. 1995, 10, 151–160. [Google Scholar] [CrossRef]
  128. Ibraghimov-Beskrovnaya, O.; Bukanov, N.O.; Donohue, L.C.; Dackowski, W.R.; Klinger, K.W.; Landes, G.M. Strong homophilic interactions of the Ig-like domains of polycystin-1,the protein product of an autosomal dominant polycystic kidney disease gene, PKD1. Hum. Mol. Genet. 2000, 9, 1641–1649. [Google Scholar] [CrossRef]
  129. Bycroft, M.; Bateman, A.; Clarke, J.; Hamill, S.J.; Sandford, R.; Thomas, R.L.; Chothia, C. The structure of a PKD domain from polycystin-1: Implications for polycystic kidney disease. EMBO J. 1999, 18, 297–305. [Google Scholar] [CrossRef] [PubMed] [Green Version]
  130. Bonifacino, J.S.; Traub, L.M. Signals for sorting of transmembrane proteins to endosomes and lysosomes. Annu. Rev. Biochem. 2003, 72, 395–447. [Google Scholar] [CrossRef] [Green Version]
  131. Le Borgne, R.; Planque, N.; Martin, P.; Dewitte, F.; Saule, S.; Hoflack, B. The AP-3-dependent targeting of the melanosomal glycoprotein QNR-71 requires a di-leucine-based sorting signal. J. Cell Sci. 2001, 114, 2831–2841. [Google Scholar] [CrossRef]
  132. Hoashi, T.; Muller, J.; Tamaki, K.; Ohara, K.; Hearing, V.J. The internal repeat domain of the melanosomal matrix protein PMEL17/GP100 is required for fibrillogenesis but not for intracellular trafficking. Pigment Cell Melanoma Res. 2008, 21, 303. [Google Scholar]
  133. Goujon, M.; McWilliam, H.; Li, W.Z.; Valentin, F.; Squizzato, S.; Paern, J.; Lopez, R. A new bioinformatics analysis tools framework at EMBL-EBI. Nucleic Acids Res. 2010, 38, W695–W699. [Google Scholar] [CrossRef] [PubMed]
Figure 1. Human and animal mutations in PMEL result in hypopigmentation and ocular pathology. (A) Protein domain model for human premelanosome protein (PMEL) ENST00000548493.5 is shown, with residue positions determined from the alignments presented in Figures 7–9. Symbols at the top of the schematic indicate the location of: (1) human variants associated with pigment dispersion syndrome/pigmentary glaucoma [9] (asterisks), (2) N-linked glycosylation sites (black dots) and (3) the serine-/threonine-rich region of the RPT domain that is modified with O-linked glycosylation (orange rectangle). Various enzyme cleavage sites are depicted by dotted vertical lines. (B) Selected animal pigmentation and/or ocular defect images are reproduced below the model with permission. All phenotypes are caused by a mutation of the respective PMEL ortholog (see Table 1). From top-left to bottom-right: Pmel-/- null mouse with a subtle dilution of coat and tail colors [40]; Silver Rocky Mountain Horse with cataracts and mitotic pupils, ectropion uvea, dyscoria, lens subluxation and a shiny white mane and tail, in conjunction with a slightly diluted body color with “silver” dapples [47]; coat color defects in merle (Mm) and double-merle (MM) Shetland Sheepdogs [49]; Japanese “L strain” quail with yellowish plumage [42] and pmelaua5022/ua5022 zebrafish with reduced global pigmentation and ocular anomalies that include enlarged anterior segments, microphthalmia and eyes that are more spherical in shape, suggestive of high intraocular pressure, a hallmark of glaucoma.
Molecules 26 03529 g001
Figure 2. Human and animal mutations in GPNMB result in hypopigmented lesions, amyloidosis cutis dyschromica and ocular pathology. (A) Schematic representation of human GPNMB (NP_001005340.1). Asterisks indicate the locations of variants that cause amyloidosis cutis dyschromica (ACD) [18,63,64,65,66]. Locations of N-linked glycosylation sites (black dots) and the cleavage site (dotted vertical line) are depicted. (B) ACD presents with hypopigmented lesions (right, from reference [18]). A wild-type murine iris compared to the iris pigment dispersion (arrowheads) of a Gpnmb-/- homozygote [8]. Images republished with permission.
Molecules 26 03529 g002
Figure 3. GPNMB, PMEL and TMEM130 form a family of related proteins with a homologous domain architecture. Schematic representation of the human GPNMB (ENST00000647578.1) and PMEL (ENST00000548493.5) proteins (A), and TMEM130 (ENST00000416379.6) (B) transmembrane proteins annotated with their predicted function domains. Each protein is represented by a segmented white box displaying the relative amino acid length: 588, 661 and 435 residues, respectively. Below the protein schematic, the InterPro Scan domain predictions are denoted by colored lines to represent the signal peptide (yellow), Ig-like fold (red), polycystic kidney disease domain (PKD, pink), non-cytoplasmic region (purple), transmembrane domain (orange) and cytoplasmic region (green). PMEL was predicted to possess a disordered (low complexity) region (blue). The homology of these sequences to GPNMB (dark grey), PMEL (black) and TMEM130 (light grey) was also flagged. The Kringle-like domain (KLD, dotted green line) was not detected by InterPro Scan but was identified by the sequence alignment. This order and arrangement of the functional domain is characteristic of the PKD- and KLD-Associated Transmembrane (PKAT) family.
Molecules 26 03529 g003
Figure 4. TMEM130 is the most ancient member of the PKAT family in the basal metazoa, with GPNMB and PMEL originating prior to the craniate radiation. Schematic representation of the major animal taxa and cladogram demonstrating their evolutionary relationship and where whole-genome duplication events occurred (1R, 2R and 3R). Check marks demonstrate which of the paralogous genes are found within the species inside these taxa. The presence of two check marks of the same colour indicates that two paralogs of that gene are found in that species.
Molecules 26 03529 g004
Figure 5. The intron-exon architecture supports a common ancestry for the PKAT family genes. Schematic representation of gene family orthologs showing exons (boxes, to scale) and separated by introns (lines, not to scale). The nucleotides coding for different protein domains are colour coded: signal peptide (yellow), N-terminal region (NTR; purple), core amyloid fragment (CAF; black) polycystic kidney domain (PKD; red), repeat domain (RPT; blue), kringle-like domain (KLD; green), transmembrane domain (TM; orange). Numbers above the exons denote exon length in basepairs, bold donates when exon lengths are shared between >3 orthologs (±5%).
Molecules 26 03529 g005
Figure 6. Phylogenetic tree representing the outparalog TMEM130, GPNMB and PMEL protein sequences separated by speciation events. Phylogeny was inferred by the Maximum Likelihood method and Whelan and Goldman + Frequency model. The BS ×1000 and percentage of trees in which the associated taxa clustered together are shown next to the branches. Branch lengths represent the substitutions per site.
Molecules 26 03529 g006
Figure 7. The N-terminal region of the PKAT paralogs shows conservation of a signal peptide in all family members and conservation of the core amyloid fragment in GPNMB. The domains are shown for human PMEL ENST00000548493.5, with residue positions shown, aligned to paralogous sequences from the representative species. The residues are color-coded for the polarity of their amino acid side chains (yellow, nonpolar; green, uncharged polar; red, acidic; blue, basic). (A) The representative sequences of TMEM130, GPNMB and PMEL contain a predicted secretory signal peptide, rich in nonpolar residues. (B) GPNMB and PMEL paralogs show a striking conservation throughout their N-termini, especially in the PMEL Core Amyloid Fragment [126], where the “essential residues” are labeled with asterisks (*). J = leucine or isoleucine.
Molecules 26 03529 g007
Figure 8. Multiple domains and functional motifs of the C-terminal to the Core Amyloid Fragment are conserved in the PKAT family. Sequence logos showing the relative abundance of each residue found at a given position were derived from alignments of paralogous sequences from the 27 clade-representative species (see Table S4, Supplementary Materials). The PMEL residue positions are shown for human PMEL ENST00000548493.5. The residues are color-coded for the polarity of their amino acid side chains (yellow, nonpolar; green, uncharged polar; red, acidic; blue, basic). Below the alignments, consensus sequences are shown for each separate orthologous gene group. Carets (^) denote residues that match each consensus, thus identifying the key residues conserved in the PKAT gene family (TMEM130, GPNMB and PMEL). (A) In the region C-terminal to the Core Amyloid Fragment of PMEL, many amino acid residues, marked with asterisks (*), are well-conserved relative to the sequence logo for the PKD domain (PROSITE PDOC50093). (B) In the C-terminal region to the RPT domain of PMEL, termed the Kringle-like domain, six cysteines are perfectly conserved for all the GPNMB and PMEL sequences and mostly conserved for the TMEM130 sequences. (C) In the C-terminal region to the Kringle-like domains, all of the PKAT gene family paralogs contain a single-pass transmembrane domain, rich in nonpolar residues. (D) At their C-termini, the PKAT gene family paralogs show the conservation of an endocytic signal matching the motif [DE]XXXL[LI].
Molecules 26 03529 g008
Figure 9. The PMEL repeat domain varies in size and amino acid composition, but T/S ladders and D/E ladders are a frequent feature. Alignments of individual PMEL repeat units of clade-representative organisms displayed in a cladogram. Sequence logos above the raw sequence represent the degree of sequence identity within a species. Conserved T/S ladders * and conserved D/E ladders ^. Residues are color-coded for the polarity of their amino acid side chains (yellow, nonpolar; green, uncharged polar; red, acidic; blue, basic).
Molecules 26 03529 g009
Figure 10. Conservation and divergence of PMEL RPT domains in fish. Amino acid (A) and cDNA (B) sequences of three teleost fish Pmela repeat domains were aligned to accentuate the insertions or deletions that differentiate the repeat unit structures of these separate species. Common sequence logos are shown above the alignments, with individual species and combined consensus sequences below. An “X” represents less than 50% consensus. (A) Residues are color-coded for the polarity of their amino acid side chains (yellow, nonpolar; green, uncharged polar; red, acidic; blue, basic). (B) The corresponding cDNA is color-coded by similarity (from darkest to lightest: 100%, >80%, >60% and <60%). An “R” represents a purine A/G, and a “Y” represents a pyrimidine C/T.
Molecules 26 03529 g010
Table 1. List of animal pmel variants associated with disease with the domain designation, inheritance pattern and reported phenotype 1.
DomainAnimalHGVS cDNAHGVS ProteinInheritancePhenotypeNotesReference
SPCattleNM_001080215.2:
c.50_52del
NP_001073684.2:
p.(Leu18del)
dominantdilute coatHighland/Galloway (c.64G > A) allele, interacts with MC1R (e) alleleSchmutz 2013
SPCattleNM_001080215.2:
c.64G > A
NP_001073684.2:
p.(Gly22Arg)
dominantdilute coatCharolais (Dc) alleleKühn 2007
NTRMouseNM_021882.4:
c.74_331del
NP_068682.2:
p.(Gly25_Asn110del)
recessivedilute coat and tail, loss of rod-shape in melanosomes (including uveal melanocytes and RPE cells)null alleleHellström 2011
NTRQuailXM_032441057.1:
c.271T > G, 353G > A, 446G > A
XP_032296948.1:
p.(Ser91Ala), (Arg118His), (Trp149Ter)
recessiveyellowish plumage“L” strainIshishita 2018
PKDChicken-“del.280-284PTVT” relative to AY636124.1dominantgrayish plumageSmoky allele, modifies Dominant White mutationKerje 2004
RPTZebrafishNM_001045330.1:
c.1474G > T
NP_001038795.1:
p.(Glu492Ter)
n/ahypopigmented body and RPE, vision defects“fading vision” (fdv) mutantSchonthaler 2005
TMChicken-“ins.723-725WAP”
relative to AY636124.1
dominantwhite plumageDominant white allele, coincident with N399D variant upstream of RPTKerje 2004
TMChicken-“del.731-7135LGTAA” relative to AY636124.1dominantbrown/khaki plumageDun allele, coincident with A35V, G105S, and R740C variants in NTR or Cyt domainsKerje 2004
TMHorseNM_001163889.1:
c.1849C > T
NP_001157361.1:
p.(Arg617Cys)
dominantsilver mane and tail, body dapples, MCOA syndromeMultiple Congenital Ocular AnomaliesAndersson 2013
CytDog“SINE insertion in final intron”(predicted to affect splicing)dominantmerle (diluted) coat pattern, various auditory and ocular defectsvariable oligo(dA) length affects phenotypeClark 2006; Murphy 2018
CytMouseNM_021882.4:
c.1805insA
NP_068682.2:
p.(Trp602Ter)
recessivesilver coatreduction in melanocyte densityMartínez-Esparza 1999
CytZebrafishNM_001045330.1:
c.2426_2436del
NP_001038795.1:
p.(Arg810fs)
recessiveglobal hypopigmentation, ocular defectspmelaua5022 alleleLahola-Chomiak 2018
1 SP = signal peptide, NTR = N-terminal region, PKD = polycystic kidney disease domain, RPT = repeat domain, TM = transmembrane domain, Cyt = cytosomal portion, RPE = retinal pigmented epithelium and MCOA = multiple congenital ocular anomalies.
Table 2. List of published human PMEL mutations with the domain designation, inheritance pattern and reported phenotype 2.
DomainHGVS cDNAHGVS ProteinInheritancePhenotypeNotesReference
NTRNM 001200054.1
c.332A
NP 001186983.1:
p.(Asn111Ser)
putative dominantPDSsingletonLahola-Chomiak 2018
CAFNM 001200054.1
c.523G > A
NP 001186983.1:
p.(Gly175Ser)
dominantPDS / PG13 member familyLahola-Chomiak 2018
RPTNM 001200054.1
c.974G > T
NP 001186983.1:
p.(Gly325Val)
putative dominantPDS / PGsingletonLahola-Chomiak 2018
RPTNM 001200054.1
c.994G > A
NP 001186983.1:
p.(Val332Ile)
putative dominantPDSsingletonLahola-Chomiak 2018
RPTNM 001200054.1
c.1019C > T
NP 001186983.1:
p.(Ala340Val)
putative dominantPDS / PG2 member familyLahola-Chomiak 2018
RPTNM 001200054.1
c.1110G > C
NP 001186983.1:
p.(Glu370Asp)
putative dominantPDS / PGsingleton x3Lahola-Chomiak 2018
RPTNM 001200054.1
c.1112G > C
NP 001186983.1:
p.(Ser371Thr)
putative dominantPDSsingletonLahola-Chomiak 2018
RPTNM 001200054.1
c.1166T > C
NP 001186983.1:
p.(Leu389Pro)
putative dominantPDSsingleton x3Lahola-Chomiak 2018
CytNM 001200054.1
c.1921_1926del
NP 001186983.1:
p.(Ser641_Ser642del)
putative dominantPDS / PGsingletonLahola-Chomiak 2018
2 NTR = N-terminal region, CAF = core amyloid fragment, RPT = repeat domain, Cyt = cytosomal portion, PDS = pigment dispersion syndrome and PG = pigmentary glaucoma.
Table 3. List of the human GPNMB variants associated with disease with the domain designation, inheritance pattern and reported phenotype 3.
DomainHGVS cDNAHGVS ProteinInheritancePhenotypeNotesReference
NTR/CAFNM_001005340.2:
c.296del,
c.565C > T
NP_001005340.1:
p.(Asn99ThrfsTer2)
p.(Arg189Ter)
homozygous;
putative recessive
ACDHan ChineseYang 2018
CAFNM_001005340.2:
c.522C > G
NP_001005340.1:
p.(Ile174Met)
homozygous;
recessive
ACDconsanguineous;
Pakistani
Rahman 2021
CAFNM_001005340.2:
c.565C > T
NP_001005340.1:
p.(Arg189Ter)
homozygous;
putative recessive
ACDHan ChineseYang 2018
CAFNM_001005340.2:
c.565C > T
NP_001005340.1:
p.(Arg189Ter)
homozygous;
recessive
ACDChineseSha 2021
CAF/CAFNM_001005340.2:
c.565C > T,
c.660T > G
NP_001005340.1:
p.(Arg189Ter)
p.(Tyr220Ter)
compound heterozygous;
recessive
ACD, skin blistersHan ChineseYang 2018
CAF/btw PKD + KLDNM_001005340.2:
c.565C > T,
c.1092del
NP_001005340.1:
p.(Arg189Ter)
p.(Pro365LeufsTer20)
compound heterozygous;
semi-dominant
ACDTaiwanese; Han ChineseOnoufriadis 2019; Yang 2018
CAF/KLDNM_001005340.2:
c565C > T,
c.1273T > C
NP_001005340.1:
p.(Arg189Ter)
p.(Cys425Arg)
compound heterozygous;
recessive
ACDThaiChiu 2021
CAFNM_001005340.2:
c.700 + 5G > T
NP_001005340.1:
p.(Asp234GlyfsTer7)
homo- / heterozygous;
semi-dominant
ACDconsanguineous; Kuwaiti BedouinOnoufriadis 2019
CAF/PKDNM_001005340.2:
c.719_720del,
c.877_880del
NP_001005340.1:
p.(Val240AspfsTer24)
p.(Val293ProfsTer6)
compound heterozygous;
putative recessive
ACDHan ChineseYang 2018
btw PKD + KLDNM_001005340.2:
c.1124G > T
NP_001005340.1:
p.(Gly375Val)
homozygous;
recessive
ACDconsanguineous;
Pakistani
Rahman 2021
KLDNM_001005340.2
c.1274G > C
NP_001005340.1:
p.(Cys425Ser)
homo- / heterozygous;
semi-dominant
ACDFilipinoOnoufriadis 2019
3 NTR = N-terminal region, CAF = core amyloid fragment, PKD = polycystic kidney disease domain, KLD = Kringle-like domain, Cyt = cytosomal portion and ACD = amyloidosis cutis dyschromica.
Table 4. List of published animal Gpnmb mutations with the domain designation, inheritance pattern and reported phenotype 4.
DomainAnimalHGVS cDNAHGVS ProteinInheritancePhenotypeNotesReference
NTRMouseNM_053110.4:
c.653C > T
NP_444340.3: p.(Arg150Ter)recessivePDS, PGDBA/2J (D2)Anderson 2002
btw CAF + PKDZebrafishENSDART00000090883.6:
c.799C > T
ENSDARP00000085316.5
P.(Gln267Ter)
N/Anone reportedZFIN ID: ZDB-ALT-130411-2760Dooley 2019
PKDZebrafishENSDART00000090883.6:
c.854G > A
ENSDARP00000085316.5
p.(Trp285Ter)
N/Anone reportedZFIN ID: ZDB-ALT-130411-2835Dooley 2019
4 NTR = N-terminal region, CAF = core amyloid fragment, PKD = polycystic kidney disease, PDS = pigment dispersion syndrome and PG = pigmentary glaucoma.
Publisher’s Note: MDPI stays neutral with regard to jurisdictional claims in published maps and institutional affiliations.

