
Malaysian Propolis and Metformin Synergistically Mitigate Kidney Oxidative Stress and Inflammation in Streptozotocin-Induced Diabetic Rats

 ,
, 
 ,
, 


Abstract
: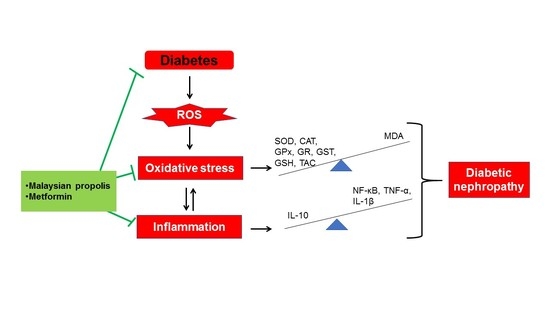
1. Introduction
2. Results
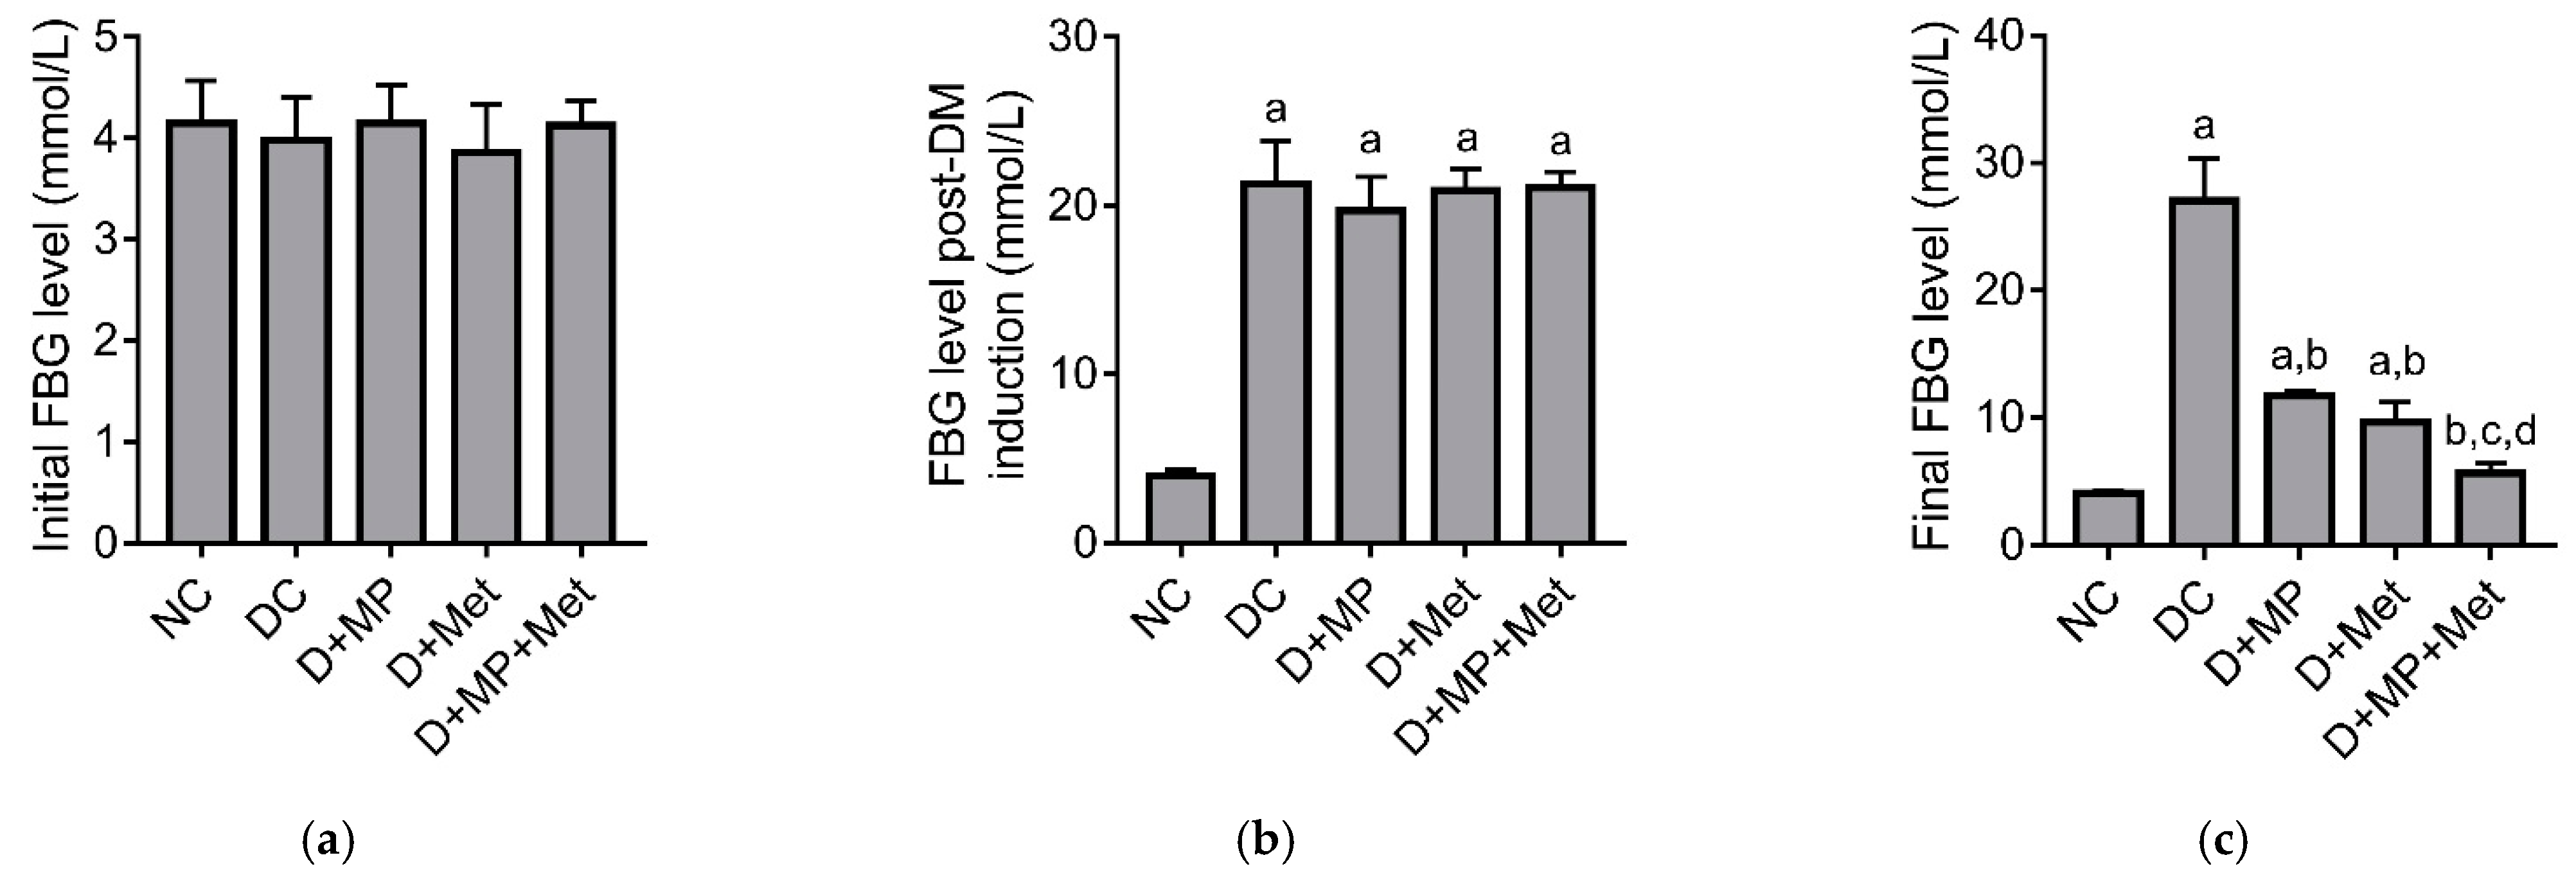
2.1. Blood Glucose Level
2.2. Serum Markers of Renal Function and Renal Lactate Dehydrogenase (LDH) Activity
2.3. Serum Electrolytes
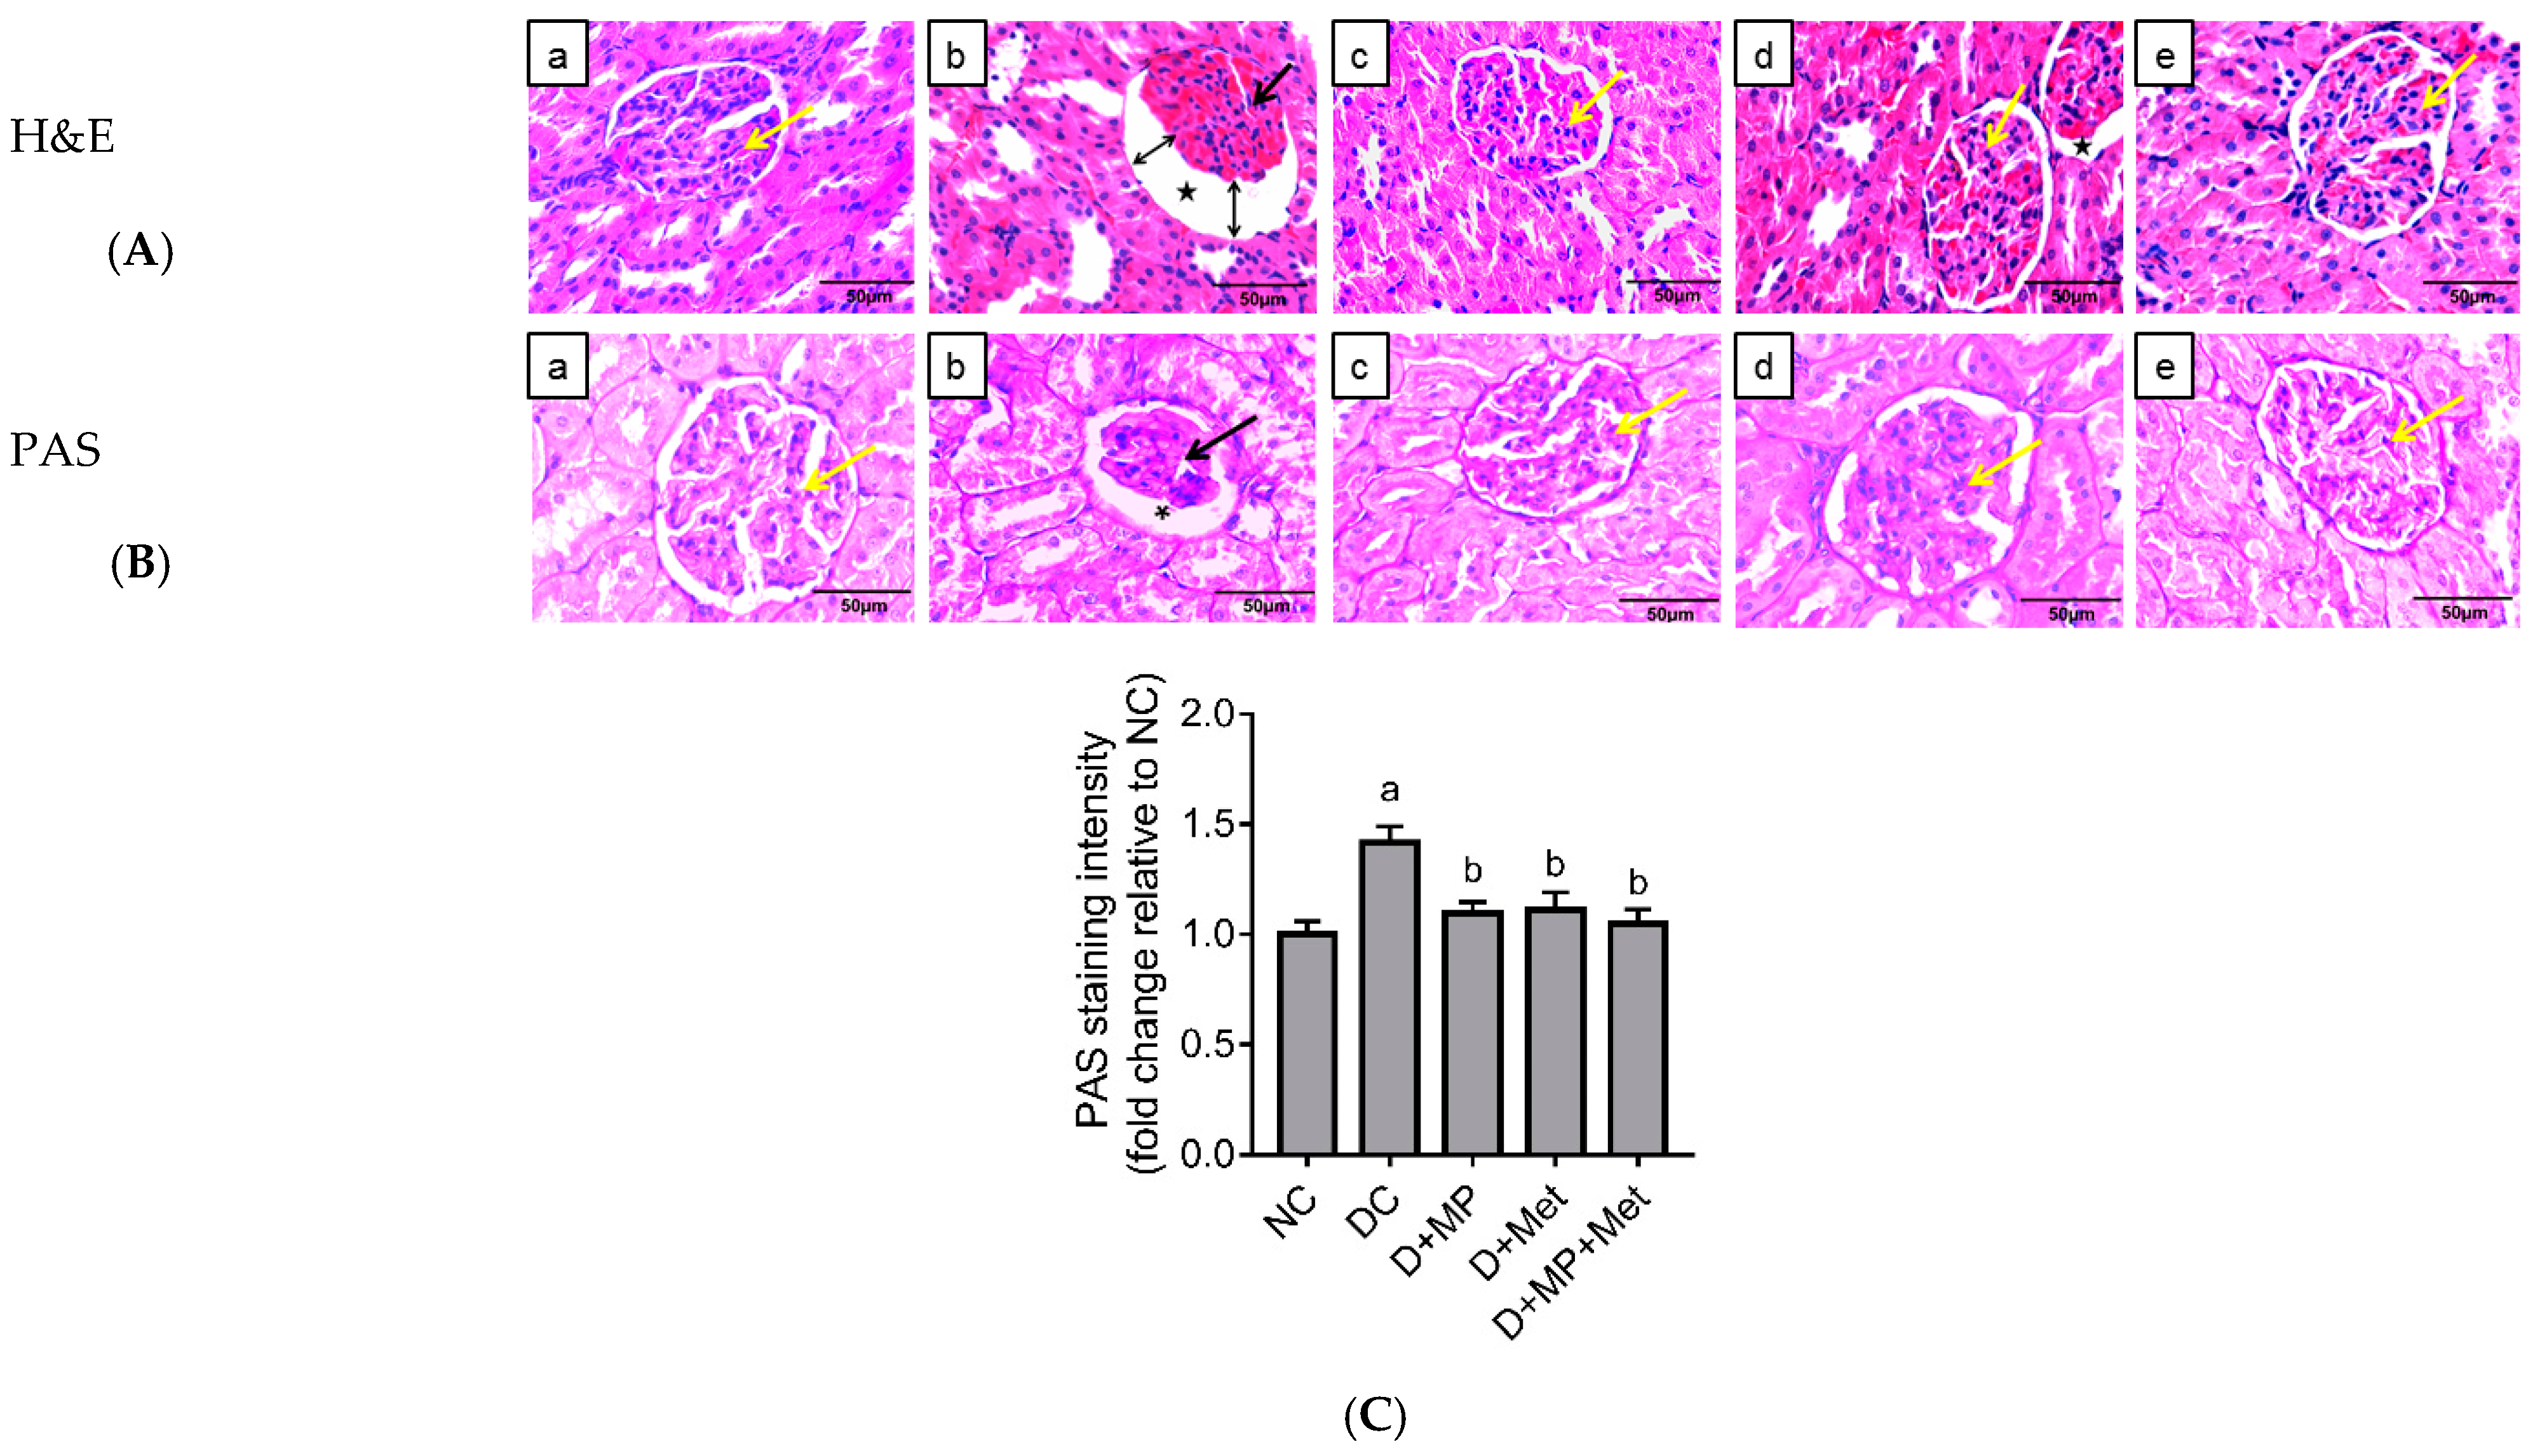
2.4. Kidney Histopathology
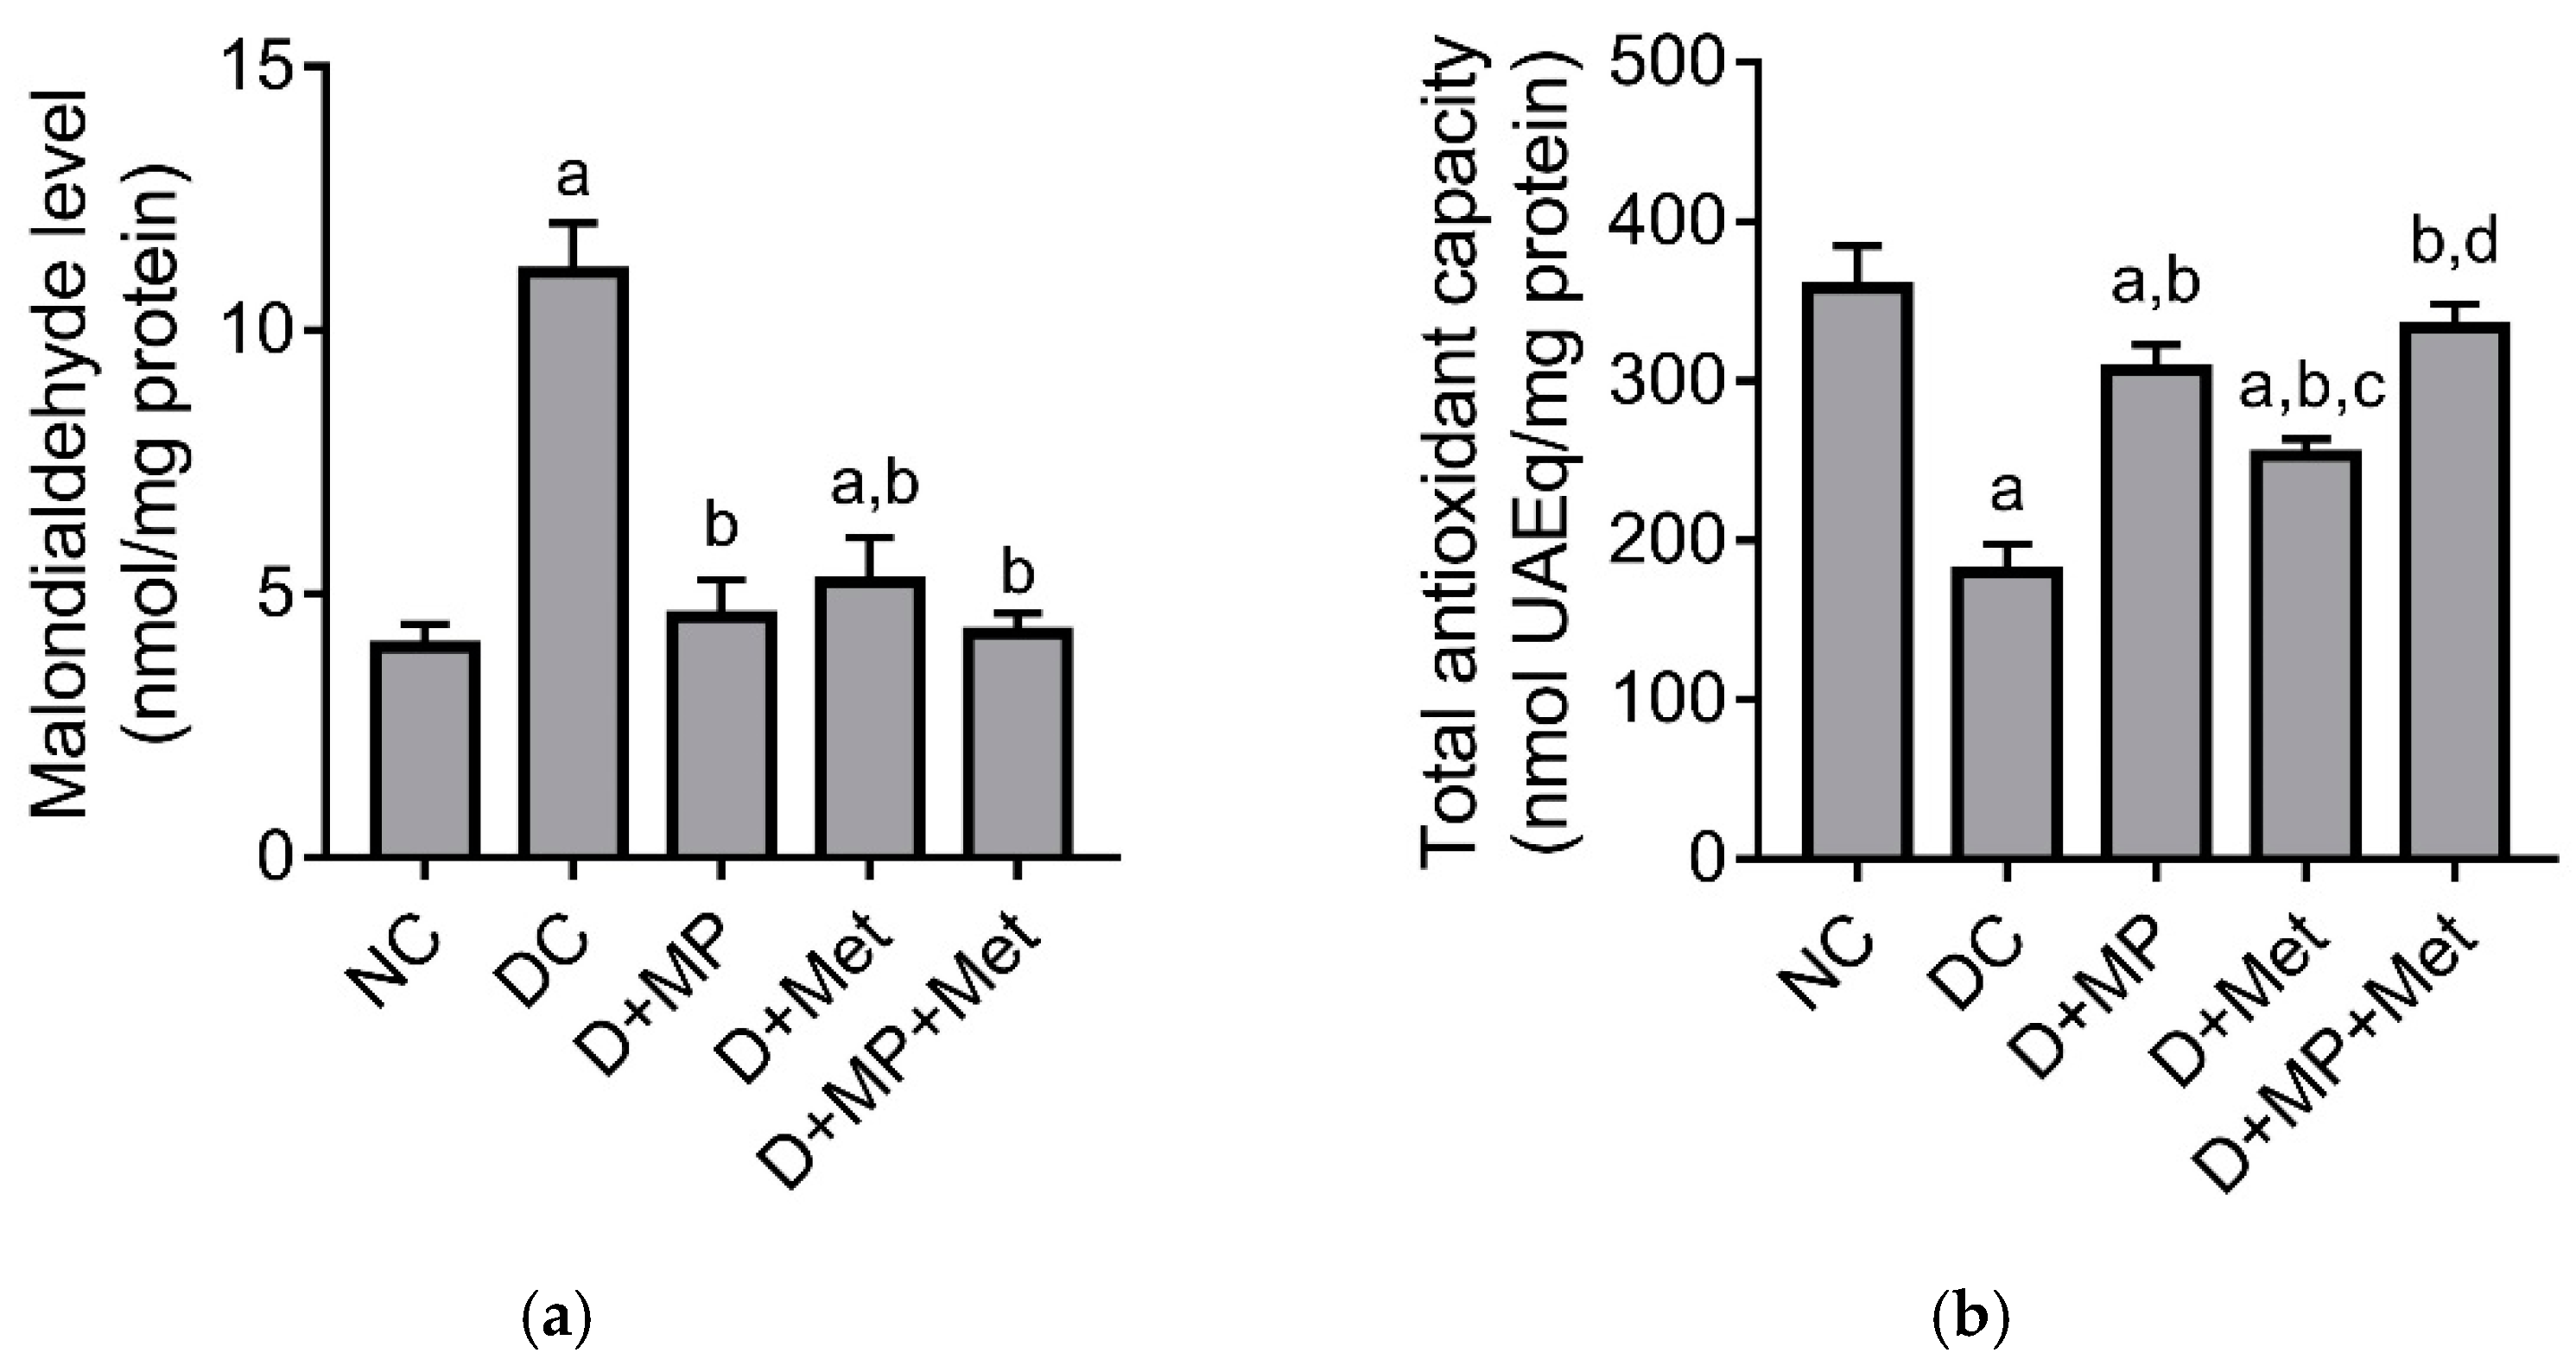
2.5. Renal Antioxidant/Oxidant Status
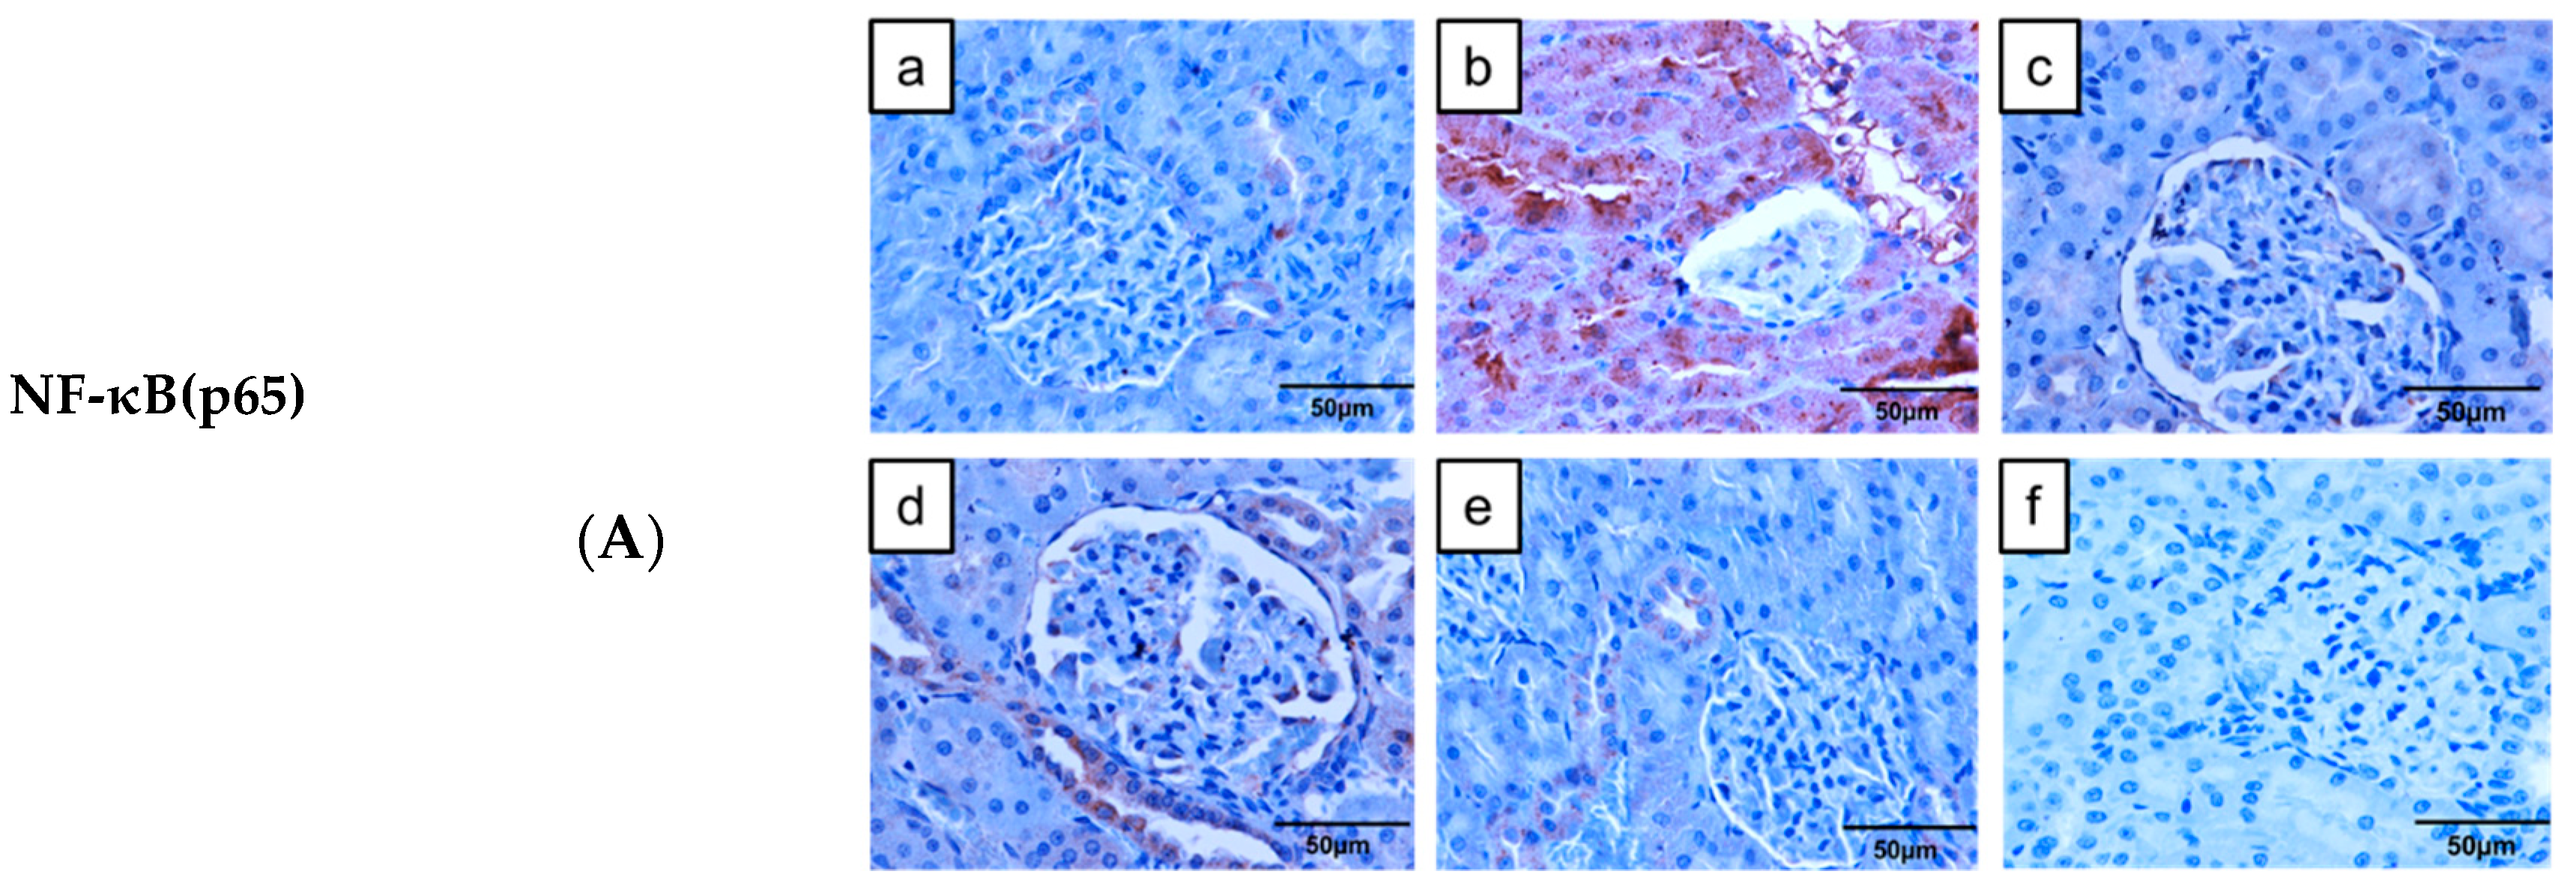
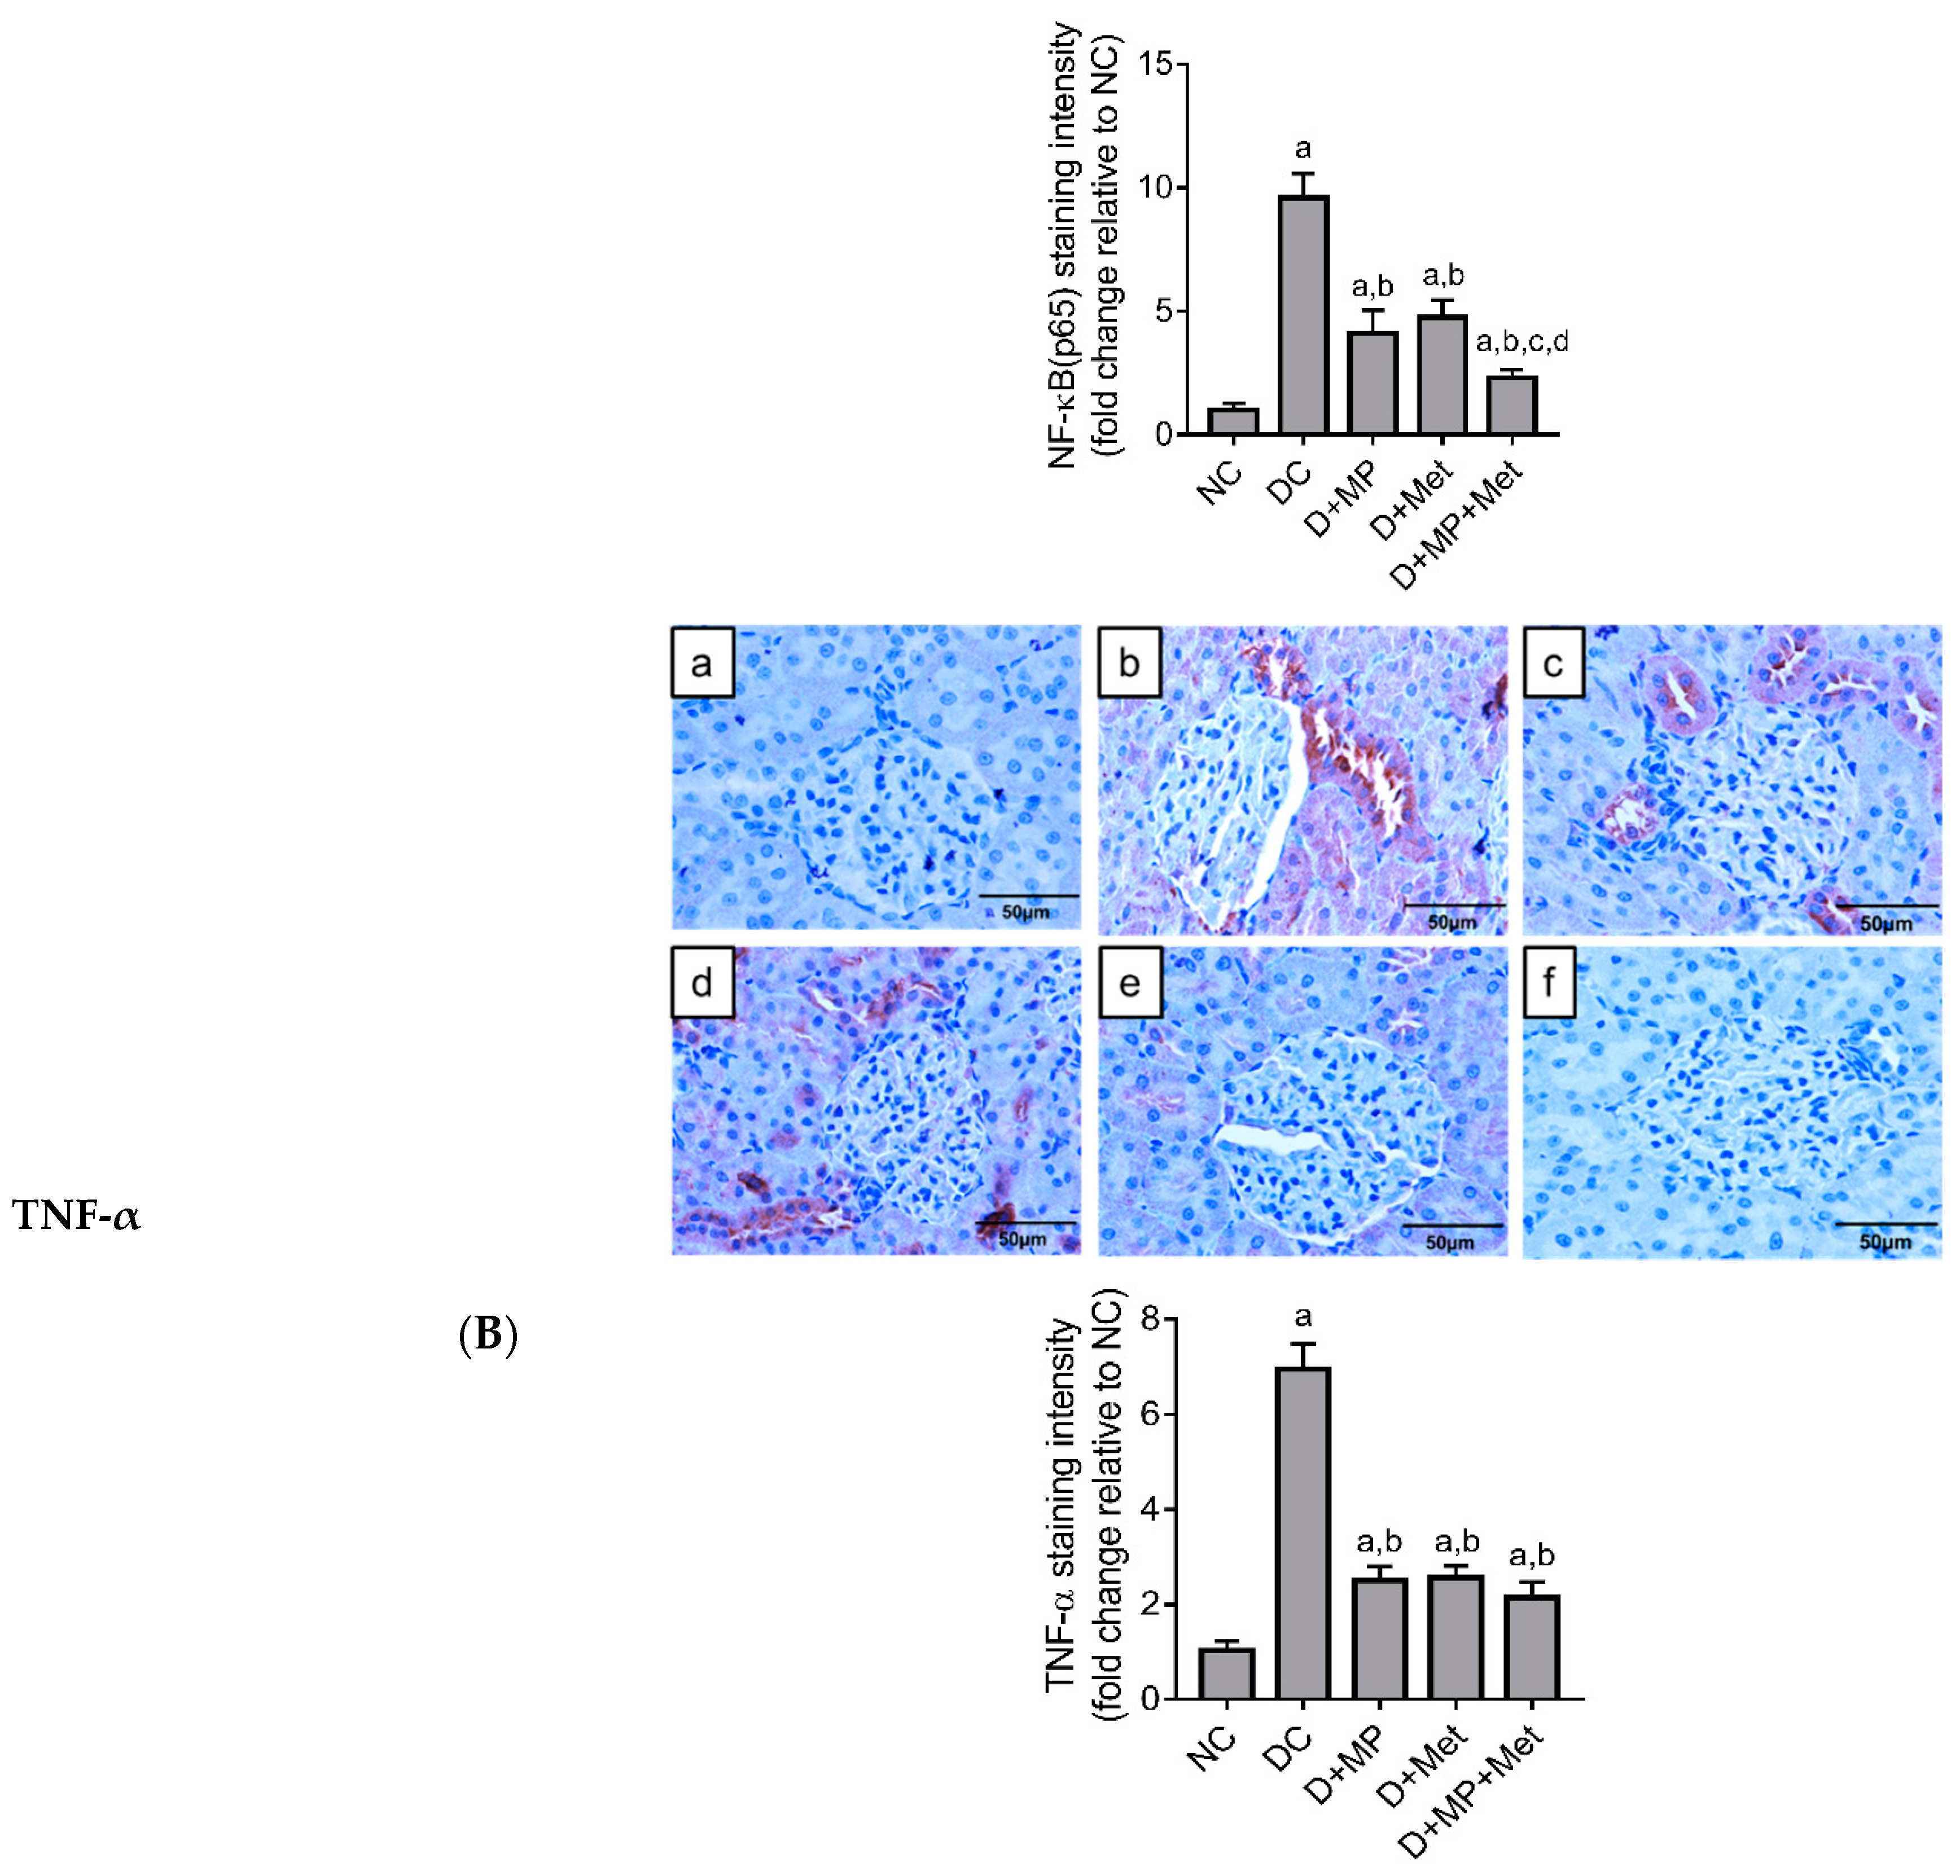
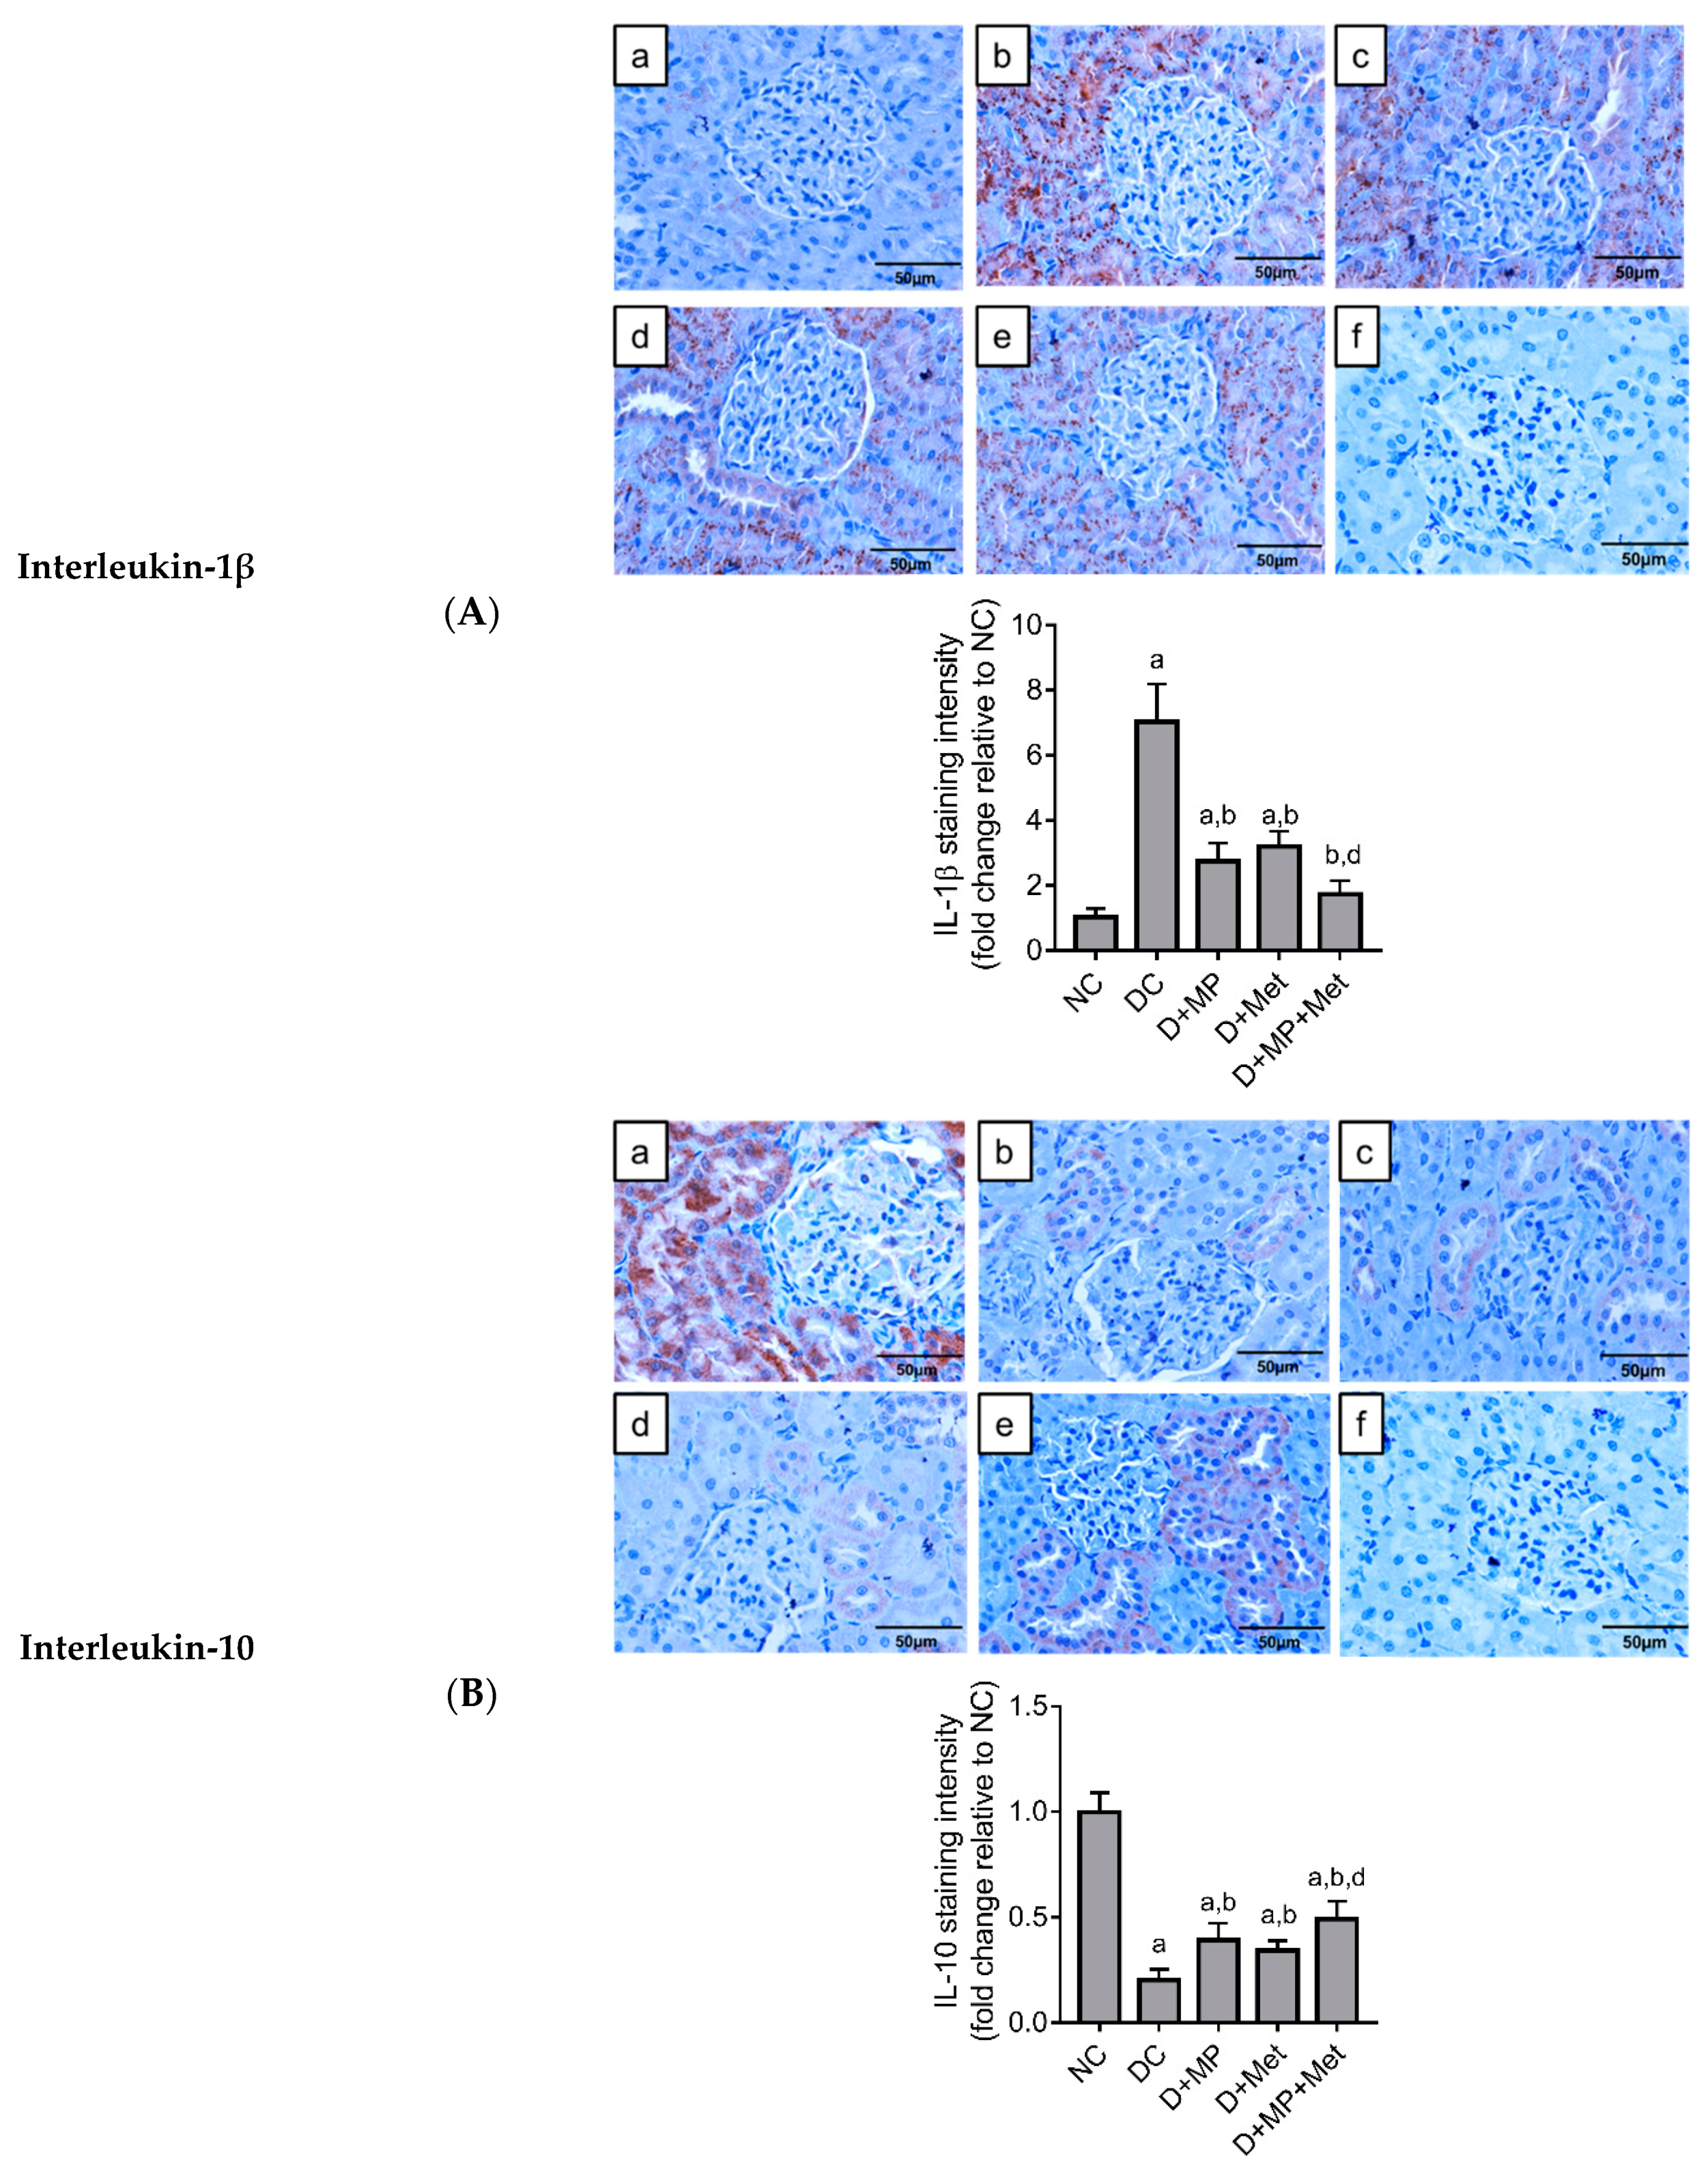
2.6. Immunoexpression of Inflammatory Markers in the Kidney
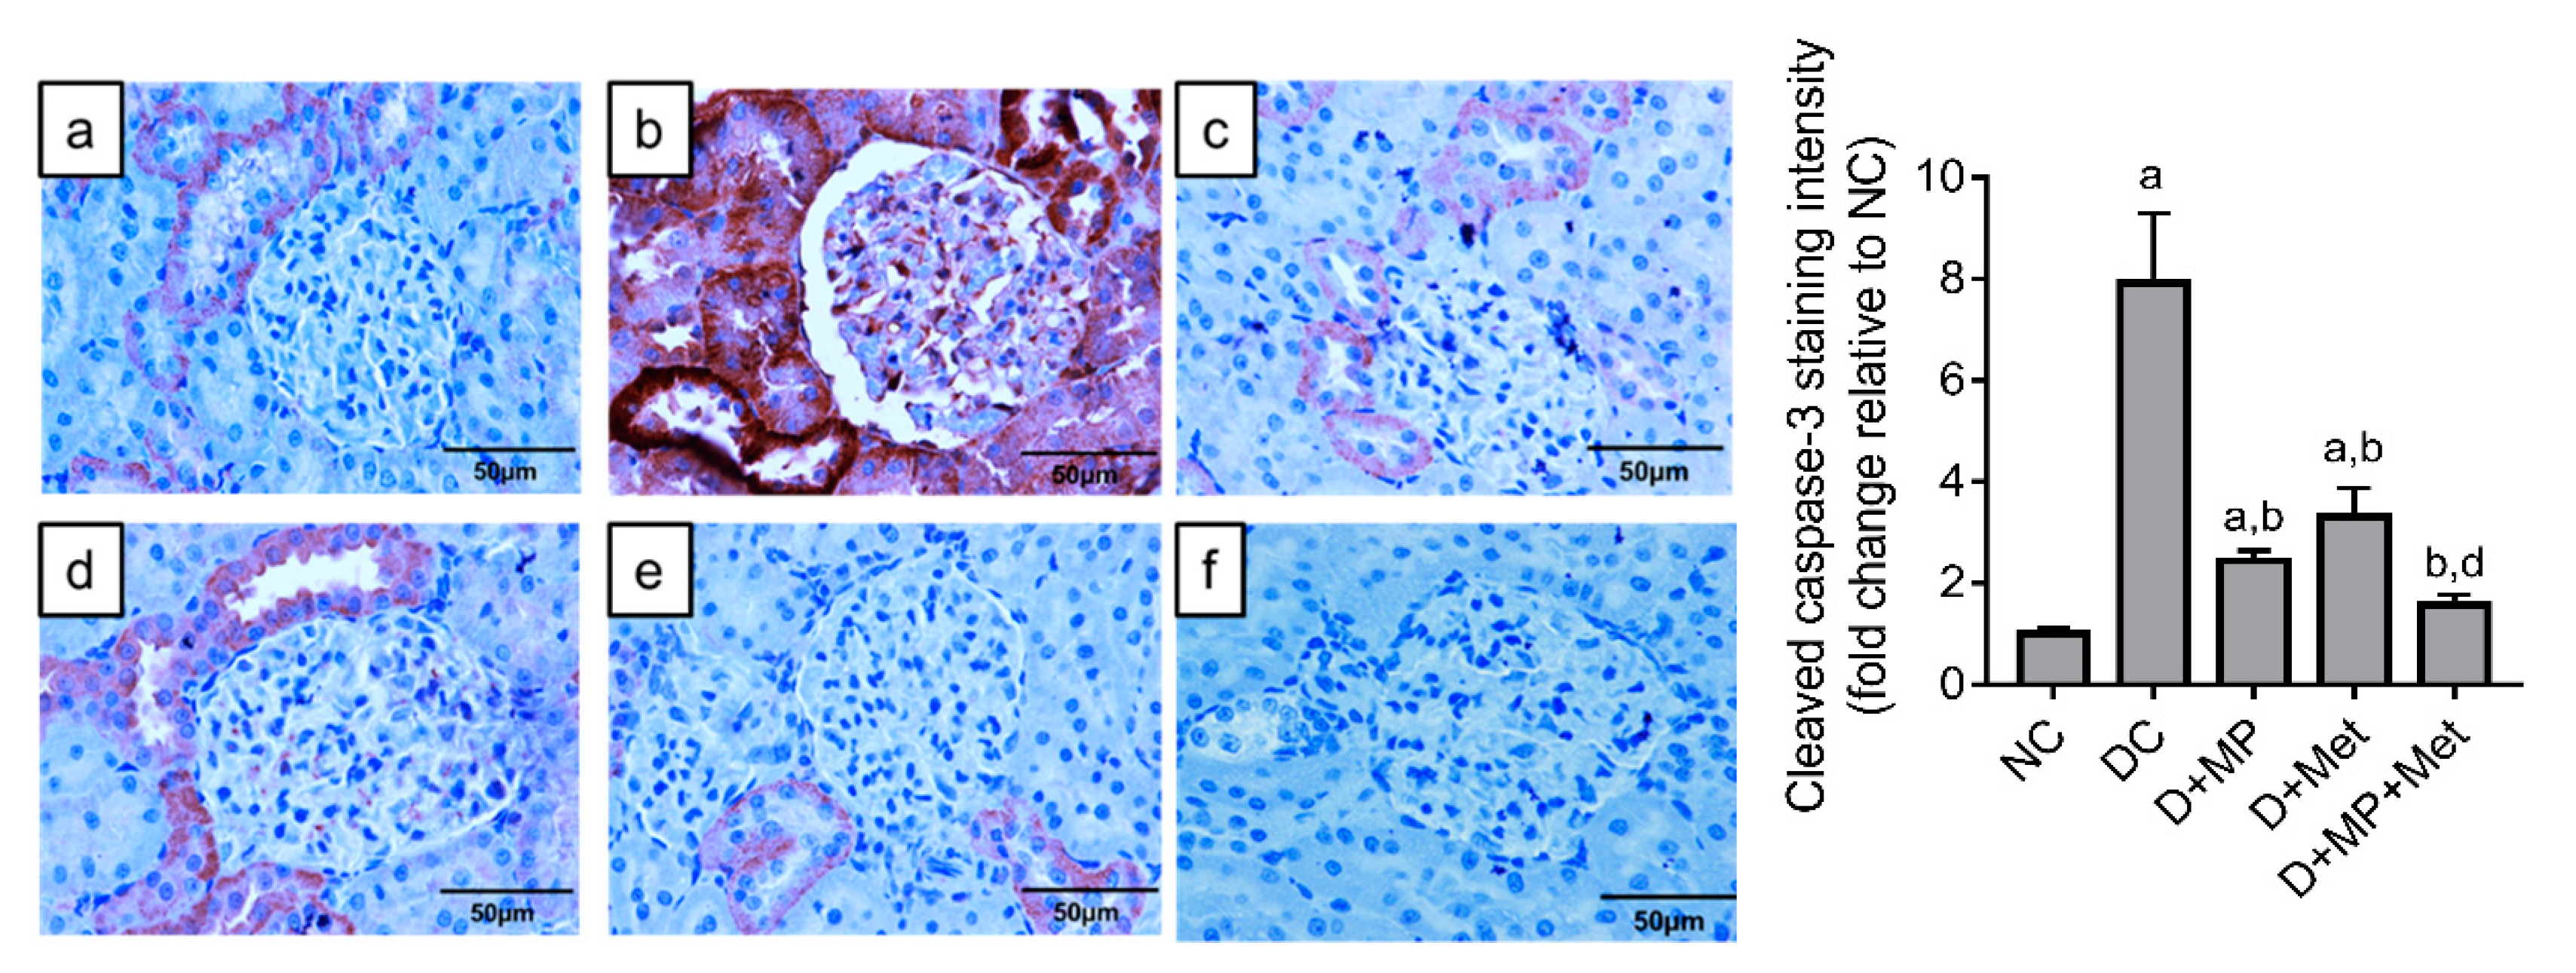
2.7. Immunoexpression of Cleaved Caspase-3 in the Kidney
3. Discussion
4. Materials and Methods
4.1. Chemicals
4.2. Preparation of Propolis Ethanol Extract
4.3. Experimental Animals
4.4. Study Design
4.5. Induction of Diabetes Mellitus
4.6. Measurement of Serum Biochemical Markers of Renal Function
4.7. Histopathological Assessment
4.8. Assessment of Renal Tissue Oxidative Stress Status
4.8.1. Preparation of Kidney Tissue Homogenate
4.8.2. Determination of Antioxidant Enzymes Activities and Total Glutathione Level
4.8.3. Determination of Malondialdehyde Level and Total Antioxidant Capacity
4.9. Immunohistochemical Detection of Inflammatory Markers and Cleaved Caspase-3
4.10. Statistical Analysis
5. Conclusions
Author Contributions
Funding
Institutional Review Board Statement
Informed Consent Statement
Data Availability Statement
Acknowledgments
Conflicts of Interest
Sample Availability
References
- Matoba, K.; Takeda, Y.; Nagai, Y.; Yokota, T.; Utsunomiya, K.; Nishimura, R. Targeting redox imbalance as an approach for diabetic kidney disease. Biomedicines 2020, 8, 40. [Google Scholar] [CrossRef] [PubMed] [Green Version]
- Zhang, C.; Li, Q.; Lai, S.; Yang, L.; Shi, G.; Wang, Q.; Luo, Z.; Zhao, R.; Yu, Y. Attenuation of diabetic nephropathy by Sanziguben Granule inhibiting EMT through Nrf2-mediated anti-oxidative effects in streptozotocin (STZ)-induced diabetic rats. J. Ethnopharmacol. 2017, 205, 207–216. [Google Scholar] [CrossRef] [PubMed]
- Giribabu, N.; Karim, K.; Kilari, E.K.; Salleh, N. Phyllanthus niruri leaves aqueous extract improves kidney functions, ameliorates kidney oxidative stress, inflammation, fibrosis and apoptosis and enhances kidney cell proliferation in adult male rats with diabetes mellitus. J. Ethnopharmacol. 2017, 205, 123–137. [Google Scholar] [CrossRef]
- Al-Hussaini, H.; Kilarkaje, N. Trans-resveratrol mitigates type 1 diabetes-induced oxidative DNA damage and accumulation of advanced glycation end products in glomeruli and tubules of rat kidneys. Toxicol. Appl. Pharmacol. 2018, 339, 97–109. [Google Scholar] [CrossRef]
- Nna, V.U.; Abu Bakar, A.B.; Md Lazin, M.; Mohamed, M. Antioxidant, anti-inflammatory and synergistic anti-hyperglycemic effects of Malaysian propolis and metformin in streptozotocin-induced diabetic rats. Food Chem. Toxicol. 2018, 120, 305–320. [Google Scholar] [CrossRef] [PubMed]
- Ibrahim, N.; Niza, N.; Rodi, M.M.M.; Zakaria, A.J.; Ismail, Z.; Mohd, K.S. Chemical and biological analyses of Malaysian stingless bee propolis extracts. Malay. J. Analyt. Sci. 2016, 20, 413–422. [Google Scholar] [CrossRef]
- Gao, W.; Pu, L.; Wei, J.; Yao, Z.; Wang, Y.; Shi, T.; Zhao, L.; Jiao, C.; Guo, C. Serum antioxidant parameters are significantly increased in patients with type 2 diabetes mellitus after consumption of Chinese propolis: A randomized controlled trial based on fasting serum glucose level. Diabetes Ther. 2018, 9, 101–111. [Google Scholar] [CrossRef] [Green Version]
- Sforcin, J.M. Biological properties and therapeutic applications of propolis. Phytother. Res. 2016, 30, 894–905. [Google Scholar] [CrossRef]
- El Rabey, H.A.; Al-Seeni, M.N.; Bakhashwain, A.S. The antidiabetic activity of Nigella sativa and propolis on streptozotocin-induced diabetes and diabetic nephropathy in male rats. Evid. Based Complemen. Alt. Med. 2017, 2017, 5439645. [Google Scholar]
- Nna, V.U.; Bakar, A.B.A.; Mohamed, M. Malaysian propolis, metformin and their combination, exert hepatoprotective effect in streptozotocin-induced diabetic rats. Life Sci. 2018, 211, 40–50. [Google Scholar] [CrossRef]
- Alm-Eldeen, A.A.; Basyony, M.A.; Elfiky, N.K.; Ghalwash, M.M. Effect of the Egyptian propolis on the hepatic antioxidant defense and pro-apoptotic p53 and anti-apoptotic bcl2 expressions in aflatoxin B1 treated male mice. Biomed. Pharmacother. 2017, 87, 247–255. [Google Scholar] [CrossRef] [PubMed]
- Nna, V.U.; Abu Bakar, A.B.; Ahmad, A.; Eleazu, C.O.; Mohamed, M. Oxidative Stress, NF-κB-Mediated Inflammation and Apoptosis in the Testes of Streptozotocin–Induced Diabetic Rats: Combined Protective Effects of Malaysian Propolis and Metformin. Antioxidants 2019, 8, 465. [Google Scholar] [CrossRef] [Green Version]
- Nna, V.U.; Bakar, A.B.A.; Ahmad, A.; Umar, U.Z.; Suleiman, J.B.; Zakaria, Z.; Othman, Z.A.; Mohamed, M. Malaysian propolis and metformin mitigate subfertility in streptozotocin-induced diabetic male rats by targeting steroidogenesis, testicular lactate transport, spermatogenesis and mating behaviour. Andrology 2020, 8, 731–746. [Google Scholar] [CrossRef]
- Çilenk, K.T.; Öztürk, İ.; Sönmez, M.F. Ameliorative effect of propolis on the cadmium-induced reproductive toxicity in male albino rats. Exp. Mol. Pathol. 2016, 101, 207–213. [Google Scholar] [CrossRef] [PubMed]
- Rizk, S.M.; Zaki, H.F.; Mina, M.A. Propolis attenuates doxorubicin-induced testicular toxicity in rats. Food Chem. Toxicol. 2014, 67, 176–186. [Google Scholar] [CrossRef]
- Khanra, R.; Bhattacharjee, N.; Dua, T.K.; Nandy, A.; Saha, A.; Kalita, J.; Manna, P.; Dewanjee, S. Taraxerol, a pentacyclic triterpenoid, from Abroma augusta leaf attenuates diabetic nephropathy in type 2 diabetic rats. Biomed. Pharmacother. 2017, 94, 726–741. [Google Scholar] [CrossRef]
- Nna, V.U.; Ujah, G.A.; Mohamed, M.; Etim, K.B.; Igba, B.O.; Augustine, E.R.; Osim, E.E. Cadmium chloride–induced testicular toxicity in male wistar rats; prophylactic effect of quercetin, and assessment of testicular recovery following cadmium chloride withdrawal. Biomed. Pharmacother. 2017, 94, 109–123. [Google Scholar] [CrossRef] [PubMed]
- Zhu, W.; Chen, M.; Shou, Q.; Li, Y.; Hu, F. Biological activities of Chinese propolis and Brazilian propolis on streptozotocin-induced type 1 diabetes mellitus in rats. Evid. Based Complement. Alt. Med. 2011, 468529. [Google Scholar] [CrossRef] [PubMed] [Green Version]
- Giacco, F.; Brownlee, M. Oxidative stress and diabetic complications. Cir. Res. 2010, 107, 1058–1070. [Google Scholar] [CrossRef] [Green Version]
- Nakamura, B.N.; Lawson, G.; Chan, J.Y.; Banuelos, J.; Cortes, M.M.; Hoang, Y.D.; Ortiz, L.; Rau, B.A.; Luderer, U. Knockout of the transcription factor NRF2 disrupts spermatogenesis in an age-dependent manner. Free Rad. Biol. Med. 2010, 49, 1368–1379. [Google Scholar] [CrossRef] [PubMed] [Green Version]
- Ujah, G.A.; Nna, V.U.; Suleiman, J.B.; Eleazu, C.; Nwokocha, C.; Rebene, J.A.; Imowo, M.U.; Obi, E.O.; Amachree, C.; Udechukwu, E.C.; et al. Tert-butylhydroquinone attenuates doxorubicin-induced dysregulation of testicular cytoprotective and steroidogenic genes, and improves spermatogenesis in rats. Sci. Rep. 2021, 11, 5522. [Google Scholar] [CrossRef]
- Lee, N.Y.; Khoo, W.K.; Adnan, M.A.; Mahalingam, T.P.; Fernandez, A.R.; Jeevaratnam, K. The pharmacological potential of Phyllanthus niruri. J. Pharm. Pharmacol. 2016, 68, 953–969. [Google Scholar] [CrossRef] [Green Version]
- Borghi, S.M.; Mizokami, S.S.; Pinho-Ribeiro, F.A.; Fattori, V.; Crespigio, J.; Clemente-Napimoga, J.T.; Napimoga, M.H.; Pitol, D.L.; Issa, J.P.M.; Fukada, S.Y.; et al. The flavonoid quercetin inhibits titanium dioxide (TiO2)-induced chronic arthritis in mice. J. Nutr. Biochem. 2018, 53, 81–95. [Google Scholar] [CrossRef]
- Feng, R.B.; Wang, Y.; He, C.; Yang, Y.; Wan, J.B. Gallic acid, a natural polyphenol, protects against tert-butyl hydroperoxide-induced hepatotoxicity by activating ERK-Nrf2-Keap1-mediated antioxidative response. Food Chem. Toxicol. 2018, 119, 479–488. [Google Scholar] [CrossRef]
- Javkhedkar, A.A.; Quiroz, Y.; Rodriguez-Iturbe, B.; Vaziri, N.D.; Lokhandwala, M.F.; Banday, A.A. Resveratrol restored Nrf2 function, reduced renal inflammation, and mitigated hypertension in spontaneously hypertensive rats. Am. J. Physiol. Regulatory Int. Comp. Physiol. 2015, 308, R840–R846. [Google Scholar] [CrossRef] [PubMed] [Green Version]
- Roslan, J.; Giribabu, N.; Karim, K.; Salleh, N. Quercetin ameliorates oxidative stress, inflammation and apoptosis in the heart of streptozotocin-nicotinamide-induced adult male diabetic rats. Biomed. Pharmacother. 2017, 86, 570–582. [Google Scholar] [CrossRef]
- Usman, U.Z.; Bakar, A.B.A.; Mohamed, M. Phytochemical screening and comparison of antioxidant activity of water and ethanol extract propolis from Malaysia. Int. J. Pharm. Pharmaceut. Sci. 2016, 8, 413–415. [Google Scholar]
- Hubl, W.; Zogbaum, M.; Boyd, J.C.; Savory, J.; Schubert, M.; Meyer, D.; Demant, T. Evaluation of analytical methods and workflow performance of the Architect ci8200 integrated serum/plasma analyzer system. Clin. Chim. Acta 2005, 357, 43–54. [Google Scholar] [CrossRef] [PubMed]
- Al Batran, R.; Al-Bayaty, F.; Al-Obaidi, M.M.J.; Abdualkader, A.M.; Hadi, H.A.; Ali, H.M.; Abdulla, M.A. In vivo antioxidant and antiulcer activity of Parkia speciosa ethanolic leaf extract against ethanol-induced gastric ulcer in rats. PLoS ONE 2013, 8, e64751. [Google Scholar] [CrossRef] [PubMed]
- Chandran, G.; Sirajudeen, K.; Yusoff, N.; Syamimi, N.; Swamy, M.; Samarendra, M.S. Effect of the antihypertensive drug enalapril on oxidative stress markers and antioxidant enzymes in kidney of spontaneously hypertensive rat. Oxid. Med. Cell. Long. 2014. [Google Scholar] [CrossRef]
- Winiarska, K.; Focht, D.; Sierakowski, B.; Lewandowski, K.; Orlowska, M.; Usarek, M. NADPH oxidase inhibitor, apocynin, improves renal glutathione status in Zucker diabetic fatty rats: A comparison with melatonin. Chem.-Biol. Interact. 2014, 218, 12–19. [Google Scholar] [CrossRef] [PubMed]
- Luchese, C.; Pinton, S.; Nogueira, C.W. Brain and lungs of rats are differently affected by cigarette smoke exposure: Antioxidant effect of an organoselenium compound. Pharmacol. Res. 2009, 59, 194–201. [Google Scholar] [CrossRef] [PubMed]
- Habig, W.H.; Pabst, M.J.; Jakoby, W.B. Glutathione S-transferases the first enzymatic step in mercapturic acid formation. J. Biol. Chem. 1974, 249, 7130–7139. [Google Scholar] [CrossRef]
- Annuk, M.; Zilmer, M.; Lind, L.; Linde, T.; Fellström, B. Oxidative stress and endothelial function in chronic renal failure. J. Am. Soc. Nephrol. 2001, 12, 2747–2752. [Google Scholar] [CrossRef] [PubMed]
- Ohkawa, H.; Ohishi, N.; Yagi, K. Assay for lipid peroxides in animal tissues by thiobarbituric acid reaction. Analyt. Biochem. 1979, 95, 351–358. [Google Scholar] [CrossRef]
- Koracevic, D.; Koracevic, G.; Djordjevic, V.; Andrejevic, S.; Cosic, V. Method for the measurement of antioxidant activity in human fluids. J. Clin. Pathol. 2001, 54, 356–361. [Google Scholar] [CrossRef] [PubMed] [Green Version]


| Parameters | NC | DC | D + MP | D + Met | D + MP + Met |
|---|---|---|---|---|---|
| Creatinine (µmol/L) | 45.75 ± 1.46 | 54.10 ± 1.73 a | 50.77 ± 1.05 a | 50.00 ± 4.81 a | 48.55 ± 0.68 b |
| Urea (mmol/L) | 7.93 ± 0.93 | 25.35 ± 1.62 a | 6.67 ± 2.16 b | 15.00 ± 4.07 a,b,c | 5.15 ± 0.76 b,d |
| Uric acid (µmol/L) | 82.72 ± 8.79 | 133.50 ± 17.62 a | 83.72 ± 19.64 b | 73.77 ± 13.46 b | 90.68 ± 14.38 b |
| Sodium (mmol/L) | 145.20 ± 1.47 | 134.00 ± 1.27 a | 142.50 ± 3.02 b | 140.80 ± 2.04 a,b | 142.50 ± 0.84 b |
| Chloride (mmol/L) | 100.20 ± 0.75 | 91.83 ± 0.75 a | 99.00 ± 4.86 b | 94.17 ± 2.23 a,d | 99.33 ± 0.82 b,d |
| Potassium (mmol/L) | 5.22 ± 0.19 | 6.97 ± 0.92 a | 5.40 ± 0.26 b | 5.42 ± 0.33 b | 5.08 ± 0.27 b |
| LDH (IU/g tissue) | 426.70 ± 42.22 | 736.50 ± 97.85 a | 445.30 ± 50.68 b | 526.30 ± 38.42 b | 388.40 ± 45.06 b,d |
Publisher’s Note: MDPI stays neutral with regard to jurisdictional claims in published maps and institutional affiliations. |
© 2021 by the authors. Licensee MDPI, Basel, Switzerland. This article is an open access article distributed under the terms and conditions of the Creative Commons Attribution (CC BY) license (https://creativecommons.org/licenses/by/4.0/).
Share and Cite
Nna, V.U.; Abu Bakar, A.B.; Zakaria, Z.; Othman, Z.A.; Jalil, N.A.C.; Mohamed, M. Malaysian Propolis and Metformin Synergistically Mitigate Kidney Oxidative Stress and Inflammation in Streptozotocin-Induced Diabetic Rats. Molecules 2021, 26, 3441. https://doi.org/10.3390/molecules26113441
Nna VU, Abu Bakar AB, Zakaria Z, Othman ZA, Jalil NAC, Mohamed M. Malaysian Propolis and Metformin Synergistically Mitigate Kidney Oxidative Stress and Inflammation in Streptozotocin-Induced Diabetic Rats. Molecules. 2021; 26(11):3441. https://doi.org/10.3390/molecules26113441
Chicago/Turabian StyleNna, Victor Udo, Ainul Bahiyah Abu Bakar, Zaida Zakaria, Zaidatul Akmal Othman, Nur Asyilla Che Jalil, and Mahaneem Mohamed. 2021. "Malaysian Propolis and Metformin Synergistically Mitigate Kidney Oxidative Stress and Inflammation in Streptozotocin-Induced Diabetic Rats" Molecules 26, no. 11: 3441. https://doi.org/10.3390/molecules26113441
APA StyleNna, V. U., Abu Bakar, A. B., Zakaria, Z., Othman, Z. A., Jalil, N. A. C., & Mohamed, M. (2021). Malaysian Propolis and Metformin Synergistically Mitigate Kidney Oxidative Stress and Inflammation in Streptozotocin-Induced Diabetic Rats. Molecules, 26(11), 3441. https://doi.org/10.3390/molecules26113441